Machine Learning
Sanjivani RuralEducation Society’s
Sanjivani College of Engineering, Kopargaon-423603
(An Autonomous Institute Affiliated to Savitribai Phule Pune University, Pune)
NAAC ‘A’ Grade Accredited
Department of Information Technology
NBAAccredited-UG Programme
Ms. K. D. Patil
Assistant Professor
2.
Contents - Classification
•Sigmoid function, Classification Algorithm in Machine Learning,
Decision Trees, Ensemble Techniques: Bagging and boosting, Adaboost
and gradient boost, Random Forest, Naïve Bayes Classifier, Support
Vector Machines. Performance Evaluation: Confusion Matrix, Accuracy,
Precision, Recall, AUC-ROC Curves, F-Measure
Machine Learning Department of Information Technology
3.
Course Outcome
• CO3:To apply different classification algorithms for various machine
learning applications.
Machine Learning Department of Information Technology
4.
Classification Algorithms EvaluationMetrics
Machine Learning Department of Information Technology
• There are many ways for measuring classification algorithm performance
such as Accuracy, confusion matrix, log-loss, and AUC-ROC etc. Precision-
recall is a widely used metrics for classification problems.
• Confusion Matrix: True/False Negative/Positive
• Accuracy, Precision, Recall, Specificity, F1-score
• AUC-ROC evaluation metric
5.
Classification Algorithms EvaluationMetrics
Machine Learning Department of Information Technology
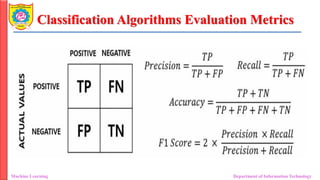
Confusion Matrix:
• It is a matrix used to determine the performance of the classification
models for a given set of test data.
• It can only be determined if the true values for test data are known.
• For the 2 prediction classes of classifiers, the matrix is of 2*2 table, for 3
classes, it is 3*3 table, and so on.
• The matrix is divided into two dimensions, that are predicted
values and actual values along with the total number of predictions.
6.
Classification Algorithms EvaluationMetrics
Machine Learning Department of Information Technology
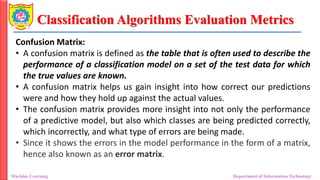
Confusion Matrix:
• A confusion matrix is defined as the table that is often used to describe the
performance of a classification model on a set of the test data for which
the true values are known.
• A confusion matrix helps us gain insight into how correct our predictions
were and how they hold up against the actual values.
• The confusion matrix provides more insight into not only the performance
of a predictive model, but also which classes are being predicted correctly,
which incorrectly, and what type of errors are being made.
• Since it shows the errors in the model performance in the form of a matrix,
hence also known as an error matrix.
7.
Classification Algorithms EvaluationMetrics
Machine Learning Department of Information Technology
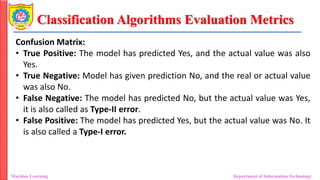
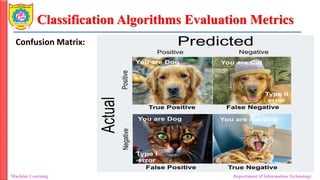
Confusion Matrix:
• True Positive: The model has predicted Yes, and the actual value was also
Yes.
• True Negative: Model has given prediction No, and the real or actual value
was also No.
• False Negative: The model has predicted No, but the actual value was Yes,
it is also called as Type-II error.
• False Positive: The model has predicted Yes, but the actual value was No. It
is also called a Type-I error.
Classification Algorithms EvaluationMetrics
Machine Learning Department of Information Technology
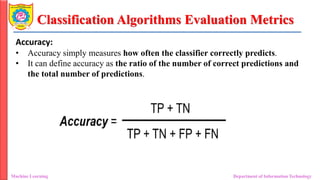
Accuracy:
• Accuracy simply measures how often the classifier correctly predicts.
• It can define accuracy as the ratio of the number of correct predictions and
the total number of predictions.
10.
Classification Algorithms EvaluationMetrics
Machine Learning Department of Information Technology
Precision:
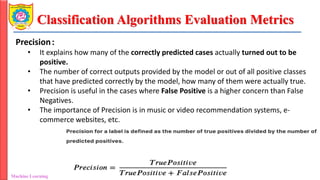
• It explains how many of the correctly predicted cases actually turned out to be
positive.
• The number of correct outputs provided by the model or out of all positive classes
that have predicted correctly by the model, how many of them were actually true.
• Precision is useful in the cases where False Positive is a higher concern than False
Negatives.
• The importance of Precision is in music or video recommendation systems, e-
commerce websites, etc.
11.
Classification Algorithms EvaluationMetrics
Machine Learning Department of Information Technology
Recall (Sensitivity)
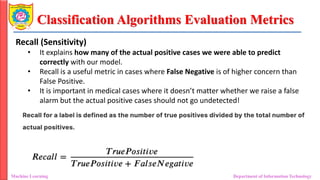
• It explains how many of the actual positive cases we were able to predict
correctly with our model.
• Recall is a useful metric in cases where False Negative is of higher concern than
False Positive.
• It is important in medical cases where it doesn’t matter whether we raise a false
alarm but the actual positive cases should not go undetected!
12.
Classification Algorithms EvaluationMetrics
Machine Learning Department of Information Technology
Recall (Sensitivity)
• It explains how many of the actual positive cases we were able to predict
correctly with our model.
• Recall is a useful metric in cases where False Negative is of higher concern than
False Positive.
• It is important in medical cases where it doesn’t matter whether we raise a false
alarm but the actual positive cases should not go undetected!
13.
Classification Algorithms EvaluationMetrics
Machine Learning Department of Information Technology
F1 Score:
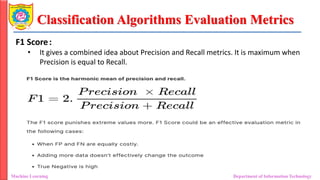
• It gives a combined idea about Precision and Recall metrics. It is maximum when
Precision is equal to Recall.
14.
Classification Algorithms EvaluationMetrics
Machine Learning Department of Information Technology
Specificity:
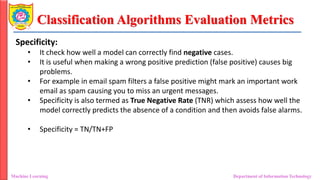
• It check how well a model can correctly find negative cases.
• It is useful when making a wrong positive prediction (false positive) causes big
problems.
• For example in email spam filters a false positive might mark an important work
email as spam causing you to miss an urgent messages.
• Specificity is also termed as True Negative Rate (TNR) which assess how well the
model correctly predicts the absence of a condition and then avoids false alarms.
• Specificity = TN/TN+FP
Classification Algorithms EvaluationMetrics
Machine Learning Department of Information Technology
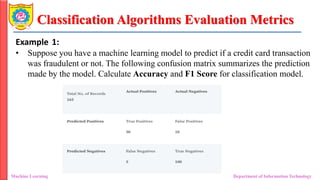
Example 1:
• Suppose you have a machine learning model to predict if a credit card transaction
was fraudulent or not. The following confusion matrix summarizes the prediction
made by the model. Calculate Accuracy and F1 Score for classification model.
17.
Classification Algorithms EvaluationMetrics
Machine Learning Department of Information Technology
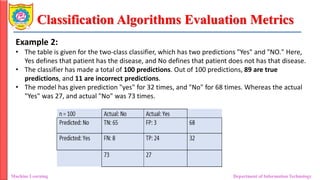
Example 2:
• The table is given for the two-class classifier, which has two predictions "Yes" and "NO." Here,
Yes defines that patient has the disease, and No defines that patient does not has that disease.
• The classifier has made a total of 100 predictions. Out of 100 predictions, 89 are true
predictions, and 11 are incorrect predictions.
• The model has given prediction "yes" for 32 times, and "No" for 68 times. Whereas the actual
"Yes" was 27, and actual "No" was 73 times.
18.
Classification Algorithms EvaluationMetrics
Machine Learning Department of Information Technology
AUC-ROC:
• The Receiver Operator Characteristic (ROC) is a probability curve that plots
the TPR (True Positive Rate) against the FPR (False Positive Rate) at various
threshold values and separates the ‘signal’ from the ‘noise’.
• The Area Under the Curve (AUC) is the measure of the ability of a classifier
to distinguish between classes.
• When AUC is equal to 1, the classifier is able to perfectly distinguish
between all Positive and Negative class points.
• When AUC is equal to 0, the classifier would be predicting all Negatives as
Positives and vice versa.
19.
Classification Algorithms EvaluationMetrics
Machine Learning Department of Information Technology
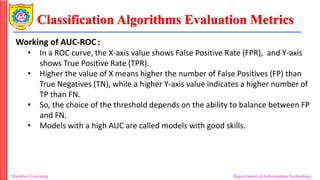
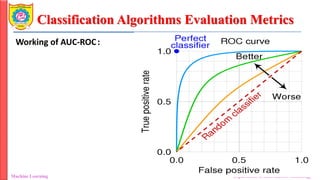
Working of AUC-ROC:
• In a ROC curve, the X-axis value shows False Positive Rate (FPR), and Y-axis
shows True Positive Rate (TPR).
• Higher the value of X means higher the number of False Positives (FP) than
True Negatives (TN), while a higher Y-axis value indicates a higher number of
TP than FN.
• So, the choice of the threshold depends on the ability to balance between FP
and FN.
• Models with a high AUC are called models with good skills.