Sanjivani Rural EducationSociety’s
Sanjivani College of Engineering, Kopargaon-423 603
Department of Information Technology
Prepared by
Dr.R.D.Chintamani
Assistant Professor
Department of Information Technology
Department of Information Technology, SRES’s Sanjivani College of Engineering, Kopargaon-
Machine Learning
(IT312)
2.
DEPARTMENT OF INFORMATIONTECHNOLOGY, SCOE,KOPARGAON
Unit-II
Regression
Course Objectives : To explore the Regression techniques
Course Outcome(CO2) : Apply the Regression methods,
3.
DEPARTMENT OF INFORMATIONTECHNOLOGY, SCOE,KOPARGAON
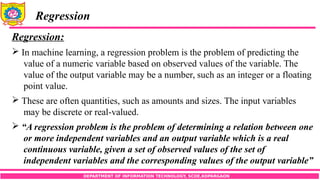
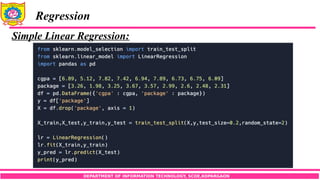
Regression
Regression:
In machine learning, a regression problem is the problem of predicting the
value of a numeric variable based on observed values of the variable. The
value of the output variable may be a number, such as an integer or a floating
point value.
These are often quantities, such as amounts and sizes. The input variables
may be discrete or real-valued.
“A regression problem is the problem of determining a relation between one
or more independent variables and an output variable which is a real
continuous variable, given a set of observed values of the set of
independent variables and the corresponding values of the output variable”
4.
DEPARTMENT OF INFORMATIONTECHNOLOGY, SCOE,KOPARGAON
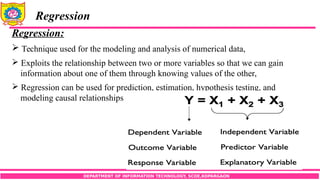
Regression
Regression:
Technique used for the modeling and analysis of numerical data,
Exploits the relationship between two or more variables so that we can gain
information about one of them through knowing values of the other,
Regression can be used for prediction, estimation, hypothesis testing, and
modeling causal relationships
5.
DEPARTMENT OF INFORMATIONTECHNOLOGY, SCOE,KOPARGAON
Regression
Regression Examples:
1) Consider the navigation of a mobile robot, say an autonomous car. The
output is the angle by which the steering wheel should be turned at each time,
to advance without hitting obstacles and deviating from the route. Inputs are
provided by sensors on the car like a video camera, GPS, and so forth.
2) In finance, the capital asset pricing model uses regression for analyzing and
quantifying the systematic risk of an investment.
3) In economics, regression is the predominant empirical tool. For example, it is
used to predict consumption spending, inventory investment, purchases of a
country’s exports, spending on imports, labor demand, and labor supply.
6.
DEPARTMENT OF INFORMATIONTECHNOLOGY, SCOE,KOPARGAON
Regression
Different Regression Models:
The different regression models are defined based on type of functions used to
represent the relation between the dependent variable y and the independent
variables.
DEPARTMENT OF INFORMATIONTECHNOLOGY, SCOE,KOPARGAON
Regression
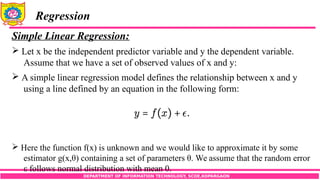
Simple Linear Regression:
Let x be the independent predictor variable and y the dependent variable.
Assume that we have a set of observed values of x and y:
A simple linear regression model defines the relationship between x and y
using a line defined by an equation in the following form:
Here the function f(x) is unknown and we would like to approximate it by some
estimator g(x,θ) containing a set of parameters θ. We assume that the random error
ε follows normal distribution with mean 0.
10.
DEPARTMENT OF INFORMATIONTECHNOLOGY, SCOE,KOPARGAON
Regression
Simple Linear Regression:
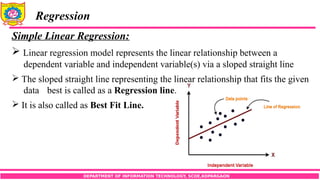
Linear regression model represents the linear relationship between a
dependent variable and independent variable(s) via a sloped straight line
The sloped straight line representing the linear relationship that fits the given
data best is called as a Regression line.
It is also called as Best Fit Line.
DEPARTMENT OF INFORMATIONTECHNOLOGY, SCOE,KOPARGAON
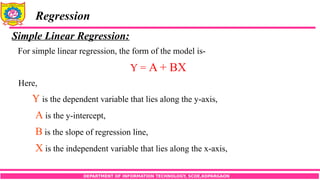
Regression
Simple Linear Regression:
For simple linear regression, the form of the model is-
Y = A + BX
Here,
Y is the dependent variable that lies along the y-axis,
A is the y-intercept,
B is the slope of regression line,
X is the independent variable that lies along the x-axis,
14.
DEPARTMENT OF INFORMATIONTECHNOLOGY, SCOE,KOPARGAON
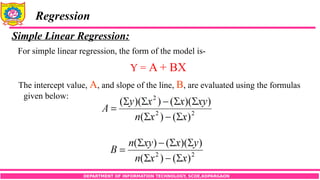
Regression
Simple Linear Regression:
For simple linear regression, the form of the model is-
Y = A + BX
The intercept value, A, and slope of the line, B, are evaluated using the formulas
given below:
15.
DEPARTMENT OF INFORMATIONTECHNOLOGY, SCOE,KOPARGAON
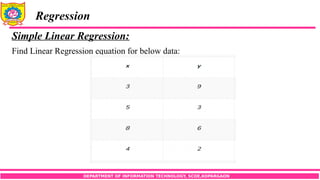
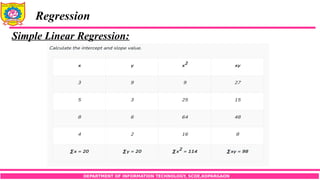
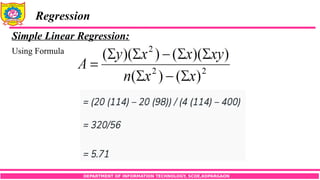
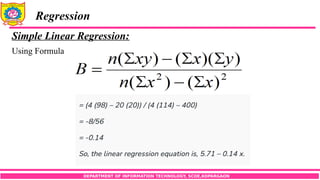
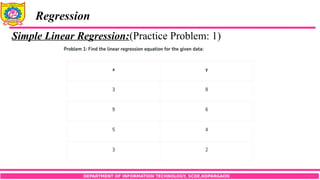
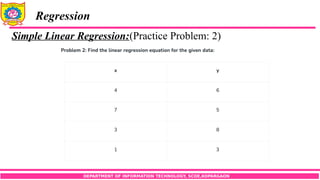
Regression
Simple Linear Regression:
Find Linear Regression equation for below data:
DEPARTMENT OF INFORMATIONTECHNOLOGY, SCOE,KOPARGAON
Evaluation Metrics
Evaluation Metrics for Linear Regression:
Machine learning model cannot have 100 per cent efficiency otherwise the
model is known as a biased model.
Which further includes the concept of overfitting and underfitting.
It is necessary to obtain the accuracy on training data, But it is also important
to get a genuine and approximate result on unseen data otherwise Model is
of no use.
So to build and deploy a generalized model we require to Evaluate the model
on different metrics which helps us to better optimize the performance, fine-
tune it, and obtain a better result.
23.
DEPARTMENT OF INFORMATIONTECHNOLOGY, SCOE,KOPARGAON
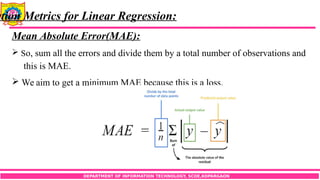
ation Metrics for Linear Regression:
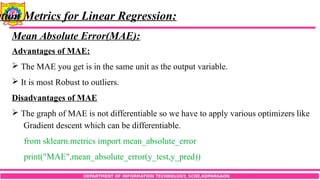
Mean Absolute Error(MAE):
MAE is a very simple metric which calculates the absolute difference between
actual and predicted values.
To better understand, let’s take an example we have input data and output
data and use Linear Regression, which draws a best-fit line.
Now you have to find the MAE of your model which is basically a mistake
made by the model known as an error.
Now find the difference between the actual value and predicted value that is
an absolute error but we have to find the mean absolute of the complete
dataset.
24.
DEPARTMENT OF INFORMATIONTECHNOLOGY, SCOE,KOPARGAON
ation Metrics for Linear Regression:
Mean Absolute Error(MAE):
So, sum all the errors and divide them by a total number of observations and
this is MAE.
We aim to get a minimum MAE because this is a loss.
25.
DEPARTMENT OF INFORMATIONTECHNOLOGY, SCOE,KOPARGAON
ation Metrics for Linear Regression:
Mean Absolute Error(MAE):
Advantages of MAE:
The MAE you get is in the same unit as the output variable.
It is most Robust to outliers.
Disadvantages of MAE
The graph of MAE is not differentiable so we have to apply various optimizers like
Gradient descent which can be differentiable.
from sklearn.metrics import mean_absolute_error
print("MAE",mean_absolute_error(y_test,y_pred))
26.
DEPARTMENT OF INFORMATIONTECHNOLOGY, SCOE,KOPARGAON
ation Metrics for Linear Regression:
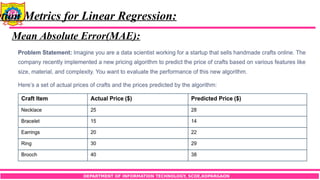
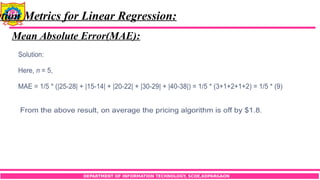
Mean Absolute Error(MAE):
27.
DEPARTMENT OF INFORMATIONTECHNOLOGY, SCOE,KOPARGAON
ation Metrics for Linear Regression:
Mean Absolute Error(MAE):
28.
DEPARTMENT OF INFORMATIONTECHNOLOGY, SCOE,KOPARGAON
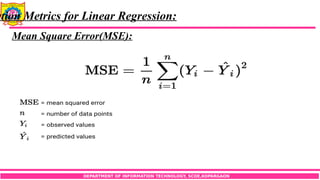
ation Metrics for Linear Regression:
Mean Square Error(MSE):
MSE is a most used and very simple metric with a little bit of change in mean
absolute error. Mean squared error states that finding the squared difference
between actual and predicted value.
So, above we are finding the absolute difference and here we are finding the
squared difference.
What actually the MSE represents? It represents the squared distance between
actual and predicted values. we perform squared to avoid the cancellation of
negative terms and it is the benefit of MSE.
29.
DEPARTMENT OF INFORMATIONTECHNOLOGY, SCOE,KOPARGAON
ation Metrics for Linear Regression:
Mean Square Error(MSE):
30.
DEPARTMENT OF INFORMATIONTECHNOLOGY, SCOE,KOPARGAON
ation Metrics for Linear Regression:
Mean Square Error(MSE):
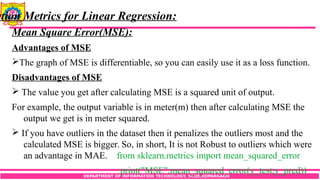
Advantages of MSE
The graph of MSE is differentiable, so you can easily use it as a loss function.
Disadvantages of MSE
The value you get after calculating MSE is a squared unit of output.
For example, the output variable is in meter(m) then after calculating MSE the
output we get is in meter squared.
If you have outliers in the dataset then it penalizes the outliers most and the
calculated MSE is bigger. So, in short, It is not Robust to outliers which were
an advantage in MAE. from sklearn.metrics import mean_squared_error
print("MSE",mean_squared_error(y_test,y_pred))
31.
DEPARTMENT OF INFORMATIONTECHNOLOGY, SCOE,KOPARGAON
ation Metrics for Linear Regression:
Mean Square Error(MSE):
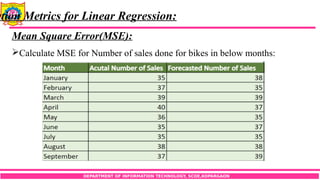
Calculate MSE for Number of sales done for bikes in below months:
32.
DEPARTMENT OF INFORMATIONTECHNOLOGY, SCOE,KOPARGAON
ation Metrics for Linear Regression:
Mean Square Error(MSE):
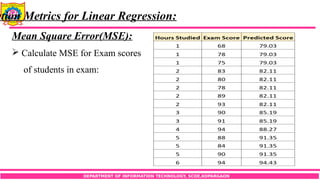
Calculate MSE for Exam scores
of students in exam:
33.
DEPARTMENT OF INFORMATIONTECHNOLOGY, SCOE,KOPARGAON
ation Metrics for Linear Regression:
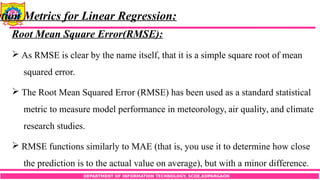
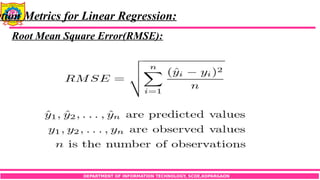
Root Mean Square Error(RMSE):
As RMSE is clear by the name itself, that it is a simple square root of mean
squared error.
The Root Mean Squared Error (RMSE) has been used as a standard statistical
metric to measure model performance in meteorology, air quality, and climate
research studies.
RMSE functions similarly to MAE (that is, you use it to determine how close
the prediction is to the actual value on average), but with a minor difference.
34.
DEPARTMENT OF INFORMATIONTECHNOLOGY, SCOE,KOPARGAON
ation Metrics for Linear Regression:
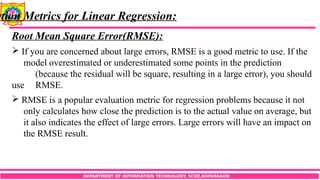
Root Mean Square Error(RMSE):
If you are concerned about large errors, RMSE is a good metric to use. If the
model overestimated or underestimated some points in the prediction
(because the residual will be square, resulting in a large error), you should
use RMSE.
RMSE is a popular evaluation metric for regression problems because it not
only calculates how close the prediction is to the actual value on average, but
it also indicates the effect of large errors. Large errors will have an impact on
the RMSE result.
35.
DEPARTMENT OF INFORMATIONTECHNOLOGY, SCOE,KOPARGAON
ation Metrics for Linear Regression:
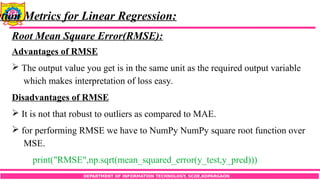
Root Mean Square Error(RMSE):
Advantages of RMSE
The output value you get is in the same unit as the required output variable
which makes interpretation of loss easy.
Disadvantages of RMSE
It is not that robust to outliers as compared to MAE.
for performing RMSE we have to NumPy NumPy square root function over
MSE.
print("RMSE",np.sqrt(mean_squared_error(y_test,y_pred)))
36.
DEPARTMENT OF INFORMATIONTECHNOLOGY, SCOE,KOPARGAON
ation Metrics for Linear Regression:
Root Mean Square Error(RMSE):
37.
DEPARTMENT OF INFORMATIONTECHNOLOGY, SCOE,KOPARGAON
ation Metrics for Linear Regression:
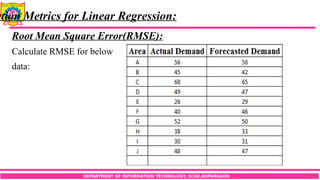
Root Mean Square Error(RMSE):
Calculate RMSE for below
data:
38.
DEPARTMENT OF INFORMATIONTECHNOLOGY, SCOE,KOPARGAON
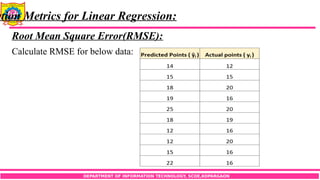
ation Metrics for Linear Regression:
Root Mean Square Error(RMSE):
Calculate RMSE for below data:
39.
DEPARTMENT OF INFORMATIONTECHNOLOGY, SCOE,KOPARGAON
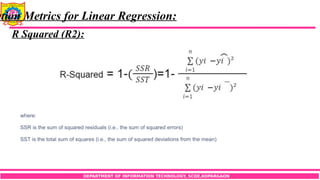
ation Metrics for Linear Regression:
R Squared (R2):
R2 score is a metric that tells the performance of your model, not the loss in
an absolute sense that how many wells did your model perform.
In contrast, MAE and MSE depend on the context as we have seen whereas
the R2 score is independent of context.
So, with help of R squared we have a baseline model to compare a model
which none of the other metrics provides.
So basically R2 squared calculates how must regression line is better than a
mean line.
40.
DEPARTMENT OF INFORMATIONTECHNOLOGY, SCOE,KOPARGAON
ation Metrics for Linear Regression:
R Squared (R2):
R2 squared is also known as Coefficient of Determination or sometimes also
known as Goodness of fit.
R squared measures how much the variation is there in predicted and actual
values in the regression model,
When to Use R Squared?
Both independent and dependent variables must be continuous.
When the independent and dependent variables have linear relationship (+ve
or -ve) between them.
41.
DEPARTMENT OF INFORMATIONTECHNOLOGY, SCOE,KOPARGAON
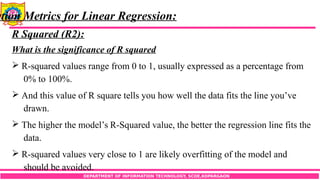
ation Metrics for Linear Regression:
R Squared (R2):
What is the significance of R squared
R-squared values range from 0 to 1, usually expressed as a percentage from
0% to 100%.
And this value of R square tells you how well the data fits the line you’ve
drawn.
The higher the model’s R-Squared value, the better the regression line fits the
data.
R-squared values very close to 1 are likely overfitting of the model and
should be avoided.
42.
DEPARTMENT OF INFORMATIONTECHNOLOGY, SCOE,KOPARGAON
ation Metrics for Linear Regression:
R Squared (R2):
43.
DEPARTMENT OF INFORMATIONTECHNOLOGY, SCOE,KOPARGAON
Regression
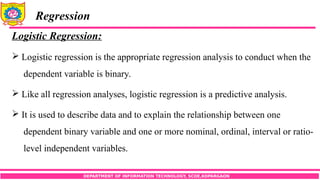
Logistic Regression:
Logistic regression is the appropriate regression analysis to conduct when the
dependent variable is binary.
Like all regression analyses, logistic regression is a predictive analysis.
It is used to describe data and to explain the relationship between one
dependent binary variable and one or more nominal, ordinal, interval or ratio-
level independent variables.
44.
DEPARTMENT OF INFORMATIONTECHNOLOGY, SCOE,KOPARGAON
Regression
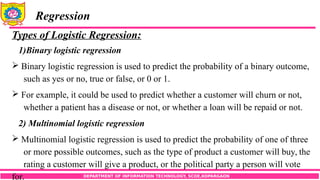
Types of Logistic Regression:
1)Binary logistic regression
Binary logistic regression is used to predict the probability of a binary outcome,
such as yes or no, true or false, or 0 or 1.
For example, it could be used to predict whether a customer will churn or not,
whether a patient has a disease or not, or whether a loan will be repaid or not.
2) Multinomial logistic regression
Multinomial logistic regression is used to predict the probability of one of three
or more possible outcomes, such as the type of product a customer will buy, the
rating a customer will give a product, or the political party a person will vote
for.
45.
DEPARTMENT OF INFORMATIONTECHNOLOGY, SCOE,KOPARGAON
Regression
Types of Logistic Regression:
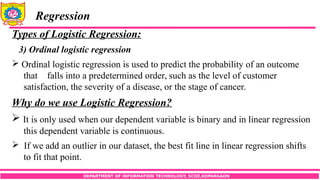
3) Ordinal logistic regression
Ordinal logistic regression is used to predict the probability of an outcome
that falls into a predetermined order, such as the level of customer
satisfaction, the severity of a disease, or the stage of cancer.
Why do we use Logistic Regression?
It is only used when our dependent variable is binary and in linear regression
this dependent variable is continuous.
If we add an outlier in our dataset, the best fit line in linear regression shifts
to fit that point.
46.
DEPARTMENT OF INFORMATIONTECHNOLOGY, SCOE,KOPARGAON
Regression
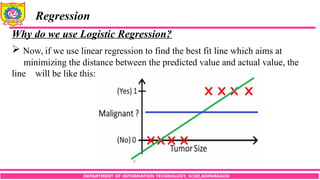
Why do we use Logistic Regression?
Now, if we use linear regression to find the best fit line which aims at
minimizing the distance between the predicted value and actual value, the
line will be like this:
47.
DEPARTMENT OF INFORMATIONTECHNOLOGY, SCOE,KOPARGAON
Regression
Why do we use Logistic Regression?
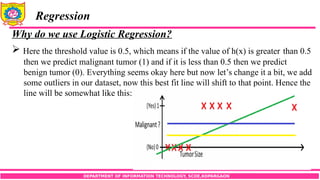
Here the threshold value is 0.5, which means if the value of h(x) is greater than 0.5
then we predict malignant tumor (1) and if it is less than 0.5 then we predict
benign tumor (0). Everything seems okay here but now let’s change it a bit, we add
some outliers in our dataset, now this best fit line will shift to that point. Hence the
line will be somewhat like this:
48.
DEPARTMENT OF INFORMATIONTECHNOLOGY, SCOE,KOPARGAON
Regression
Why do we use Logistic Regression?
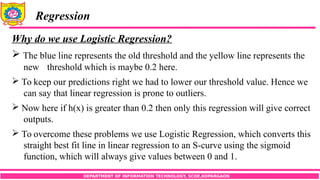
The blue line represents the old threshold and the yellow line represents the
new threshold which is maybe 0.2 here.
To keep our predictions right we had to lower our threshold value. Hence we
can say that linear regression is prone to outliers.
Now here if h(x) is greater than 0.2 then only this regression will give correct
outputs.
To overcome these problems we use Logistic Regression, which converts this
straight best fit line in linear regression to an S-curve using the sigmoid
function, which will always give values between 0 and 1.
49.
DEPARTMENT OF INFORMATIONTECHNOLOGY, SCOE,KOPARGAON
Regression
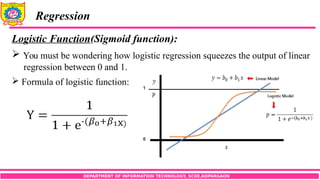
Logistic Function(Sigmoid function):
You must be wondering how logistic regression squeezes the output of linear
regression between 0 and 1.
Formula of logistic function:
50.
DEPARTMENT OF INFORMATIONTECHNOLOGY, SCOE,KOPARGAON
Regression
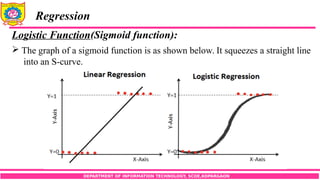
Logistic Function(Sigmoid function):
The graph of a sigmoid function is as shown below. It squeezes a straight line
into an S-curve.
51.
DEPARTMENT OF INFORMATIONTECHNOLOGY, SCOE,KOPARGAON
Regression
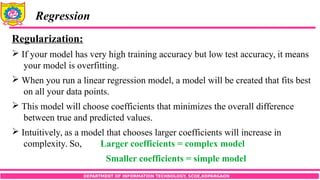
Regularization:
If your model has very high training accuracy but low test accuracy, it means
your model is overfitting.
When you run a linear regression model, a model will be created that fits best
on all your data points.
This model will choose coefficients that minimizes the overall difference
between true and predicted values.
Intuitively, as a model that chooses larger coefficients will increase in
complexity. So, Larger coefficients = complex model
Smaller coefficients = simple model
52.
DEPARTMENT OF INFORMATIONTECHNOLOGY, SCOE,KOPARGAON
Regression
Regularization:
This means that as the model chooses larger coefficients, it becomes more
complex, which means it might overfit.
To mitigate overfitting, we need to force the model to choose smaller
coefficients.
We can do this by employing a technique called “Regularization”
Regularization is a process that discourages the model from becoming overly
complex.
It does this by punishing models that choose large coefficients.
53.
DEPARTMENT OF INFORMATIONTECHNOLOGY, SCOE,KOPARGAON
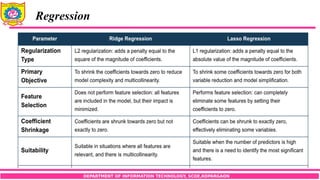
Regression
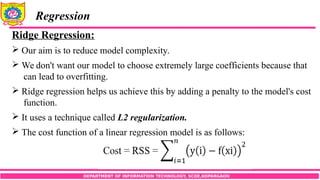
Ridge Regression:
Our aim is to reduce model complexity.
We don't want our model to choose extremely large coefficients because that
can lead to overfitting.
Ridge regression helps us achieve this by adding a penalty to the model's cost
function.
It uses a technique called L2 regularization.
The cost function of a linear regression model is as follows:
54.
DEPARTMENT OF INFORMATIONTECHNOLOGY, SCOE,KOPARGAON
Regression
Ridge Regression:
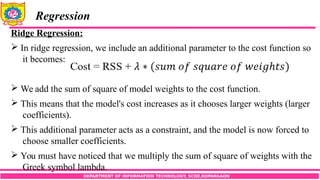
In ridge regression, we include an additional parameter to the cost function so
it becomes:
We add the sum of square of model weights to the cost function.
This means that the model's cost increases as it chooses larger weights (larger
coefficients).
This additional parameter acts as a constraint, and the model is now forced to
choose smaller coefficients.
You must have noticed that we multiply the sum of square of weights with the
Greek symbol lambda.
55.
DEPARTMENT OF INFORMATIONTECHNOLOGY, SCOE,KOPARGAON
Regression
Ridge Regression:
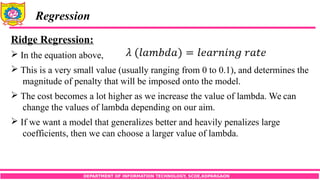
In the equation above,
This is a very small value (usually ranging from 0 to 0.1), and determines the
magnitude of penalty that will be imposed onto the model.
The cost becomes a lot higher as we increase the value of lambda. We can
change the values of lambda depending on our aim.
If we want a model that generalizes better and heavily penalizes large
coefficients, then we can choose a larger value of lambda.
DEPARTMENT OF INFORMATIONTECHNOLOGY, SCOE,KOPARGAON
Regression
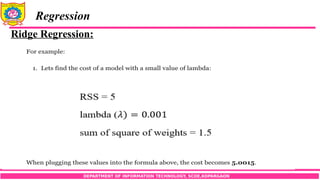
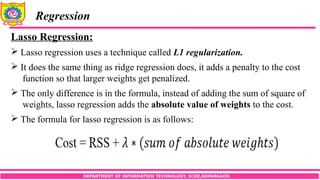
Lasso Regression:
Lasso regression uses a technique called L1 regularization.
It does the same thing as ridge regression does, it adds a penalty to the cost
function so that larger weights get penalized.
The only difference is in the formula, instead of adding the sum of square of
weights, lasso regression adds the absolute value of weights to the cost.
The formula for lasso regression is as follows:
59.
DEPARTMENT OF INFORMATIONTECHNOLOGY, SCOE,KOPARGAON
Regression
Lasso Regression:
It works similar to ridge regression it terms of mitigating overfitting, except
that it takes the absolute weights instead of the square weights.
If you want to perform linear regression on a high dimensional dataset, lasso
regression can help you narrow down and eliminate some features.
Both ridge and lasso regression will help shrink coefficients, and minimize
feature weights.
However, if the value of lambda is large enough, lasso regression can
sometimes pull feature weights down to zero.
60.
DEPARTMENT OF INFORMATIONTECHNOLOGY, SCOE,KOPARGAON
Regression
Lasso Regression:
When the coefficient of a feature gets pulled down to zero, that coefficient is
eliminated from the model.
This way, lasso regression can help eliminate unnecessary features from your
model.
It should be noted that ridge regression does not set coefficients to zero, so it
can't be used to eliminate features the way lasso regression can.