Sigmoid function,Classification Algorithm in Machine Learning: Decision Trees ,
Ensemble Techniques: Bagging and boosting, Adaboost and gradient boost, Random
Forest,Naïve Bayes Classifier, Support Vector Machines. Performance Evaluation:
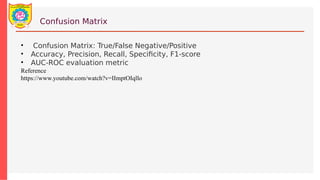
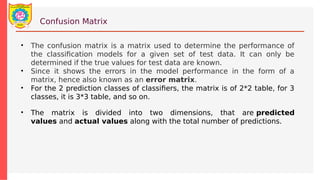
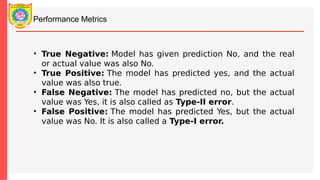
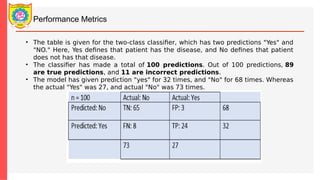
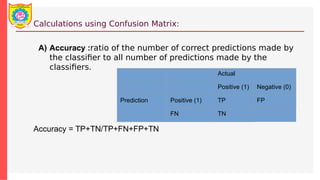
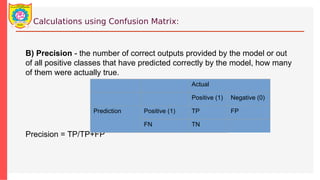
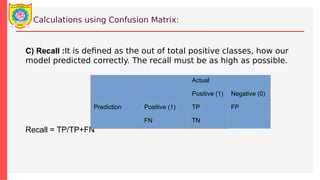
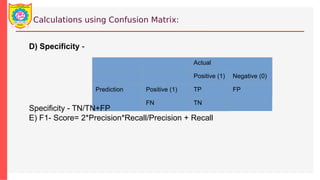
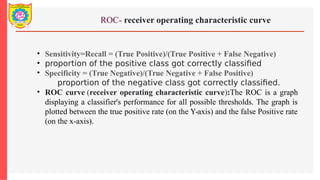
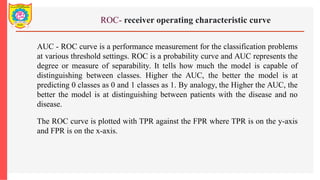
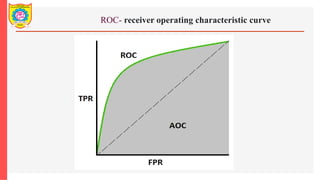
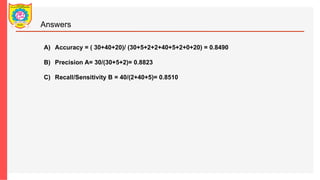
Confusion Matrix, Accuracy, Precision, Recall, AUC-ROC Curves, F-Measure


![PERFORMANCE_PREDICTION__PARAMETERS[1].pptx](https://cdn.slidesharecdn.com/ss_thumbnails/performancepredictionparameters1-240130171305-9f984922-thumbnail.jpg?width=640&height=640&fit=bounds)