Foundation of Data Science unit number three notes
1.
Sanjivani Rural EducationSociety’s
Sanjivani College of Engineering, Kopargaon-423 603
Department of Information Technology
Prepared by
Mr. Umesh B. Sangule
Assistant Professor
Department of Information Technology
De
partme
ntof InformationTec
hnology, SRES’sSanjivani Colle
geof Engine
e
ring, Kopargaon-423603
Foundation of Data Science
(IT305B)
2.
DEPARTMENT OF INFORMATIONTECHNOLOGY, SCOE,KOPARGAON
Unit-III
LINEAR ALGEBRA
Course Objectives : To apply the Linear Algebra for data
science.
Course Outcome(CO3) : Apply the fundamentals of Linear
Algebra on data.
3.
Content
DEPARTMENT OF INFORMATIONTECHNOLOGY, SCOE,KOPARGAON
Data measurements scale,
Measures of central tendency,
Measures of variation,
Measures of shape
4.
DEPARTMENT OF INFORMATIONTECHNOLOGY, SCOE,KOPARGAON
“ Data have an important story to tell.
They rely on you to give them a voice ”
Before you give them a voice, you have to understand the different data
types.
There are different ways to categorize data based on the way it has been
collected or its structure.
Data Types and Data Measurement Scale
5.
DEPARTMENT OF INFORMATIONTECHNOLOGY, SCOE,KOPARGAON
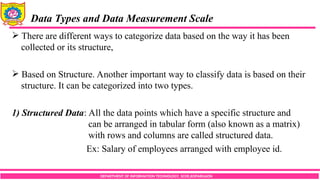
There are different ways to categorize data based on the way it has been
collected or its structure,
Based on Structure. Another important way to classify data is based on their
structure. It can be categorized into two types.
1) Structured Data: All the data points which have a specific structure and
can be arranged in tabular form (also known as a matrix)
with rows and columns are called structured data.
Ex: Salary of employees arranged with employee id.
Data Types and Data Measurement Scale
6.
DEPARTMENT OF INFORMATIONTECHNOLOGY, SCOE,KOPARGAON
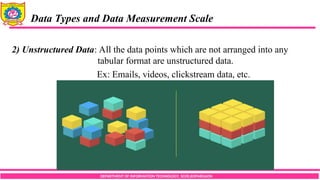
2) Unstructured Data: All the data points which are not arranged into any
tabular format are unstructured data.
Ex: Emails, videos, clickstream data, etc.
Data Types and Data Measurement Scale
7.
DEPARTMENT OF INFORMATIONTECHNOLOGY, SCOE,KOPARGAON
Based on Data Collection: Data can be categorized into three types based on
how data has been collected.
1) Cross-Sectional Data
2) Time-Series Data
3) Panel Data
Cross-Sectional Data: Any data points/values captured on multiple variables
over one specific time period is termed as cross-
sectional data.
Ex: attributes of the employee such as age, salary,
level, team for the year 2019.
Data Types and Data Measurement Scale
8.
DEPARTMENT OF INFORMATIONTECHNOLOGY, SCOE,KOPARGAON
Time-Series Data: Any data points/values captured on a single variable over
multiple periods is called time-series data.
Ex: sales of smartphones on a monthly, quarterly,
yearly basis.
Panel Data: A combination of both the cross-sectional and time-series data
is known as Panel data.
Ex: GDP of the various country over different periods
Data Types and Data Measurement Scale
9.
DEPARTMENT OF INFORMATIONTECHNOLOGY, SCOE,KOPARGAON
Data Types and Data Measurement Scale
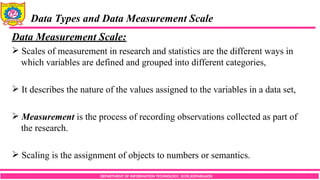
Data Measurement Scale:
Scales of measurement in research and statistics are the different ways in
which variables are defined and grouped into different categories,
It describes the nature of the values assigned to the variables in a data set,
Measurement is the process of recording observations collected as part of
the research.
Scaling is the assignment of objects to numbers or semantics.
10.
DEPARTMENT OF INFORMATIONTECHNOLOGY, SCOE,KOPARGAON
Data Types and Data Measurement Scale
Data Measurement Scale:
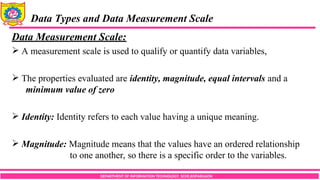
A measurement scale is used to qualify or quantify data variables,
The properties evaluated are identity, magnitude, equal intervals and a
minimum value of zero
Identity: Identity refers to each value having a unique meaning.
Magnitude: Magnitude means that the values have an ordered relationship
to one another, so there is a specific order to the variables.
11.
DEPARTMENT OF INFORMATIONTECHNOLOGY, SCOE,KOPARGAON
Data Types and Data Measurement Scale
Data Measurement Scale:
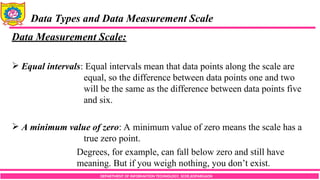
Equal intervals: Equal intervals mean that data points along the scale are
equal, so the difference between data points one and two
will be the same as the difference between data points five
and six.
A minimum value of zero: A minimum value of zero means the scale has a
true zero point.
Degrees, for example, can fall below zero and still have
meaning. But if you weigh nothing, you don’t exist.
12.
DEPARTMENT OF INFORMATIONTECHNOLOGY, SCOE,KOPARGAON
Data Types and Data Measurement Scale
Data Measurement Scale:
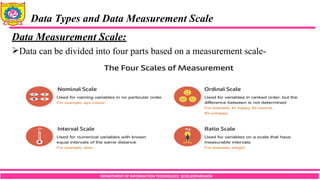
Data can be divided into four parts based on a measurement scale-
13.
DEPARTMENT OF INFORMATIONTECHNOLOGY, SCOE,KOPARGAON
Data Types and Data Measurement Scale
Data Measurement Scale:
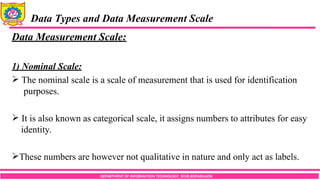
1) Nominal Scale:
The nominal scale is a scale of measurement that is used for identification
purposes.
It is also known as categorical scale, it assigns numbers to attributes for easy
identity.
These numbers are however not qualitative in nature and only act as labels.
14.
DEPARTMENT OF INFORMATIONTECHNOLOGY, SCOE,KOPARGAON
Data Types and Data Measurement Scale
Data Measurement Scale:
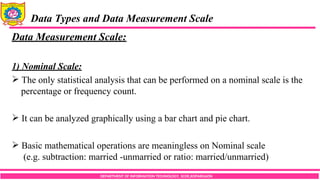
1) Nominal Scale:
The only statistical analysis that can be performed on a nominal scale is the
percentage or frequency count.
It can be analyzed graphically using a bar chart and pie chart.
Basic mathematical operations are meaningless on Nominal scale
(e.g. subtraction: married -unmarried or ratio: married/unmarried)
15.
DEPARTMENT OF INFORMATIONTECHNOLOGY, SCOE,KOPARGAON
Data Types and Data Measurement Scale
Data Measurement Scale:
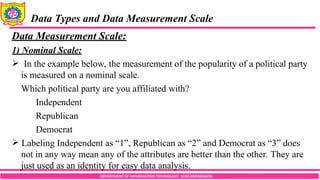
1) Nominal Scale:
In the example below, the measurement of the popularity of a political party
is measured on a nominal scale.
Which political party are you affiliated with?
Independent
Republican
Democrat
Labeling Independent as “1”, Republican as “2” and Democrat as “3” does
not in any way mean any of the attributes are better than the other. They are
just used as an identity for easy data analysis.
16.
DEPARTMENT OF INFORMATIONTECHNOLOGY, SCOE,KOPARGAON
Data Types and Data Measurement Scale
Data Measurement Scale:
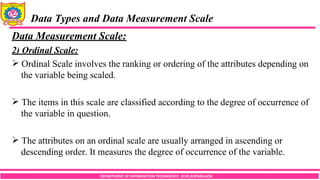
2) Ordinal Scale:
Ordinal Scale involves the ranking or ordering of the attributes depending on
the variable being scaled.
The items in this scale are classified according to the degree of occurrence of
the variable in question.
The attributes on an ordinal scale are usually arranged in ascending or
descending order. It measures the degree of occurrence of the variable.
17.
DEPARTMENT OF INFORMATIONTECHNOLOGY, SCOE,KOPARGAON
Data Types and Data Measurement Scale
Data Measurement Scale:
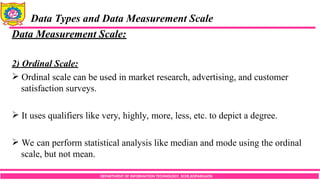
2) Ordinal Scale:
Ordinal scale can be used in market research, advertising, and customer
satisfaction surveys.
It uses qualifiers like very, highly, more, less, etc. to depict a degree.
We can perform statistical analysis like median and mode using the ordinal
scale, but not mean.
18.
DEPARTMENT OF INFORMATIONTECHNOLOGY, SCOE,KOPARGAON
Data Types and Data Measurement Scale
Data Measurement Scale:
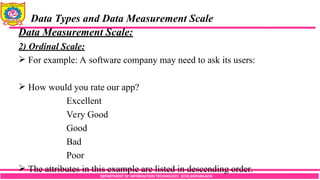
2) Ordinal Scale:
For example: A software company may need to ask its users:
How would you rate our app?
Excellent
Very Good
Good
Bad
Poor
The attributes in this example are listed in descending order.
19.
DEPARTMENT OF INFORMATIONTECHNOLOGY, SCOE,KOPARGAON
Data Types and Data Measurement Scale
Data Measurement Scale:
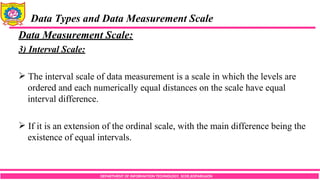
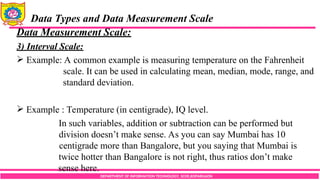
3) Interval Scale:
The interval scale of data measurement is a scale in which the levels are
ordered and each numerically equal distances on the scale have equal
interval difference.
If it is an extension of the ordinal scale, with the main difference being the
existence of equal intervals.
20.
DEPARTMENT OF INFORMATIONTECHNOLOGY, SCOE,KOPARGAON
Data Types and Data Measurement Scale
Data Measurement Scale:
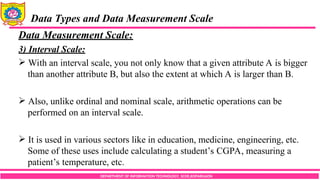
3) Interval Scale:
With an interval scale, you not only know that a given attribute A is bigger
than another attribute B, but also the extent at which A is larger than B.
Also, unlike ordinal and nominal scale, arithmetic operations can be
performed on an interval scale.
It is used in various sectors like in education, medicine, engineering, etc.
Some of these uses include calculating a student’s CGPA, measuring a
patient’s temperature, etc.
21.
DEPARTMENT OF INFORMATIONTECHNOLOGY, SCOE,KOPARGAON
Data Types and Data Measurement Scale
Data Measurement Scale:
3) Interval Scale:
Example: A common example is measuring temperature on the Fahrenheit
scale. It can be used in calculating mean, median, mode, range, and
standard deviation.
Example : Temperature (in centigrade), IQ level.
In such variables, addition or subtraction can be performed but
division doesn’t make sense. As you can say Mumbai has 10
centigrade more than Bangalore, but you saying that Mumbai is
twice hotter than Bangalore is not right, thus ratios don’t make
sense here.
22.
DEPARTMENT OF INFORMATIONTECHNOLOGY, SCOE,KOPARGAON
Data Types and Data Measurement Scale
Data Measurement Scale:
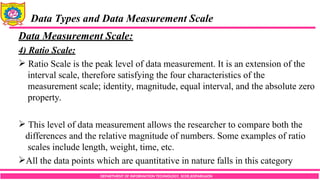
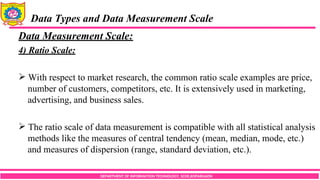
4) Ratio Scale:
Ratio Scale is the peak level of data measurement. It is an extension of the
interval scale, therefore satisfying the four characteristics of the
measurement scale; identity, magnitude, equal interval, and the absolute zero
property.
This level of data measurement allows the researcher to compare both the
differences and the relative magnitude of numbers. Some examples of ratio
scales include length, weight, time, etc.
All the data points which are quantitative in nature falls in this category
23.
DEPARTMENT OF INFORMATIONTECHNOLOGY, SCOE,KOPARGAON
Data Types and Data Measurement Scale
Data Measurement Scale:
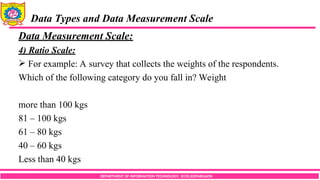
4) Ratio Scale:
With respect to market research, the common ratio scale examples are price,
number of customers, competitors, etc. It is extensively used in marketing,
advertising, and business sales.
The ratio scale of data measurement is compatible with all statistical analysis
methods like the measures of central tendency (mean, median, mode, etc.)
and measures of dispersion (range, standard deviation, etc.).
24.
DEPARTMENT OF INFORMATIONTECHNOLOGY, SCOE,KOPARGAON
Data Types and Data Measurement Scale
Data Measurement Scale:
4) Ratio Scale:
For example: A survey that collects the weights of the respondents.
Which of the following category do you fall in? Weight
more than 100 kgs
81 – 100 kgs
61 – 80 kgs
40 – 60 kgs
Less than 40 kgs
25.
DEPARTMENT OF INFORMATIONTECHNOLOGY, SCOE,KOPARGAON
Measures of central tendency
Measures of central tendency:
A measure of central tendency (also referred to as measures of centre or
central location) is a summary measure that attempts to describe a whole set
of data with a single value that represents the middle or centre of its
distribution.
Therefore, a measure of central tendency is a way to summarize a large set of
numbers using one single score,
There are three main measures of central tendency:
1. Mean 2.Median 3. Mode
26.
DEPARTMENT OF INFORMATIONTECHNOLOGY, SCOE,KOPARGAON
Measures of central tendency
Measures of central tendency:
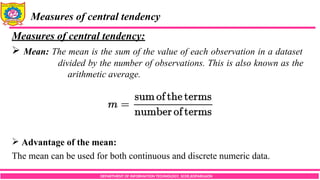
Mean: The mean is the sum of the value of each observation in a dataset
divided by the number of observations. This is also known as the
arithmetic average.
Advantage of the mean:
The mean can be used for both continuous and discrete numeric data.
27.
DEPARTMENT OF INFORMATIONTECHNOLOGY, SCOE,KOPARGAON
Measures of central tendency
Measures of central tendency:
Limitations of the mean:
The mean cannot be calculated for categorical data, as the values cannot be
summed,
As the mean includes every value in the distribution the mean is influenced
by outliers,
Example: 54, 54, 54, 55, 56, 57, 57, 58, 58, 60, 60
The mean is (623/11)= 56.6
28.
DEPARTMENT OF INFORMATIONTECHNOLOGY, SCOE,KOPARGAON
Measures of central tendency
Measures of central tendency:
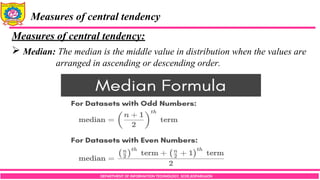
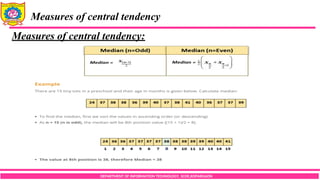
Median: The median is the middle value in distribution when the values are
arranged in ascending or descending order.
29.
DEPARTMENT OF INFORMATIONTECHNOLOGY, SCOE,KOPARGAON
Measures of central tendency
Measures of central tendency:
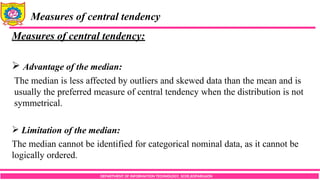
Advantage of the median:
The median is less affected by outliers and skewed data than the mean and is
usually the preferred measure of central tendency when the distribution is not
symmetrical.
Limitation of the median:
The median cannot be identified for categorical nominal data, as it cannot be
logically ordered.
30.
DEPARTMENT OF INFORMATIONTECHNOLOGY, SCOE,KOPARGAON
Measures of central tendency
Measures of central tendency:
31.
DEPARTMENT OF INFORMATIONTECHNOLOGY, SCOE,KOPARGAON
Measures of central tendency
Measures of central tendency:
Mode: The mode is the most commonly occurring value in a distribution.
Consider this dataset showing the retirement age of 11 people, in whole years:
54, 54, 54, 55, 56, 57, 57, 58, 58, 60, 60
This list shows a simple frequency distribution of the retirement age data.
54 – 3, 55 – 1, 56 – 1, 57 – 2, 58 – 2, 60 – 2
The most commonly occurring value is 54, therefore the mode of this
distribution is 54 years.
32.
DEPARTMENT OF INFORMATIONTECHNOLOGY, SCOE,KOPARGAON
Measures of central tendency
Measures of central tendency:
Advantage of the mode:
The mode has an advantage over the median and the mean as it can be found
for both numerical and categorical (non-numerical) data.
Limitations of Mode:
It is also possible for there to be more than one mode for the same distribution
of data, (bi-modal, or multi-modal). The presence of more than one mode can
limit the ability of the mode in describing the centre or typical value of the
distribution because a single value to describe the centre cannot be identified.
33.
DEPARTMENT OF INFORMATIONTECHNOLOGY, SCOE,KOPARGAON
Measures of central tendency
Measures of central tendency:
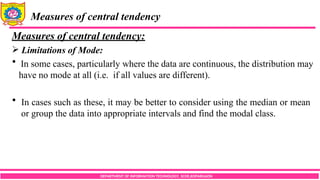
Limitations of Mode:
In some cases, particularly where the data are continuous, the distribution may
have no mode at all (i.e. if all values are different).
In cases such as these, it may be better to consider using the median or mean
or group the data into appropriate intervals and find the modal class.
34.
DEPARTMENT OF INFORMATIONTECHNOLOGY, SCOE,KOPARGAON
Measures of central tendency
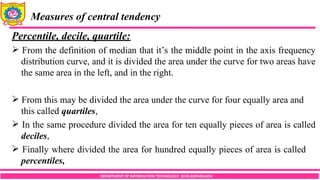
Percentile, decile, quartile:
From the definition of median that it’s the middle point in the axis frequency
distribution curve, and it is divided the area under the curve for two areas have
the same area in the left, and in the right.
From this may be divided the area under the curve for four equally area and
this called quartiles,
In the same procedure divided the area for ten equally pieces of area is called
deciles,
Finally where divided the area for hundred equally pieces of area is called
percentiles,
35.
DEPARTMENT OF INFORMATIONTECHNOLOGY, SCOE,KOPARGAON
Measures of central tendency
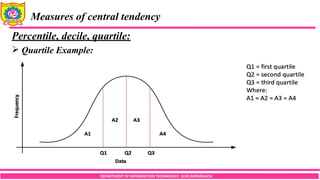
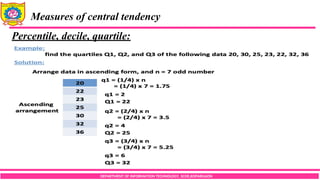
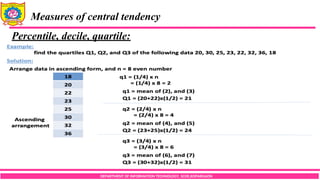
Percentile, decile, quartile:
Quartile Example:
36.
DEPARTMENT OF INFORMATIONTECHNOLOGY, SCOE,KOPARGAON
Measures of central tendency
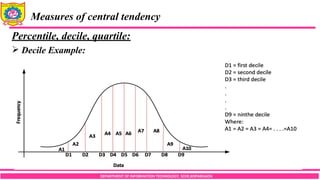
Percentile, decile, quartile:
Decile Example:
37.
DEPARTMENT OF INFORMATIONTECHNOLOGY, SCOE,KOPARGAON
Measures of central tendency
Percentile, decile, quartile:
38.
DEPARTMENT OF INFORMATIONTECHNOLOGY, SCOE,KOPARGAON
Measures of central tendency
Percentile, decile, quartile:
39.
DEPARTMENT OF INFORMATIONTECHNOLOGY, SCOE,KOPARGAON
Measures of variation
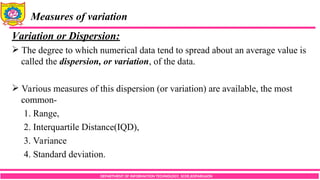
Variation or Dispersion:
The degree to which numerical data tend to spread about an average value is
called the dispersion, or variation, of the data.
Various measures of this dispersion (or variation) are available, the most
common-
1. Range,
2. Interquartile Distance(IQD),
3. Variance
4. Standard deviation.
40.
DEPARTMENT OF INFORMATIONTECHNOLOGY, SCOE,KOPARGAON
Measures of variation
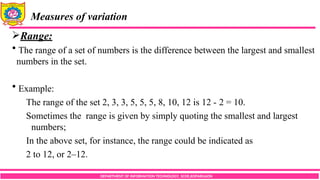
Range:
The range of a set of numbers is the difference between the largest and smallest
numbers in the set.
Example:
The range of the set 2, 3, 3, 5, 5, 5, 8, 10, 12 is 12 - 2 = 10.
Sometimes the range is given by simply quoting the smallest and largest
numbers;
In the above set, for instance, the range could be indicated as
2 to 12, or 2–12.
41.
DEPARTMENT OF INFORMATIONTECHNOLOGY, SCOE,KOPARGAON
Measures of variation
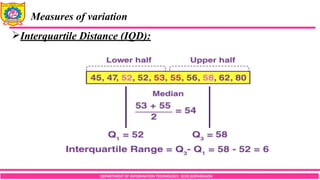
Interquartile Distance (IQD):
The midpoint of data distribution, or the middle of your four quartiles, is
referred to as the interquartile range (IQR), which is in the middle of the lower
and upper quartiles.
The IQD is a measurement of how evenly the data is distributed around the
average.
The formula for Interquartile Range is given below:
Interquartile Distance(IQD)= 3 − 1
𝑄 𝑄
The IQD is a useful measure for identifying outliers in data,
42.
DEPARTMENT OF INFORMATIONTECHNOLOGY, SCOE,KOPARGAON
Measures of variation
Interquartile Distance (IQD):
43.
DEPARTMENT OF INFORMATIONTECHNOLOGY, SCOE,KOPARGAON
Measures of variation
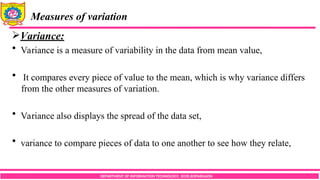
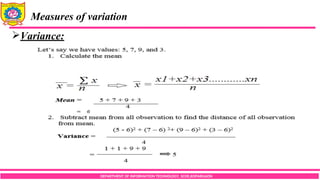
Variance:
Variance is a measure of variability in the data from mean value,
It compares every piece of value to the mean, which is why variance differs
from the other measures of variation.
Variance also displays the spread of the data set,
variance to compare pieces of data to one another to see how they relate,
DEPARTMENT OF INFORMATIONTECHNOLOGY, SCOE,KOPARGAON
Measures of variation
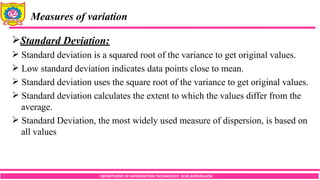
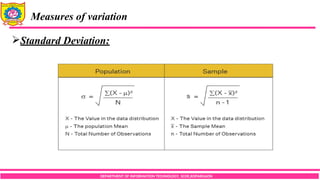
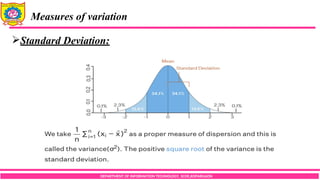
Standard Deviation:
Standard deviation is a squared root of the variance to get original values.
Low standard deviation indicates data points close to mean.
Standard deviation uses the square root of the variance to get original values.
Standard deviation calculates the extent to which the values differ from the
average.
Standard Deviation, the most widely used measure of dispersion, is based on
all values
DEPARTMENT OF INFORMATIONTECHNOLOGY, SCOE,KOPARGAON
Measures of variation
Standard Deviation:
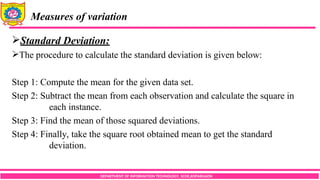
The procedure to calculate the standard deviation is given below:
Step 1: Compute the mean for the given data set.
Step 2: Subtract the mean from each observation and calculate the square in
each instance.
Step 3: Find the mean of those squared deviations.
Step 4: Finally, take the square root obtained mean to get the standard
deviation.
DEPARTMENT OF INFORMATIONTECHNOLOGY, SCOE,KOPARGAON
Measures of Shape
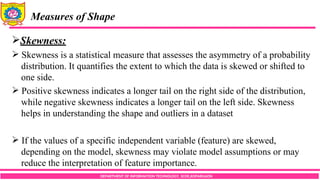
Skewness:
Skewness is a statistical measure that assesses the asymmetry of a probability
distribution. It quantifies the extent to which the data is skewed or shifted to
one side.
Positive skewness indicates a longer tail on the right side of the distribution,
while negative skewness indicates a longer tail on the left side. Skewness
helps in understanding the shape and outliers in a dataset
If the values of a specific independent variable (feature) are skewed,
depending on the model, skewness may violate model assumptions or may
reduce the interpretation of feature importance.
52.
DEPARTMENT OF INFORMATIONTECHNOLOGY, SCOE,KOPARGAON
Measures of Shape
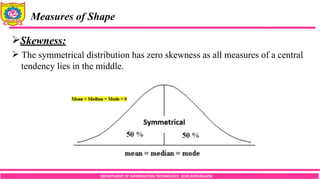
Skewness:
The symmetrical distribution has zero skewness as all measures of a central
tendency lies in the middle.
53.
DEPARTMENT OF INFORMATIONTECHNOLOGY, SCOE,KOPARGAON
Measures of Shape
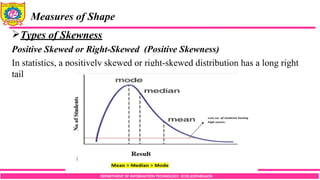
Types of Skewness
Positive Skewed or Right-Skewed (Positive Skewness)
In statistics, a positively skewed or right-skewed distribution has a long right
tail
54.
DEPARTMENT OF INFORMATIONTECHNOLOGY, SCOE,KOPARGAON
Measures of Shape
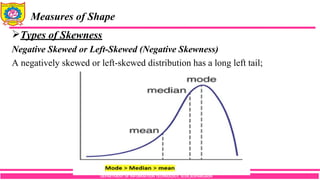
Types of Skewness
Negative Skewed or Left-Skewed (Negative Skewness)
A negatively skewed or left-skewed distribution has a long left tail;
55.
DEPARTMENT OF INFORMATIONTECHNOLOGY, SCOE,KOPARGAON
Measures of Shape
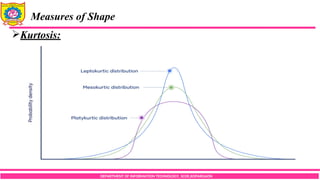
Kurtosis:
The excess kurtosis is used in statistics and probability theory to compare the
kurtosis coefficient with that normal distribution.
Excess kurtosis can be positive (Leptokurtic distribution), negative
(Platykurtic distribution), or near zero (Mesokurtic distribution),
Leptokurtic or heavy-tailed distribution (kurtosis more than normal
distribution).
Mesokurtic (kurtosis same as the normal distribution).
Platykurtic or short-tailed distribution (kurtosis less than normal distribution)


![2. Numerical Descriptive Measures[1].pdf](https://cdn.slidesharecdn.com/ss_thumbnails/2-241121070922-5ee24598-thumbnail.jpg?width=640&height=640&fit=bounds)


