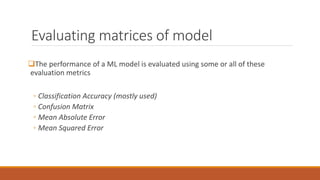
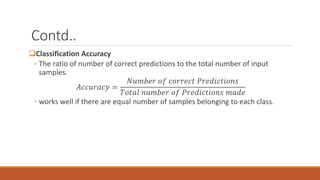
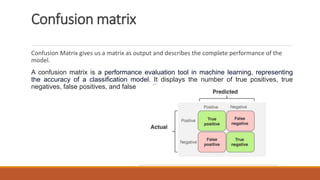
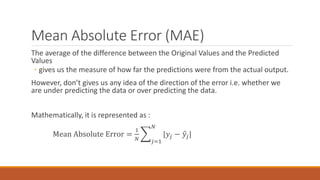
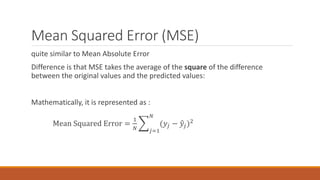
Machine Learning
LECTURE – 06
MACHINE LEARNING MODEL
EVALUATION
Outline
◦ Performance Measure Parameters
◦ Classification Accuracy (mostly used)
◦ Error Rate
◦ Precision
◦ Recall
◦ Confusion Matrix/ Contingency Table
◦ Mean Absolute Error
◦ Mean Squared Error
Evaluating matrices of model
The performance of a ML model is evaluated using some or all of these
evaluation metrics
◦ Classification Accuracy (mostly used)
◦ Confusion Matrix
◦ Mean Absolute Error
◦ Mean Squared Error
Contd..
Classification Accuracy
◦ The ratio of number of correct predictions to the total number of input
samples.
𝐴𝑐𝑐𝑢𝑟𝑎𝑐𝑦 =
𝑁𝑢𝑚𝑏𝑒𝑟 𝑜𝑓 𝑐𝑜𝑟𝑟𝑒𝑐𝑡 𝑃𝑟𝑒𝑑𝑖𝑐𝑡𝑖𝑜𝑛𝑠
𝑇𝑜𝑡𝑎𝑙 𝑛𝑢𝑚𝑏𝑒𝑟 𝑜𝑓 𝑃𝑟𝑒𝑑𝑖𝑐𝑡𝑖𝑜𝑛𝑠 𝑚𝑎𝑑𝑒
◦ works well if there are equal number of samples belonging to each class.
Confusion matrix
Confusion Matrix gives us a matrix as output and describes the complete performance of the
model.
A confusion matrix is a performance evaluation tool in machine learning, representing
the accuracy of a classification model. It displays the number of true positives, true
negatives, false positives, and false negatives.
Confusion Matrix
Lets assume we have a binary classification problem. We have some samples
belonging to two classes : YES or NO. Also, we have our own classifier which
predicts a class for a given input sample.
On testing our model on 165 samples ,we get the following result:
Yes-> Patient
No-> No Disease
Total Predictions= 165
Yes=110 times
No= 55 times
Actual:
Yes =105 times
No = 60 times
Contd..
There are 4 important terms :
◦ True Positives : The cases in which we predicted YES and the actual output was also
YES.
◦ True Negatives : The cases in which we predicted NO and the actual output was NO.
◦ False Positives : The cases in which we predicted YES and the actual output was NO.
◦ False Negatives : The cases in which we predicted NO and the actual output was YES.
Computations from confusion matrix
List of rates that are often computed from a confusion matrix for a binary classifier:
Accuracy: Overall, how often is the classifier correct?
𝐴𝑐𝑐𝑢𝑟𝑎𝑐𝑦 =
𝑇𝑃+𝑇𝑁
𝑇𝑜𝑡𝑎𝑙 𝑛𝑢𝑚𝑏𝑒𝑟 𝑜𝑓 𝑃𝑟𝑒𝑑𝑖𝑐𝑡𝑖𝑜𝑛𝑠 𝑚𝑎𝑑𝑒
or
𝑇𝑃+𝑇𝑁
𝑇𝑃+𝑇𝑁+𝐹𝑃+𝐹𝑁
𝐴𝑐𝑐𝑢𝑟𝑎𝑐𝑦 =
100 + 50
165
= 0.91
Misclassification Rate (Error Rate): Overall, how often is it wrong?
𝐸𝑟𝑟𝑜𝑟 𝑟𝑎𝑡𝑒 =
𝐹𝑃+𝐹𝑁
𝑇𝑜𝑡𝑎𝑙 𝑛𝑢𝑚𝑏𝑒𝑟 𝑜𝑓 𝑃𝑟𝑒𝑑𝑖𝑐𝑡𝑖𝑜𝑛𝑠 𝑚𝑎𝑑𝑒
or
𝐹𝑃+𝐹𝑁
𝑇𝑃+𝑇𝑁+𝐹𝑃+𝐹𝑁
𝐸𝑟𝑟𝑜𝑟 𝑟𝑎𝑡𝑒 =
10 + 5
165
= 0.09 i. e. 1 minus Accuracy
In this example, Accuracy = (55 + 30)/(55 + 5 + 30 + 10 ) =
0.85
Is accuracy the best measure?
Accuracy may not be a good measure if the dataset is not balanced (both negative and positive
classes have different number of data instances).
In this example, TN = 90, FP = 0, FN = 10 and TP = 0. The confusion matrix is as follows.
Accuracy in this case will be (90 + 0)/(100) = 0.9 and in
percentage the accuracy is 90 %.
The accuracy, in this case, is 90 % but this model is very
poor because all the 10 people who are unhealthy are
classified as healthy.
By this example what we are trying to say is that accuracy
is not a good metric when the data set is unbalanced. Using
accuracy in such scenarios can result in misleading
interpretation of results.
Precision and Recall
Precision and recall are metrics used to evaluate the performance of machine learning
models and classification models.
Precision: Out of all the examples that predicted as positive, how many are
really positive? Precision measures the accuracy of positive predictions. Within
a given set of positively-labeled results, the fraction that were true positives =
TP/(TP+ FP)
Recall: Out of all the positive examples, how many are predicted as positive?
Recall measures the completeness of positive predictions.
Recall is also known as sensitivity or true positive rate Given a set of positively-
labeled results, the fraction of all positives that were retrieved = TP/(TP + FN)
F1-score
F1 score computes the average of precision and recall, where the relative
contribution of both of these metrics are equal to F1 score. The best value of F1
score is 1 and the worst is 0. What does this mean? This means a perfect model
will have a F1 score of 1 – all of the predictions were correct.
In this example, Accuracy = (55 + 30)/(55 + 5 + 30 + 10 ) =
0.85
precision = 30/(30+ 5) = 0.857
Recall = 30/(30+ 10) = 0.75
F1 Score = 2* ( 0.857 * 0.75)/(0.857 + 0.75) = 0.799
Mean Absolute Error (MAE)
The average of the difference between the Original Values and the Predicted
Values
◦ gives us the measure of how far the predictions were from the actual output.
However, don’t gives us any idea of the direction of the error i.e. whether we
are under predicting the data or over predicting the data.
Mathematically, it is represented as :
Mean Absolute Error =
1
𝑁 𝑗=1
𝑁
|𝑦𝑗 − 𝑦𝑗|
Mean Squared Error (MSE)
quite similar to Mean Absolute Error
Difference is that MSE takes the average of the square of the difference
between the original values and the predicted values:
Mathematically, it is represented as :
Mean Squared Error =
1
𝑁 𝑗=1
𝑁
(𝑦𝑗 − 𝑦𝑗)2
END

MACHINE LEARNING PPT K MEANS CLUSTERING.

  • 1.
    Machine Learning LECTURE –06 MACHINE LEARNING MODEL EVALUATION
  • 2.
    Outline ◦ Performance MeasureParameters ◦ Classification Accuracy (mostly used) ◦ Error Rate ◦ Precision ◦ Recall ◦ Confusion Matrix/ Contingency Table ◦ Mean Absolute Error ◦ Mean Squared Error
  • 3.
    Evaluating matrices ofmodel The performance of a ML model is evaluated using some or all of these evaluation metrics ◦ Classification Accuracy (mostly used) ◦ Confusion Matrix ◦ Mean Absolute Error ◦ Mean Squared Error
  • 4.
    Contd.. Classification Accuracy ◦ Theratio of number of correct predictions to the total number of input samples. 𝐴𝑐𝑐𝑢𝑟𝑎𝑐𝑦 = 𝑁𝑢𝑚𝑏𝑒𝑟 𝑜𝑓 𝑐𝑜𝑟𝑟𝑒𝑐𝑡 𝑃𝑟𝑒𝑑𝑖𝑐𝑡𝑖𝑜𝑛𝑠 𝑇𝑜𝑡𝑎𝑙 𝑛𝑢𝑚𝑏𝑒𝑟 𝑜𝑓 𝑃𝑟𝑒𝑑𝑖𝑐𝑡𝑖𝑜𝑛𝑠 𝑚𝑎𝑑𝑒 ◦ works well if there are equal number of samples belonging to each class.
  • 5.
    Confusion matrix Confusion Matrixgives us a matrix as output and describes the complete performance of the model. A confusion matrix is a performance evaluation tool in machine learning, representing the accuracy of a classification model. It displays the number of true positives, true negatives, false positives, and false negatives.
  • 7.
    Confusion Matrix Lets assumewe have a binary classification problem. We have some samples belonging to two classes : YES or NO. Also, we have our own classifier which predicts a class for a given input sample. On testing our model on 165 samples ,we get the following result: Yes-> Patient No-> No Disease Total Predictions= 165 Yes=110 times No= 55 times Actual: Yes =105 times No = 60 times
  • 8.
    Contd.. There are 4important terms : ◦ True Positives : The cases in which we predicted YES and the actual output was also YES. ◦ True Negatives : The cases in which we predicted NO and the actual output was NO. ◦ False Positives : The cases in which we predicted YES and the actual output was NO. ◦ False Negatives : The cases in which we predicted NO and the actual output was YES.
  • 9.
    Computations from confusionmatrix List of rates that are often computed from a confusion matrix for a binary classifier: Accuracy: Overall, how often is the classifier correct? 𝐴𝑐𝑐𝑢𝑟𝑎𝑐𝑦 = 𝑇𝑃+𝑇𝑁 𝑇𝑜𝑡𝑎𝑙 𝑛𝑢𝑚𝑏𝑒𝑟 𝑜𝑓 𝑃𝑟𝑒𝑑𝑖𝑐𝑡𝑖𝑜𝑛𝑠 𝑚𝑎𝑑𝑒 or 𝑇𝑃+𝑇𝑁 𝑇𝑃+𝑇𝑁+𝐹𝑃+𝐹𝑁 𝐴𝑐𝑐𝑢𝑟𝑎𝑐𝑦 = 100 + 50 165 = 0.91 Misclassification Rate (Error Rate): Overall, how often is it wrong? 𝐸𝑟𝑟𝑜𝑟 𝑟𝑎𝑡𝑒 = 𝐹𝑃+𝐹𝑁 𝑇𝑜𝑡𝑎𝑙 𝑛𝑢𝑚𝑏𝑒𝑟 𝑜𝑓 𝑃𝑟𝑒𝑑𝑖𝑐𝑡𝑖𝑜𝑛𝑠 𝑚𝑎𝑑𝑒 or 𝐹𝑃+𝐹𝑁 𝑇𝑃+𝑇𝑁+𝐹𝑃+𝐹𝑁 𝐸𝑟𝑟𝑜𝑟 𝑟𝑎𝑡𝑒 = 10 + 5 165 = 0.09 i. e. 1 minus Accuracy
  • 10.
    In this example,Accuracy = (55 + 30)/(55 + 5 + 30 + 10 ) = 0.85
  • 11.
    Is accuracy thebest measure? Accuracy may not be a good measure if the dataset is not balanced (both negative and positive classes have different number of data instances). In this example, TN = 90, FP = 0, FN = 10 and TP = 0. The confusion matrix is as follows. Accuracy in this case will be (90 + 0)/(100) = 0.9 and in percentage the accuracy is 90 %. The accuracy, in this case, is 90 % but this model is very poor because all the 10 people who are unhealthy are classified as healthy. By this example what we are trying to say is that accuracy is not a good metric when the data set is unbalanced. Using accuracy in such scenarios can result in misleading interpretation of results.
  • 12.
    Precision and Recall Precisionand recall are metrics used to evaluate the performance of machine learning models and classification models. Precision: Out of all the examples that predicted as positive, how many are really positive? Precision measures the accuracy of positive predictions. Within a given set of positively-labeled results, the fraction that were true positives = TP/(TP+ FP) Recall: Out of all the positive examples, how many are predicted as positive? Recall measures the completeness of positive predictions. Recall is also known as sensitivity or true positive rate Given a set of positively- labeled results, the fraction of all positives that were retrieved = TP/(TP + FN)
  • 13.
    F1-score F1 score computesthe average of precision and recall, where the relative contribution of both of these metrics are equal to F1 score. The best value of F1 score is 1 and the worst is 0. What does this mean? This means a perfect model will have a F1 score of 1 – all of the predictions were correct.
  • 14.
    In this example,Accuracy = (55 + 30)/(55 + 5 + 30 + 10 ) = 0.85 precision = 30/(30+ 5) = 0.857 Recall = 30/(30+ 10) = 0.75 F1 Score = 2* ( 0.857 * 0.75)/(0.857 + 0.75) = 0.799
  • 15.
    Mean Absolute Error(MAE) The average of the difference between the Original Values and the Predicted Values ◦ gives us the measure of how far the predictions were from the actual output. However, don’t gives us any idea of the direction of the error i.e. whether we are under predicting the data or over predicting the data. Mathematically, it is represented as : Mean Absolute Error = 1 𝑁 𝑗=1 𝑁 |𝑦𝑗 − 𝑦𝑗|
  • 16.
    Mean Squared Error(MSE) quite similar to Mean Absolute Error Difference is that MSE takes the average of the square of the difference between the original values and the predicted values: Mathematically, it is represented as : Mean Squared Error = 1 𝑁 𝑗=1 𝑁 (𝑦𝑗 − 𝑦𝑗)2
  • 17.