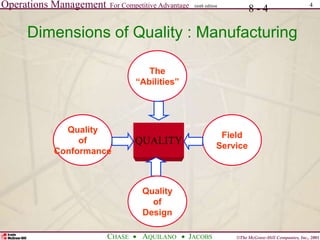
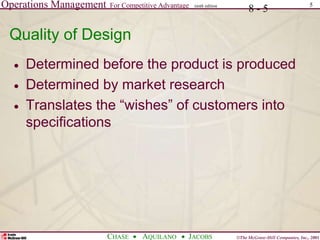
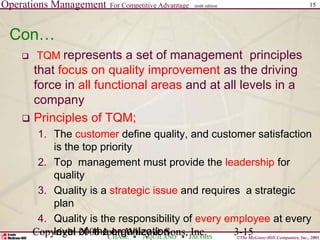
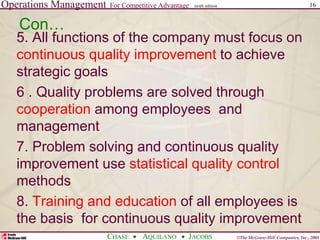
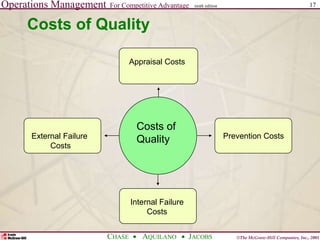
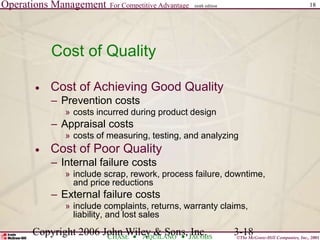
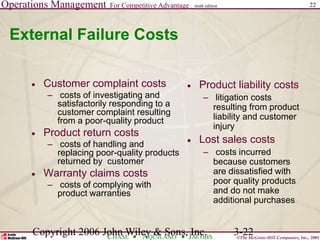
Operations Management For Competitive Advantage
©The McGraw-Hill Companies, Inc., 2001
CHASE AQUILANO JACOBS
ninth edition 1
Quality Management and Control
Kahsu Mebrahtu(Asst. Prof.)
Mekelle University
College of Business and Economics
Department of Management
Postgraduate Program(MBA)
ninth edition
Chapter 3
Operations Management For Competitive Advantage
©The McGraw-Hill Companies, Inc., 2001
CHASE AQUILANO JACOBS
ninth edition 2
8 - 2
What is Quality?
Quality is like beauty !!!
Meeting, or exceeding, customer
requirements now and in the future.
 Quality is the totality of features and
characteristics of a product or service
that bears on its ability to satisfy given
needs.
Operations Management For Competitive Advantage
©The McGraw-Hill Companies, Inc., 2001
CHASE AQUILANO JACOBS
ninth edition 3
Copyright 2006 John Wiley & Sons, Inc. 3-3
Meaning of Quality:
Consumer’s Perspective
 Fitness for use
 how well product or
service does what it is
supposed to
 Quality of design
 designing quality
characteristics into a
product or service
 A Mercedes and a Ford are
equally “fit for use,” but with
different design dimensions
Operations Management For Competitive Advantage
©The McGraw-Hill Companies, Inc., 2001
CHASE AQUILANO JACOBS
ninth edition 4
8 - 4
Dimensions of Quality : Manufacturing
QUALITY
Quality
of
Conformance
Field
Service
The
“Abilities”
Quality
of
Design
Operations Management For Competitive Advantage
©The McGraw-Hill Companies, Inc., 2001
CHASE AQUILANO JACOBS
ninth edition 5
8 - 5
Quality of Design
 Determined before the product is produced
 Determined by market research
 Translates the “wishes” of customers into
specifications
Operations Management For Competitive Advantage
©The McGraw-Hill Companies, Inc., 2001
CHASE AQUILANO JACOBS
ninth edition 6
8 - 6
Quality of Conformance
Producing a product that meets the
specifications
Operations Management For Competitive Advantage
©The McGraw-Hill Companies, Inc., 2001
CHASE AQUILANO JACOBS
ninth edition 7
8 - 7
Abilities
 Availability (Continuity of service to customers)
 Reliability (Length of time that a product can be used
before it fails)
 Maintainability (Restoration of the product or service
once it has failed)
Operations Management For Competitive Advantage
©The McGraw-Hill Companies, Inc., 2001
CHASE AQUILANO JACOBS
ninth edition 8
Dimensions of Quality: Services
 1. Time and Timelines: How long must a
customer wait for service and is it completed
on time ?
 2. Completeness: Is everything the customer
asked for provided?
 3. Courtesy: How are customers treated by
employees?
 4. Consistency
 is same level of service provided to each
customer each time?
Operations Management For Competitive Advantage
©The McGraw-Hill Companies, Inc., 2001
CHASE AQUILANO JACOBS
ninth edition 9
Copyright 2006 John Wiley & Sons, Inc. 3-9
 Accessibility and convenience
 how easy is it to obtain service?
 does service representative answer you calls quickly?
 Accuracy
 is service performed right every time?
 is your bank or credit card statement correct every
month?
 Responsiveness
 how well does company react to unusual situations?
 how well is a telephone operator at able to respond to a
customer’s questions?
Dimensions of Quality:
Service (cont.)
Operations Management For Competitive Advantage
©The McGraw-Hill Companies, Inc., 2001
CHASE AQUILANO JACOBS
ninth edition 10
Copyright 2006 John Wiley & Sons, Inc. 3-10
Meaning of Quality:
Producer’s Perspective
 Quality of conformance
 Making sure product or service is produced
according to design
 if new tires do not conform to specifications, y
wobble
 if a hotel room is not clean when a guest checks
in, hotel is not functioning according to
specifications of its design
Operations Management For Competitive Advantage
©The McGraw-Hill Companies, Inc., 2001
CHASE AQUILANO JACOBS
ninth edition 11
Copyright 2006 John Wiley & Sons, Inc. 3-11
Meaning of Quality:
A Final Perspective
 Consumer’s and producer’s
perspectives depend on each other
 Consumer’s perspective: PRICE
 Producer’s perspective: COST
 Consumer’s view must dominate
Operations Management For Competitive Advantage
©The McGraw-Hill Companies, Inc., 2001
CHASE AQUILANO JACOBS
ninth edition 12
Copyright 2006 John Wiley & Sons, Inc. 3-12
Fitness for
Consumer Use
Producer’s Perspective Consumer’s Perspective
Quality of Conformance
• Conformance to
specifications
• Cost
Quality of Design
• Quality characteristics
• Price
Marketing
Production
Meaning of Quality
The Meaning of Quality
Operations Management For Competitive Advantage
©The McGraw-Hill Companies, Inc., 2001
CHASE AQUILANO JACOBS
ninth edition 13
8 - 13
The Quality Cycle
MARKETING
Interprets customer needs
Works with customer to
design product to fit
operations
Interpretation of needs
CUSTOMER
Specifies quality needs
Needs
OPERATIONS
Produces the product or
services
QUALITY CONTROL
Plans and monitors
quality
Product
ENGINEERING
Defines design concept
Prepares specifications
Define quality
characteristics
Specifications
Operations Management For Competitive Advantage
©The McGraw-Hill Companies, Inc., 2001
CHASE AQUILANO JACOBS
ninth edition 14
Total Quality Management (TQM)
Defined
 Total quality management is defined as
managing the entire organization so that it
excels on all dimensions of products and
services that are important to the customer.
Operations Management For Competitive Advantage
©The McGraw-Hill Companies, Inc., 2001
CHASE AQUILANO JACOBS
ninth edition 15
Copyright 2006 John Wiley & Sons, Inc. 3-15
Con…
 TQM represents a set of management principles
that focus on quality improvement as the driving
force in all functional areas and at all levels in a
company
 Principles of TQM;
1. The customer define quality, and customer satisfaction
is the top priority
2. Top management must provide the leadership for
quality
3. Quality is a strategic issue and requires a strategic
plan
4. Quality is the responsibility of every employee at every
level of the organization
Operations Management For Competitive Advantage
©The McGraw-Hill Companies, Inc., 2001
CHASE AQUILANO JACOBS
ninth edition 16
Con…
5. All functions of the company must focus on
continuous quality improvement to achieve
strategic goals
6 . Quality problems are solved through
cooperation among employees and
management
7. Problem solving and continuous quality
improvement use statistical quality control
methods
8. Training and education of all employees is
the basis for continuous quality improvement
Operations Management For Competitive Advantage
©The McGraw-Hill Companies, Inc., 2001
CHASE AQUILANO JACOBS
ninth edition 17
Costs of Quality
External Failure
Costs
Appraisal Costs
Prevention Costs
Internal Failure
Costs
Costs of
Quality
Operations Management For Competitive Advantage
©The McGraw-Hill Companies, Inc., 2001
CHASE AQUILANO JACOBS
ninth edition 18
Copyright 2006 John Wiley & Sons, Inc. 3-18
Cost of Quality
 Cost of Achieving Good Quality
– Prevention costs
» costs incurred during product design
– Appraisal costs
» costs of measuring, testing, and analyzing
 Cost of Poor Quality
– Internal failure costs
» include scrap, rework, process failure, downtime,
and price reductions
– External failure costs
» include complaints, returns, warranty claims,
liability, and lost sales
Operations Management For Competitive Advantage
©The McGraw-Hill Companies, Inc., 2001
CHASE AQUILANO JACOBS
ninth edition 19
Copyright 2006 John Wiley & Sons, Inc. 3-19
Prevention Costs
 Quality planning costs
– costs of developing and
implementing quality
management program
 Product-design costs
– costs of designing products
with quality characteristics
 Process costs
– costs expended to make
sure productive process
conforms to quality
specifications
 Training costs
– costs of developing and
putting on quality training
programs for employees and
management
 Information costs
– costs of acquiring and
maintaining data related to
quality, and development of
reports on quality
performance
Operations Management For Competitive Advantage
©The McGraw-Hill Companies, Inc., 2001
CHASE AQUILANO JACOBS
ninth edition 20
Copyright 2006 John Wiley & Sons, Inc. 3-20
Appraisal Costs
 Inspection and testing
– costs of testing and inspecting materials, parts, and
product at various stages and at end of process
 Test equipment costs
– costs of maintaining equipment used in testing
quality characteristics of products
 Operator costs
– costs of time spent by operators to gather data for
testing product quality, to make equipment
adjustments to maintain quality, and to stop work to
assess quality
Operations Management For Competitive Advantage
©The McGraw-Hill Companies, Inc., 2001
CHASE AQUILANO JACOBS
ninth edition 21
Copyright 2006 John Wiley & Sons, Inc. 3-21
Internal Failure Costs
 Scrap costs
– costs of poor-quality
products that must be
discarded, including labor,
material, and indirect costs
 Rework costs
– costs of fixing defective
products to conform to
quality specifications
 Process failure costs
– costs of determining why
production process is
producing poor-quality
products
 Process downtime costs
– costs of shutting down
productive process to fix
problem
 Price-downgrading costs
– costs of discounting poor-
quality products—that is,
selling products as “seconds”
Operations Management For Competitive Advantage
©The McGraw-Hill Companies, Inc., 2001
CHASE AQUILANO JACOBS
ninth edition 22
Copyright 2006 John Wiley & Sons, Inc. 3-22
External Failure Costs
 Customer complaint costs
– costs of investigating and
satisfactorily responding to a
customer complaint resulting
from a poor-quality product
 Product return costs
– costs of handling and
replacing poor-quality products
returned by customer
 Warranty claims costs
– costs of complying with
product warranties
 Product liability costs
– litigation costs
resulting from product
liability and customer
injury
 Lost sales costs
– costs incurred
because customers
are dissatisfied with
poor quality products
and do not make
additional purchases
Operations Management For Competitive Advantage
©The McGraw-Hill Companies, Inc., 2001
CHASE AQUILANO JACOBS
ninth edition 23
Benchmarking
1. Identify those processes needing
improvement.
2. Identify a firm that is the world leader in
performing the process.
3. Contact the managers of that company and
make a personal visit to interview managers
and workers.
4. Analyze data.
Operations Management For Competitive Advantage
©The McGraw-Hill Companies, Inc., 2001
CHASE AQUILANO JACOBS
ninth edition 24
PART II Statistical Quality Control
Operations Management For Competitive Advantage
©The McGraw-Hill Companies, Inc., 2001
CHASE AQUILANO JACOBS
ninth edition 25
9 -25
Designing of Quality Control Systems
 Processes and “internal customers.”
 “Critical points” and guidelines in identifying
them.
 Steps in designing QC systems.
Operations Management For Competitive Advantage
©The McGraw-Hill Companies, Inc., 2001
CHASE AQUILANO JACOBS
ninth edition 26
9 -26
Steps in Designing QC Systems
 Identify critical points
 Decide on the type of measurement
(variable versus attribute)
 Decide on the amount of inspection to be
used.
 Decide who should do the inspection
Operations Management For Competitive Advantage
©The McGraw-Hill Companies, Inc., 2001
CHASE AQUILANO JACOBS
ninth edition 27
9 -27
Process Quality Control
 Basic assumptions (tenets) of Process
Quality Control:
– Every process has random variation in it.
– Production processes are not usually found in a state of
control.
 “State of Control”; what does it mean?
Operations Management For Competitive Advantage
©The McGraw-Hill Companies, Inc., 2001
CHASE AQUILANO JACOBS
ninth edition 28
9 -28
Process Control Chart
x
y
Time
Upper control limit (UCL)
Center line (CL)
Lower control limit (LCL)
Average + 3
standard
deviations
Quality
measurement
average
Average - 3
standard
deviations
Operations Management For Competitive Advantage
©The McGraw-Hill Companies, Inc., 2001
CHASE AQUILANO JACOBS
ninth edition 29
9 -29
UCL
LCL
CL
1 2 3 4 5 6
Sample
Quality Control Chart
Stop the process; look for assignable cause
Operations Management For Competitive Advantage
©The McGraw-Hill Companies, Inc., 2001
CHASE AQUILANO JACOBS
ninth edition 30
Quality Measures: Attributes & Variables
 Attribute: is a product characteristics such as
color, surface texture, cleanliness, or smell or
taste
 Hence attributes can be evaluated as: good or
bad, acceptable or not, or yes or no
 A variable measure is a product characteristic
that is measured on a continuous scale such as
length h, temperature, or time
Operations Management For Competitive Advantage
©The McGraw-Hill Companies, Inc., 2001
CHASE AQUILANO JACOBS
ninth edition 31
Types of Statistical Sampling
 Attribute (Go or no-go information)
– Defectives refers to the acceptability of product
across a range of characteristics.
– Defects refers to the number of defects per unit
which may be higher than the number of
defectives.
– p-chart application
– C-chart
 Variable (Continuous)
– Usually measured by the mean and the standard
deviation.
– X-bar and R chart applications
Operations Management For Competitive Advantage
©The McGraw-Hill Companies, Inc., 2001
CHASE AQUILANO JACOBS
ninth edition 32
UCL
LCL
Samples
over time
1 2 3 4 5 6
UCL
LCL
Samples
over time
1 2 3 4 5 6
UCL
LCL
Samples
over time
1 2 3 4 5 6
Normal Behavior
Possible problem, investigate
Statistical Process Control
(SPC) Charts
Operations Management For Competitive Advantage
©The McGraw-Hill Companies, Inc., 2001
CHASE AQUILANO JACOBS
ninth edition 33
Control Limits
We establish the Upper Control Limits (UCL)
and the Lower Control Limits (LCL) with plus
or minus 3 standard deviations. Based on
this we can expect 99.7% of our sample
observations to fall within these limits.
x
LCL UCL
99.7%
Operations Management For Competitive Advantage
©The McGraw-Hill Companies, Inc., 2001
CHASE AQUILANO JACOBS
ninth edition 34
Copyright 2006 John Wiley & Sons, Inc. 4-34
Control Charts for
Attributes
 p-charts
 uses portion defective in a sample
 c-charts
 uses number of defects in an item
Operations Management For Competitive Advantage
©The McGraw-Hill Companies, Inc., 2001
CHASE AQUILANO JACOBS
ninth edition 35
Copyright 2006 John Wiley & Sons, Inc.
p-Chart
UCL = p + zp
LCL = p - zp
z = number of standard deviations from
process average
p = sample proportion defective; an estimate
of process average
p = standard deviation of sample proportion
p =
p(1 - p)
n
Operations Management For Competitive Advantage
©The McGraw-Hill Companies, Inc., 2001
CHASE AQUILANO JACOBS
ninth edition 36
Con…
p =
T otal N um b er of D efectives
T otal N um b er of O bservations
n
s
)
p
-
(1
p
=
p
Operations Management For Competitive Advantage
©The McGraw-Hill Companies, Inc., 2001
CHASE AQUILANO JACOBS
ninth edition 37
Copyright 2006 John Wiley & Sons, Inc. 4-37
p-Chart Example
20 samples of 100 pairs of jeans
NUMBER OF PROPORTION
SAMPLE DEFECTIVES DEFECTIVE
1 6 .06
2 0 .00
3 4 .04
: : :
: : :
20 18 .18
200
Operations Management For Competitive Advantage
©The McGraw-Hill Companies, Inc., 2001
CHASE AQUILANO JACOBS
ninth edition 38
Copyright 2006 John Wiley & Sons, Inc. 4-38
p-Chart Example (cont.)
UCL = p + z = 0.10 + 3
p(1 - p)
n
0.10(1 - 0.10)
100
UCL = 0.190
LCL = 0.010
LCL = p - z = 0.10 - 3
p(1 - p)
n
0.10(1 - 0.10)
100
= 200 / 20(100) = 0.10
total defectives
total sample observations
p =
Operations Management For Competitive Advantage
©The McGraw-Hill Companies, Inc., 2001
CHASE AQUILANO JACOBS
ninth edition 39
Copyright 2006 John Wiley & Sons, Inc. 4-39
0.02
0.04
0.06
0.08
0.10
0.12
0.14
0.16
0.18
0.20
Proportion
defective
Sample number
2 4 6 8 10 12 14 16 18 20
UCL = 0.190
LCL = 0.010
p = 0.10
p-Chart
Example
(cont.)
Operations Management For Competitive Advantage
©The McGraw-Hill Companies, Inc., 2001
CHASE AQUILANO JACOBS
ninth edition 40
Copyright 2006 John Wiley & Sons, Inc. 4-40
c-Chart
UCL = c + zc
LCL = c - zc
where
c = number of defects per sample
c = c
Operations Management For Competitive Advantage
©The McGraw-Hill Companies, Inc., 2001
CHASE AQUILANO JACOBS
ninth edition 41
Copyright 2006 John Wiley & Sons, Inc. 4-41
c-Chart (cont.)
Number of defects in 15 sample rooms
1 12
2 8
3 16
: :
: :
15 15
190
SAMPLE
c = = 12.67
190
15
UCL = c + zc
= 12.67 + 3 12.67
= 23.35
LCL = c + zc
= 12.67 - 3 12.67
= 1.99
NUMBER
OF
DEFECTS
Operations Management For Competitive Advantage
©The McGraw-Hill Companies, Inc., 2001
CHASE AQUILANO JACOBS
ninth edition 42
Copyright 2006 John Wiley & Sons, Inc. 4-42
3
6
9
12
15
18
21
24
Number
of
defects
Sample number
2 4 6 8 10 12 14 16
UCL = 23.35
LCL = 1.99
c = 12.67
c-Chart
(cont.)
Operations Management For Competitive Advantage
©The McGraw-Hill Companies, Inc., 2001
CHASE AQUILANO JACOBS
ninth edition 43
Copyright 2006 John Wiley & Sons, Inc. 4-43
Control Charts for
Variables
 Mean chart ( x -Chart )
 uses average of a sample
 Range chart ( R-Chart )
 uses amount of dispersion in a
sample
Operations Management For Competitive Advantage
©The McGraw-Hill Companies, Inc., 2001
CHASE AQUILANO JACOBS
ninth edition 44
Copyright 2006 John Wiley & Sons, Inc. 4-44
x-bar Chart
x =
x1 + x2 + ... xk
k
=
UCL = x + A2R LCL = x - A2R
= =
where
x = average of sample means
=
Operations Management For Competitive Advantage
©The McGraw-Hill Companies, Inc., 2001
CHASE AQUILANO JACOBS
ninth edition 45
Copyright 2006 John Wiley & Sons, Inc. 4-45
x-bar Chart Example
Example 15.4
OBSERVATIONS (SLIP- RING DIAMETER, CM)
SAMPLE k 1 2 3 4 5 x R
1 5.02 5.01 4.94 4.99 4.96 4.98 0.08
2 5.01 5.03 5.07 4.95 4.96 5.00 0.12
3 4.99 5.00 4.93 4.92 4.99 4.97 0.08
4 5.03 4.91 5.01 4.98 4.89 4.96 0.14
5 4.95 4.92 5.03 5.05 5.01 4.99 0.13
6 4.97 5.06 5.06 4.96 5.03 5.01 0.10
7 5.05 5.01 5.10 4.96 4.99 5.02 0.14
8 5.09 5.10 5.00 4.99 5.08 5.05 0.11
9 5.14 5.10 4.99 5.08 5.09 5.08 0.15
10 5.01 4.98 5.08 5.07 4.99 5.03 0.10
50.09 1.15
Operations Management For Competitive Advantage
©The McGraw-Hill Companies, Inc., 2001
CHASE AQUILANO JACOBS
ninth edition 46
Copyright 2006 John Wiley & Sons, Inc. 4-46
UCL = x + A2R = 5.01 + (0.58)(0.115) = 5.08
LCL = x - A2R = 5.01 - (0.58)(0.115) = 4.94
=
=
x = = = 5.01 cm
= x
k
50.09
10
x- bar Chart
Example (cont.)
Retrieve Factor Value A2
Operations Management For Competitive Advantage
©The McGraw-Hill Companies, Inc., 2001
CHASE AQUILANO JACOBS
ninth edition 47
Copyright 2006 John Wiley & Sons, Inc. 4-47
x- bar
Chart
Example
(cont.)
UCL = 5.08
LCL = 4.94
Mean
Sample number
|
1
|
2
|
3
|
4
|
5
|
6
|
7
|
8
|
9
|
10
5.10 –
5.08 –
5.06 –
5.04 –
5.02 –
5.00 –
4.98 –
4.96 –
4.94 –
4.92 –
x = 5.01
=
Operations Management For Competitive Advantage
©The McGraw-Hill Companies, Inc., 2001
CHASE AQUILANO JACOBS
ninth edition 48
Copyright 2006 John Wiley & Sons, Inc. 4-48
R- Chart
UCL = D4R LCL = D3R
R =
R
k
where
R = range of each sample
k = number of samples
Operations Management For Competitive Advantage
©The McGraw-Hill Companies, Inc., 2001
CHASE AQUILANO JACOBS
ninth edition 49
Copyright 2006 John Wiley & Sons, Inc. 4-49
R-Chart Example
OBSERVATIONS (SLIP-RING DIAMETER, CM)
SAMPLE k 1 2 3 4 5 x R
1 5.02 5.01 4.94 4.99 4.96 4.98 0.08
2 5.01 5.03 5.07 4.95 4.96 5.00 0.12
3 4.99 5.00 4.93 4.92 4.99 4.97 0.08
4 5.03 4.91 5.01 4.98 4.89 4.96 0.14
5 4.95 4.92 5.03 5.05 5.01 4.99 0.13
6 4.97 5.06 5.06 4.96 5.03 5.01 0.10
7 5.05 5.01 5.10 4.96 4.99 5.02 0.14
8 5.09 5.10 5.00 4.99 5.08 5.05 0.11
9 5.14 5.10 4.99 5.08 5.09 5.08 0.15
10 5.01 4.98 5.08 5.07 4.99 5.03 0.10
50.09 1.15
Example 15.3
Operations Management For Competitive Advantage
©The McGraw-Hill Companies, Inc., 2001
CHASE AQUILANO JACOBS
ninth edition 50
Copyright 2006 John Wiley & Sons, Inc. 4-50
R-Chart Example (cont.)
Example 15.3
R
k
R = = = 0.115
1.15
10
UCL = D4R = 2.11(0.115) = 0.243
LCL = D3R = 0(0.115) = 0
Retrieve Factor Values D3 and D4
Operations Management For Competitive Advantage
©The McGraw-Hill Companies, Inc., 2001
CHASE AQUILANO JACOBS
ninth edition 51
Copyright 2006 John Wiley & Sons, Inc. 4-51
R-Chart Example (cont.)
UCL = 0.243
LCL = 0
Range
Sample number
R = 0.115
|
1
|
2
|
3
|
4
|
5
|
6
|
7
|
8
|
9
|
10
0.28 –
0.24 –
0.20 –
0.16 –
0.12 –
0.08 –
0.04 –
0 –
Operations Management For Competitive Advantage
©The McGraw-Hill Companies, Inc., 2001
CHASE AQUILANO JACOBS
ninth edition 52
Copyright 2006 John Wiley & Sons, Inc. 4-52
Fac
tors
n A2 D3 D4
SAMPLE SIZE FACTOR FOR x-CHART FACTORS FOR R-CHART
2 1.88 0.00 3.27
3 1.02 0.00 2.57
4 0.73 0.00 2.28
5 0.58 0.00 2.11
6 0.48 0.00 2.00
7 0.42 0.08 1.92
8 0.37 0.14 1.86
9 0.44 0.18 1.82
10 0.11 0.22 1.78
11 0.99 0.26 1.74
12 0.77 0.28 1.72
13 0.55 0.31 1.69
14 0.44 0.33 1.67
15 0.22 0.35 1.65
16 0.11 0.36 1.64
17 0.00 0.38 1.62
18 0.99 0.39 1.61
19 0.99 0.40 1.61
20 0.88 0.41 1.59
Appendix:
Determining Control Limits for x-bar and R-Charts
Return
Operations Management For Competitive Advantage
©The McGraw-Hill Companies, Inc., 2001
CHASE AQUILANO JACOBS
ninth edition 53
9 -53
Continuous Improvement
 Pareto analysis
 Cause-and-effect (fish-bone) diagrams
 Process capability charts
Operations Management For Competitive Advantage
©The McGraw-Hill Companies, Inc., 2001
CHASE AQUILANO JACOBS
ninth edition 54
CHECK SHEETS
Used to keep a record
of the number and type
of discontinuities over a
specified period of time
or within a certain
batch of product.
PARETO CHART
A graphical representation ranking
discontinuities from the most to
least significant. Used to help
brainstorm what discontinuities, if
worked upon first, would be the
most likely to produce the greatest
improvement in quality.
Class Example
Our manufacturing procedure is composed of several steps. Several of these
procedures have lead to discontinuities noticed upon inspection. The steps causing
defectives are as follows:
 Caulking 198 defectives
 Fitting 25 defectives
 Connections 103 defectives
 Torque 18 defectives
 Gapping 72 defective
A Pareto Diagram will be developed.
Operations Management For Competitive Advantage
©The McGraw-Hill Companies, Inc., 2001
CHASE AQUILANO JACOBS
ninth edition 55
Operations Management For Competitive Advantage
©The McGraw-Hill Companies, Inc., 2001
CHASE AQUILANO JACOBS
ninth edition 56
Operations Management For Competitive Advantage
©The McGraw-Hill Companies, Inc., 2001
CHASE AQUILANO JACOBS
ninth edition 57
CAUSE AND EFFECT DIAGRAMS (Fishbone Diagram)
Used in brainstorming session to help identify the causes of quality
losses. This diagram is particularly useful after the flow chart and
the Pareto diagrams have been developed.
QUALITY
(Effect)
Cause
Step 1:Decide on the quality characteristic {e.g. Reduction of
wobble during machine rotation}
Step 2:Set up the fish bone backbone
Step 3:Identify main factors causing effect {e.g. Workers,
Materials, Inspection, Tools}
Step 4: Add Cause to each branch
Operations Management For Competitive Advantage
©The McGraw-Hill Companies, Inc., 2001
CHASE AQUILANO JACOBS
ninth edition 58
Operations Management For Competitive Advantage
©The McGraw-Hill Companies, Inc., 2001
CHASE AQUILANO JACOBS
ninth edition 59
Reading Assignment
1. Acceptance Sampling
2. Kaizen method of quality
management
3. Process Capability Index
4. ISO quality guidelines
5. The History of Total Quality
Management

CH-3 Quality management and Control.pptx

  • 1.
    Operations Management ForCompetitive Advantage ©The McGraw-Hill Companies, Inc., 2001 CHASE AQUILANO JACOBS ninth edition 1 Quality Management and Control Kahsu Mebrahtu(Asst. Prof.) Mekelle University College of Business and Economics Department of Management Postgraduate Program(MBA) ninth edition Chapter 3
  • 2.
    Operations Management ForCompetitive Advantage ©The McGraw-Hill Companies, Inc., 2001 CHASE AQUILANO JACOBS ninth edition 2 8 - 2 What is Quality? Quality is like beauty !!! Meeting, or exceeding, customer requirements now and in the future.  Quality is the totality of features and characteristics of a product or service that bears on its ability to satisfy given needs.
  • 3.
    Operations Management ForCompetitive Advantage ©The McGraw-Hill Companies, Inc., 2001 CHASE AQUILANO JACOBS ninth edition 3 Copyright 2006 John Wiley & Sons, Inc. 3-3 Meaning of Quality: Consumer’s Perspective  Fitness for use  how well product or service does what it is supposed to  Quality of design  designing quality characteristics into a product or service  A Mercedes and a Ford are equally “fit for use,” but with different design dimensions
  • 4.
    Operations Management ForCompetitive Advantage ©The McGraw-Hill Companies, Inc., 2001 CHASE AQUILANO JACOBS ninth edition 4 8 - 4 Dimensions of Quality : Manufacturing QUALITY Quality of Conformance Field Service The “Abilities” Quality of Design
  • 5.
    Operations Management ForCompetitive Advantage ©The McGraw-Hill Companies, Inc., 2001 CHASE AQUILANO JACOBS ninth edition 5 8 - 5 Quality of Design  Determined before the product is produced  Determined by market research  Translates the “wishes” of customers into specifications
  • 6.
    Operations Management ForCompetitive Advantage ©The McGraw-Hill Companies, Inc., 2001 CHASE AQUILANO JACOBS ninth edition 6 8 - 6 Quality of Conformance Producing a product that meets the specifications
  • 7.
    Operations Management ForCompetitive Advantage ©The McGraw-Hill Companies, Inc., 2001 CHASE AQUILANO JACOBS ninth edition 7 8 - 7 Abilities  Availability (Continuity of service to customers)  Reliability (Length of time that a product can be used before it fails)  Maintainability (Restoration of the product or service once it has failed)
  • 8.
    Operations Management ForCompetitive Advantage ©The McGraw-Hill Companies, Inc., 2001 CHASE AQUILANO JACOBS ninth edition 8 Dimensions of Quality: Services  1. Time and Timelines: How long must a customer wait for service and is it completed on time ?  2. Completeness: Is everything the customer asked for provided?  3. Courtesy: How are customers treated by employees?  4. Consistency  is same level of service provided to each customer each time?
  • 9.
    Operations Management ForCompetitive Advantage ©The McGraw-Hill Companies, Inc., 2001 CHASE AQUILANO JACOBS ninth edition 9 Copyright 2006 John Wiley & Sons, Inc. 3-9  Accessibility and convenience  how easy is it to obtain service?  does service representative answer you calls quickly?  Accuracy  is service performed right every time?  is your bank or credit card statement correct every month?  Responsiveness  how well does company react to unusual situations?  how well is a telephone operator at able to respond to a customer’s questions? Dimensions of Quality: Service (cont.)
  • 10.
    Operations Management ForCompetitive Advantage ©The McGraw-Hill Companies, Inc., 2001 CHASE AQUILANO JACOBS ninth edition 10 Copyright 2006 John Wiley & Sons, Inc. 3-10 Meaning of Quality: Producer’s Perspective  Quality of conformance  Making sure product or service is produced according to design  if new tires do not conform to specifications, y wobble  if a hotel room is not clean when a guest checks in, hotel is not functioning according to specifications of its design
  • 11.
    Operations Management ForCompetitive Advantage ©The McGraw-Hill Companies, Inc., 2001 CHASE AQUILANO JACOBS ninth edition 11 Copyright 2006 John Wiley & Sons, Inc. 3-11 Meaning of Quality: A Final Perspective  Consumer’s and producer’s perspectives depend on each other  Consumer’s perspective: PRICE  Producer’s perspective: COST  Consumer’s view must dominate
  • 12.
    Operations Management ForCompetitive Advantage ©The McGraw-Hill Companies, Inc., 2001 CHASE AQUILANO JACOBS ninth edition 12 Copyright 2006 John Wiley & Sons, Inc. 3-12 Fitness for Consumer Use Producer’s Perspective Consumer’s Perspective Quality of Conformance • Conformance to specifications • Cost Quality of Design • Quality characteristics • Price Marketing Production Meaning of Quality The Meaning of Quality
  • 13.
    Operations Management ForCompetitive Advantage ©The McGraw-Hill Companies, Inc., 2001 CHASE AQUILANO JACOBS ninth edition 13 8 - 13 The Quality Cycle MARKETING Interprets customer needs Works with customer to design product to fit operations Interpretation of needs CUSTOMER Specifies quality needs Needs OPERATIONS Produces the product or services QUALITY CONTROL Plans and monitors quality Product ENGINEERING Defines design concept Prepares specifications Define quality characteristics Specifications
  • 14.
    Operations Management ForCompetitive Advantage ©The McGraw-Hill Companies, Inc., 2001 CHASE AQUILANO JACOBS ninth edition 14 Total Quality Management (TQM) Defined  Total quality management is defined as managing the entire organization so that it excels on all dimensions of products and services that are important to the customer.
  • 15.
    Operations Management ForCompetitive Advantage ©The McGraw-Hill Companies, Inc., 2001 CHASE AQUILANO JACOBS ninth edition 15 Copyright 2006 John Wiley & Sons, Inc. 3-15 Con…  TQM represents a set of management principles that focus on quality improvement as the driving force in all functional areas and at all levels in a company  Principles of TQM; 1. The customer define quality, and customer satisfaction is the top priority 2. Top management must provide the leadership for quality 3. Quality is a strategic issue and requires a strategic plan 4. Quality is the responsibility of every employee at every level of the organization
  • 16.
    Operations Management ForCompetitive Advantage ©The McGraw-Hill Companies, Inc., 2001 CHASE AQUILANO JACOBS ninth edition 16 Con… 5. All functions of the company must focus on continuous quality improvement to achieve strategic goals 6 . Quality problems are solved through cooperation among employees and management 7. Problem solving and continuous quality improvement use statistical quality control methods 8. Training and education of all employees is the basis for continuous quality improvement
  • 17.
    Operations Management ForCompetitive Advantage ©The McGraw-Hill Companies, Inc., 2001 CHASE AQUILANO JACOBS ninth edition 17 Costs of Quality External Failure Costs Appraisal Costs Prevention Costs Internal Failure Costs Costs of Quality
  • 18.
    Operations Management ForCompetitive Advantage ©The McGraw-Hill Companies, Inc., 2001 CHASE AQUILANO JACOBS ninth edition 18 Copyright 2006 John Wiley & Sons, Inc. 3-18 Cost of Quality  Cost of Achieving Good Quality – Prevention costs » costs incurred during product design – Appraisal costs » costs of measuring, testing, and analyzing  Cost of Poor Quality – Internal failure costs » include scrap, rework, process failure, downtime, and price reductions – External failure costs » include complaints, returns, warranty claims, liability, and lost sales
  • 19.
    Operations Management ForCompetitive Advantage ©The McGraw-Hill Companies, Inc., 2001 CHASE AQUILANO JACOBS ninth edition 19 Copyright 2006 John Wiley & Sons, Inc. 3-19 Prevention Costs  Quality planning costs – costs of developing and implementing quality management program  Product-design costs – costs of designing products with quality characteristics  Process costs – costs expended to make sure productive process conforms to quality specifications  Training costs – costs of developing and putting on quality training programs for employees and management  Information costs – costs of acquiring and maintaining data related to quality, and development of reports on quality performance
  • 20.
    Operations Management ForCompetitive Advantage ©The McGraw-Hill Companies, Inc., 2001 CHASE AQUILANO JACOBS ninth edition 20 Copyright 2006 John Wiley & Sons, Inc. 3-20 Appraisal Costs  Inspection and testing – costs of testing and inspecting materials, parts, and product at various stages and at end of process  Test equipment costs – costs of maintaining equipment used in testing quality characteristics of products  Operator costs – costs of time spent by operators to gather data for testing product quality, to make equipment adjustments to maintain quality, and to stop work to assess quality
  • 21.
    Operations Management ForCompetitive Advantage ©The McGraw-Hill Companies, Inc., 2001 CHASE AQUILANO JACOBS ninth edition 21 Copyright 2006 John Wiley & Sons, Inc. 3-21 Internal Failure Costs  Scrap costs – costs of poor-quality products that must be discarded, including labor, material, and indirect costs  Rework costs – costs of fixing defective products to conform to quality specifications  Process failure costs – costs of determining why production process is producing poor-quality products  Process downtime costs – costs of shutting down productive process to fix problem  Price-downgrading costs – costs of discounting poor- quality products—that is, selling products as “seconds”
  • 22.
    Operations Management ForCompetitive Advantage ©The McGraw-Hill Companies, Inc., 2001 CHASE AQUILANO JACOBS ninth edition 22 Copyright 2006 John Wiley & Sons, Inc. 3-22 External Failure Costs  Customer complaint costs – costs of investigating and satisfactorily responding to a customer complaint resulting from a poor-quality product  Product return costs – costs of handling and replacing poor-quality products returned by customer  Warranty claims costs – costs of complying with product warranties  Product liability costs – litigation costs resulting from product liability and customer injury  Lost sales costs – costs incurred because customers are dissatisfied with poor quality products and do not make additional purchases
  • 23.
    Operations Management ForCompetitive Advantage ©The McGraw-Hill Companies, Inc., 2001 CHASE AQUILANO JACOBS ninth edition 23 Benchmarking 1. Identify those processes needing improvement. 2. Identify a firm that is the world leader in performing the process. 3. Contact the managers of that company and make a personal visit to interview managers and workers. 4. Analyze data.
  • 24.
    Operations Management ForCompetitive Advantage ©The McGraw-Hill Companies, Inc., 2001 CHASE AQUILANO JACOBS ninth edition 24 PART II Statistical Quality Control
  • 25.
    Operations Management ForCompetitive Advantage ©The McGraw-Hill Companies, Inc., 2001 CHASE AQUILANO JACOBS ninth edition 25 9 -25 Designing of Quality Control Systems  Processes and “internal customers.”  “Critical points” and guidelines in identifying them.  Steps in designing QC systems.
  • 26.
    Operations Management ForCompetitive Advantage ©The McGraw-Hill Companies, Inc., 2001 CHASE AQUILANO JACOBS ninth edition 26 9 -26 Steps in Designing QC Systems  Identify critical points  Decide on the type of measurement (variable versus attribute)  Decide on the amount of inspection to be used.  Decide who should do the inspection
  • 27.
    Operations Management ForCompetitive Advantage ©The McGraw-Hill Companies, Inc., 2001 CHASE AQUILANO JACOBS ninth edition 27 9 -27 Process Quality Control  Basic assumptions (tenets) of Process Quality Control: – Every process has random variation in it. – Production processes are not usually found in a state of control.  “State of Control”; what does it mean?
  • 28.
    Operations Management ForCompetitive Advantage ©The McGraw-Hill Companies, Inc., 2001 CHASE AQUILANO JACOBS ninth edition 28 9 -28 Process Control Chart x y Time Upper control limit (UCL) Center line (CL) Lower control limit (LCL) Average + 3 standard deviations Quality measurement average Average - 3 standard deviations
  • 29.
    Operations Management ForCompetitive Advantage ©The McGraw-Hill Companies, Inc., 2001 CHASE AQUILANO JACOBS ninth edition 29 9 -29 UCL LCL CL 1 2 3 4 5 6 Sample Quality Control Chart Stop the process; look for assignable cause Stop the process; look for assignable cause
  • 30.
    Operations Management ForCompetitive Advantage ©The McGraw-Hill Companies, Inc., 2001 CHASE AQUILANO JACOBS ninth edition 30 Quality Measures: Attributes & Variables  Attribute: is a product characteristics such as color, surface texture, cleanliness, or smell or taste  Hence attributes can be evaluated as: good or bad, acceptable or not, or yes or no  A variable measure is a product characteristic that is measured on a continuous scale such as length h, temperature, or time
  • 31.
    Operations Management ForCompetitive Advantage ©The McGraw-Hill Companies, Inc., 2001 CHASE AQUILANO JACOBS ninth edition 31 Types of Statistical Sampling  Attribute (Go or no-go information) – Defectives refers to the acceptability of product across a range of characteristics. – Defects refers to the number of defects per unit which may be higher than the number of defectives. – p-chart application – C-chart  Variable (Continuous) – Usually measured by the mean and the standard deviation. – X-bar and R chart applications
  • 32.
    Operations Management ForCompetitive Advantage ©The McGraw-Hill Companies, Inc., 2001 CHASE AQUILANO JACOBS ninth edition 32 UCL LCL Samples over time 1 2 3 4 5 6 UCL LCL Samples over time 1 2 3 4 5 6 UCL LCL Samples over time 1 2 3 4 5 6 Normal Behavior Possible problem, investigate Possible problem, investigate Statistical Process Control (SPC) Charts
  • 33.
    Operations Management ForCompetitive Advantage ©The McGraw-Hill Companies, Inc., 2001 CHASE AQUILANO JACOBS ninth edition 33 Control Limits We establish the Upper Control Limits (UCL) and the Lower Control Limits (LCL) with plus or minus 3 standard deviations. Based on this we can expect 99.7% of our sample observations to fall within these limits. x LCL UCL 99.7%
  • 34.
    Operations Management ForCompetitive Advantage ©The McGraw-Hill Companies, Inc., 2001 CHASE AQUILANO JACOBS ninth edition 34 Copyright 2006 John Wiley & Sons, Inc. 4-34 Control Charts for Attributes  p-charts  uses portion defective in a sample  c-charts  uses number of defects in an item
  • 35.
    Operations Management ForCompetitive Advantage ©The McGraw-Hill Companies, Inc., 2001 CHASE AQUILANO JACOBS ninth edition 35 Copyright 2006 John Wiley & Sons, Inc. p-Chart UCL = p + zp LCL = p - zp z = number of standard deviations from process average p = sample proportion defective; an estimate of process average p = standard deviation of sample proportion p = p(1 - p) n
  • 36.
    Operations Management ForCompetitive Advantage ©The McGraw-Hill Companies, Inc., 2001 CHASE AQUILANO JACOBS ninth edition 36 Con… p = T otal N um b er of D efectives T otal N um b er of O bservations n s ) p - (1 p = p
  • 37.
    Operations Management ForCompetitive Advantage ©The McGraw-Hill Companies, Inc., 2001 CHASE AQUILANO JACOBS ninth edition 37 Copyright 2006 John Wiley & Sons, Inc. 4-37 p-Chart Example 20 samples of 100 pairs of jeans NUMBER OF PROPORTION SAMPLE DEFECTIVES DEFECTIVE 1 6 .06 2 0 .00 3 4 .04 : : : : : : 20 18 .18 200
  • 38.
    Operations Management ForCompetitive Advantage ©The McGraw-Hill Companies, Inc., 2001 CHASE AQUILANO JACOBS ninth edition 38 Copyright 2006 John Wiley & Sons, Inc. 4-38 p-Chart Example (cont.) UCL = p + z = 0.10 + 3 p(1 - p) n 0.10(1 - 0.10) 100 UCL = 0.190 LCL = 0.010 LCL = p - z = 0.10 - 3 p(1 - p) n 0.10(1 - 0.10) 100 = 200 / 20(100) = 0.10 total defectives total sample observations p =
  • 39.
    Operations Management ForCompetitive Advantage ©The McGraw-Hill Companies, Inc., 2001 CHASE AQUILANO JACOBS ninth edition 39 Copyright 2006 John Wiley & Sons, Inc. 4-39 0.02 0.04 0.06 0.08 0.10 0.12 0.14 0.16 0.18 0.20 Proportion defective Sample number 2 4 6 8 10 12 14 16 18 20 UCL = 0.190 LCL = 0.010 p = 0.10 p-Chart Example (cont.)
  • 40.
    Operations Management ForCompetitive Advantage ©The McGraw-Hill Companies, Inc., 2001 CHASE AQUILANO JACOBS ninth edition 40 Copyright 2006 John Wiley & Sons, Inc. 4-40 c-Chart UCL = c + zc LCL = c - zc where c = number of defects per sample c = c
  • 41.
    Operations Management ForCompetitive Advantage ©The McGraw-Hill Companies, Inc., 2001 CHASE AQUILANO JACOBS ninth edition 41 Copyright 2006 John Wiley & Sons, Inc. 4-41 c-Chart (cont.) Number of defects in 15 sample rooms 1 12 2 8 3 16 : : : : 15 15 190 SAMPLE c = = 12.67 190 15 UCL = c + zc = 12.67 + 3 12.67 = 23.35 LCL = c + zc = 12.67 - 3 12.67 = 1.99 NUMBER OF DEFECTS
  • 42.
    Operations Management ForCompetitive Advantage ©The McGraw-Hill Companies, Inc., 2001 CHASE AQUILANO JACOBS ninth edition 42 Copyright 2006 John Wiley & Sons, Inc. 4-42 3 6 9 12 15 18 21 24 Number of defects Sample number 2 4 6 8 10 12 14 16 UCL = 23.35 LCL = 1.99 c = 12.67 c-Chart (cont.)
  • 43.
    Operations Management ForCompetitive Advantage ©The McGraw-Hill Companies, Inc., 2001 CHASE AQUILANO JACOBS ninth edition 43 Copyright 2006 John Wiley & Sons, Inc. 4-43 Control Charts for Variables  Mean chart ( x -Chart )  uses average of a sample  Range chart ( R-Chart )  uses amount of dispersion in a sample
  • 44.
    Operations Management ForCompetitive Advantage ©The McGraw-Hill Companies, Inc., 2001 CHASE AQUILANO JACOBS ninth edition 44 Copyright 2006 John Wiley & Sons, Inc. 4-44 x-bar Chart x = x1 + x2 + ... xk k = UCL = x + A2R LCL = x - A2R = = where x = average of sample means =
  • 45.
    Operations Management ForCompetitive Advantage ©The McGraw-Hill Companies, Inc., 2001 CHASE AQUILANO JACOBS ninth edition 45 Copyright 2006 John Wiley & Sons, Inc. 4-45 x-bar Chart Example Example 15.4 OBSERVATIONS (SLIP- RING DIAMETER, CM) SAMPLE k 1 2 3 4 5 x R 1 5.02 5.01 4.94 4.99 4.96 4.98 0.08 2 5.01 5.03 5.07 4.95 4.96 5.00 0.12 3 4.99 5.00 4.93 4.92 4.99 4.97 0.08 4 5.03 4.91 5.01 4.98 4.89 4.96 0.14 5 4.95 4.92 5.03 5.05 5.01 4.99 0.13 6 4.97 5.06 5.06 4.96 5.03 5.01 0.10 7 5.05 5.01 5.10 4.96 4.99 5.02 0.14 8 5.09 5.10 5.00 4.99 5.08 5.05 0.11 9 5.14 5.10 4.99 5.08 5.09 5.08 0.15 10 5.01 4.98 5.08 5.07 4.99 5.03 0.10 50.09 1.15
  • 46.
    Operations Management ForCompetitive Advantage ©The McGraw-Hill Companies, Inc., 2001 CHASE AQUILANO JACOBS ninth edition 46 Copyright 2006 John Wiley & Sons, Inc. 4-46 UCL = x + A2R = 5.01 + (0.58)(0.115) = 5.08 LCL = x - A2R = 5.01 - (0.58)(0.115) = 4.94 = = x = = = 5.01 cm = x k 50.09 10 x- bar Chart Example (cont.) Retrieve Factor Value A2
  • 47.
    Operations Management ForCompetitive Advantage ©The McGraw-Hill Companies, Inc., 2001 CHASE AQUILANO JACOBS ninth edition 47 Copyright 2006 John Wiley & Sons, Inc. 4-47 x- bar Chart Example (cont.) UCL = 5.08 LCL = 4.94 Mean Sample number | 1 | 2 | 3 | 4 | 5 | 6 | 7 | 8 | 9 | 10 5.10 – 5.08 – 5.06 – 5.04 – 5.02 – 5.00 – 4.98 – 4.96 – 4.94 – 4.92 – x = 5.01 =
  • 48.
    Operations Management ForCompetitive Advantage ©The McGraw-Hill Companies, Inc., 2001 CHASE AQUILANO JACOBS ninth edition 48 Copyright 2006 John Wiley & Sons, Inc. 4-48 R- Chart UCL = D4R LCL = D3R R = R k where R = range of each sample k = number of samples
  • 49.
    Operations Management ForCompetitive Advantage ©The McGraw-Hill Companies, Inc., 2001 CHASE AQUILANO JACOBS ninth edition 49 Copyright 2006 John Wiley & Sons, Inc. 4-49 R-Chart Example OBSERVATIONS (SLIP-RING DIAMETER, CM) SAMPLE k 1 2 3 4 5 x R 1 5.02 5.01 4.94 4.99 4.96 4.98 0.08 2 5.01 5.03 5.07 4.95 4.96 5.00 0.12 3 4.99 5.00 4.93 4.92 4.99 4.97 0.08 4 5.03 4.91 5.01 4.98 4.89 4.96 0.14 5 4.95 4.92 5.03 5.05 5.01 4.99 0.13 6 4.97 5.06 5.06 4.96 5.03 5.01 0.10 7 5.05 5.01 5.10 4.96 4.99 5.02 0.14 8 5.09 5.10 5.00 4.99 5.08 5.05 0.11 9 5.14 5.10 4.99 5.08 5.09 5.08 0.15 10 5.01 4.98 5.08 5.07 4.99 5.03 0.10 50.09 1.15 Example 15.3
  • 50.
    Operations Management ForCompetitive Advantage ©The McGraw-Hill Companies, Inc., 2001 CHASE AQUILANO JACOBS ninth edition 50 Copyright 2006 John Wiley & Sons, Inc. 4-50 R-Chart Example (cont.) Example 15.3 R k R = = = 0.115 1.15 10 UCL = D4R = 2.11(0.115) = 0.243 LCL = D3R = 0(0.115) = 0 Retrieve Factor Values D3 and D4
  • 51.
    Operations Management ForCompetitive Advantage ©The McGraw-Hill Companies, Inc., 2001 CHASE AQUILANO JACOBS ninth edition 51 Copyright 2006 John Wiley & Sons, Inc. 4-51 R-Chart Example (cont.) UCL = 0.243 LCL = 0 Range Sample number R = 0.115 | 1 | 2 | 3 | 4 | 5 | 6 | 7 | 8 | 9 | 10 0.28 – 0.24 – 0.20 – 0.16 – 0.12 – 0.08 – 0.04 – 0 –
  • 52.
    Operations Management ForCompetitive Advantage ©The McGraw-Hill Companies, Inc., 2001 CHASE AQUILANO JACOBS ninth edition 52 Copyright 2006 John Wiley & Sons, Inc. 4-52 Fac tors n A2 D3 D4 SAMPLE SIZE FACTOR FOR x-CHART FACTORS FOR R-CHART 2 1.88 0.00 3.27 3 1.02 0.00 2.57 4 0.73 0.00 2.28 5 0.58 0.00 2.11 6 0.48 0.00 2.00 7 0.42 0.08 1.92 8 0.37 0.14 1.86 9 0.44 0.18 1.82 10 0.11 0.22 1.78 11 0.99 0.26 1.74 12 0.77 0.28 1.72 13 0.55 0.31 1.69 14 0.44 0.33 1.67 15 0.22 0.35 1.65 16 0.11 0.36 1.64 17 0.00 0.38 1.62 18 0.99 0.39 1.61 19 0.99 0.40 1.61 20 0.88 0.41 1.59 Appendix: Determining Control Limits for x-bar and R-Charts Return
  • 53.
    Operations Management ForCompetitive Advantage ©The McGraw-Hill Companies, Inc., 2001 CHASE AQUILANO JACOBS ninth edition 53 9 -53 Continuous Improvement  Pareto analysis  Cause-and-effect (fish-bone) diagrams  Process capability charts
  • 54.
    Operations Management ForCompetitive Advantage ©The McGraw-Hill Companies, Inc., 2001 CHASE AQUILANO JACOBS ninth edition 54 CHECK SHEETS Used to keep a record of the number and type of discontinuities over a specified period of time or within a certain batch of product. PARETO CHART A graphical representation ranking discontinuities from the most to least significant. Used to help brainstorm what discontinuities, if worked upon first, would be the most likely to produce the greatest improvement in quality. Class Example Our manufacturing procedure is composed of several steps. Several of these procedures have lead to discontinuities noticed upon inspection. The steps causing defectives are as follows:  Caulking 198 defectives  Fitting 25 defectives  Connections 103 defectives  Torque 18 defectives  Gapping 72 defective A Pareto Diagram will be developed.
  • 55.
    Operations Management ForCompetitive Advantage ©The McGraw-Hill Companies, Inc., 2001 CHASE AQUILANO JACOBS ninth edition 55
  • 56.
    Operations Management ForCompetitive Advantage ©The McGraw-Hill Companies, Inc., 2001 CHASE AQUILANO JACOBS ninth edition 56
  • 57.
    Operations Management ForCompetitive Advantage ©The McGraw-Hill Companies, Inc., 2001 CHASE AQUILANO JACOBS ninth edition 57 CAUSE AND EFFECT DIAGRAMS (Fishbone Diagram) Used in brainstorming session to help identify the causes of quality losses. This diagram is particularly useful after the flow chart and the Pareto diagrams have been developed. QUALITY (Effect) Cause Step 1:Decide on the quality characteristic {e.g. Reduction of wobble during machine rotation} Step 2:Set up the fish bone backbone Step 3:Identify main factors causing effect {e.g. Workers, Materials, Inspection, Tools} Step 4: Add Cause to each branch
  • 58.
    Operations Management ForCompetitive Advantage ©The McGraw-Hill Companies, Inc., 2001 CHASE AQUILANO JACOBS ninth edition 58
  • 59.
    Operations Management ForCompetitive Advantage ©The McGraw-Hill Companies, Inc., 2001 CHASE AQUILANO JACOBS ninth edition 59 Reading Assignment 1. Acceptance Sampling 2. Kaizen method of quality management 3. Process Capability Index 4. ISO quality guidelines 5. The History of Total Quality Management

Editor's Notes