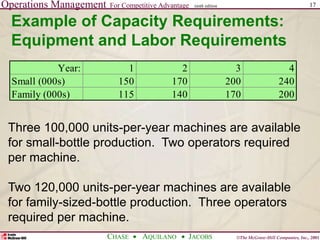
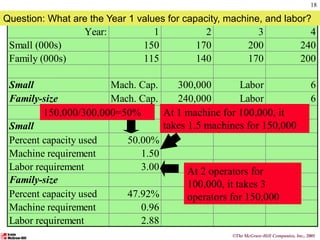
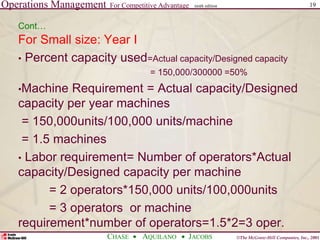
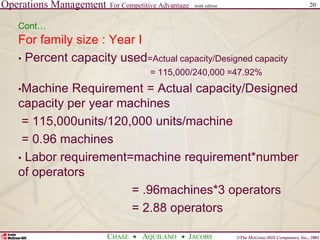
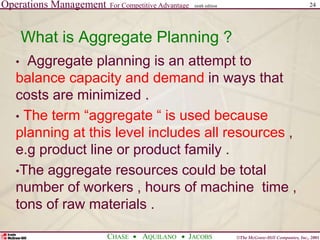
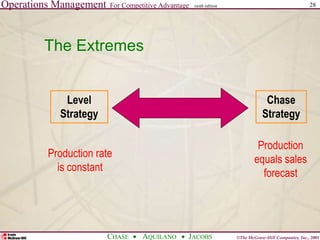
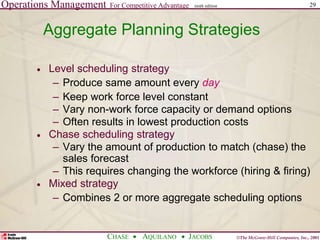
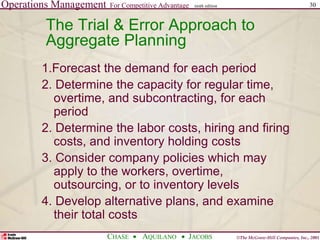
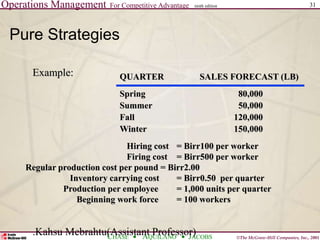
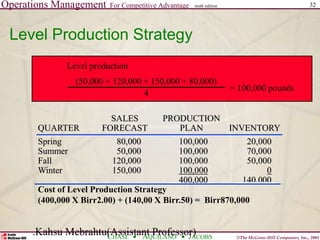
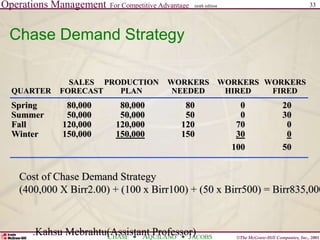
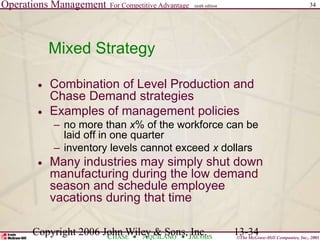
SlideShare a Scribd company logo
1 of 50
Operations Management For Competitive Advantage
©The McGraw-Hill Companies, Inc., 2001
CHASE AQUILANO JACOBS
ninth edition 1
CHAPTER 8
STRATEGIC CAPACITY
MANAGEMENT, AGGREGATE
PLANNING AND SCHEDULING
Kahsu Mebrahtu (Asst. Prof.)
Mekelle University
College of Business and Economics
Department of Management
Postgraduate Program (MBA)
ninth edition
Operations Management For Competitive Advantage
©The McGraw-Hill Companies, Inc., 2001
CHASE AQUILANO JACOBS
ninth edition 2
Part I: Strategic Capacity Planning
 Strategic Capacity Planning Defined
 Capacity Utilization & Best Operating Level
 Economies & Diseconomies of Scale
 Capacity Focus, Flexibility & Planning
 Determining Capacity Requirements
Operations Management For Competitive Advantage
©The McGraw-Hill Companies, Inc., 2001
CHASE AQUILANO JACOBS
ninth edition 3
Strategic Capacity Planning
Defined
 Capacity can be defined as the ability to hold, receive,
store, or accommodate.
 Capacity is the maximum capability to produce .
 It can be measured as units of output, amount of birr, hour
of work, or number of customers processed over a specified
time
 Or the amount of output that a system is capable achieving
over a specific period of time .
Operations Management For Competitive Advantage
©The McGraw-Hill Companies, Inc., 2001
CHASE AQUILANO JACOBS
ninth edition 4
Examples
 The number of automobiles produced in a
shift
The number of customers served in
restaurant in a given time
The number of students in a class etc.
Operations Management For Competitive Advantage
©The McGraw-Hill Companies, Inc., 2001
CHASE AQUILANO JACOBS
ninth edition 5
Time Durations for capacity Planning
o Long range planning: greater than one year.
Eg. Building, equipment, or facilities
oIntermediate range planning: monthly or
quarterly plans for the next 6 to 18 months .
Eg. Hiring, layoffs , new tools , subcontracting
oShort Range Planning: less than one month
Eg. Weekly or daily scheduling process
Operations Management For Competitive Advantage
©The McGraw-Hill Companies, Inc., 2001
CHASE AQUILANO JACOBS
ninth edition 6
Capacity Planning
 Capacity planning- is the long-term strategic
decision that establishes a firm’s overall
level resources
 Strategic capacity planning is an approach
for determining the overall capacity level of
capital intensive resources, including
facilities, equipment, and overall labor force
size.
Operations Management For Competitive Advantage
©The McGraw-Hill Companies, Inc., 2001
CHASE AQUILANO JACOBS
ninth edition 7
Copyright 2006 John Wiley & Sons, Inc. 6-7
Capacity Expansion Strategies
Operations Management For Competitive Advantage
©The McGraw-Hill Companies, Inc., 2001
CHASE AQUILANO JACOBS
ninth edition 8
Type of capacity
 1. Rated capacity(Designed capacity) –the
theoretical output that could be attained if a
process were operated at full speed without
interruption, exceptions or downtime .
 2. Effective capacity- takes into account the
efficiency with which a particular product or
customer can be processed, and the
utilization of the scheduled hours or work.
Operations Management For Competitive Advantage
©The McGraw-Hill Companies, Inc., 2001
CHASE AQUILANO JACOBS
ninth edition 9
 Effective daily capacity=(no. of machines or
workers ) X (hours per shift)x(no. of shifts)
x(utilization)x(efficiency)
 Utilization-refers to the percentage of
available working time that a worker actually
works or a machine actually runs.
 Efficiency-refers to how well a machine or
worker performs compared to a standard
output level.
Operations Management For Competitive Advantage
©The McGraw-Hill Companies, Inc., 2001
CHASE AQUILANO JACOBS
ninth edition 10
Capacity Utilization
 Capacity used
– rate of output actually achieved
 Best operating level
– capacity for which the process was designed ( or
the volume of output at which average unit cost is
minimized)
 Capacity utilization rate = Capacity used x 100
Best operating level
Operations Management For Competitive Advantage
©The McGraw-Hill Companies, Inc., 2001
CHASE AQUILANO JACOBS
ninth edition 11
Best Operating Level
Underutilization
Best Operating
Level
Average
unit cost
of output
Volume
Overutilization
Operations Management For Competitive Advantage
©The McGraw-Hill Companies, Inc., 2001
CHASE AQUILANO JACOBS
ninth edition 12
Example of Capacity Utilization
 During one week of production, a plant
produced 83 units of a product. Its historic
highest or best utilization recorded was 120
units per week. What is this plant’s capacity
utilization rate?
 Answer:
Capacity utilization rate = Capacity used .
Best operating level
= 83/120
=0.69 or 69%
Operations Management For Competitive Advantage
©The McGraw-Hill Companies, Inc., 2001
CHASE AQUILANO JACOBS
ninth edition 13
Capacity Planning-
 Frequency of Capacity Additions
 External Sources of Capacity
Operations Management For Competitive Advantage
©The McGraw-Hill Companies, Inc., 2001
CHASE AQUILANO JACOBS
ninth edition 14
Determining Capacity Requirements
 Forecast sales within each individual product
line.
 Calculate equipment and labor requirements
to meet the forecasts.
 Project equipment and labor availability over
the planning horizon.
Operations Management For Competitive Advantage
©The McGraw-Hill Companies, Inc., 2001
CHASE AQUILANO JACOBS
ninth edition 15
Example of Capacity Requirements
A manufacturer produces two lines of mustard,
Fancy Fine and Generic line. Each is sold in
small and family-size plastic bottles.
The following table shows forecast demand for
the next four years.
Year: 1 2 3 4
FancyFine
Small (000s) 50 60 80 100
Family (000s) 35 50 70 90
Generic
Small (000s) 100 110 120 140
Family (000s) 80 90 100 110
Operations Management For Competitive Advantage
©The McGraw-Hill Companies, Inc., 2001
CHASE AQUILANO JACOBS
ninth edition 16
Example of Capacity Requirements:
The Product from a Capacity Viewpoint
 Question: Are we really producing two
different types of mustards from the
standpoint of capacity requirements?
 Answer: No, it’s the same product just
packaged differently.
Operations Management For Competitive Advantage
©The McGraw-Hill Companies, Inc., 2001
CHASE AQUILANO JACOBS
ninth edition 17
Example of Capacity Requirements:
Equipment and Labor Requirements
Year: 1 2 3 4
Small (000s) 150 170 200 240
Family (000s) 115 140 170 200
Three 100,000 units-per-year machines are available
for small-bottle production. Two operators required
per machine.
Two 120,000 units-per-year machines are available
for family-sized-bottle production. Three operators
required per machine.
Year: 1 2 3 4
Small (000s) 150 170 200 240
Family (000s) 115 140 170 200
Small Mach. Cap. 300,000 Labor 6
Family-size Mach. Cap. 240,000 Labor 6
Small
Percent capacity used 50.00%
Machine requirement 1.50
Labor requirement 3.00
Family-size
Percent capacity used 47.92%
Machine requirement 0.96
Labor requirement 2.88
Question: What are the Year 1 values for capacity, machine, and labor?
150,000/300,000=50% At 1 machine for 100,000, it
takes 1.5 machines for 150,000
At 2 operators for
100,000, it takes 3
operators for 150,000
©The McGraw-Hill Companies, Inc., 2001
18
Operations Management For Competitive Advantage
©The McGraw-Hill Companies, Inc., 2001
CHASE AQUILANO JACOBS
ninth edition 19
Cont…
For Small size: Year I
• Percent capacity used=Actual capacity/Designed capacity
= 150,000/300000 =50%
•Machine Requirement = Actual capacity/Designed
capacity per year machines
= 150,000units/100,000 units/machine
= 1.5 machines
• Labor requirement= Number of operators*Actual
capacity/Designed capacity per machine
= 2 operators*150,000 units/100,000units
= 3 operators or machine
requirement*number of operators=1.5*2=3 oper.
Operations Management For Competitive Advantage
©The McGraw-Hill Companies, Inc., 2001
CHASE AQUILANO JACOBS
ninth edition 20
Cont…
For family size : Year I
• Percent capacity used=Actual capacity/Designed capacity
= 115,000/240,000 =47.92%
•Machine Requirement = Actual capacity/Designed
capacity per year machines
= 115,000units/120,000 units/machine
= 0.96 machines
• Labor requirement=machine requirement*number
of operators
= .96machines*3 operators
= 2.88 operators
Year: 1 2 3 4
Small (000s) 150 170 200 240
Family (000s) 115 140 170 200
Small Mach. Cap. 300,000 Labor 6
Family-size Mach. Cap. 240,000 Labor 6
Small
Percent capacity used 50.00%
Machine requirement 1.50
Labor requirement 3.00
Family-size
Percent capacity used 47.92%
Machine requirement 0.96
Labor requirement 2.88
Question: What are the values for columns 2, 3 and 4 in the table below?
56.67%
1.70
3.40
58.33%
1.17
3.50
66.67%
2.00
4.00
70.83%
1.42
4.25
80.00%
2.40
4.80
83.33%
1.67
5.00
21
©The McGraw-Hill Companies, Inc., 2001
Operations Management For Competitive Advantage
©The McGraw-Hill Companies, Inc., 2001
CHASE AQUILANO JACOBS
ninth edition 22
Home work/Reading Assignment
•Read and understand the different
techniques of demand forecasting
•Read about the use of decision tree as a
method of capacity choice
Operations Management For Competitive Advantage
©The McGraw-Hill Companies, Inc., 2001
CHASE AQUILANO JACOBS
ninth edition 23
PART II: Aggregate Planning
 Operations Planning Overview
 Aggregate production planning
 Examples: Chase and Level strategies
Operations Management For Competitive Advantage
©The McGraw-Hill Companies, Inc., 2001
CHASE AQUILANO JACOBS
ninth edition 24
What is Aggregate Planning ?
• Aggregate planning is an attempt to
balance capacity and demand in ways that
costs are minimized .
• The term “aggregate “ is used because
planning at this level includes all resources ,
e.g product line or product family .
•The aggregate resources could be total
number of workers , hours of machine time ,
tons of raw materials .
Operations Management For Competitive Advantage
©The McGraw-Hill Companies, Inc., 2001
CHASE AQUILANO JACOBS
ninth edition 25
 Meet demand
(Sales Forecast)
 Use capacity efficiently
 Meet inventory policy
 Minimize cost
– Labor
– Inventory
– Plant & equipment
– Subcontract
Aggregate Planning Goals
Operations Management For Competitive Advantage
©The McGraw-Hill Companies, Inc., 2001
CHASE AQUILANO JACOBS
ninth edition 26
Aggregate Planning
Strategies
Pure Strategies
Demand Options — change demand:
(options to increase demand
 Pricing (e.g. change price)
 Promotion –advertising, direct marketing
 backordering during high demand periods
 New demand creation-a new , but complementary
demand is created for a product or service .E.g. in
restaurant customers may demand the bar services
due to high waiting time .
Operations Management For Competitive Advantage
©The McGraw-Hill Companies, Inc., 2001
CHASE AQUILANO JACOBS
ninth edition 27
Aggregate Planning
Strategies
Pure Strategies
Capacity Options — change capacity:
(options to increase or decrease capacity)
 changing inventory levels
 varying work force size by hiring or layoffs
 varying production capacity through
overtime or idle time
 subcontracting (aka “outsourcing”)
 using part-time workers
Operations Management For Competitive Advantage
©The McGraw-Hill Companies, Inc., 2001
CHASE AQUILANO JACOBS
ninth edition 28
The Extremes
Level
Strategy
Chase
Strategy
Production
equals sales
forecast
Production rate
is constant
Operations Management For Competitive Advantage
©The McGraw-Hill Companies, Inc., 2001
CHASE AQUILANO JACOBS
ninth edition 29
 Level scheduling strategy
– Produce same amount every day
– Keep work force level constant
– Vary non-work force capacity or demand options
– Often results in lowest production costs
 Chase scheduling strategy
– Vary the amount of production to match (chase) the
sales forecast
– This requires changing the workforce (hiring & firing)
 Mixed strategy
– Combines 2 or more aggregate scheduling options
Aggregate Planning Strategies
Operations Management For Competitive Advantage
©The McGraw-Hill Companies, Inc., 2001
CHASE AQUILANO JACOBS
ninth edition 30
The Trial & Error Approach to
Aggregate Planning
1.Forecast the demand for each period
2. Determine the capacity for regular time,
overtime, and subcontracting, for each
period
2. Determine the labor costs, hiring and firing
costs, and inventory holding costs
3. Consider company policies which may
apply to the workers, overtime,
outsourcing, or to inventory levels
4. Develop alternative plans, and examine
their total costs
Operations Management For Competitive Advantage
©The McGraw-Hill Companies, Inc., 2001
CHASE AQUILANO JACOBS
ninth edition 31
.Kahsu Mebrahtu(Assistant Professor)
Pure Strategies
Hiring cost = Birr100 per worker
Firing cost = Birr500 per worker
Regular production cost per pound = Birr2.00
Inventory carrying cost = Birr0.50 per quarter
Production per employee = 1,000 units per quarter
Beginning work force = 100 workers
QUARTER SALES FORECAST (LB)
Spring 80,000
Summer 50,000
Fall 120,000
Winter 150,000
Example:
Operations Management For Competitive Advantage
©The McGraw-Hill Companies, Inc., 2001
CHASE AQUILANO JACOBS
ninth edition 32
.Kahsu Mebrahtu(Assistant Professor)
Level Production Strategy
Level production
= 100,000 pounds
(50,000 + 120,000 + 150,000 + 80,000)
4
Spring 80,000 100,000 20,000
Summer 50,000 100,000 70,000
Fall 120,000 100,000 50,000
Winter 150,000 100,000 0
400,000 140,000
Cost of Level Production Strategy
(400,000 X Birr2.00) + (140,00 X Birr.50) = Birr870,000
SALES PRODUCTION
QUARTER FORECAST PLAN INVENTORY
Operations Management For Competitive Advantage
©The McGraw-Hill Companies, Inc., 2001
CHASE AQUILANO JACOBS
ninth edition 33
.Kahsu Mebrahtu(Assistant Professor)
Chase Demand Strategy
Spring 80,000 80,000 80 0 20
Summer 50,000 50,000 50 0 30
Fall 120,000 120,000 120 70 0
Winter 150,000 150,000 150 30 0
100 50
SALES PRODUCTION WORKERS WORKERS WORKERS
QUARTER FORECAST PLAN NEEDED HIRED FIRED
Cost of Chase Demand Strategy
(400,000 X Birr2.00) + (100 x Birr100) + (50 x Birr500) = Birr835,000
Operations Management For Competitive Advantage
©The McGraw-Hill Companies, Inc., 2001
CHASE AQUILANO JACOBS
ninth edition 34
Copyright 2006 John Wiley & Sons, Inc. 13-34
Mixed Strategy
 Combination of Level Production and
Chase Demand strategies
 Examples of management policies
– no more than x% of the workforce can be
laid off in one quarter
– inventory levels cannot exceed x dollars
 Many industries may simply shut down
manufacturing during the low demand
season and schedule employee
vacations during that time
Operations Management For Competitive Advantage
©The McGraw-Hill Companies, Inc., 2001
CHASE AQUILANO JACOBS
ninth edition 35
PART III .Operations Scheduling
Operations Management For Competitive Advantage
©The McGraw-Hill Companies, Inc., 2001
CHASE AQUILANO JACOBS
ninth edition 36
Work Center
Defined
 A work center is an area in a business in
which productive resources are organized
and work is completed.
 May be a single machine, a group of
machines, or an area where a particular type
of work is done.
Operations Management For Competitive Advantage
©The McGraw-Hill Companies, Inc., 2001
CHASE AQUILANO JACOBS
ninth edition 37
Scheduling and Controlling Functions
1. Allocate orders , equipment, and personnel to work
centers or other specified locations
2. Determining the sequence of order performance (that is
establishing job priorities )
3. Initiating performance of the scheduled work. This is
commonly termed dispatching of orders ( This includes
start date, Job# , description and run time )
4. Shop floor control (or production activity control)
involving:
a. Reviewing the status and controlling the progress of
orders as they are being worked on.
b. Expediting late and critical orders
Operations Management For Competitive Advantage
©The McGraw-Hill Companies, Inc., 2001
CHASE AQUILANO JACOBS
ninth edition 38
Work-Center Scheduling Objectives
 Meet due dates
 Minimize lead time
 Minimize setup time or cost
 Minimize work-in-process inventory
 Maximize machine utilization
Operations Management For Competitive Advantage
©The McGraw-Hill Companies, Inc., 2001
CHASE AQUILANO JACOBS
ninth edition 39
Priority Rules for Job Sequencing
1. First-come, first-served (FCFS)
2. Shortest operating time (SOT)
3. Earliest due date first
4. Earliest start date first (due date-lead time)
5. slack time remaining (STR) first: Time remaining before due
date – the processing time remaining. Run the shortest
STR first
Operations Management For Competitive Advantage
©The McGraw-Hill Companies, Inc., 2001
CHASE AQUILANO JACOBS
ninth edition 40
6. slack time remaining (per operation as opposed to per job)
first. Run orders with shortest STR/OP.
STR/OP= Time remaining - Remaining processing
before due date Time________
Number of remaining operation
7. Smallest critical ratio (CR) first
(due date-current date)/(number of days remaining)
8. Smallest queue ratio (QR) first
(slack time remaining in schedule)/(planned remaining
queue time)
9. Last come, first served (LCFS)
10. Random order or whim
Operations Management For Competitive Advantage
©The McGraw-Hill Companies, Inc., 2001
CHASE AQUILANO JACOBS
ninth edition 41
Schedule Performance Measures
 Meeting due dates of customers or
downstream operations.
 Minimizing the flow time (the time a job
spends in the process).
 Minimizing work-in-process inventory.
 Minimizing idle time of machines or workers.
Operations Management For Competitive Advantage
©The McGraw-Hill Companies, Inc., 2001
CHASE AQUILANO JACOBS
ninth edition 42
Example of Job Sequencing: First-
Come First-Served
Jobs (in order Processing Due Date Flow Time
of arrival) Time (days) (days hence) (days)
A 4 5 4
B 7 10 11
C 3 6 14
D 1 4 15
Answer: FCFS Schedule
Jobs (in order Processing Due Date
of arrival) Time (days) (days hence)
A 4 5
B 7 10
C 3 6
D 1 4
Suppose you have the four
jobs to the right arrive for
processing on one machine.
What is the FCFS schedule?
Do all the jobs get done on time?
No, Jobs B, C, and D
are going to be late.
Operations Management For Competitive Advantage
©The McGraw-Hill Companies, Inc., 2001
CHASE AQUILANO JACOBS
ninth edition 43
Total Flow Time = 4+11+14+15= 44 days
Mean Flow Time =44days/4jobs= 11days
Average lateness/job=(0+1+8+11)/4jobs=5
days (i.e on the average a job will be late by
5 days )
Operations Management For Competitive Advantage
©The McGraw-Hill Companies, Inc., 2001
CHASE AQUILANO JACOBS
ninth edition 44
Example of Job Sequencing: Shortest
Operating Time
Jobs (in order Processing Due Date
of arrival) Time (days) (days hence)
A 4 5
B 7 10
C 3 6
D 1 4
Answer: Shortest Operating Time Schedule
Jobs (in order Processing Due Date Flow Time
of arrival) Time (days) (days hence) (days)
D 1 4 1
C 3 6 4
A 4 5 8
B 7 10 15
Suppose you have the four
jobs to the right arrive for
processing on one machine.
What is the SOT schedule?
Do all the jobs get done on time?
No, Jobs A and
B are going to
be late.
Operations Management For Competitive Advantage
©The McGraw-Hill Companies, Inc., 2001
CHASE AQUILANO JACOBS
ninth edition 45
Example of Job Sequencing:
Last-Come First-Served
Jobs (in order Processing Due Date
of arrival) Time (days) (days hence)
A 4 5
B 7 10
C 3 6
D 1 4
Answer: Last-Come First-Served Schedule
Jobs (in order Processing Due Date Flow Time
of arrival) Time (days) (days hence) (days)
D 1 4 1
C 3 6 4
B 7 10 11
A 4 5 15
No, Jobs B and
A are going to
be late.
Suppose you have the four
jobs to the right arrive for
processing on one machine.
What is the LCFS schedule?
Do all the jobs get done on time?
Operations Management For Competitive Advantage
©The McGraw-Hill Companies, Inc., 2001
CHASE AQUILANO JACOBS
ninth edition 46
Example of Job Sequencing: Earliest
Due Date First
Jobs (in order Processing Due Date
of arrival) Time (days) (days hence)
A 4 5
B 7 10
C 3 6
D 1 4
Answer: Earliest Due Date First
Jobs (in order Processing Due Date Flow Time
of arrival) Time (days) (days hence) (days)
D 1 4 1
A 4 5 5
C 3 6 8
B 7 10 15
Suppose you have the four
jobs to the right arrive for
processing on one machine.
What is the earliest due date first
schedule?
Do all the jobs get done on time?
No, Jobs C and
B are going to
be late.
Operations Management For Competitive Advantage
©The McGraw-Hill Companies, Inc., 2001
CHASE AQUILANO JACOBS
ninth edition 47
Example of Job Sequencing: STR
Jobs (in order Processing Due Date
of arrival) Time (days) (days hence)
A 4 5
B 7 10
C 3 6
D 1 4
Suppose you have the four
jobs to the right arrive for
processing on one machine.
What is the CR schedule?
Do all the jobs get done on time?
No, Job D,
C,and B will be
late
Answer: STR First
Jobs (in order Processing Due Date Flow Time
of arrival) Time (days) (days hence) (days)
A 4 5 4
D 1 4 5
C 3 6 8
B 7 10 15
Operations Management For Competitive Advantage
©The McGraw-Hill Companies, Inc., 2001
CHASE AQUILANO JACOBS
ninth edition 48
Cont…
STR= Time remaining before due date
minus the processing time remaining
For Job A=4-4= 0
Job B= 9-7=2 days
Job C=5-3=2 days
Job D=3-1=2 days
Decision: Job A, Job D, Job C, and Job B
based on the minimum operating time
Operations Management For Competitive Advantage
©The McGraw-Hill Companies, Inc., 2001
CHASE AQUILANO JACOBS
ninth edition 49
Comparison of Priority Rules
Rule Total Completion
Time(Days)
Average
Completion Time
or Mean flow
time (Days)
Average
Lateness(Days)
FCFS 44 11 4.5
SOT 28 7 2
LCFS 31 7.75 2.75
EDDate 29 7.25 1.75
STR 32 8 2
Operations Management For Competitive Advantage
©The McGraw-Hill Companies, Inc., 2001
CHASE AQUILANO JACOBS
ninth edition 50
Reading Assignment :
1. Assignment Method
2. Employee Scheduling
3. Enterprise Resource Planning Systems

More Related Content

What's hot

Functional objectives and strategies
Functional objectives and strategiesFunctional objectives and strategies
Functional objectives and strategies
gemdeane1
 
Mrp 1 deepak 12mt07ind009
Mrp 1 deepak 12mt07ind009Mrp 1 deepak 12mt07ind009
Mrp 1 deepak 12mt07ind009
Akash Maurya
 
Training & Development ppt
Training & Development pptTraining & Development ppt
Training & Development ppt
Manoj Kumar
 
Human Resource Planning
Human Resource PlanningHuman Resource Planning
Human Resource Planning
simply_coool
 
Techniques of job design
Techniques of job designTechniques of job design
Techniques of job design
DineshOli2
 

What's hot (20)

A Brief History Of Training
A Brief History Of TrainingA Brief History Of Training
A Brief History Of Training
 
Time study
Time studyTime study
Time study
 
Functional objectives and strategies
Functional objectives and strategiesFunctional objectives and strategies
Functional objectives and strategies
 
HRIS
HRISHRIS
HRIS
 
Absorption costing vs variable costing
Absorption costing  vs variable costingAbsorption costing  vs variable costing
Absorption costing vs variable costing
 
Inventory model (operation research)
Inventory model (operation research)Inventory model (operation research)
Inventory model (operation research)
 
Mrp 1 deepak 12mt07ind009
Mrp 1 deepak 12mt07ind009Mrp 1 deepak 12mt07ind009
Mrp 1 deepak 12mt07ind009
 
Sales personnel recruitment plan and training program
Sales personnel recruitment plan and training program  Sales personnel recruitment plan and training program
Sales personnel recruitment plan and training program
 
Production and Operation Management (Capacity Planning )
Production and Operation Management (Capacity Planning )Production and Operation Management (Capacity Planning )
Production and Operation Management (Capacity Planning )
 
Human resource management unit 1
Human resource management unit 1Human resource management unit 1
Human resource management unit 1
 
Training & Development ppt
Training & Development pptTraining & Development ppt
Training & Development ppt
 
Production and Operation Management (Production Management)
Production and Operation Management (Production Management)Production and Operation Management (Production Management)
Production and Operation Management (Production Management)
 
Inventory Control Final Ppt
Inventory Control Final PptInventory Control Final Ppt
Inventory Control Final Ppt
 
Managerial Economics Cost PPT
Managerial Economics Cost PPTManagerial Economics Cost PPT
Managerial Economics Cost PPT
 
Human Resource Planning
Human Resource PlanningHuman Resource Planning
Human Resource Planning
 
Organizational climate
Organizational climateOrganizational climate
Organizational climate
 
Safety stocks final
Safety stocks finalSafety stocks final
Safety stocks final
 
Techniques of job design
Techniques of job designTechniques of job design
Techniques of job design
 
Process selection
Process selectionProcess selection
Process selection
 
Theory of Production and Costs & Cost Concepts
Theory of Production and Costs & Cost ConceptsTheory of Production and Costs & Cost Concepts
Theory of Production and Costs & Cost Concepts
 

Similar to Chapter-8 Capacity Planning, Aggregate Planning and Scheduling.pptx

Ch11 strg.capacity mgt
Ch11 strg.capacity mgtCh11 strg.capacity mgt
Ch11 strg.capacity mgt
videoaakash15
 
Ch11 strg.capacity+mgt
Ch11 strg.capacity+mgtCh11 strg.capacity+mgt
Ch11 strg.capacity+mgt
videoaakash15
 
Capacity Planning
Capacity PlanningCapacity Planning
Capacity Planning
MOHD ARISH
 
Strategic capacity planning for products and services
Strategic capacity planning for products and servicesStrategic capacity planning for products and services
Strategic capacity planning for products and services
gerlyn bonus
 
Operations management1
Operations management1Operations management1
Operations management1
Patrick Rubix
 
Beck Manufacturing and Plant CapacityRead the Beck Manufacturin.docx
Beck Manufacturing and Plant CapacityRead the Beck Manufacturin.docxBeck Manufacturing and Plant CapacityRead the Beck Manufacturin.docx
Beck Manufacturing and Plant CapacityRead the Beck Manufacturin.docx
ikirkton
 

Similar to Chapter-8 Capacity Planning, Aggregate Planning and Scheduling.pptx (20)

Chap009
Chap009Chap009
Chap009
 
Capacity planning1
Capacity planning1Capacity planning1
Capacity planning1
 
capacity planning om
capacity planning omcapacity planning om
capacity planning om
 
Capacity planning
Capacity planningCapacity planning
Capacity planning
 
Capacity Management
Capacity ManagementCapacity Management
Capacity Management
 
Ch11 strg.capacity mgt
Ch11 strg.capacity mgtCh11 strg.capacity mgt
Ch11 strg.capacity mgt
 
Ch11 strg.capacity+mgt
Ch11 strg.capacity+mgtCh11 strg.capacity+mgt
Ch11 strg.capacity+mgt
 
Capacity planning
Capacity planningCapacity planning
Capacity planning
 
Operations management chapter: capacity management
Operations management chapter: capacity managementOperations management chapter: capacity management
Operations management chapter: capacity management
 
Capacity Planning
Capacity PlanningCapacity Planning
Capacity Planning
 
Group 5 STRATEGY CAPACITY PLANNING (1).pptx
Group 5 STRATEGY CAPACITY PLANNING (1).pptxGroup 5 STRATEGY CAPACITY PLANNING (1).pptx
Group 5 STRATEGY CAPACITY PLANNING (1).pptx
 
Strategic capacity planning for products and services
Strategic capacity planning for products and servicesStrategic capacity planning for products and services
Strategic capacity planning for products and services
 
Process
ProcessProcess
Process
 
Reading 3 Strategic Capacity Management.pdf
Reading 3 Strategic Capacity Management.pdfReading 3 Strategic Capacity Management.pdf
Reading 3 Strategic Capacity Management.pdf
 
HOW TO PERFORM A MANUFACTURING CAPACITY ANALYSIS.pptx
HOW TO PERFORM A MANUFACTURING CAPACITY ANALYSIS.pptxHOW TO PERFORM A MANUFACTURING CAPACITY ANALYSIS.pptx
HOW TO PERFORM A MANUFACTURING CAPACITY ANALYSIS.pptx
 
capacity planning class notes.ppt
capacity planning class notes.pptcapacity planning class notes.ppt
capacity planning class notes.ppt
 
CHAPTER 3 System and design Capacity.pptx
CHAPTER 3 System and design Capacity.pptxCHAPTER 3 System and design Capacity.pptx
CHAPTER 3 System and design Capacity.pptx
 
Operations management1
Operations management1Operations management1
Operations management1
 
Beck Manufacturing and Plant CapacityRead the Beck Manufacturin.docx
Beck Manufacturing and Plant CapacityRead the Beck Manufacturin.docxBeck Manufacturing and Plant CapacityRead the Beck Manufacturin.docx
Beck Manufacturing and Plant CapacityRead the Beck Manufacturin.docx
 
3. capacity planning
3. capacity planning3. capacity planning
3. capacity planning
 

More from amanuel236786

CH-2.2 Developing Project Charter and Baseline Project Plan.ppt
CH-2.2 Developing Project Charter and Baseline Project Plan.pptCH-2.2 Developing Project Charter and Baseline Project Plan.ppt
CH-2.2 Developing Project Charter and Baseline Project Plan.ppt
amanuel236786
 
CH-2.1 Conceptualizing and Initializing the IT Project.ppt
CH-2.1 Conceptualizing and Initializing the IT Project.pptCH-2.1 Conceptualizing and Initializing the IT Project.ppt
CH-2.1 Conceptualizing and Initializing the IT Project.ppt
amanuel236786
 
CH 3- The Human Side of Project Management.ppt
CH 3- The Human Side of Project Management.pptCH 3- The Human Side of Project Management.ppt
CH 3- The Human Side of Project Management.ppt
amanuel236786
 
Chapter 4 Product and Service Design.pptx
Chapter 4 Product and Service Design.pptxChapter 4 Product and Service Design.pptx
Chapter 4 Product and Service Design.pptx
amanuel236786
 

More from amanuel236786 (20)

Chapter 5(five).pdf
Chapter 5(five).pdfChapter 5(five).pdf
Chapter 5(five).pdf
 
CH-2.2 Developing Project Charter and Baseline Project Plan.ppt
CH-2.2 Developing Project Charter and Baseline Project Plan.pptCH-2.2 Developing Project Charter and Baseline Project Plan.ppt
CH-2.2 Developing Project Charter and Baseline Project Plan.ppt
 
CH-2.1 Conceptualizing and Initializing the IT Project.ppt
CH-2.1 Conceptualizing and Initializing the IT Project.pptCH-2.1 Conceptualizing and Initializing the IT Project.ppt
CH-2.1 Conceptualizing and Initializing the IT Project.ppt
 
CH 3- The Human Side of Project Management.ppt
CH 3- The Human Side of Project Management.pptCH 3- The Human Side of Project Management.ppt
CH 3- The Human Side of Project Management.ppt
 
Chapter 4 Product and Service Design.pptx
Chapter 4 Product and Service Design.pptxChapter 4 Product and Service Design.pptx
Chapter 4 Product and Service Design.pptx
 
Chapter 4 Product and Service Design.ppt
Chapter 4 Product and Service Design.pptChapter 4 Product and Service Design.ppt
Chapter 4 Product and Service Design.ppt
 
CH-1 Introduction to OM.ppt
CH-1 Introduction to OM.pptCH-1 Introduction to OM.ppt
CH-1 Introduction to OM.ppt
 
CH 3 Quality management and Control.pptx
CH 3 Quality management and Control.pptxCH 3 Quality management and Control.pptx
CH 3 Quality management and Control.pptx
 
CH 3 Quality management and Control.ppt
CH 3 Quality management and Control.pptCH 3 Quality management and Control.ppt
CH 3 Quality management and Control.ppt
 
CH 2 Operations Strategy New 2013.pptx
CH 2 Operations Strategy New 2013.pptxCH 2 Operations Strategy New 2013.pptx
CH 2 Operations Strategy New 2013.pptx
 
Chapter-7 Job Design and Work Measurement Final.pptx
Chapter-7 Job Design and Work Measurement Final.pptxChapter-7 Job Design and Work Measurement Final.pptx
Chapter-7 Job Design and Work Measurement Final.pptx
 
CHAPTER-6 Facility Location and Layout 1.pptx
CHAPTER-6 Facility Location and Layout 1.pptxCHAPTER-6 Facility Location and Layout 1.pptx
CHAPTER-6 Facility Location and Layout 1.pptx
 
Chapter-5 Process Selection New.pptx
Chapter-5 Process Selection New.pptxChapter-5 Process Selection New.pptx
Chapter-5 Process Selection New.pptx
 
Chapter-4 Product and Service Design.pptx
Chapter-4 Product and Service Design.pptxChapter-4 Product and Service Design.pptx
Chapter-4 Product and Service Design.pptx
 
CH-3 Quality management and Control.pptx
CH-3 Quality management and Control.pptxCH-3 Quality management and Control.pptx
CH-3 Quality management and Control.pptx
 
CH-2 Operations Strategy.pptx
CH-2 Operations Strategy.pptxCH-2 Operations Strategy.pptx
CH-2 Operations Strategy.pptx
 
CH-1 Introduction to OM.pptx
CH-1 Introduction to OM.pptxCH-1 Introduction to OM.pptx
CH-1 Introduction to OM.pptx
 
uml.pptx
uml.pptxuml.pptx
uml.pptx
 
Chapter 2.ppt
Chapter 2.pptChapter 2.ppt
Chapter 2.ppt
 
Lecture 4.pdf
Lecture 4.pdfLecture 4.pdf
Lecture 4.pdf
 

Recently uploaded

Seal of Good Local Governance (SGLG) 2024Final.pptx
Seal of Good Local Governance (SGLG) 2024Final.pptxSeal of Good Local Governance (SGLG) 2024Final.pptx
Seal of Good Local Governance (SGLG) 2024Final.pptx
negromaestrong
 
Gardella_PRCampaignConclusion Pitch Letter
Gardella_PRCampaignConclusion Pitch LetterGardella_PRCampaignConclusion Pitch Letter
Gardella_PRCampaignConclusion Pitch Letter
MateoGardella
 
1029 - Danh muc Sach Giao Khoa 10 . pdf
1029 -  Danh muc Sach Giao Khoa 10 . pdf1029 -  Danh muc Sach Giao Khoa 10 . pdf
1029 - Danh muc Sach Giao Khoa 10 . pdf
QucHHunhnh
 

Recently uploaded (20)

PROCESS RECORDING FORMAT.docx
PROCESS      RECORDING        FORMAT.docxPROCESS      RECORDING        FORMAT.docx
PROCESS RECORDING FORMAT.docx
 
fourth grading exam for kindergarten in writing
fourth grading exam for kindergarten in writingfourth grading exam for kindergarten in writing
fourth grading exam for kindergarten in writing
 
Basic Civil Engineering first year Notes- Chapter 4 Building.pptx
Basic Civil Engineering first year Notes- Chapter 4 Building.pptxBasic Civil Engineering first year Notes- Chapter 4 Building.pptx
Basic Civil Engineering first year Notes- Chapter 4 Building.pptx
 
Mattingly "AI & Prompt Design: The Basics of Prompt Design"
Mattingly "AI & Prompt Design: The Basics of Prompt Design"Mattingly "AI & Prompt Design: The Basics of Prompt Design"
Mattingly "AI & Prompt Design: The Basics of Prompt Design"
 
Advance Mobile Application Development class 07
Advance Mobile Application Development class 07Advance Mobile Application Development class 07
Advance Mobile Application Development class 07
 
Presentation by Andreas Schleicher Tackling the School Absenteeism Crisis 30 ...
Presentation by Andreas Schleicher Tackling the School Absenteeism Crisis 30 ...Presentation by Andreas Schleicher Tackling the School Absenteeism Crisis 30 ...
Presentation by Andreas Schleicher Tackling the School Absenteeism Crisis 30 ...
 
Unit-IV- Pharma. Marketing Channels.pptx
Unit-IV- Pharma. Marketing Channels.pptxUnit-IV- Pharma. Marketing Channels.pptx
Unit-IV- Pharma. Marketing Channels.pptx
 
Unit-V; Pricing (Pharma Marketing Management).pptx
Unit-V; Pricing (Pharma Marketing Management).pptxUnit-V; Pricing (Pharma Marketing Management).pptx
Unit-V; Pricing (Pharma Marketing Management).pptx
 
Seal of Good Local Governance (SGLG) 2024Final.pptx
Seal of Good Local Governance (SGLG) 2024Final.pptxSeal of Good Local Governance (SGLG) 2024Final.pptx
Seal of Good Local Governance (SGLG) 2024Final.pptx
 
Explore beautiful and ugly buildings. Mathematics helps us create beautiful d...
Explore beautiful and ugly buildings. Mathematics helps us create beautiful d...Explore beautiful and ugly buildings. Mathematics helps us create beautiful d...
Explore beautiful and ugly buildings. Mathematics helps us create beautiful d...
 
Mehran University Newsletter Vol-X, Issue-I, 2024
Mehran University Newsletter Vol-X, Issue-I, 2024Mehran University Newsletter Vol-X, Issue-I, 2024
Mehran University Newsletter Vol-X, Issue-I, 2024
 
Sports & Fitness Value Added Course FY..
Sports & Fitness Value Added Course FY..Sports & Fitness Value Added Course FY..
Sports & Fitness Value Added Course FY..
 
Web & Social Media Analytics Previous Year Question Paper.pdf
Web & Social Media Analytics Previous Year Question Paper.pdfWeb & Social Media Analytics Previous Year Question Paper.pdf
Web & Social Media Analytics Previous Year Question Paper.pdf
 
Application orientated numerical on hev.ppt
Application orientated numerical on hev.pptApplication orientated numerical on hev.ppt
Application orientated numerical on hev.ppt
 
Introduction to Nonprofit Accounting: The Basics
Introduction to Nonprofit Accounting: The BasicsIntroduction to Nonprofit Accounting: The Basics
Introduction to Nonprofit Accounting: The Basics
 
Gardella_PRCampaignConclusion Pitch Letter
Gardella_PRCampaignConclusion Pitch LetterGardella_PRCampaignConclusion Pitch Letter
Gardella_PRCampaignConclusion Pitch Letter
 
Código Creativo y Arte de Software | Unidad 1
Código Creativo y Arte de Software | Unidad 1Código Creativo y Arte de Software | Unidad 1
Código Creativo y Arte de Software | Unidad 1
 
1029 - Danh muc Sach Giao Khoa 10 . pdf
1029 -  Danh muc Sach Giao Khoa 10 . pdf1029 -  Danh muc Sach Giao Khoa 10 . pdf
1029 - Danh muc Sach Giao Khoa 10 . pdf
 
Grant Readiness 101 TechSoup and Remy Consulting
Grant Readiness 101 TechSoup and Remy ConsultingGrant Readiness 101 TechSoup and Remy Consulting
Grant Readiness 101 TechSoup and Remy Consulting
 
Paris 2024 Olympic Geographies - an activity
Paris 2024 Olympic Geographies - an activityParis 2024 Olympic Geographies - an activity
Paris 2024 Olympic Geographies - an activity
 

Chapter-8 Capacity Planning, Aggregate Planning and Scheduling.pptx

  • 1. Operations Management For Competitive Advantage ©The McGraw-Hill Companies, Inc., 2001 CHASE AQUILANO JACOBS ninth edition 1 CHAPTER 8 STRATEGIC CAPACITY MANAGEMENT, AGGREGATE PLANNING AND SCHEDULING Kahsu Mebrahtu (Asst. Prof.) Mekelle University College of Business and Economics Department of Management Postgraduate Program (MBA) ninth edition
  • 2. Operations Management For Competitive Advantage ©The McGraw-Hill Companies, Inc., 2001 CHASE AQUILANO JACOBS ninth edition 2 Part I: Strategic Capacity Planning  Strategic Capacity Planning Defined  Capacity Utilization & Best Operating Level  Economies & Diseconomies of Scale  Capacity Focus, Flexibility & Planning  Determining Capacity Requirements
  • 3. Operations Management For Competitive Advantage ©The McGraw-Hill Companies, Inc., 2001 CHASE AQUILANO JACOBS ninth edition 3 Strategic Capacity Planning Defined  Capacity can be defined as the ability to hold, receive, store, or accommodate.  Capacity is the maximum capability to produce .  It can be measured as units of output, amount of birr, hour of work, or number of customers processed over a specified time  Or the amount of output that a system is capable achieving over a specific period of time .
  • 4. Operations Management For Competitive Advantage ©The McGraw-Hill Companies, Inc., 2001 CHASE AQUILANO JACOBS ninth edition 4 Examples  The number of automobiles produced in a shift The number of customers served in restaurant in a given time The number of students in a class etc.
  • 5. Operations Management For Competitive Advantage ©The McGraw-Hill Companies, Inc., 2001 CHASE AQUILANO JACOBS ninth edition 5 Time Durations for capacity Planning o Long range planning: greater than one year. Eg. Building, equipment, or facilities oIntermediate range planning: monthly or quarterly plans for the next 6 to 18 months . Eg. Hiring, layoffs , new tools , subcontracting oShort Range Planning: less than one month Eg. Weekly or daily scheduling process
  • 6. Operations Management For Competitive Advantage ©The McGraw-Hill Companies, Inc., 2001 CHASE AQUILANO JACOBS ninth edition 6 Capacity Planning  Capacity planning- is the long-term strategic decision that establishes a firm’s overall level resources  Strategic capacity planning is an approach for determining the overall capacity level of capital intensive resources, including facilities, equipment, and overall labor force size.
  • 7. Operations Management For Competitive Advantage ©The McGraw-Hill Companies, Inc., 2001 CHASE AQUILANO JACOBS ninth edition 7 Copyright 2006 John Wiley & Sons, Inc. 6-7 Capacity Expansion Strategies
  • 8. Operations Management For Competitive Advantage ©The McGraw-Hill Companies, Inc., 2001 CHASE AQUILANO JACOBS ninth edition 8 Type of capacity  1. Rated capacity(Designed capacity) –the theoretical output that could be attained if a process were operated at full speed without interruption, exceptions or downtime .  2. Effective capacity- takes into account the efficiency with which a particular product or customer can be processed, and the utilization of the scheduled hours or work.
  • 9. Operations Management For Competitive Advantage ©The McGraw-Hill Companies, Inc., 2001 CHASE AQUILANO JACOBS ninth edition 9  Effective daily capacity=(no. of machines or workers ) X (hours per shift)x(no. of shifts) x(utilization)x(efficiency)  Utilization-refers to the percentage of available working time that a worker actually works or a machine actually runs.  Efficiency-refers to how well a machine or worker performs compared to a standard output level.
  • 10. Operations Management For Competitive Advantage ©The McGraw-Hill Companies, Inc., 2001 CHASE AQUILANO JACOBS ninth edition 10 Capacity Utilization  Capacity used – rate of output actually achieved  Best operating level – capacity for which the process was designed ( or the volume of output at which average unit cost is minimized)  Capacity utilization rate = Capacity used x 100 Best operating level
  • 11. Operations Management For Competitive Advantage ©The McGraw-Hill Companies, Inc., 2001 CHASE AQUILANO JACOBS ninth edition 11 Best Operating Level Underutilization Best Operating Level Average unit cost of output Volume Overutilization
  • 12. Operations Management For Competitive Advantage ©The McGraw-Hill Companies, Inc., 2001 CHASE AQUILANO JACOBS ninth edition 12 Example of Capacity Utilization  During one week of production, a plant produced 83 units of a product. Its historic highest or best utilization recorded was 120 units per week. What is this plant’s capacity utilization rate?  Answer: Capacity utilization rate = Capacity used . Best operating level = 83/120 =0.69 or 69%
  • 13. Operations Management For Competitive Advantage ©The McGraw-Hill Companies, Inc., 2001 CHASE AQUILANO JACOBS ninth edition 13 Capacity Planning-  Frequency of Capacity Additions  External Sources of Capacity
  • 14. Operations Management For Competitive Advantage ©The McGraw-Hill Companies, Inc., 2001 CHASE AQUILANO JACOBS ninth edition 14 Determining Capacity Requirements  Forecast sales within each individual product line.  Calculate equipment and labor requirements to meet the forecasts.  Project equipment and labor availability over the planning horizon.
  • 15. Operations Management For Competitive Advantage ©The McGraw-Hill Companies, Inc., 2001 CHASE AQUILANO JACOBS ninth edition 15 Example of Capacity Requirements A manufacturer produces two lines of mustard, Fancy Fine and Generic line. Each is sold in small and family-size plastic bottles. The following table shows forecast demand for the next four years. Year: 1 2 3 4 FancyFine Small (000s) 50 60 80 100 Family (000s) 35 50 70 90 Generic Small (000s) 100 110 120 140 Family (000s) 80 90 100 110
  • 16. Operations Management For Competitive Advantage ©The McGraw-Hill Companies, Inc., 2001 CHASE AQUILANO JACOBS ninth edition 16 Example of Capacity Requirements: The Product from a Capacity Viewpoint  Question: Are we really producing two different types of mustards from the standpoint of capacity requirements?  Answer: No, it’s the same product just packaged differently.
  • 17. Operations Management For Competitive Advantage ©The McGraw-Hill Companies, Inc., 2001 CHASE AQUILANO JACOBS ninth edition 17 Example of Capacity Requirements: Equipment and Labor Requirements Year: 1 2 3 4 Small (000s) 150 170 200 240 Family (000s) 115 140 170 200 Three 100,000 units-per-year machines are available for small-bottle production. Two operators required per machine. Two 120,000 units-per-year machines are available for family-sized-bottle production. Three operators required per machine.
  • 18. Year: 1 2 3 4 Small (000s) 150 170 200 240 Family (000s) 115 140 170 200 Small Mach. Cap. 300,000 Labor 6 Family-size Mach. Cap. 240,000 Labor 6 Small Percent capacity used 50.00% Machine requirement 1.50 Labor requirement 3.00 Family-size Percent capacity used 47.92% Machine requirement 0.96 Labor requirement 2.88 Question: What are the Year 1 values for capacity, machine, and labor? 150,000/300,000=50% At 1 machine for 100,000, it takes 1.5 machines for 150,000 At 2 operators for 100,000, it takes 3 operators for 150,000 ©The McGraw-Hill Companies, Inc., 2001 18
  • 19. Operations Management For Competitive Advantage ©The McGraw-Hill Companies, Inc., 2001 CHASE AQUILANO JACOBS ninth edition 19 Cont… For Small size: Year I • Percent capacity used=Actual capacity/Designed capacity = 150,000/300000 =50% •Machine Requirement = Actual capacity/Designed capacity per year machines = 150,000units/100,000 units/machine = 1.5 machines • Labor requirement= Number of operators*Actual capacity/Designed capacity per machine = 2 operators*150,000 units/100,000units = 3 operators or machine requirement*number of operators=1.5*2=3 oper.
  • 20. Operations Management For Competitive Advantage ©The McGraw-Hill Companies, Inc., 2001 CHASE AQUILANO JACOBS ninth edition 20 Cont… For family size : Year I • Percent capacity used=Actual capacity/Designed capacity = 115,000/240,000 =47.92% •Machine Requirement = Actual capacity/Designed capacity per year machines = 115,000units/120,000 units/machine = 0.96 machines • Labor requirement=machine requirement*number of operators = .96machines*3 operators = 2.88 operators
  • 21. Year: 1 2 3 4 Small (000s) 150 170 200 240 Family (000s) 115 140 170 200 Small Mach. Cap. 300,000 Labor 6 Family-size Mach. Cap. 240,000 Labor 6 Small Percent capacity used 50.00% Machine requirement 1.50 Labor requirement 3.00 Family-size Percent capacity used 47.92% Machine requirement 0.96 Labor requirement 2.88 Question: What are the values for columns 2, 3 and 4 in the table below? 56.67% 1.70 3.40 58.33% 1.17 3.50 66.67% 2.00 4.00 70.83% 1.42 4.25 80.00% 2.40 4.80 83.33% 1.67 5.00 21 ©The McGraw-Hill Companies, Inc., 2001
  • 22. Operations Management For Competitive Advantage ©The McGraw-Hill Companies, Inc., 2001 CHASE AQUILANO JACOBS ninth edition 22 Home work/Reading Assignment •Read and understand the different techniques of demand forecasting •Read about the use of decision tree as a method of capacity choice
  • 23. Operations Management For Competitive Advantage ©The McGraw-Hill Companies, Inc., 2001 CHASE AQUILANO JACOBS ninth edition 23 PART II: Aggregate Planning  Operations Planning Overview  Aggregate production planning  Examples: Chase and Level strategies
  • 24. Operations Management For Competitive Advantage ©The McGraw-Hill Companies, Inc., 2001 CHASE AQUILANO JACOBS ninth edition 24 What is Aggregate Planning ? • Aggregate planning is an attempt to balance capacity and demand in ways that costs are minimized . • The term “aggregate “ is used because planning at this level includes all resources , e.g product line or product family . •The aggregate resources could be total number of workers , hours of machine time , tons of raw materials .
  • 25. Operations Management For Competitive Advantage ©The McGraw-Hill Companies, Inc., 2001 CHASE AQUILANO JACOBS ninth edition 25  Meet demand (Sales Forecast)  Use capacity efficiently  Meet inventory policy  Minimize cost – Labor – Inventory – Plant & equipment – Subcontract Aggregate Planning Goals
  • 26. Operations Management For Competitive Advantage ©The McGraw-Hill Companies, Inc., 2001 CHASE AQUILANO JACOBS ninth edition 26 Aggregate Planning Strategies Pure Strategies Demand Options — change demand: (options to increase demand  Pricing (e.g. change price)  Promotion –advertising, direct marketing  backordering during high demand periods  New demand creation-a new , but complementary demand is created for a product or service .E.g. in restaurant customers may demand the bar services due to high waiting time .
  • 27. Operations Management For Competitive Advantage ©The McGraw-Hill Companies, Inc., 2001 CHASE AQUILANO JACOBS ninth edition 27 Aggregate Planning Strategies Pure Strategies Capacity Options — change capacity: (options to increase or decrease capacity)  changing inventory levels  varying work force size by hiring or layoffs  varying production capacity through overtime or idle time  subcontracting (aka “outsourcing”)  using part-time workers
  • 28. Operations Management For Competitive Advantage ©The McGraw-Hill Companies, Inc., 2001 CHASE AQUILANO JACOBS ninth edition 28 The Extremes Level Strategy Chase Strategy Production equals sales forecast Production rate is constant
  • 29. Operations Management For Competitive Advantage ©The McGraw-Hill Companies, Inc., 2001 CHASE AQUILANO JACOBS ninth edition 29  Level scheduling strategy – Produce same amount every day – Keep work force level constant – Vary non-work force capacity or demand options – Often results in lowest production costs  Chase scheduling strategy – Vary the amount of production to match (chase) the sales forecast – This requires changing the workforce (hiring & firing)  Mixed strategy – Combines 2 or more aggregate scheduling options Aggregate Planning Strategies
  • 30. Operations Management For Competitive Advantage ©The McGraw-Hill Companies, Inc., 2001 CHASE AQUILANO JACOBS ninth edition 30 The Trial & Error Approach to Aggregate Planning 1.Forecast the demand for each period 2. Determine the capacity for regular time, overtime, and subcontracting, for each period 2. Determine the labor costs, hiring and firing costs, and inventory holding costs 3. Consider company policies which may apply to the workers, overtime, outsourcing, or to inventory levels 4. Develop alternative plans, and examine their total costs
  • 31. Operations Management For Competitive Advantage ©The McGraw-Hill Companies, Inc., 2001 CHASE AQUILANO JACOBS ninth edition 31 .Kahsu Mebrahtu(Assistant Professor) Pure Strategies Hiring cost = Birr100 per worker Firing cost = Birr500 per worker Regular production cost per pound = Birr2.00 Inventory carrying cost = Birr0.50 per quarter Production per employee = 1,000 units per quarter Beginning work force = 100 workers QUARTER SALES FORECAST (LB) Spring 80,000 Summer 50,000 Fall 120,000 Winter 150,000 Example:
  • 32. Operations Management For Competitive Advantage ©The McGraw-Hill Companies, Inc., 2001 CHASE AQUILANO JACOBS ninth edition 32 .Kahsu Mebrahtu(Assistant Professor) Level Production Strategy Level production = 100,000 pounds (50,000 + 120,000 + 150,000 + 80,000) 4 Spring 80,000 100,000 20,000 Summer 50,000 100,000 70,000 Fall 120,000 100,000 50,000 Winter 150,000 100,000 0 400,000 140,000 Cost of Level Production Strategy (400,000 X Birr2.00) + (140,00 X Birr.50) = Birr870,000 SALES PRODUCTION QUARTER FORECAST PLAN INVENTORY
  • 33. Operations Management For Competitive Advantage ©The McGraw-Hill Companies, Inc., 2001 CHASE AQUILANO JACOBS ninth edition 33 .Kahsu Mebrahtu(Assistant Professor) Chase Demand Strategy Spring 80,000 80,000 80 0 20 Summer 50,000 50,000 50 0 30 Fall 120,000 120,000 120 70 0 Winter 150,000 150,000 150 30 0 100 50 SALES PRODUCTION WORKERS WORKERS WORKERS QUARTER FORECAST PLAN NEEDED HIRED FIRED Cost of Chase Demand Strategy (400,000 X Birr2.00) + (100 x Birr100) + (50 x Birr500) = Birr835,000
  • 34. Operations Management For Competitive Advantage ©The McGraw-Hill Companies, Inc., 2001 CHASE AQUILANO JACOBS ninth edition 34 Copyright 2006 John Wiley & Sons, Inc. 13-34 Mixed Strategy  Combination of Level Production and Chase Demand strategies  Examples of management policies – no more than x% of the workforce can be laid off in one quarter – inventory levels cannot exceed x dollars  Many industries may simply shut down manufacturing during the low demand season and schedule employee vacations during that time
  • 35. Operations Management For Competitive Advantage ©The McGraw-Hill Companies, Inc., 2001 CHASE AQUILANO JACOBS ninth edition 35 PART III .Operations Scheduling
  • 36. Operations Management For Competitive Advantage ©The McGraw-Hill Companies, Inc., 2001 CHASE AQUILANO JACOBS ninth edition 36 Work Center Defined  A work center is an area in a business in which productive resources are organized and work is completed.  May be a single machine, a group of machines, or an area where a particular type of work is done.
  • 37. Operations Management For Competitive Advantage ©The McGraw-Hill Companies, Inc., 2001 CHASE AQUILANO JACOBS ninth edition 37 Scheduling and Controlling Functions 1. Allocate orders , equipment, and personnel to work centers or other specified locations 2. Determining the sequence of order performance (that is establishing job priorities ) 3. Initiating performance of the scheduled work. This is commonly termed dispatching of orders ( This includes start date, Job# , description and run time ) 4. Shop floor control (or production activity control) involving: a. Reviewing the status and controlling the progress of orders as they are being worked on. b. Expediting late and critical orders
  • 38. Operations Management For Competitive Advantage ©The McGraw-Hill Companies, Inc., 2001 CHASE AQUILANO JACOBS ninth edition 38 Work-Center Scheduling Objectives  Meet due dates  Minimize lead time  Minimize setup time or cost  Minimize work-in-process inventory  Maximize machine utilization
  • 39. Operations Management For Competitive Advantage ©The McGraw-Hill Companies, Inc., 2001 CHASE AQUILANO JACOBS ninth edition 39 Priority Rules for Job Sequencing 1. First-come, first-served (FCFS) 2. Shortest operating time (SOT) 3. Earliest due date first 4. Earliest start date first (due date-lead time) 5. slack time remaining (STR) first: Time remaining before due date – the processing time remaining. Run the shortest STR first
  • 40. Operations Management For Competitive Advantage ©The McGraw-Hill Companies, Inc., 2001 CHASE AQUILANO JACOBS ninth edition 40 6. slack time remaining (per operation as opposed to per job) first. Run orders with shortest STR/OP. STR/OP= Time remaining - Remaining processing before due date Time________ Number of remaining operation 7. Smallest critical ratio (CR) first (due date-current date)/(number of days remaining) 8. Smallest queue ratio (QR) first (slack time remaining in schedule)/(planned remaining queue time) 9. Last come, first served (LCFS) 10. Random order or whim
  • 41. Operations Management For Competitive Advantage ©The McGraw-Hill Companies, Inc., 2001 CHASE AQUILANO JACOBS ninth edition 41 Schedule Performance Measures  Meeting due dates of customers or downstream operations.  Minimizing the flow time (the time a job spends in the process).  Minimizing work-in-process inventory.  Minimizing idle time of machines or workers.
  • 42. Operations Management For Competitive Advantage ©The McGraw-Hill Companies, Inc., 2001 CHASE AQUILANO JACOBS ninth edition 42 Example of Job Sequencing: First- Come First-Served Jobs (in order Processing Due Date Flow Time of arrival) Time (days) (days hence) (days) A 4 5 4 B 7 10 11 C 3 6 14 D 1 4 15 Answer: FCFS Schedule Jobs (in order Processing Due Date of arrival) Time (days) (days hence) A 4 5 B 7 10 C 3 6 D 1 4 Suppose you have the four jobs to the right arrive for processing on one machine. What is the FCFS schedule? Do all the jobs get done on time? No, Jobs B, C, and D are going to be late.
  • 43. Operations Management For Competitive Advantage ©The McGraw-Hill Companies, Inc., 2001 CHASE AQUILANO JACOBS ninth edition 43 Total Flow Time = 4+11+14+15= 44 days Mean Flow Time =44days/4jobs= 11days Average lateness/job=(0+1+8+11)/4jobs=5 days (i.e on the average a job will be late by 5 days )
  • 44. Operations Management For Competitive Advantage ©The McGraw-Hill Companies, Inc., 2001 CHASE AQUILANO JACOBS ninth edition 44 Example of Job Sequencing: Shortest Operating Time Jobs (in order Processing Due Date of arrival) Time (days) (days hence) A 4 5 B 7 10 C 3 6 D 1 4 Answer: Shortest Operating Time Schedule Jobs (in order Processing Due Date Flow Time of arrival) Time (days) (days hence) (days) D 1 4 1 C 3 6 4 A 4 5 8 B 7 10 15 Suppose you have the four jobs to the right arrive for processing on one machine. What is the SOT schedule? Do all the jobs get done on time? No, Jobs A and B are going to be late.
  • 45. Operations Management For Competitive Advantage ©The McGraw-Hill Companies, Inc., 2001 CHASE AQUILANO JACOBS ninth edition 45 Example of Job Sequencing: Last-Come First-Served Jobs (in order Processing Due Date of arrival) Time (days) (days hence) A 4 5 B 7 10 C 3 6 D 1 4 Answer: Last-Come First-Served Schedule Jobs (in order Processing Due Date Flow Time of arrival) Time (days) (days hence) (days) D 1 4 1 C 3 6 4 B 7 10 11 A 4 5 15 No, Jobs B and A are going to be late. Suppose you have the four jobs to the right arrive for processing on one machine. What is the LCFS schedule? Do all the jobs get done on time?
  • 46. Operations Management For Competitive Advantage ©The McGraw-Hill Companies, Inc., 2001 CHASE AQUILANO JACOBS ninth edition 46 Example of Job Sequencing: Earliest Due Date First Jobs (in order Processing Due Date of arrival) Time (days) (days hence) A 4 5 B 7 10 C 3 6 D 1 4 Answer: Earliest Due Date First Jobs (in order Processing Due Date Flow Time of arrival) Time (days) (days hence) (days) D 1 4 1 A 4 5 5 C 3 6 8 B 7 10 15 Suppose you have the four jobs to the right arrive for processing on one machine. What is the earliest due date first schedule? Do all the jobs get done on time? No, Jobs C and B are going to be late.
  • 47. Operations Management For Competitive Advantage ©The McGraw-Hill Companies, Inc., 2001 CHASE AQUILANO JACOBS ninth edition 47 Example of Job Sequencing: STR Jobs (in order Processing Due Date of arrival) Time (days) (days hence) A 4 5 B 7 10 C 3 6 D 1 4 Suppose you have the four jobs to the right arrive for processing on one machine. What is the CR schedule? Do all the jobs get done on time? No, Job D, C,and B will be late Answer: STR First Jobs (in order Processing Due Date Flow Time of arrival) Time (days) (days hence) (days) A 4 5 4 D 1 4 5 C 3 6 8 B 7 10 15
  • 48. Operations Management For Competitive Advantage ©The McGraw-Hill Companies, Inc., 2001 CHASE AQUILANO JACOBS ninth edition 48 Cont… STR= Time remaining before due date minus the processing time remaining For Job A=4-4= 0 Job B= 9-7=2 days Job C=5-3=2 days Job D=3-1=2 days Decision: Job A, Job D, Job C, and Job B based on the minimum operating time
  • 49. Operations Management For Competitive Advantage ©The McGraw-Hill Companies, Inc., 2001 CHASE AQUILANO JACOBS ninth edition 49 Comparison of Priority Rules Rule Total Completion Time(Days) Average Completion Time or Mean flow time (Days) Average Lateness(Days) FCFS 44 11 4.5 SOT 28 7 2 LCFS 31 7.75 2.75 EDDate 29 7.25 1.75 STR 32 8 2
  • 50. Operations Management For Competitive Advantage ©The McGraw-Hill Companies, Inc., 2001 CHASE AQUILANO JACOBS ninth edition 50 Reading Assignment : 1. Assignment Method 2. Employee Scheduling 3. Enterprise Resource Planning Systems