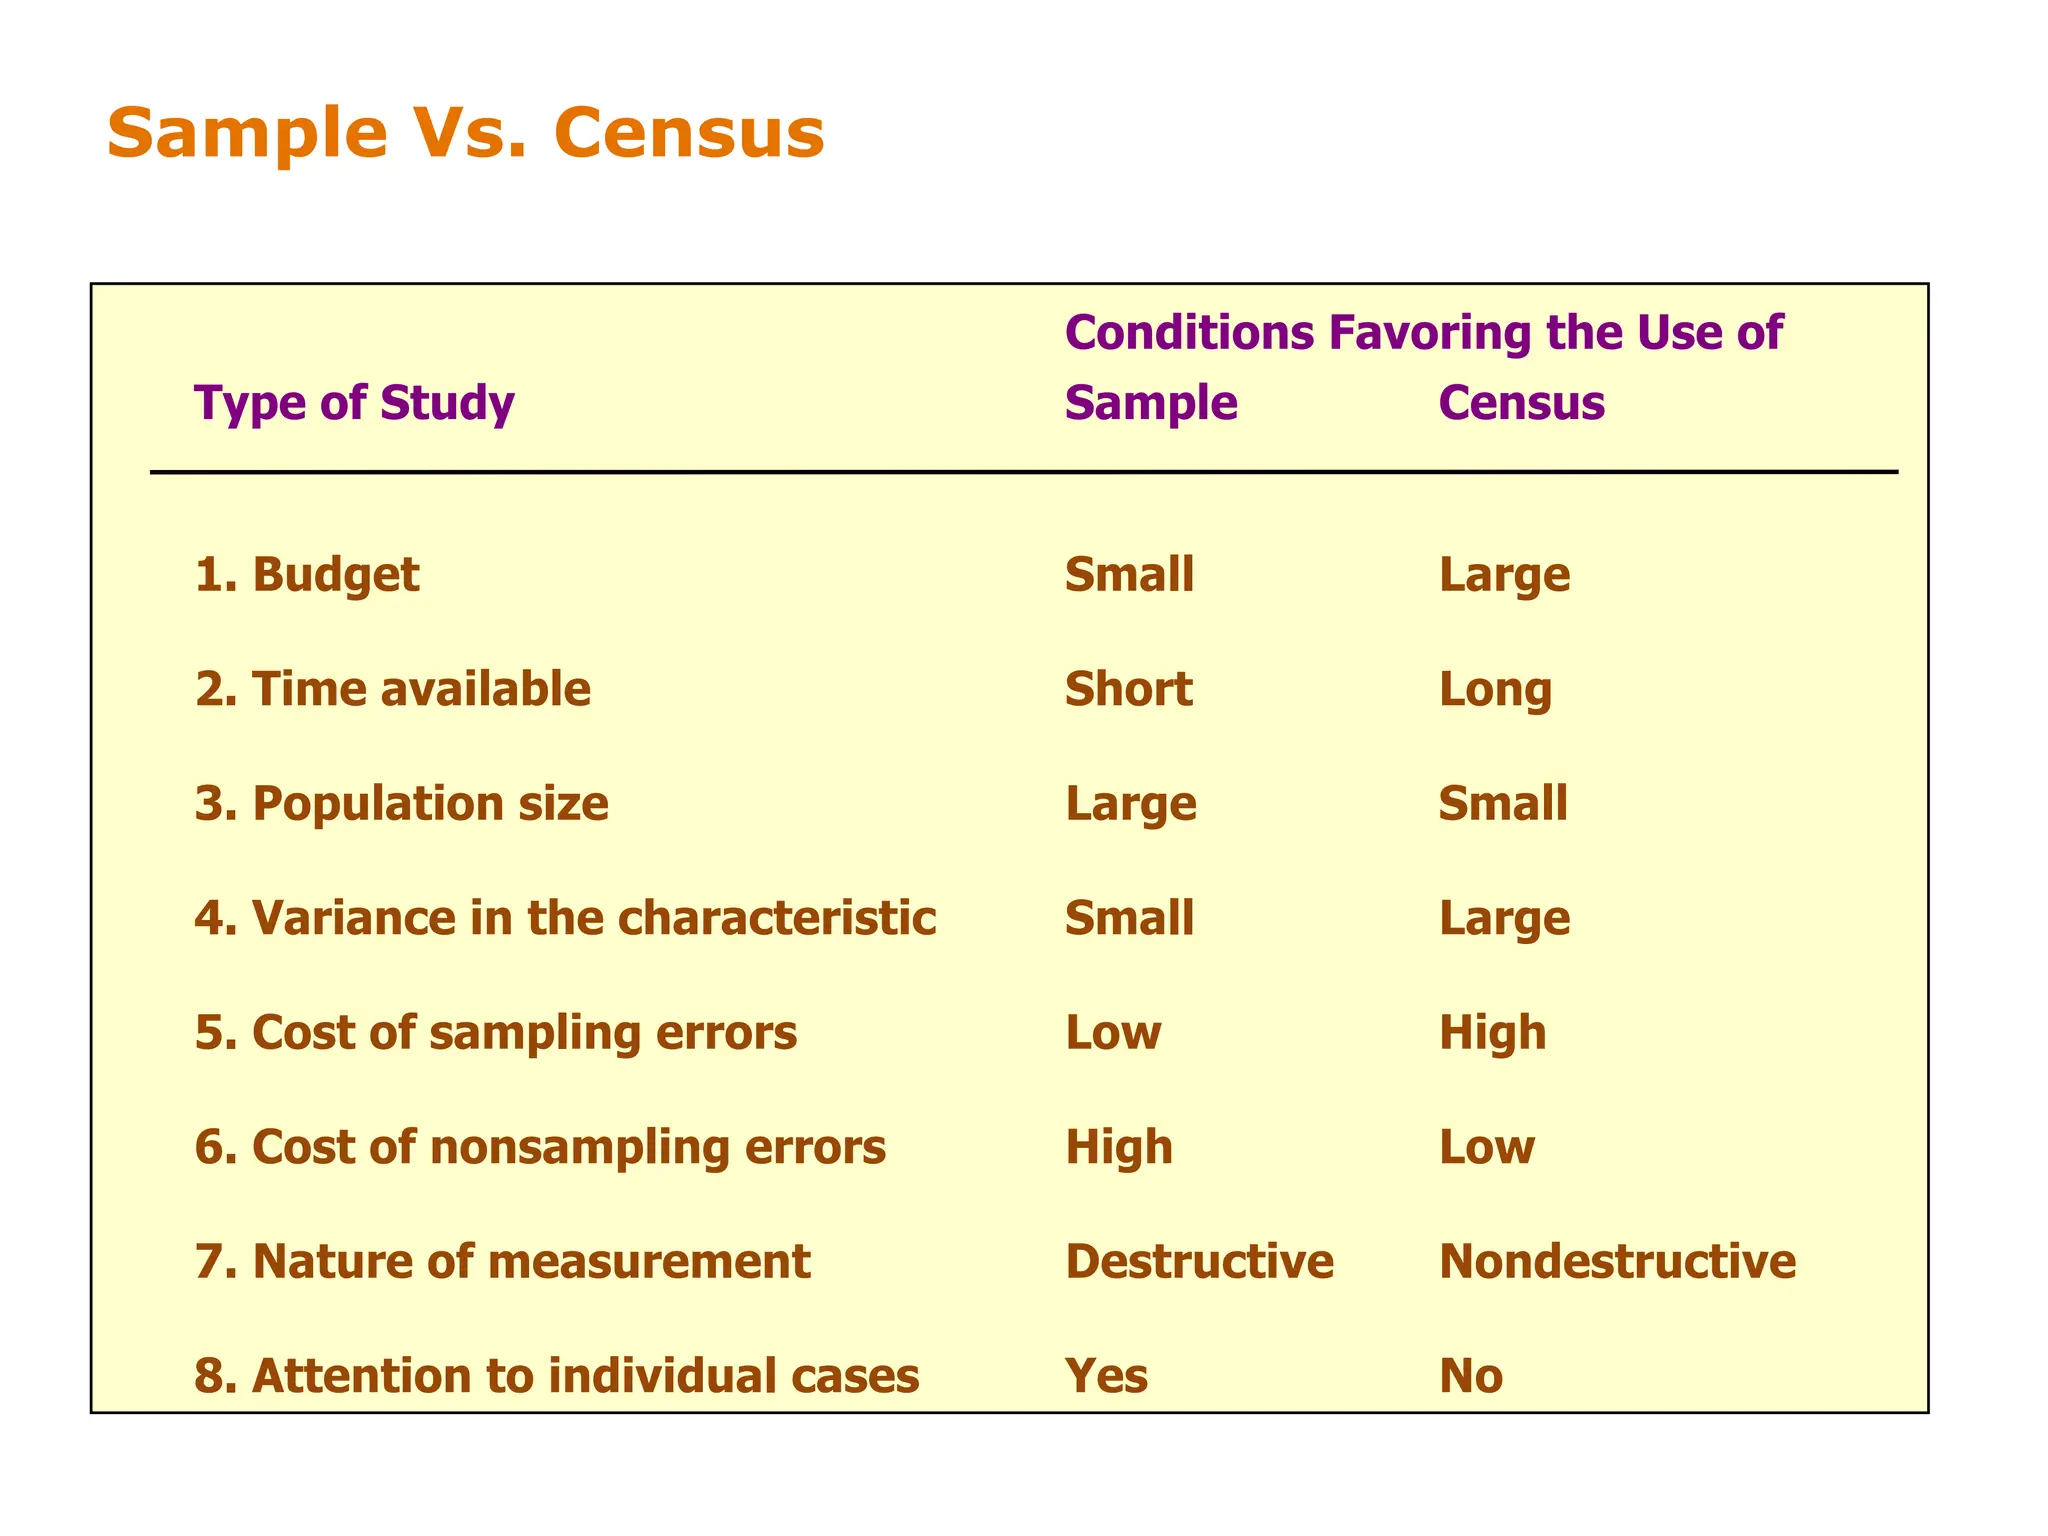
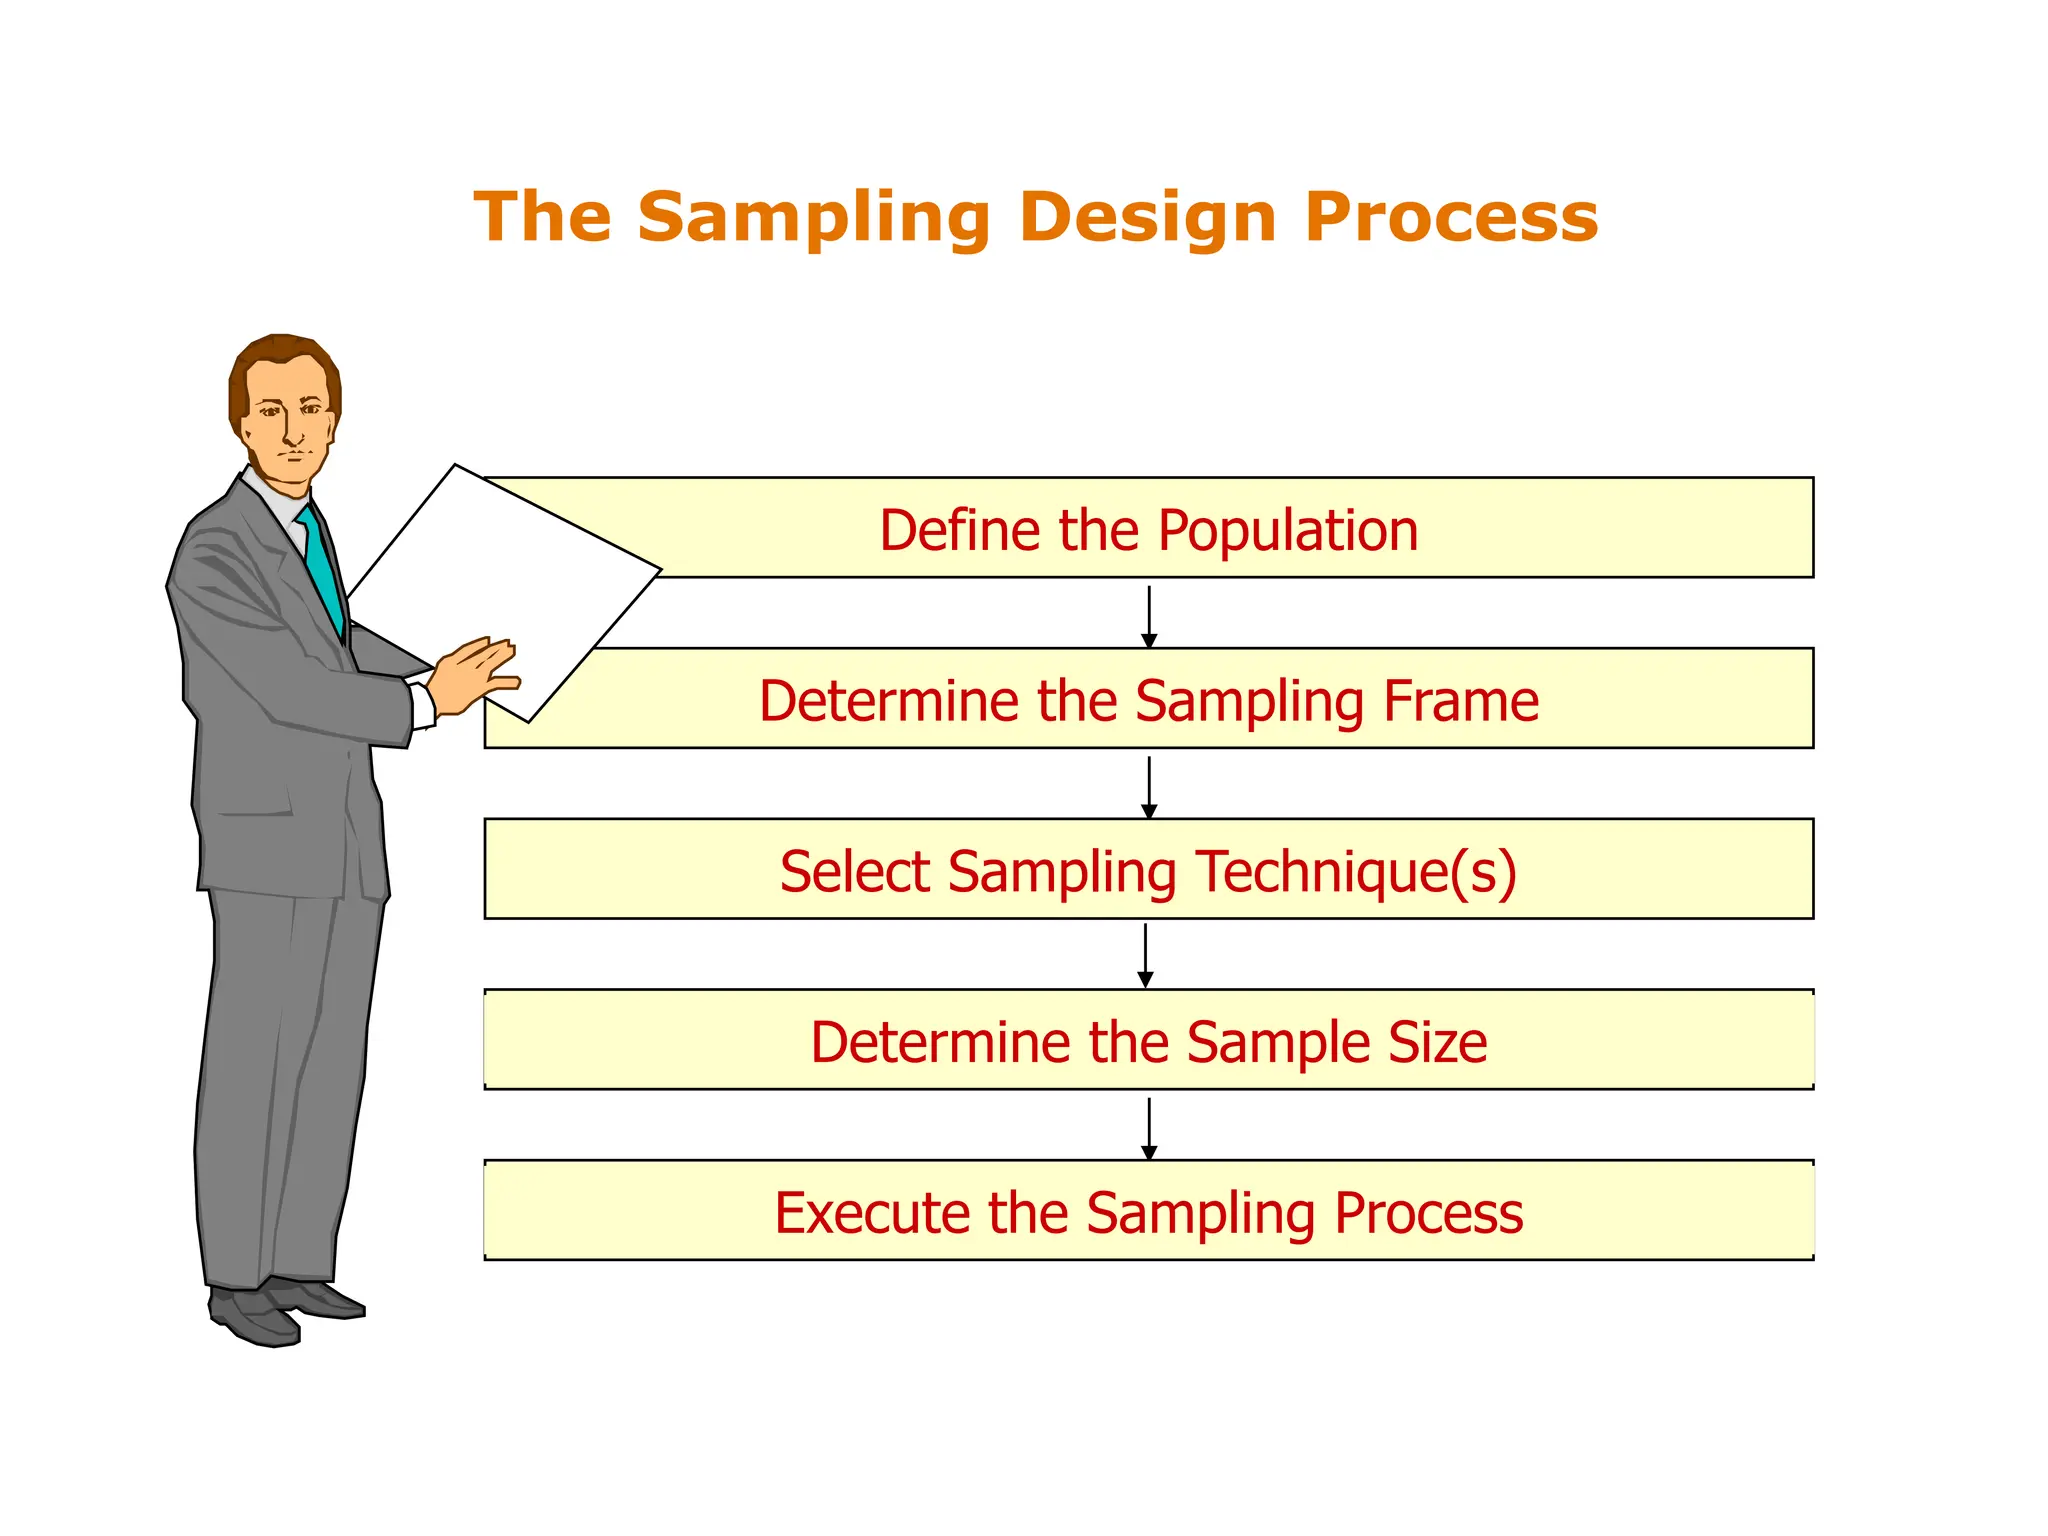
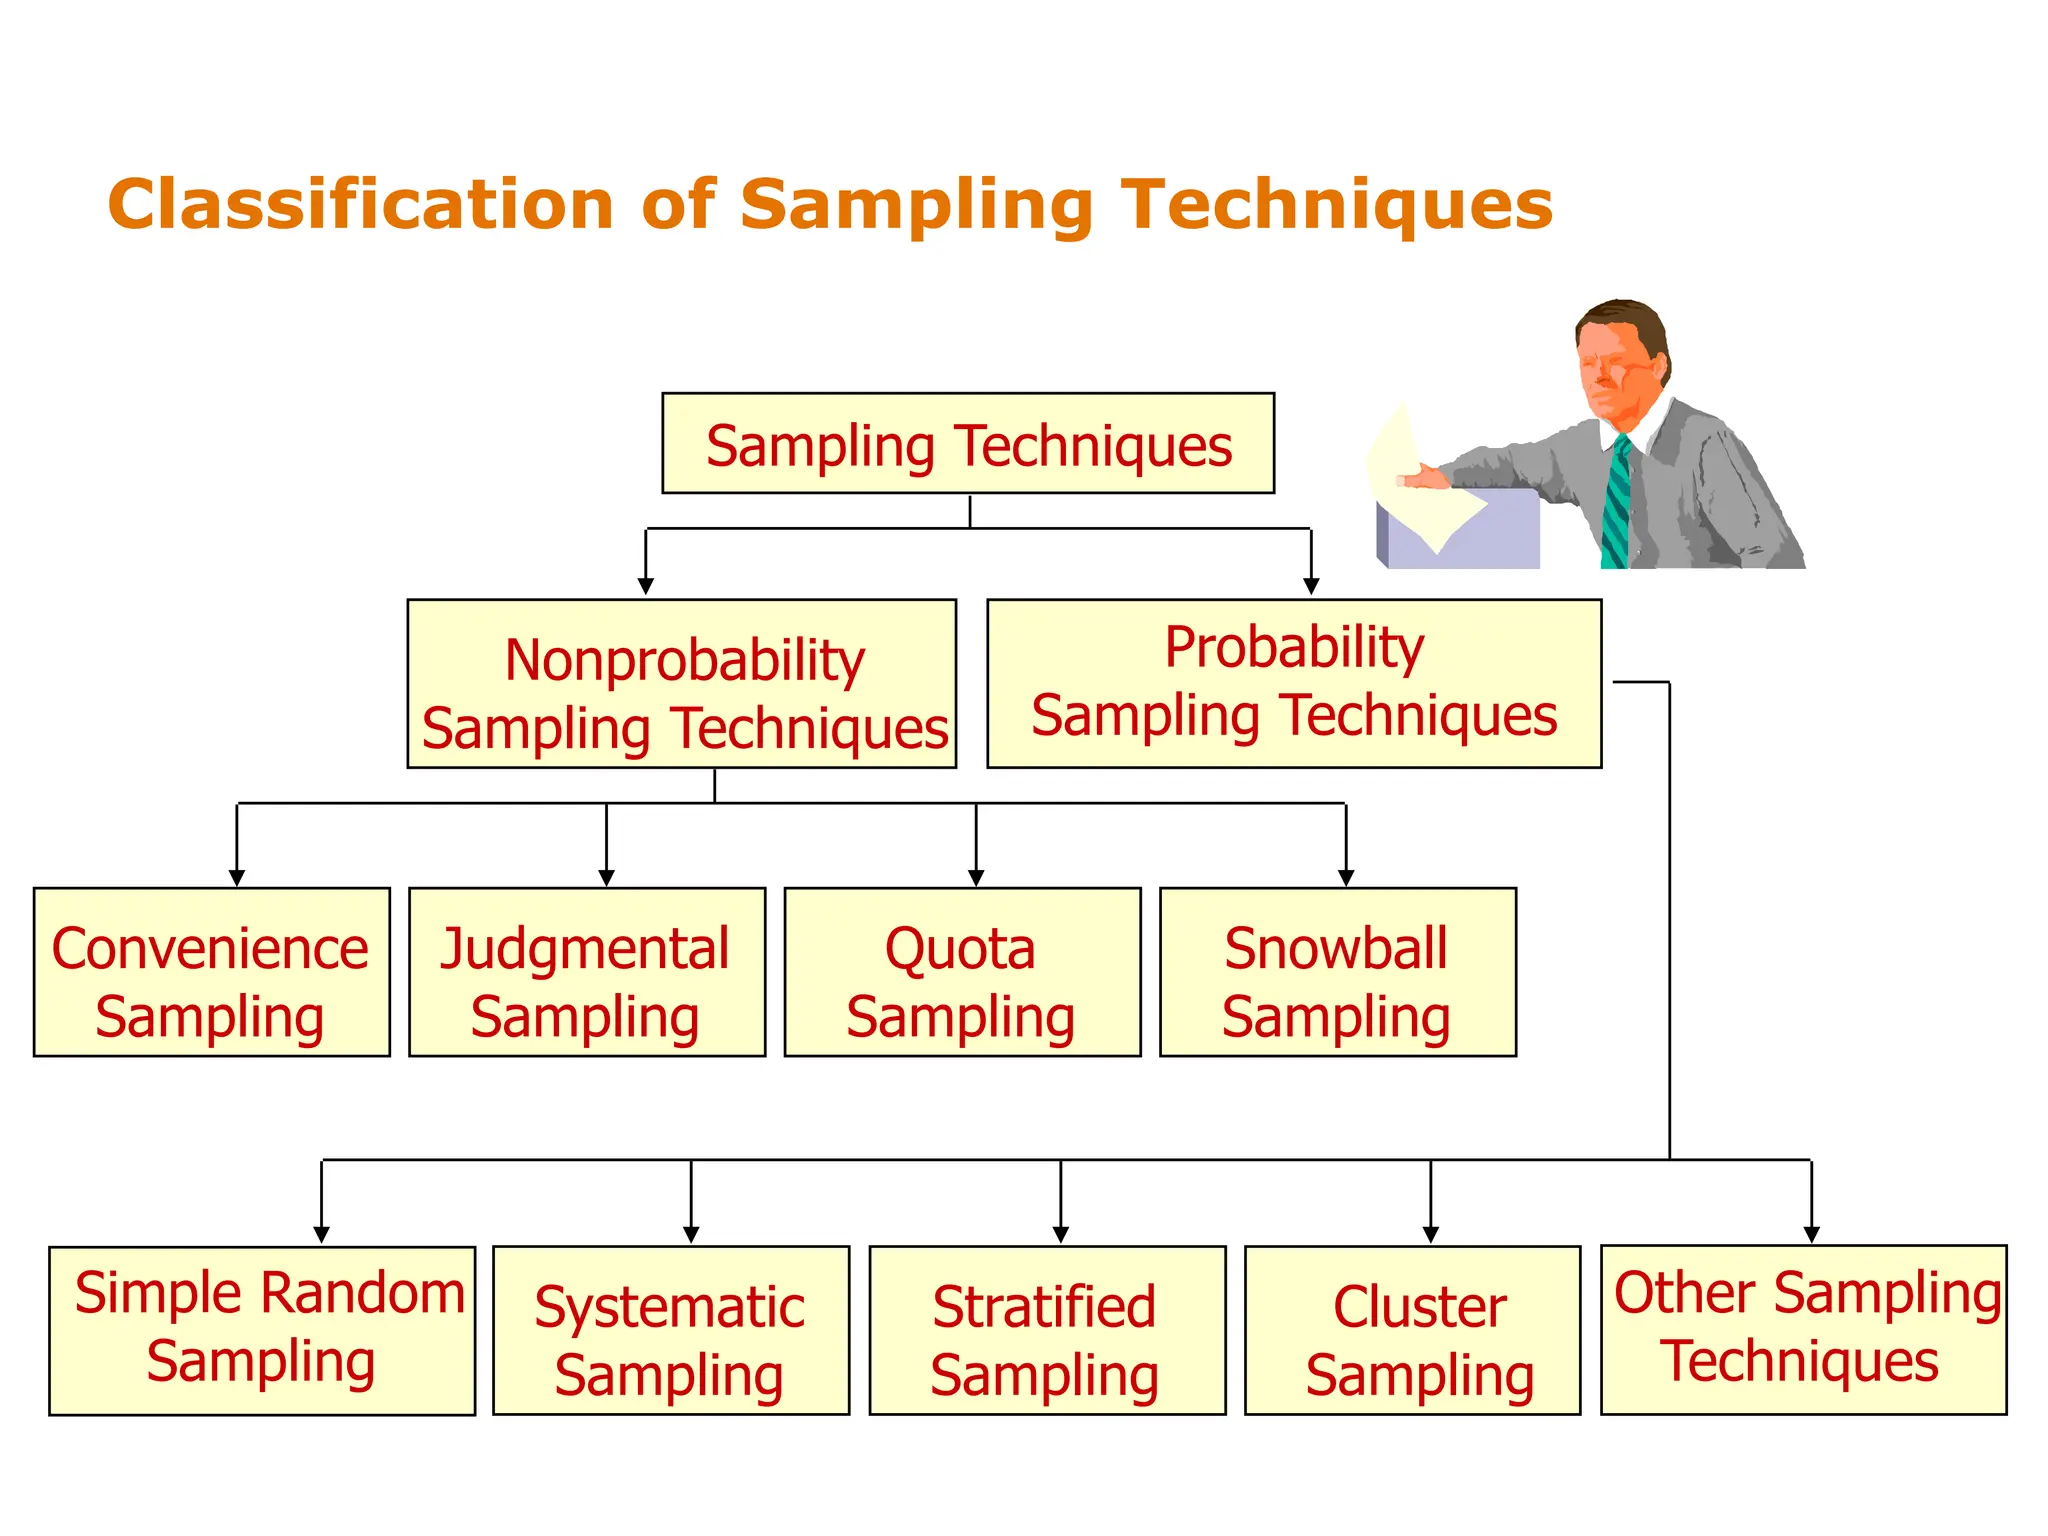
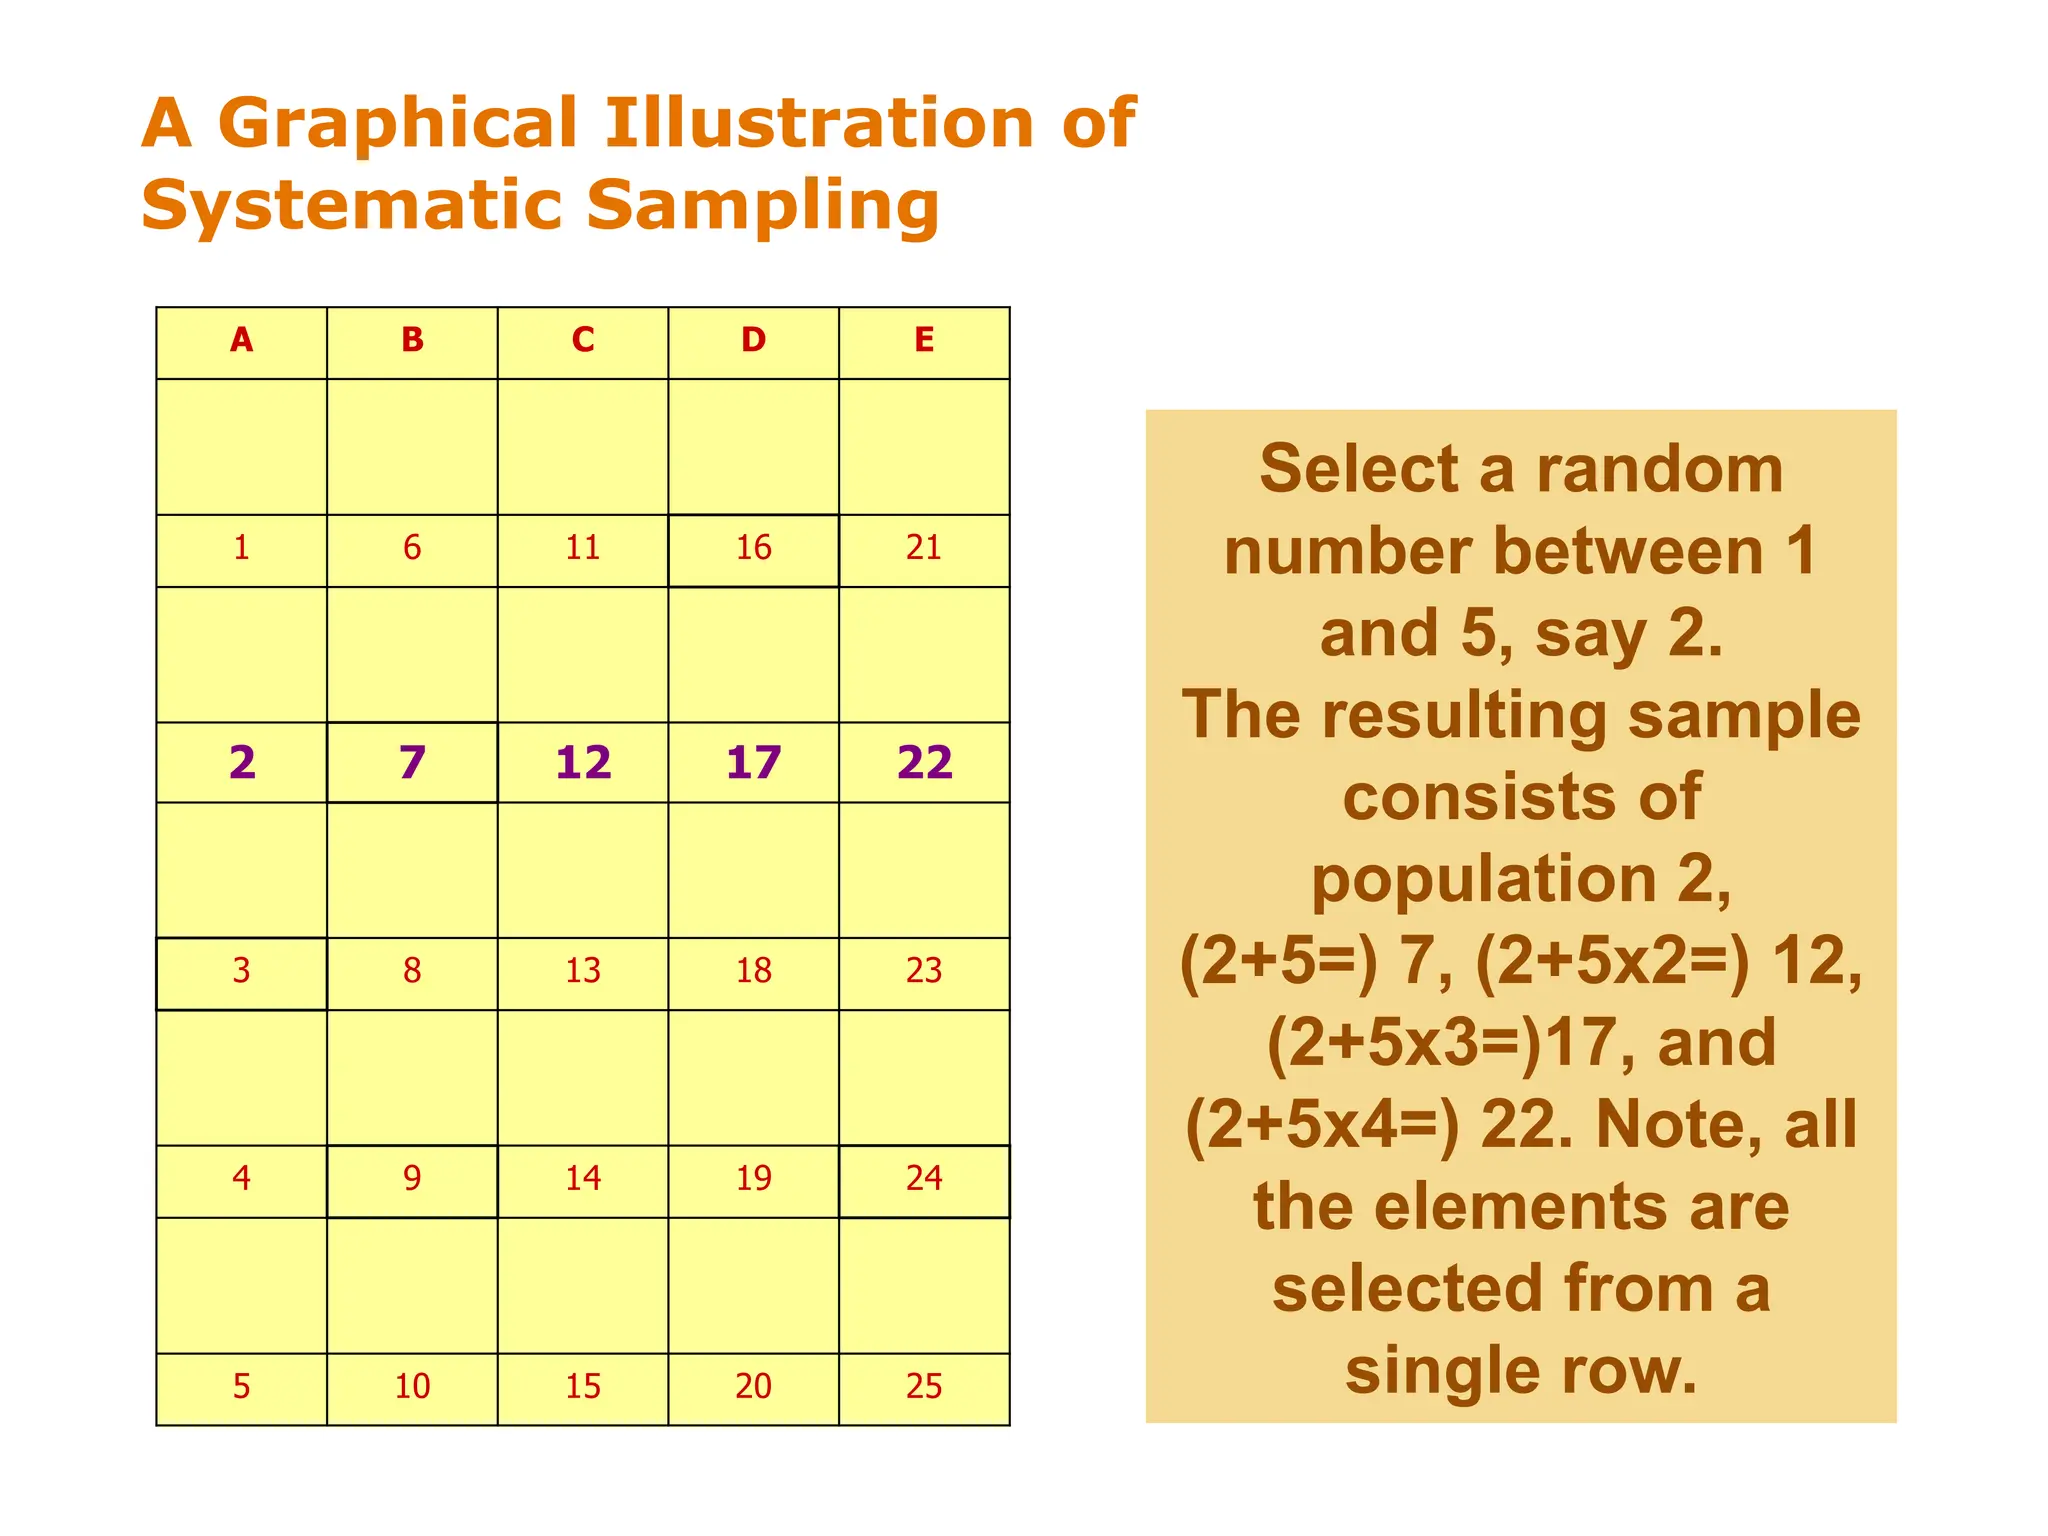
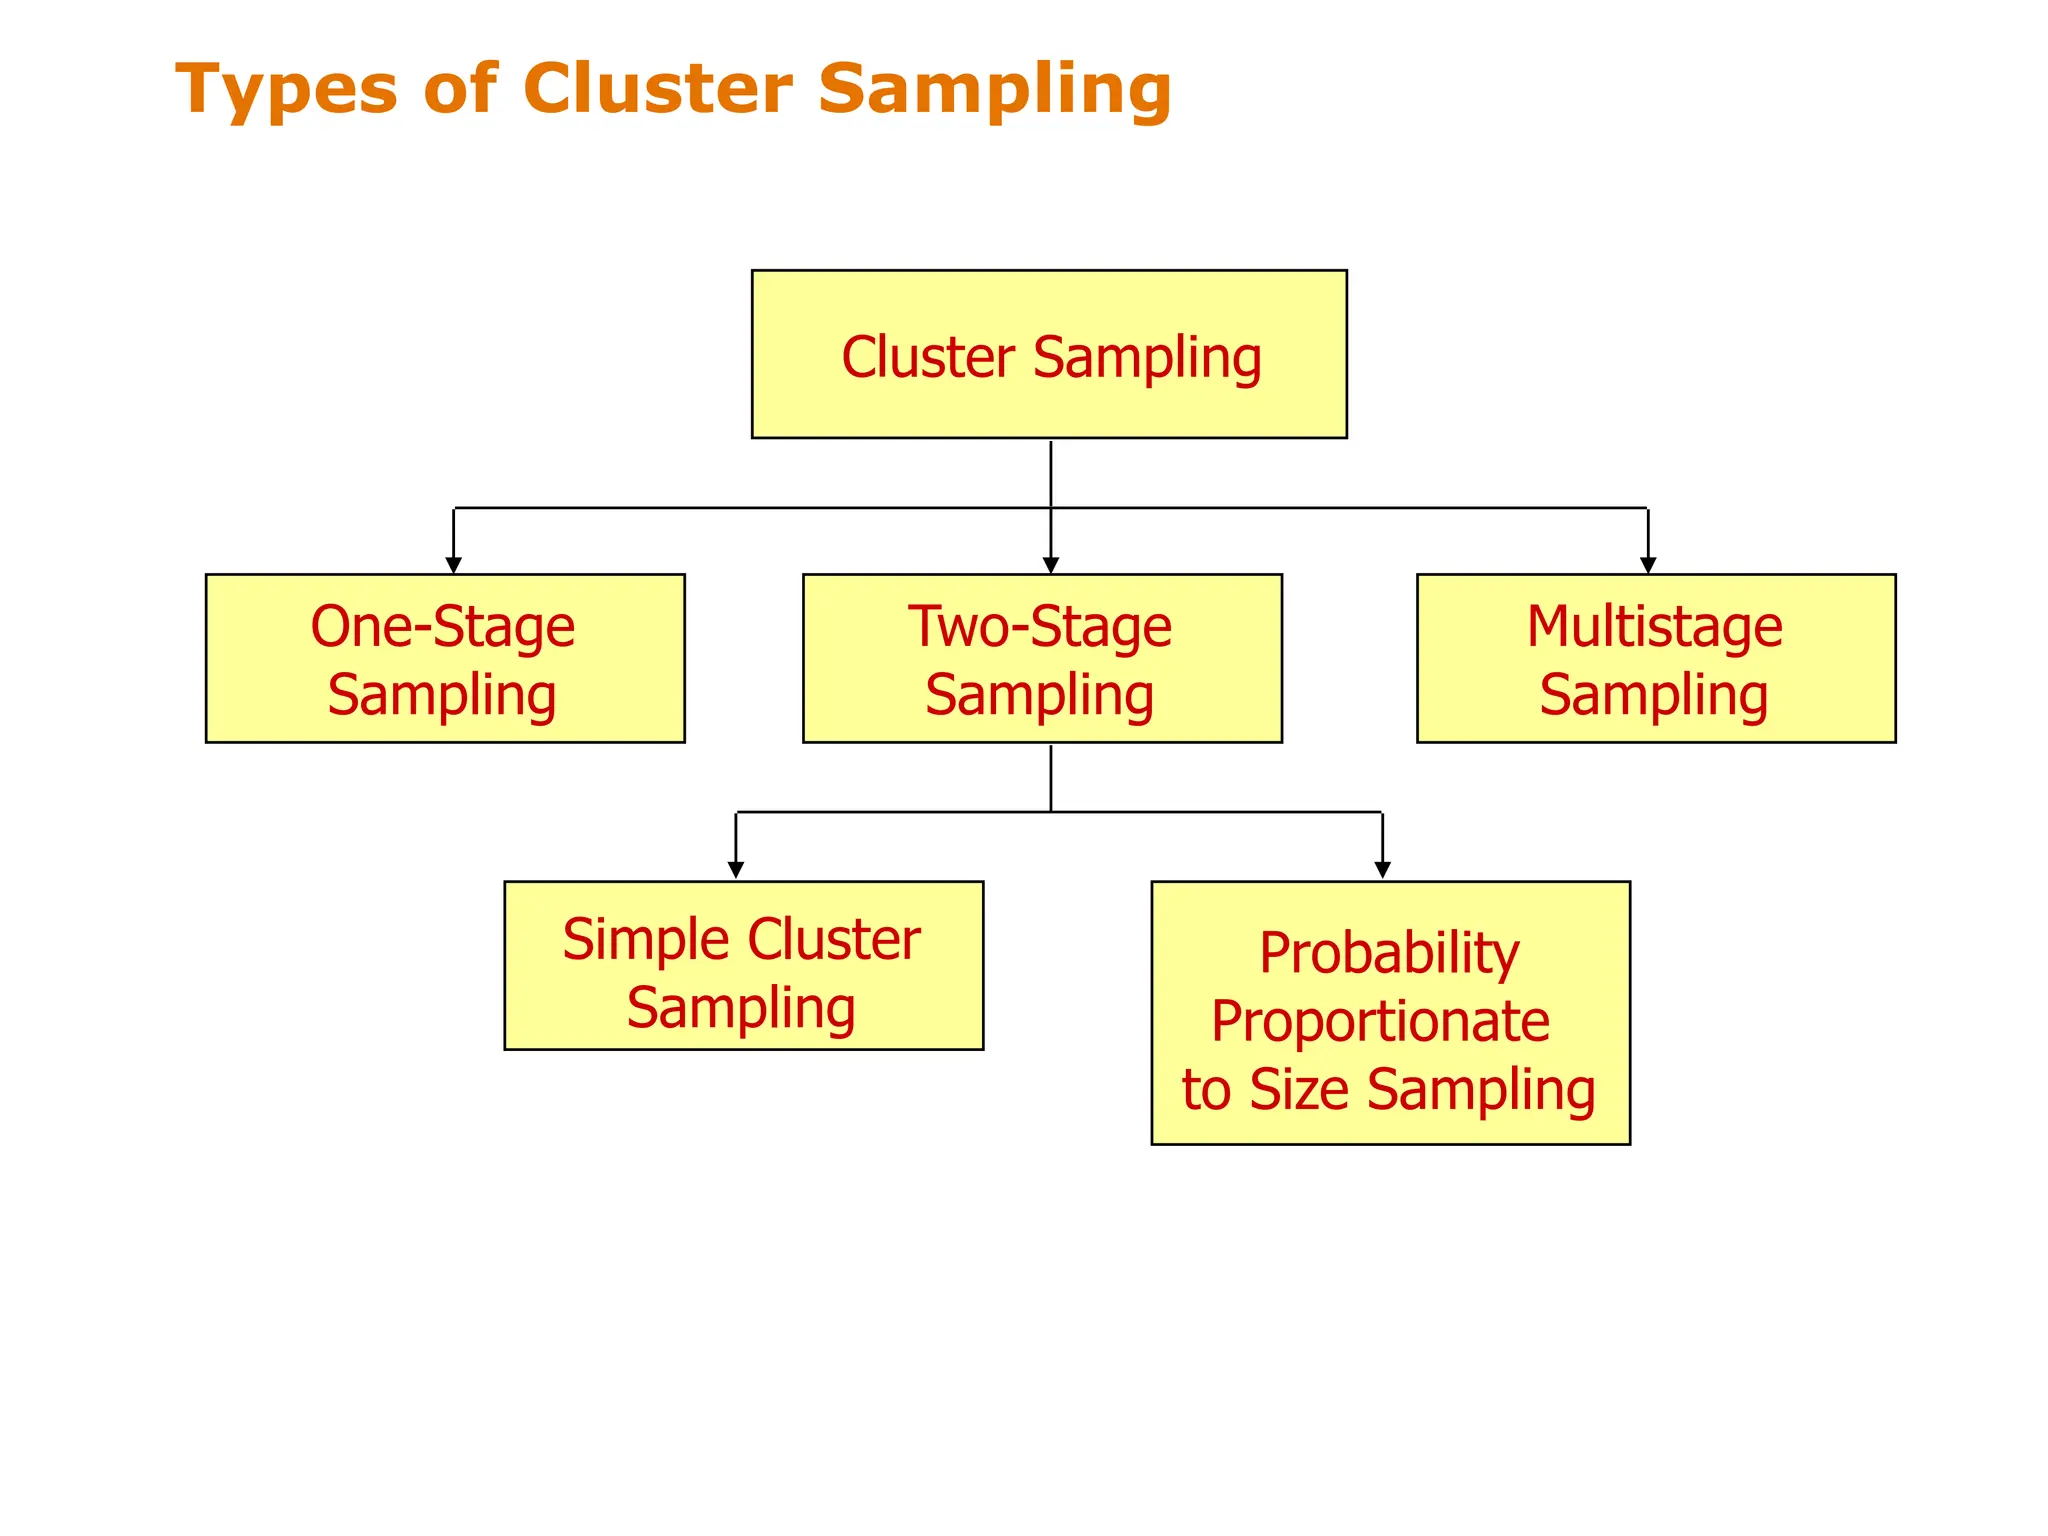
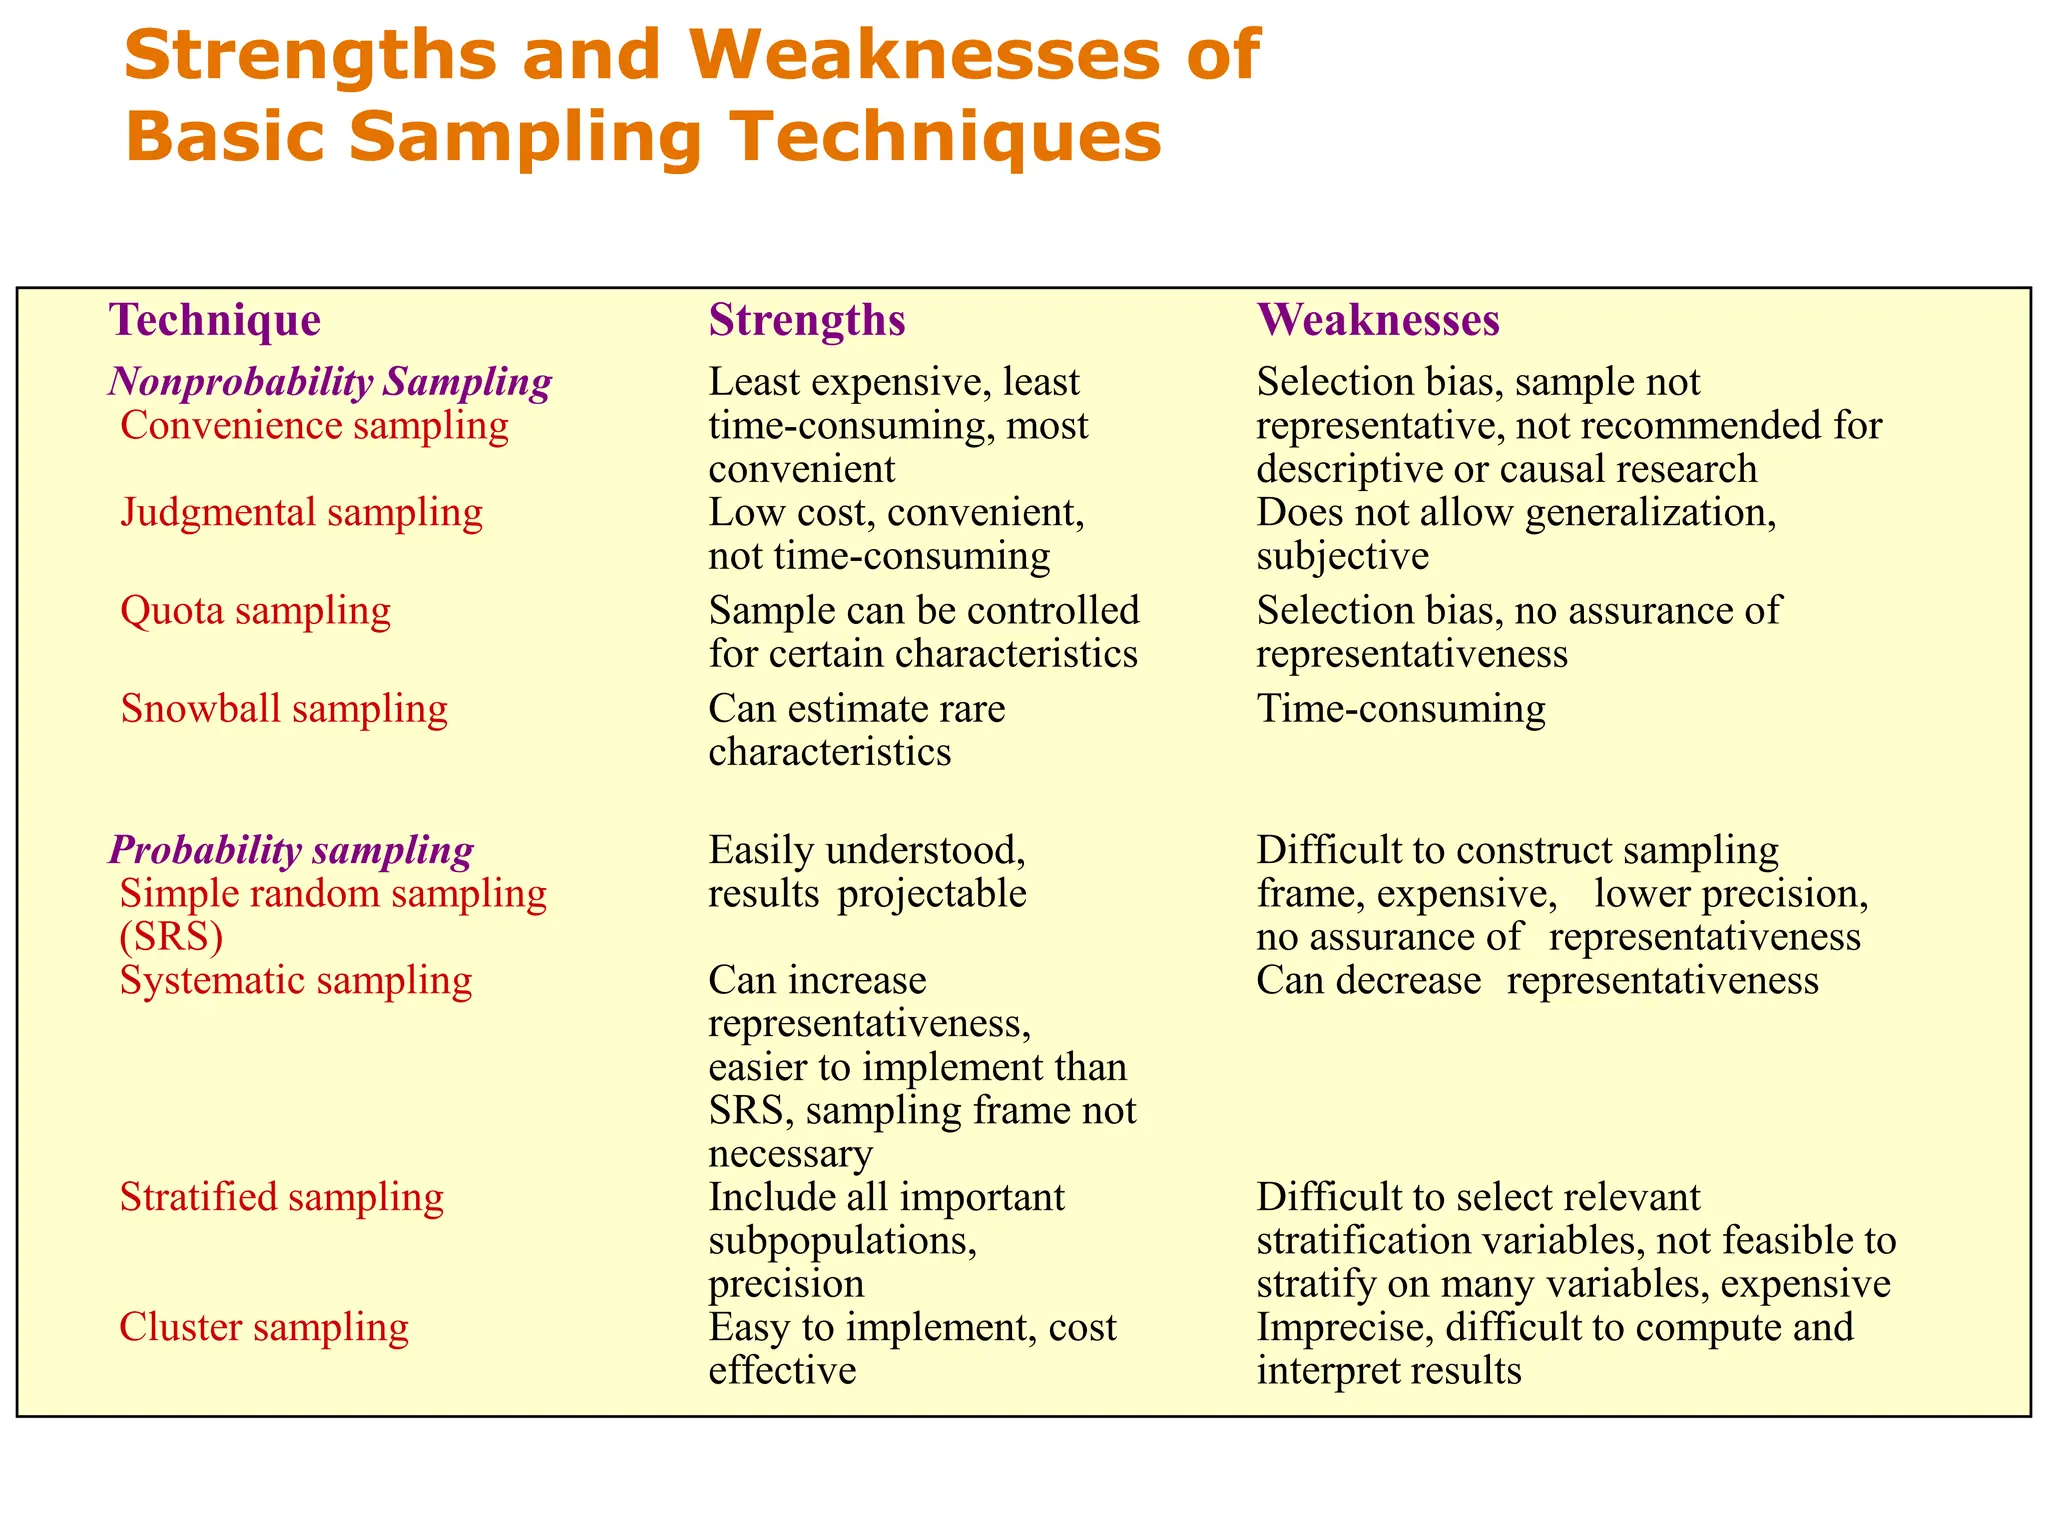
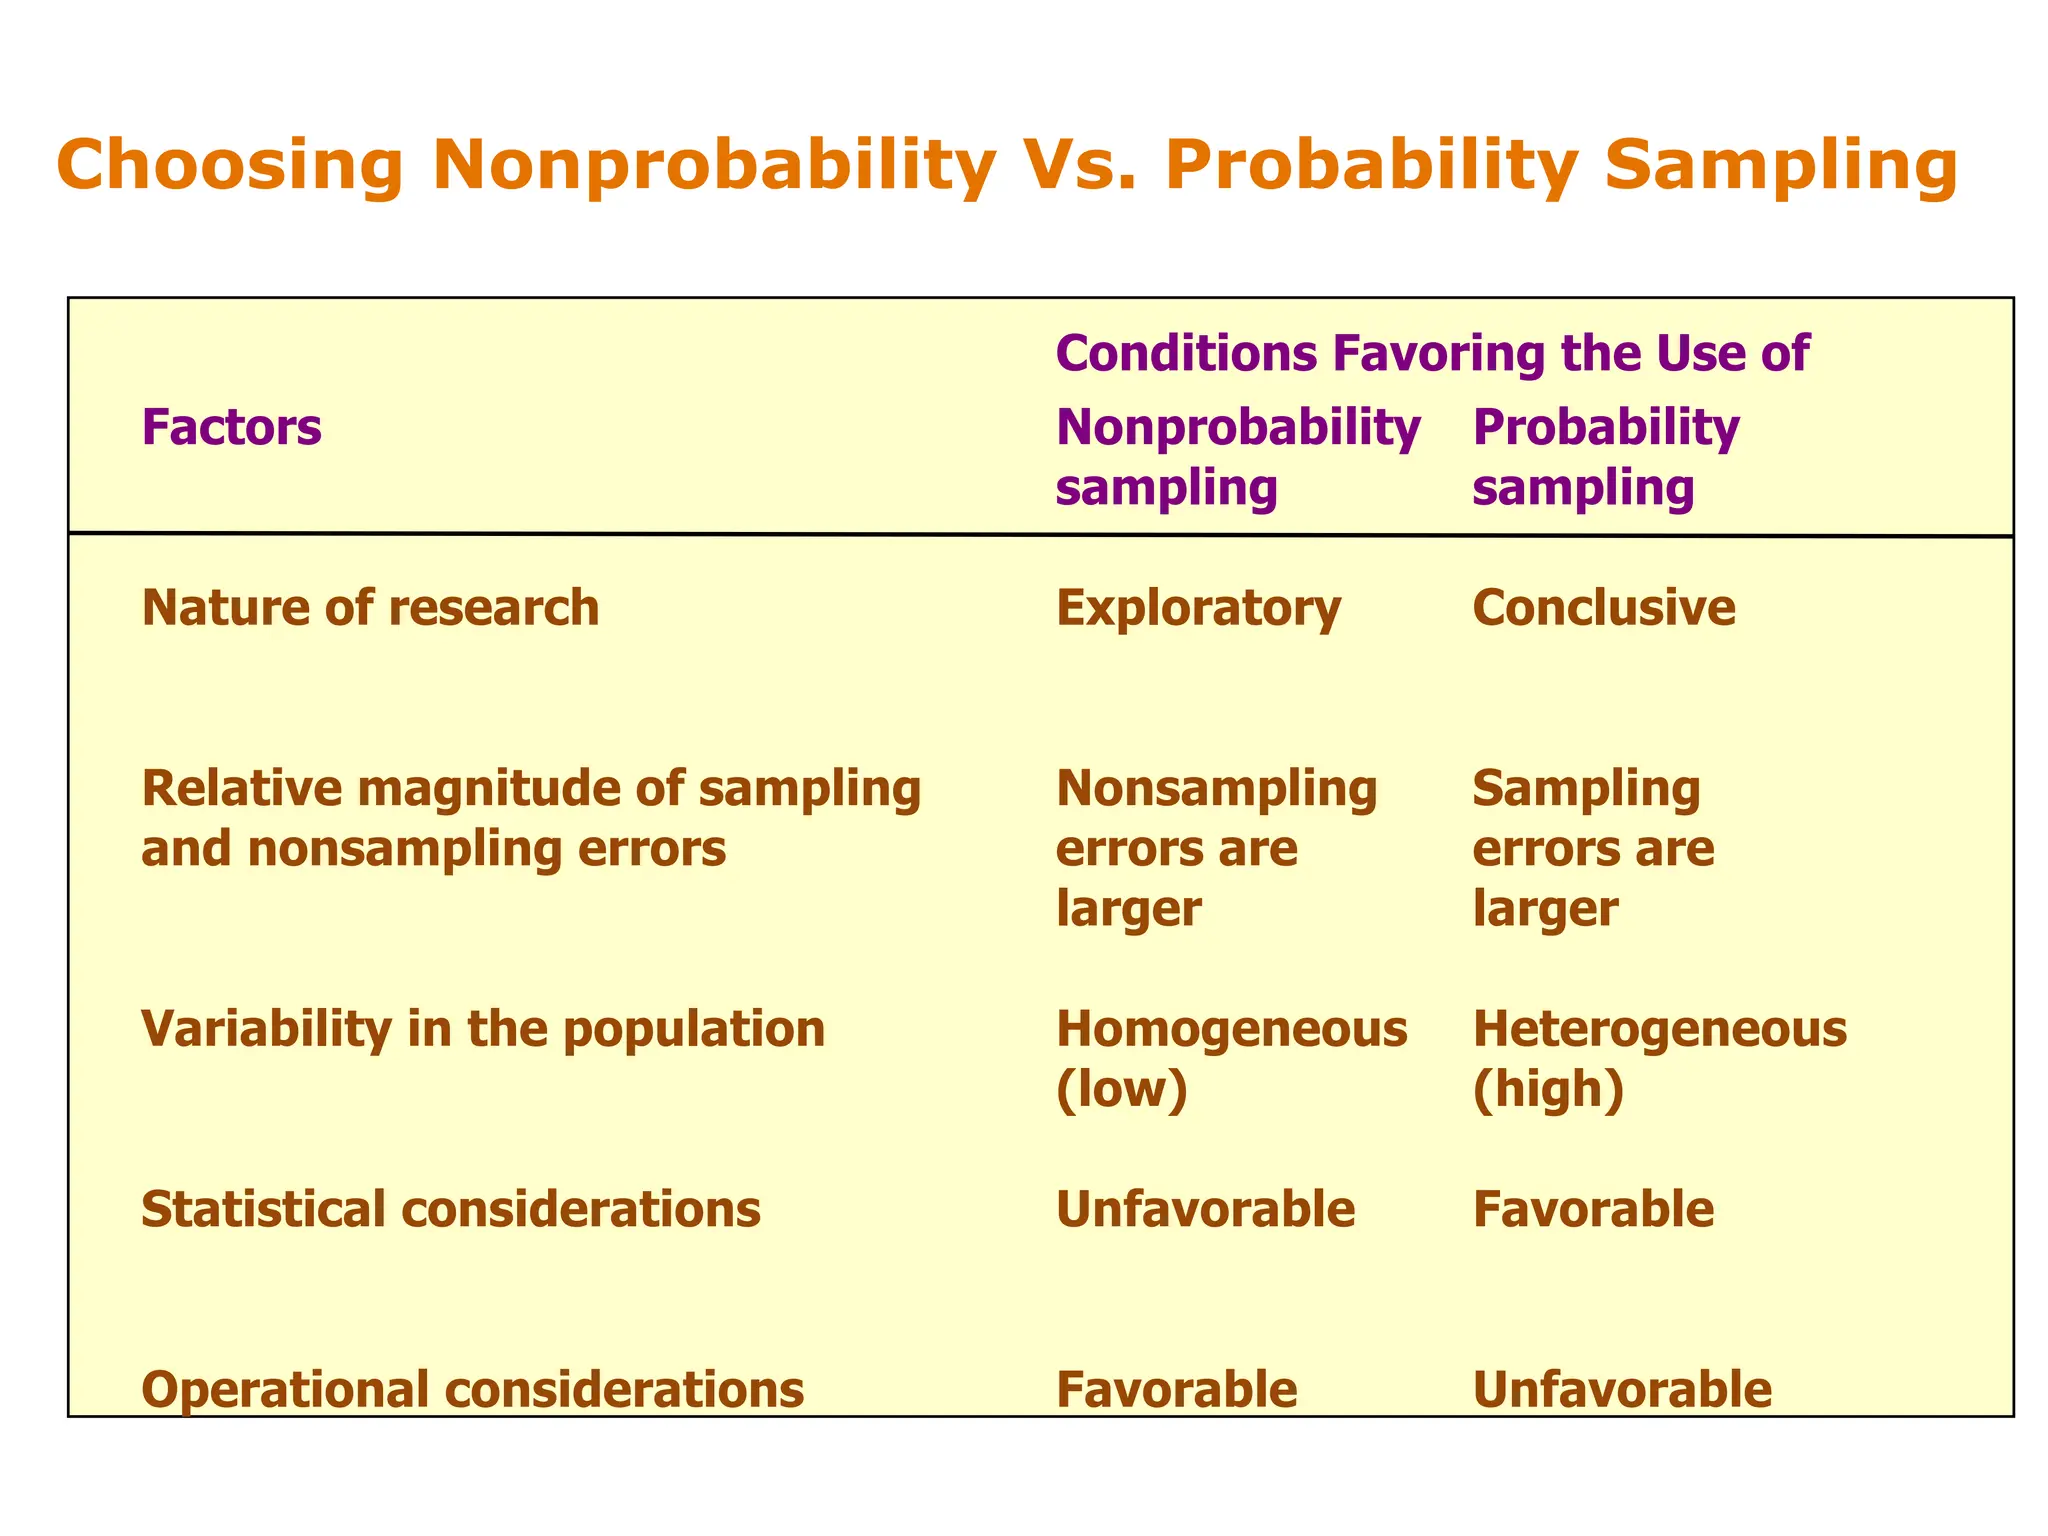
Sampling:
Design and Procedures
Sample Vs. Census
Conditions Favoring the Use of
Type of Study Sample Census
1. Budget Small Large
2. Time available Short Long
3. Population size Large Small
4. Variance in the characteristic Small Large
5. Cost of sampling errors Low High
6. Cost of nonsampling errors High Low
7. Nature of measurement Destructive Nondestructive
8. Attention to individual cases Yes No
The Sampling Design Process
Define the Population
Determine the Sampling Frame
Select Sampling Technique(s)
Determine the Sample Size
Execute the Sampling Process
Classification of Sampling Techniques
Sampling Techniques
Nonprobability
Sampling Techniques
Probability
Sampling Techniques
Convenience
Sampling
Judgmental
Sampling
Quota
Sampling
Snowball
Sampling
Systematic
Sampling
Stratified
Sampling
Cluster
Sampling
Other Sampling
Techniques
Simple Random
Sampling
Convenience Sampling
Convenience sampling attempts to obtain a
sample of convenient elements. Often, respondents
are selected because they happen to be in the right
place at the right time.
• Use of students, and members of social
organizations
• Mall intercept interviews without qualifying the
respondents
• “People on the street” interviews
A Graphical Illustration of Convenience
Sampling
A B C D E
1 6 11 16 21
2 7 12 17 22
3 8 13 18 23
4 9 14 19 24
5 10 15 20 25
Group D happens to
assemble at a
convenient time and
place. So all the
elements in this
Group are selected.
The resulting sample
consists of elements
16, 17, 18, 19 and 20.
Note, no elements are
selected from group
A, B, C and E.
Judgmental Sampling
Judgmental sampling is a form of
convenience sampling in which the
population elements are selected based on
the judgment of the researcher.
• Test markets
• Purchase engineers selected in industrial
marketing research
• Expert witnesses used in court
Graphical Illustration of Judgmental Sampling
A B C D E
1 6 11 16 21
2 7 12 17 22
3 8 13 18 23
4 9 14 19 24
5 10 15 20 25
The researcher considers
groups B, C and E to be
typical and convenient.
Within each of these
groups one or two
elements are selected
based on typicality and
convenience. The
resulting sample
consists of elements 8,
10, 11, 13, and 24. Note,
no elements are selected
from groups A and D.
Quota Sampling
Quota sampling may be viewed as two-stage restricted
judgmental sampling.
• The first stage consists of developing control categories,
or quotas, of population elements.
• In the second stage, sample elements are selected based
on convenience or judgment.
Control Population Sample
Variable composition composition
Gender Percentage Percentage Number
Male 48 48 480
Female 52 52 520
____ ____ ____
100 100 1000
A Graphical Illustration of Quota Sampling
A B C D E
1 6 11 16 21
2 7 12 17 22
3 8 13 18 23
4 9 14 19 24
5 10 15 20 25
A quota of one
element from each
group, A to E, is
imposed. Within each
group, one element is
selected based on
judgment or
convenience. The
resulting sample
consists of elements
3, 6, 13, 20 and 22.
Note, one element is
selected from each
column or group.
Snowball Sampling
In snowball sampling, an initial group of
respondents is selected, usually at random.
• After being interviewed, these respondents
are asked to identify others who belong to
the target population of interest.
• Subsequent respondents are selected based
on the referrals.
A Graphical Illustration of Snowball Sampling
A B C D E
1 6 11 16 21
2 7 12 17 22
3 8 13 18 23
4 9 14 19 24
5 10 15 20 25
Elements 2 and 9 are
selected randomly from
groups A and B.
Element 2 refers
elements 12 and 13.
Element 9 refers
element 18. The
resulting sample
consists of elements 2,
9, 12, 13, and 18. Note,
there are no elements
from group E.
Random
Selection Referrals
Fig. 6
Simple Random Sampling
• Each element in the population has a
known and equal probability of selection.
• Each possible sample of a given size (n)
has a known and equal probability of being
the sample actually selected.
• This implies that every element is selected
independently of every other element.
A Graphical Illustration of Simple Random
Sampling
A B C D E
1 6 11 16 21
2 7 12 17 22
3 8 13 18 23
4 9 14 19 24
5 10 15 20 25
Select five
random numbers
from 1 to 25. The
resulting sample
consists of
population
elements 3, 7, 9,
16, and 24. Note,
there is no
element from
Group C.
Systematic Sampling
• The sample is chosen by selecting a random
starting point and then picking every ith element
in succession from the sampling frame.
• The sampling interval, i, is determined by dividing
the population size N by the sample size n and
rounding to the nearest integer.
• When the ordering of the elements is related to
the characteristic of interest, systematic sampling
increases the representativeness of the sample.
Systematic Sampling
• If the ordering of the elements produces a
cyclical pattern, systematic sampling may
decrease the representativeness of the sample.
For example, there are 100,000 elements in the
population and a sample of 1,000 is desired. In
this case the sampling interval, i, is 100. A
random number between 1 and 100 is selected.
If, for example, this number is 23, the sample
consists of elements 23, 123, 223, 323, 423,
523, and so on.
A Graphical Illustration of
Systematic Sampling
A B C D E
1 6 11 16 21
2 7 12 17 22
3 8 13 18 23
4 9 14 19 24
5 10 15 20 25
Select a random
number between 1
and 5, say 2.
The resulting sample
consists of
population 2,
(2+5=) 7, (2+5x2=) 12,
(2+5x3=)17, and
(2+5x4=) 22. Note, all
the elements are
selected from a
single row.
Stratified Sampling
• A two-step process in which the population is
partitioned into subpopulations, or strata.
• The strata should be mutually exclusive and
collectively exhaustive in that every population
element should be assigned to one and only one
stratum and no population elements should be
omitted.
• Next, elements are selected from each stratum
by a random procedure, usually SRS.
• A major objective of stratified sampling is to
increase precision without increasing cost.
Stratified Sampling
• The elements within a stratum should be as
homogeneous as possible, but the elements in
different strata should be as heterogeneous as
possible.
• The stratification variables should also be
closely related to the characteristic of interest.
• Finally, the variables should decrease the cost
of the stratification process by being easy to
measure and apply.
Stratified Sampling
• In proportionate stratified sampling, the
size of the sample drawn from each stratum is
proportionate to the relative size of that
stratum in the total population.
• In disproportionate stratified sampling,
the size of the sample from each stratum is
proportionate to the relative size of that
stratum and to the standard deviation of the
distribution of the characteristic of interest
among all the elements in that stratum.
A Graphical Illustration of
Stratified Sampling
A B C D E
1 6 11 16 21
2 7 12 17 22
3 8 13 18 23
4 9 14 19 24
5 10 15 20 25
Randomly select a
number from 1 to 5
for each stratum, A to
E. The resulting
sample consists of
population elements
4, 7, 13, 19 and 21.
Note, one element
is selected from each
column.
Cluster Sampling
• The target population is first divided into
mutually exclusive and collectively exhaustive
subpopulations, or clusters.
• Then a random sample of clusters is selected,
based on a probability sampling technique
such as SRS.
• For each selected cluster, either all the
elements are included in the sample (one-
stage) or a sample of elements is drawn
probabilistically (two-stage).
Cluster Sampling
• Elements within a cluster should be as
heterogeneous as possible, but clusters
themselves should be as homogeneous as
possible. Ideally, each cluster should be a
small-scale representation of the population.
• In probability proportionate to size
sampling, the clusters are sampled with
probability proportional to size. In the
second stage, the probability of selecting a
sampling unit in a selected cluster varies
inversely with the size of the cluster.
A Graphical Illustration of
Cluster Sampling (2-Stage)
A B C D E
1 6 11 16 21
2 7 12 17 22
3 8 13 18 23
4 9 14 19 24
5 10 15 20 25
Randomly select 3
clusters, B, D and E.
Within each cluster,
randomly select one
or two elements. The
resulting sample
consists of
population elements
7, 18, 20, 21, and 23.
Note, no elements
are selected from
clusters A and C.
Types of Cluster Sampling
Cluster Sampling
One-Stage
Sampling
Multistage
Sampling
Two-Stage
Sampling
Simple Cluster
Sampling
Probability
Proportionate
to Size Sampling
Strengths and Weaknesses of
Basic Sampling Techniques
Technique Strengths Weaknesses
Nonprobability Sampling
Convenience sampling
Least expensive, least
time-consuming, most
convenient
Selection bias, sample not
representative, not recommended for
descriptive or causal research
Judgmental sampling Low cost, convenient,
not time-consuming
Does not allow generalization,
subjective
Quota sampling Sample can be controlled
for certain characteristics
Selection bias, no assurance of
representativeness
Snowball sampling Can estimate rare
characteristics
Time-consuming
Probability sampling
Simple random sampling
(SRS)
Easily understood,
results projectable
Difficult to construct sampling
frame, expensive, lower precision,
no assurance of representativeness
Systematic sampling Can increase
representativeness,
easier to implement than
SRS, sampling frame not
necessary
Can decrease representativeness
Stratified sampling Include all important
subpopulations,
precision
Difficult to select relevant
stratification variables, not feasible to
stratify on many variables, expensive
Cluster sampling Easy to implement, cost
effective
Imprecise, difficult to compute and
interpret results
Choosing Nonprobability Vs. Probability Sampling
Conditions Favoring the Use of
Factors Nonprobability
sampling
Probability
sampling
Nature of research Exploratory Conclusive
Relative magnitude of sampling
and nonsampling errors
Nonsampling
errors are
larger
Sampling
errors are
larger
Variability in the population Homogeneous
(low)
Heterogeneous
(high)
Statistical considerations Unfavorable Favorable
Operational considerations Favorable Unfavorable

Sampling design and procedure of supply chain management

  • 1.
  • 2.
    Sample Vs. Census ConditionsFavoring the Use of Type of Study Sample Census 1. Budget Small Large 2. Time available Short Long 3. Population size Large Small 4. Variance in the characteristic Small Large 5. Cost of sampling errors Low High 6. Cost of nonsampling errors High Low 7. Nature of measurement Destructive Nondestructive 8. Attention to individual cases Yes No
  • 3.
    The Sampling DesignProcess Define the Population Determine the Sampling Frame Select Sampling Technique(s) Determine the Sample Size Execute the Sampling Process
  • 4.
    Classification of SamplingTechniques Sampling Techniques Nonprobability Sampling Techniques Probability Sampling Techniques Convenience Sampling Judgmental Sampling Quota Sampling Snowball Sampling Systematic Sampling Stratified Sampling Cluster Sampling Other Sampling Techniques Simple Random Sampling
  • 5.
    Convenience Sampling Convenience samplingattempts to obtain a sample of convenient elements. Often, respondents are selected because they happen to be in the right place at the right time. • Use of students, and members of social organizations • Mall intercept interviews without qualifying the respondents • “People on the street” interviews
  • 6.
    A Graphical Illustrationof Convenience Sampling A B C D E 1 6 11 16 21 2 7 12 17 22 3 8 13 18 23 4 9 14 19 24 5 10 15 20 25 Group D happens to assemble at a convenient time and place. So all the elements in this Group are selected. The resulting sample consists of elements 16, 17, 18, 19 and 20. Note, no elements are selected from group A, B, C and E.
  • 7.
    Judgmental Sampling Judgmental samplingis a form of convenience sampling in which the population elements are selected based on the judgment of the researcher. • Test markets • Purchase engineers selected in industrial marketing research • Expert witnesses used in court
  • 8.
    Graphical Illustration ofJudgmental Sampling A B C D E 1 6 11 16 21 2 7 12 17 22 3 8 13 18 23 4 9 14 19 24 5 10 15 20 25 The researcher considers groups B, C and E to be typical and convenient. Within each of these groups one or two elements are selected based on typicality and convenience. The resulting sample consists of elements 8, 10, 11, 13, and 24. Note, no elements are selected from groups A and D.
  • 9.
    Quota Sampling Quota samplingmay be viewed as two-stage restricted judgmental sampling. • The first stage consists of developing control categories, or quotas, of population elements. • In the second stage, sample elements are selected based on convenience or judgment. Control Population Sample Variable composition composition Gender Percentage Percentage Number Male 48 48 480 Female 52 52 520 ____ ____ ____ 100 100 1000
  • 10.
    A Graphical Illustrationof Quota Sampling A B C D E 1 6 11 16 21 2 7 12 17 22 3 8 13 18 23 4 9 14 19 24 5 10 15 20 25 A quota of one element from each group, A to E, is imposed. Within each group, one element is selected based on judgment or convenience. The resulting sample consists of elements 3, 6, 13, 20 and 22. Note, one element is selected from each column or group.
  • 11.
    Snowball Sampling In snowballsampling, an initial group of respondents is selected, usually at random. • After being interviewed, these respondents are asked to identify others who belong to the target population of interest. • Subsequent respondents are selected based on the referrals.
  • 12.
    A Graphical Illustrationof Snowball Sampling A B C D E 1 6 11 16 21 2 7 12 17 22 3 8 13 18 23 4 9 14 19 24 5 10 15 20 25 Elements 2 and 9 are selected randomly from groups A and B. Element 2 refers elements 12 and 13. Element 9 refers element 18. The resulting sample consists of elements 2, 9, 12, 13, and 18. Note, there are no elements from group E. Random Selection Referrals Fig. 6
  • 13.
    Simple Random Sampling •Each element in the population has a known and equal probability of selection. • Each possible sample of a given size (n) has a known and equal probability of being the sample actually selected. • This implies that every element is selected independently of every other element.
  • 14.
    A Graphical Illustrationof Simple Random Sampling A B C D E 1 6 11 16 21 2 7 12 17 22 3 8 13 18 23 4 9 14 19 24 5 10 15 20 25 Select five random numbers from 1 to 25. The resulting sample consists of population elements 3, 7, 9, 16, and 24. Note, there is no element from Group C.
  • 15.
    Systematic Sampling • Thesample is chosen by selecting a random starting point and then picking every ith element in succession from the sampling frame. • The sampling interval, i, is determined by dividing the population size N by the sample size n and rounding to the nearest integer. • When the ordering of the elements is related to the characteristic of interest, systematic sampling increases the representativeness of the sample.
  • 16.
    Systematic Sampling • Ifthe ordering of the elements produces a cyclical pattern, systematic sampling may decrease the representativeness of the sample. For example, there are 100,000 elements in the population and a sample of 1,000 is desired. In this case the sampling interval, i, is 100. A random number between 1 and 100 is selected. If, for example, this number is 23, the sample consists of elements 23, 123, 223, 323, 423, 523, and so on.
  • 17.
    A Graphical Illustrationof Systematic Sampling A B C D E 1 6 11 16 21 2 7 12 17 22 3 8 13 18 23 4 9 14 19 24 5 10 15 20 25 Select a random number between 1 and 5, say 2. The resulting sample consists of population 2, (2+5=) 7, (2+5x2=) 12, (2+5x3=)17, and (2+5x4=) 22. Note, all the elements are selected from a single row.
  • 18.
    Stratified Sampling • Atwo-step process in which the population is partitioned into subpopulations, or strata. • The strata should be mutually exclusive and collectively exhaustive in that every population element should be assigned to one and only one stratum and no population elements should be omitted. • Next, elements are selected from each stratum by a random procedure, usually SRS. • A major objective of stratified sampling is to increase precision without increasing cost.
  • 19.
    Stratified Sampling • Theelements within a stratum should be as homogeneous as possible, but the elements in different strata should be as heterogeneous as possible. • The stratification variables should also be closely related to the characteristic of interest. • Finally, the variables should decrease the cost of the stratification process by being easy to measure and apply.
  • 20.
    Stratified Sampling • Inproportionate stratified sampling, the size of the sample drawn from each stratum is proportionate to the relative size of that stratum in the total population. • In disproportionate stratified sampling, the size of the sample from each stratum is proportionate to the relative size of that stratum and to the standard deviation of the distribution of the characteristic of interest among all the elements in that stratum.
  • 21.
    A Graphical Illustrationof Stratified Sampling A B C D E 1 6 11 16 21 2 7 12 17 22 3 8 13 18 23 4 9 14 19 24 5 10 15 20 25 Randomly select a number from 1 to 5 for each stratum, A to E. The resulting sample consists of population elements 4, 7, 13, 19 and 21. Note, one element is selected from each column.
  • 22.
    Cluster Sampling • Thetarget population is first divided into mutually exclusive and collectively exhaustive subpopulations, or clusters. • Then a random sample of clusters is selected, based on a probability sampling technique such as SRS. • For each selected cluster, either all the elements are included in the sample (one- stage) or a sample of elements is drawn probabilistically (two-stage).
  • 23.
    Cluster Sampling • Elementswithin a cluster should be as heterogeneous as possible, but clusters themselves should be as homogeneous as possible. Ideally, each cluster should be a small-scale representation of the population. • In probability proportionate to size sampling, the clusters are sampled with probability proportional to size. In the second stage, the probability of selecting a sampling unit in a selected cluster varies inversely with the size of the cluster.
  • 24.
    A Graphical Illustrationof Cluster Sampling (2-Stage) A B C D E 1 6 11 16 21 2 7 12 17 22 3 8 13 18 23 4 9 14 19 24 5 10 15 20 25 Randomly select 3 clusters, B, D and E. Within each cluster, randomly select one or two elements. The resulting sample consists of population elements 7, 18, 20, 21, and 23. Note, no elements are selected from clusters A and C.
  • 25.
    Types of ClusterSampling Cluster Sampling One-Stage Sampling Multistage Sampling Two-Stage Sampling Simple Cluster Sampling Probability Proportionate to Size Sampling
  • 26.
    Strengths and Weaknessesof Basic Sampling Techniques Technique Strengths Weaknesses Nonprobability Sampling Convenience sampling Least expensive, least time-consuming, most convenient Selection bias, sample not representative, not recommended for descriptive or causal research Judgmental sampling Low cost, convenient, not time-consuming Does not allow generalization, subjective Quota sampling Sample can be controlled for certain characteristics Selection bias, no assurance of representativeness Snowball sampling Can estimate rare characteristics Time-consuming Probability sampling Simple random sampling (SRS) Easily understood, results projectable Difficult to construct sampling frame, expensive, lower precision, no assurance of representativeness Systematic sampling Can increase representativeness, easier to implement than SRS, sampling frame not necessary Can decrease representativeness Stratified sampling Include all important subpopulations, precision Difficult to select relevant stratification variables, not feasible to stratify on many variables, expensive Cluster sampling Easy to implement, cost effective Imprecise, difficult to compute and interpret results
  • 27.
    Choosing Nonprobability Vs.Probability Sampling Conditions Favoring the Use of Factors Nonprobability sampling Probability sampling Nature of research Exploratory Conclusive Relative magnitude of sampling and nonsampling errors Nonsampling errors are larger Sampling errors are larger Variability in the population Homogeneous (low) Heterogeneous (high) Statistical considerations Unfavorable Favorable Operational considerations Favorable Unfavorable