Download to read offline
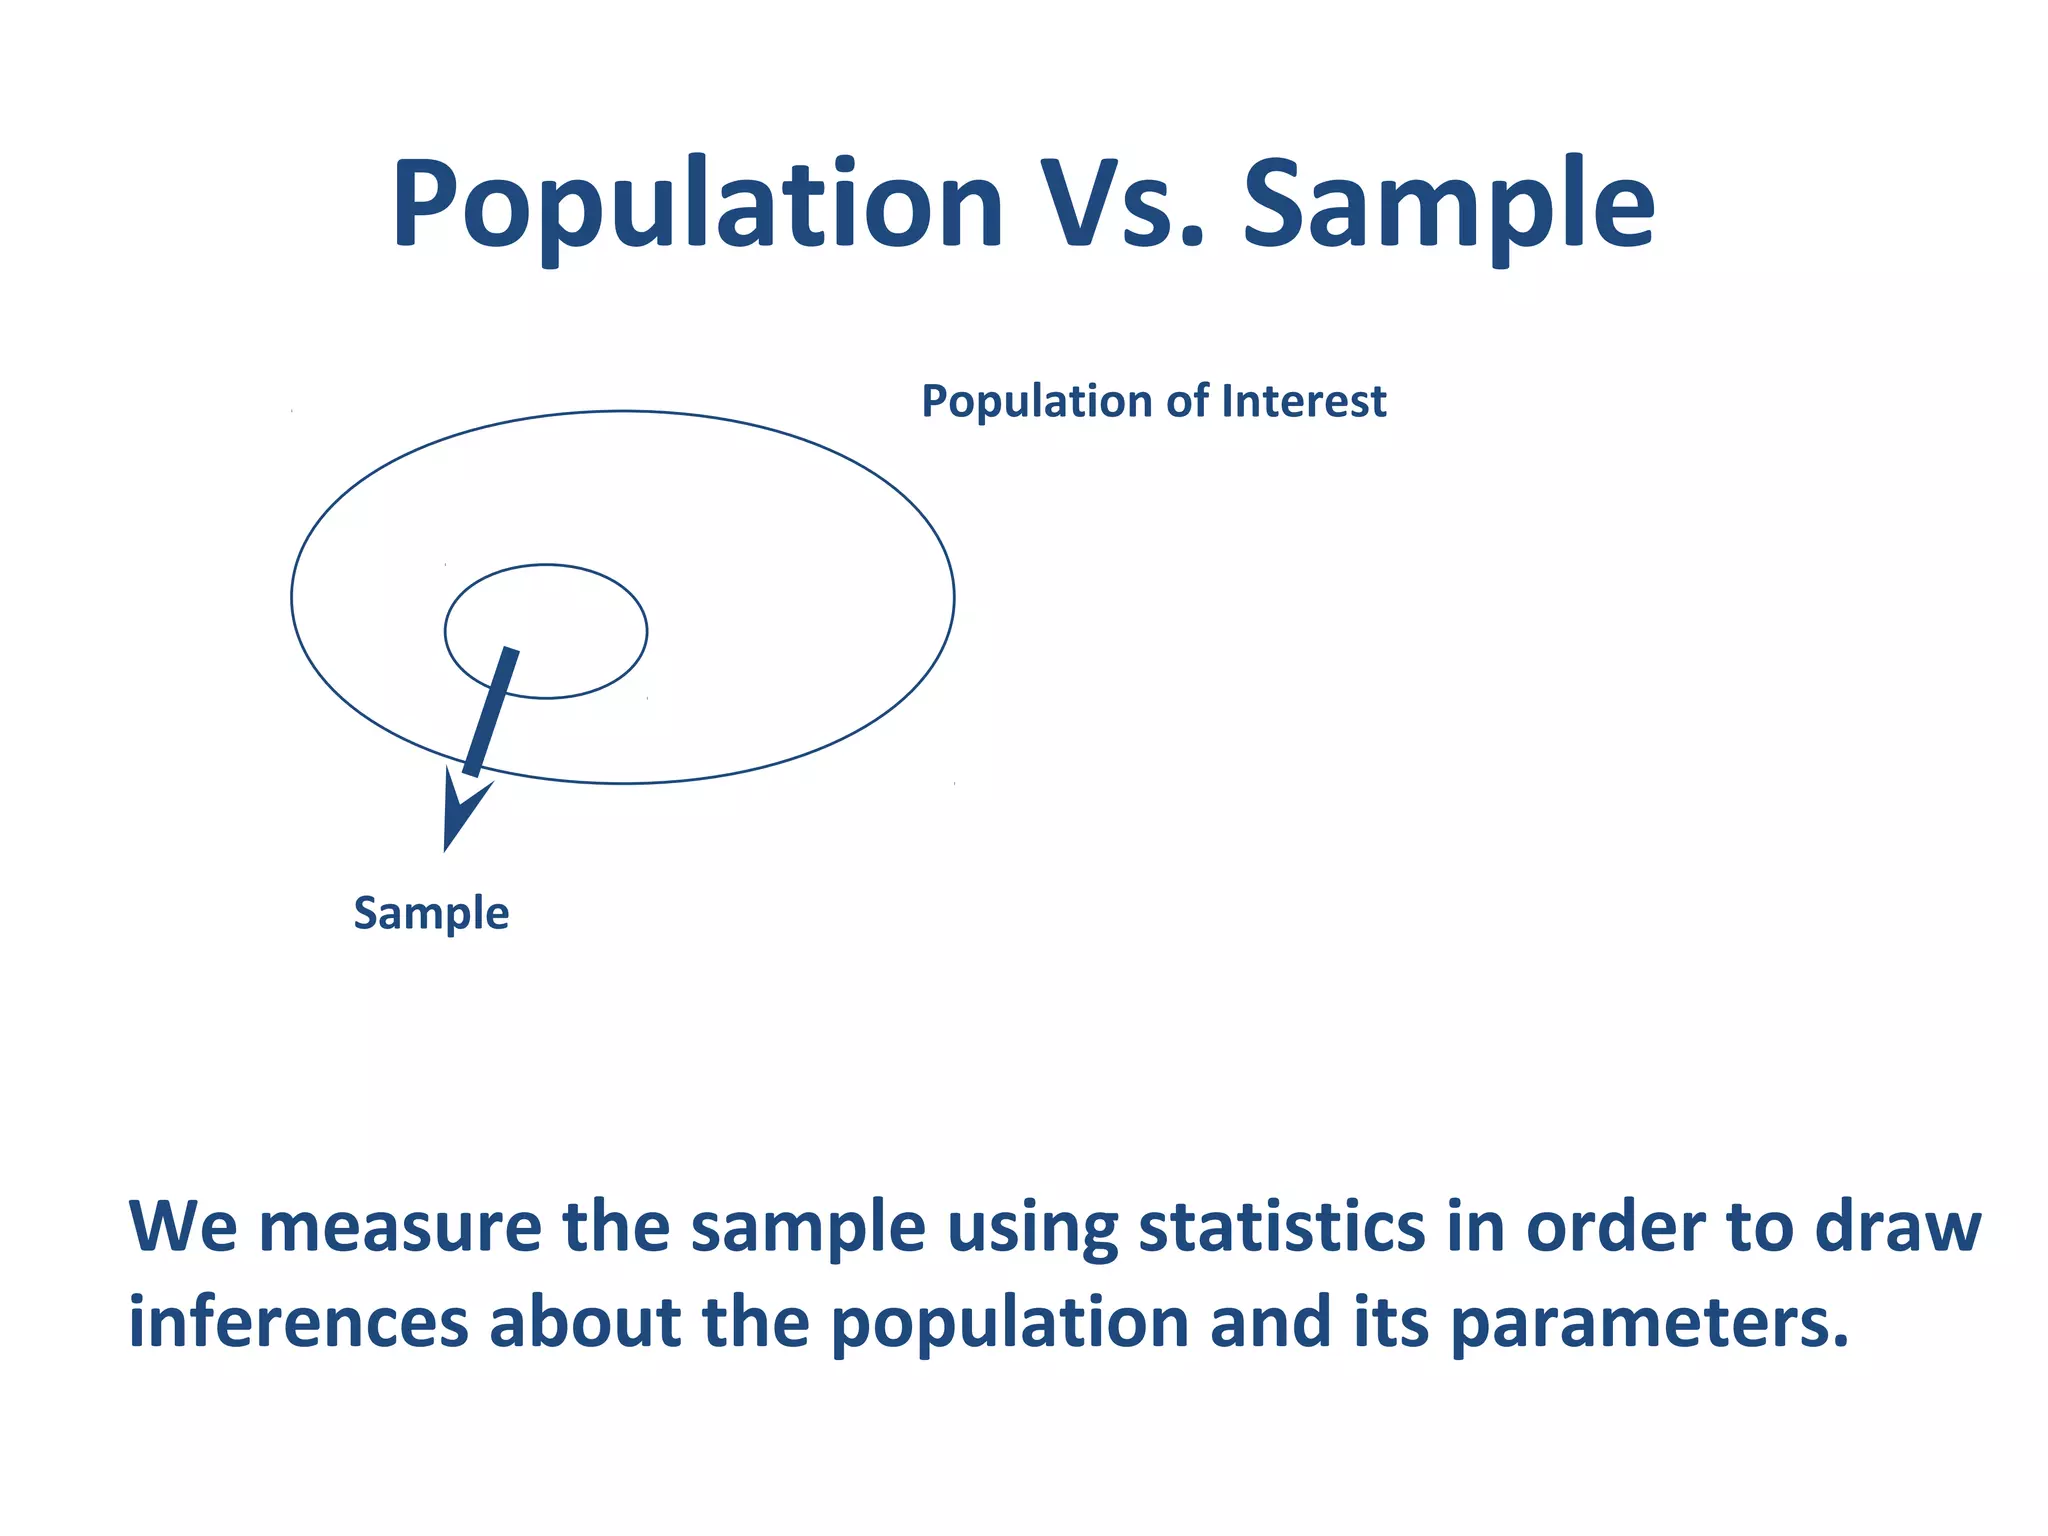
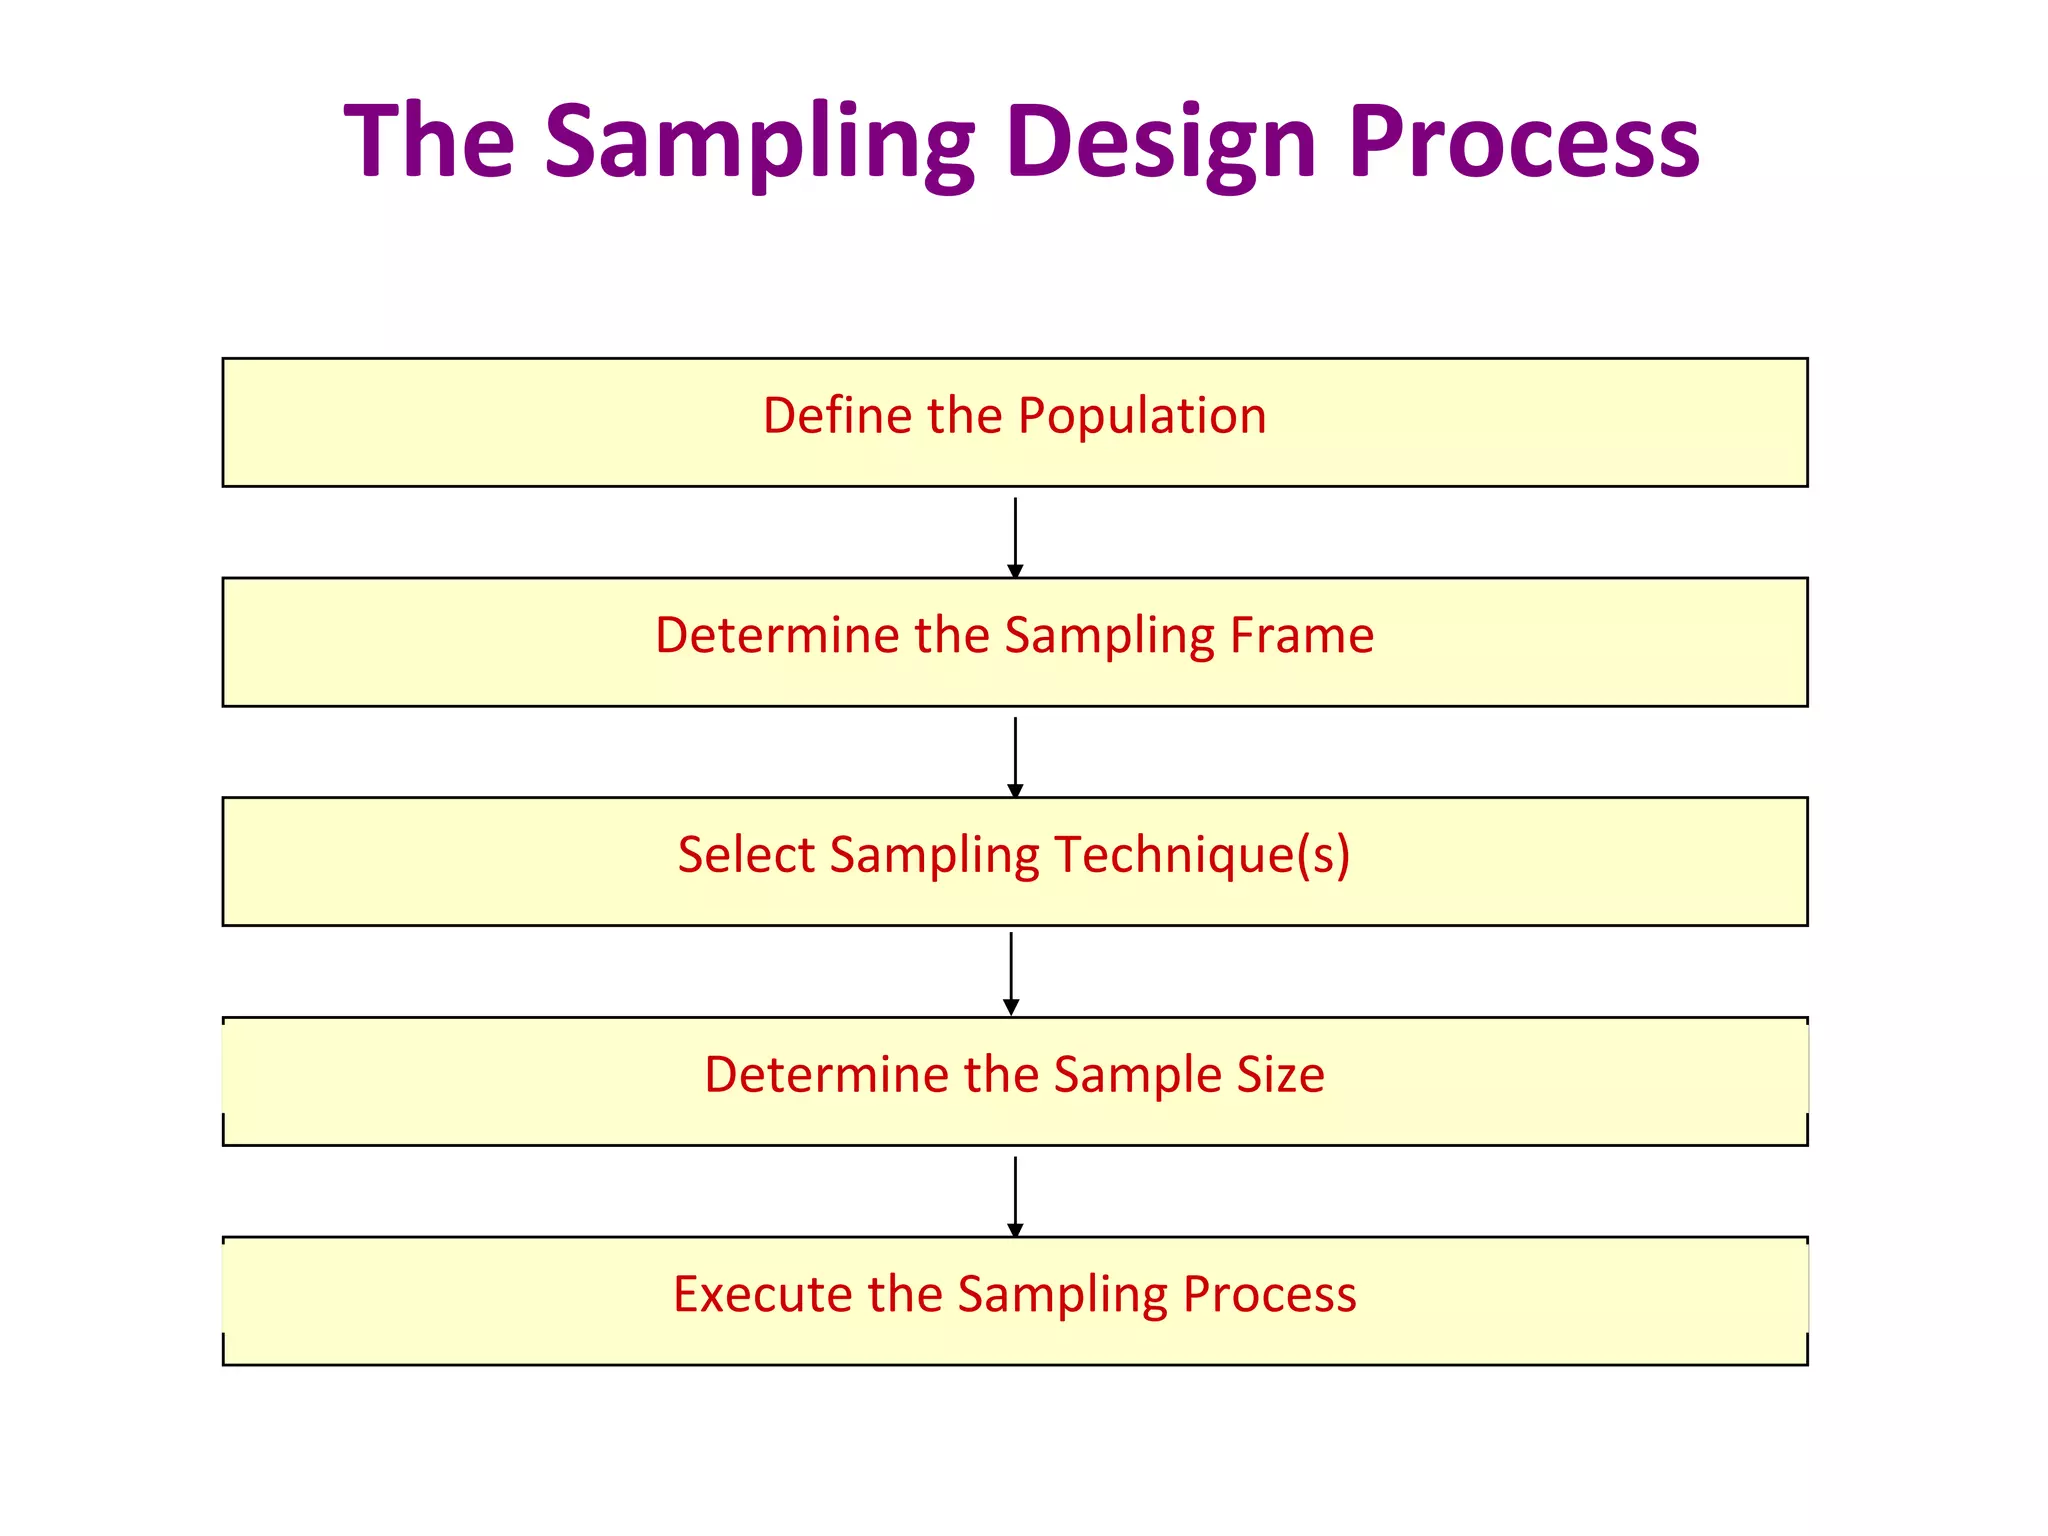
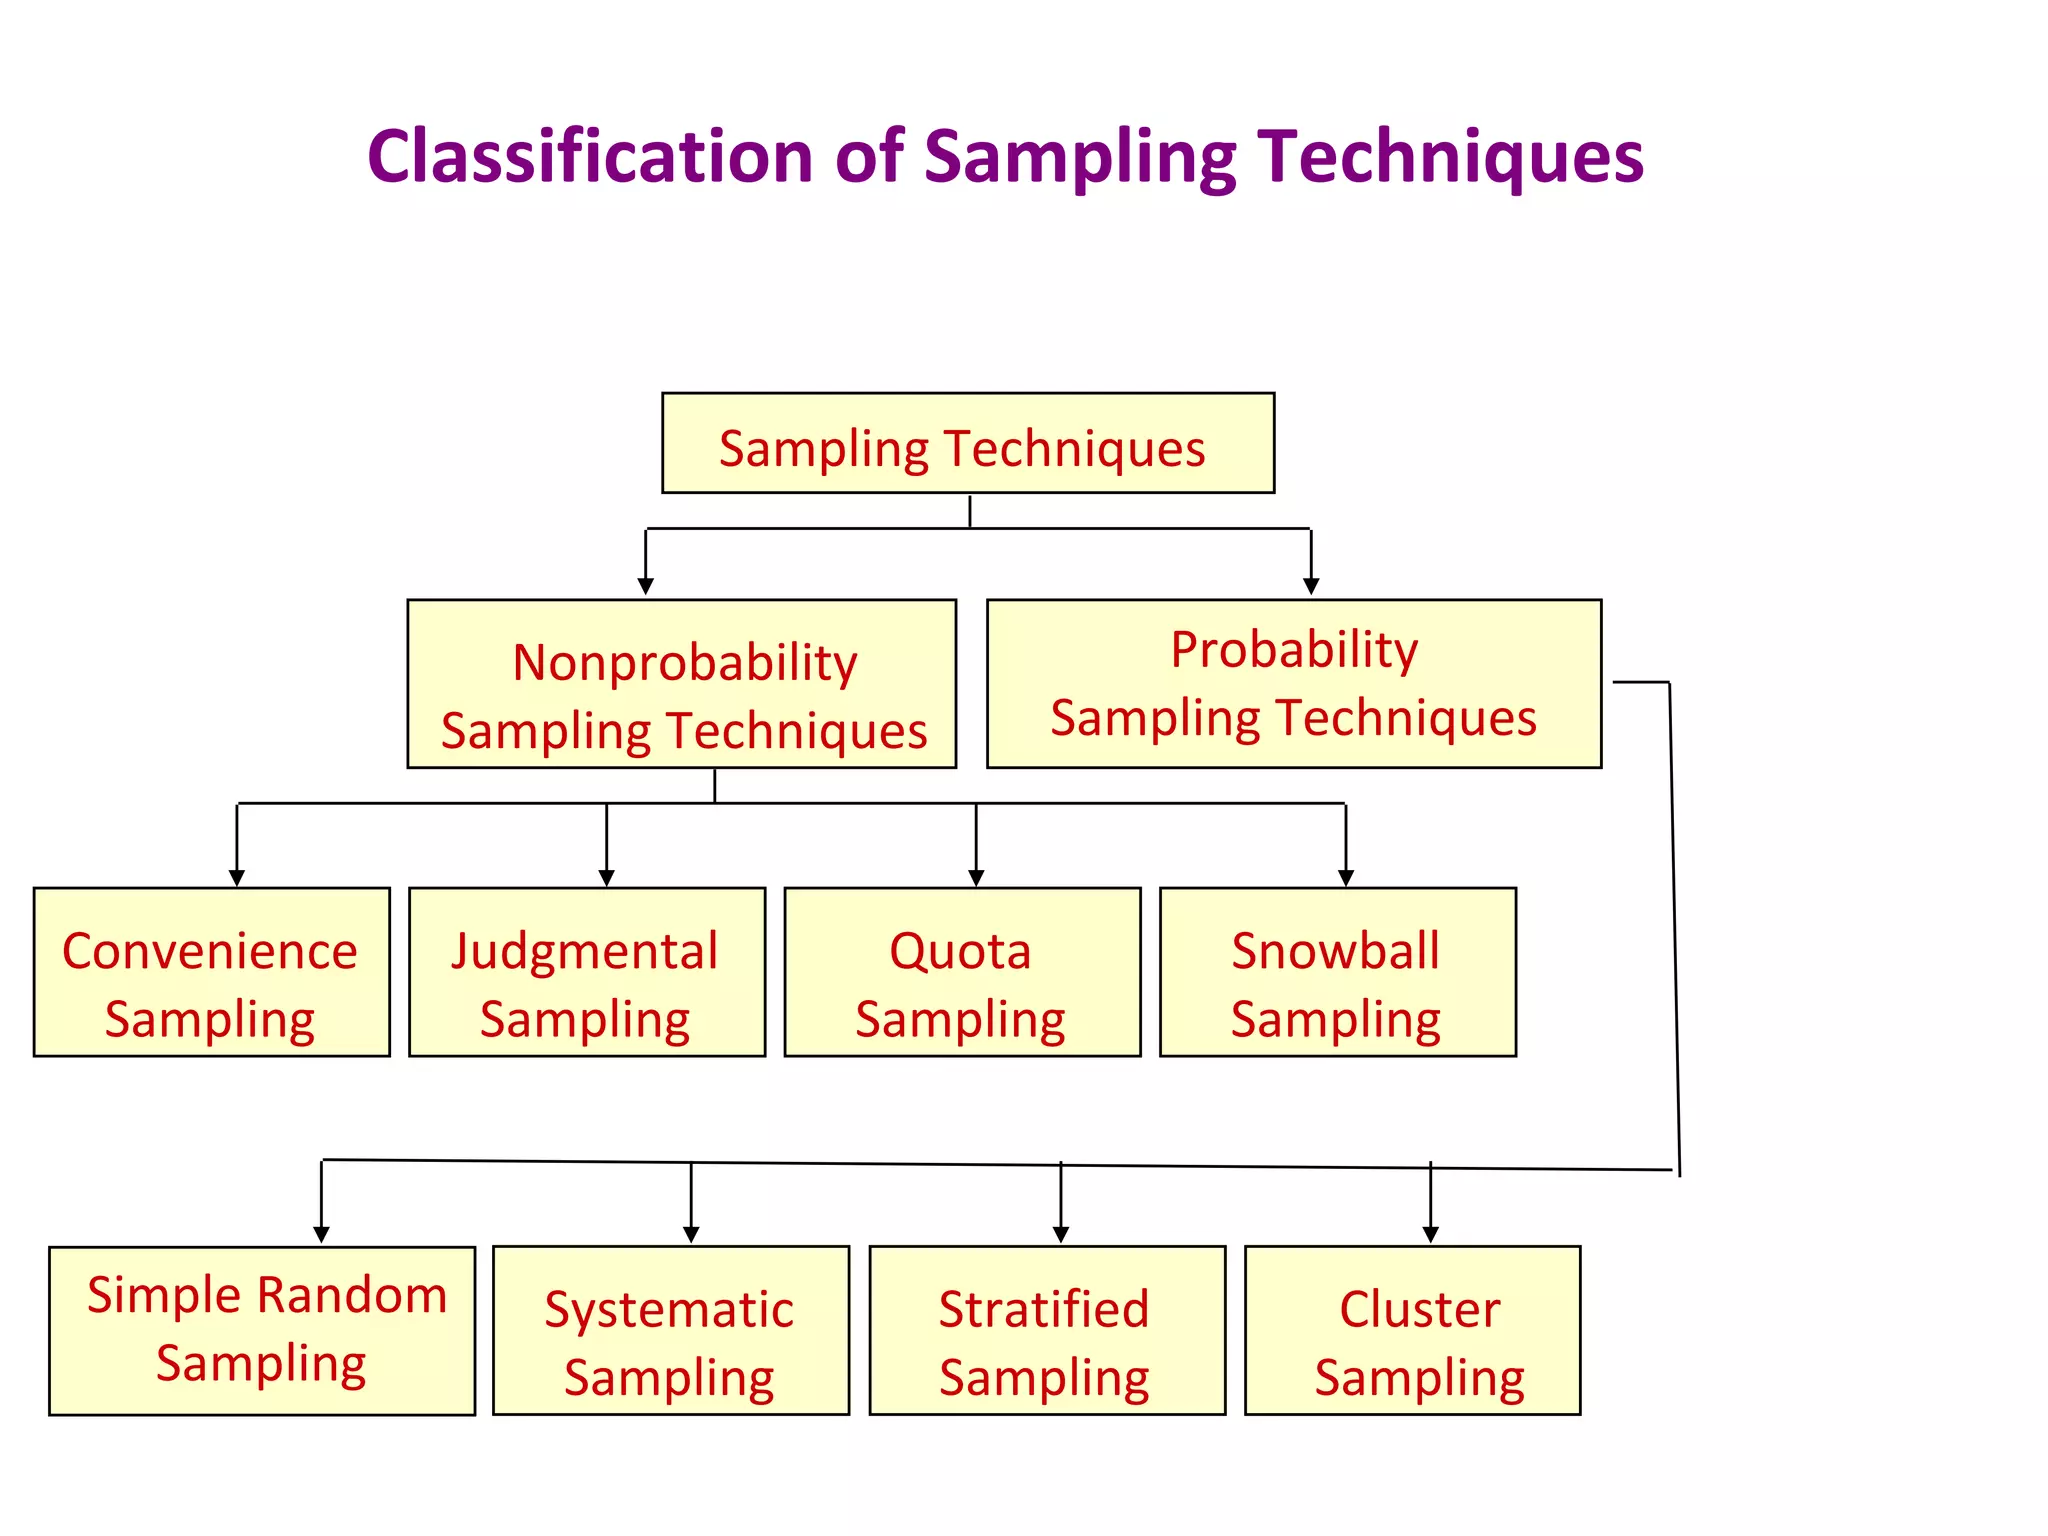
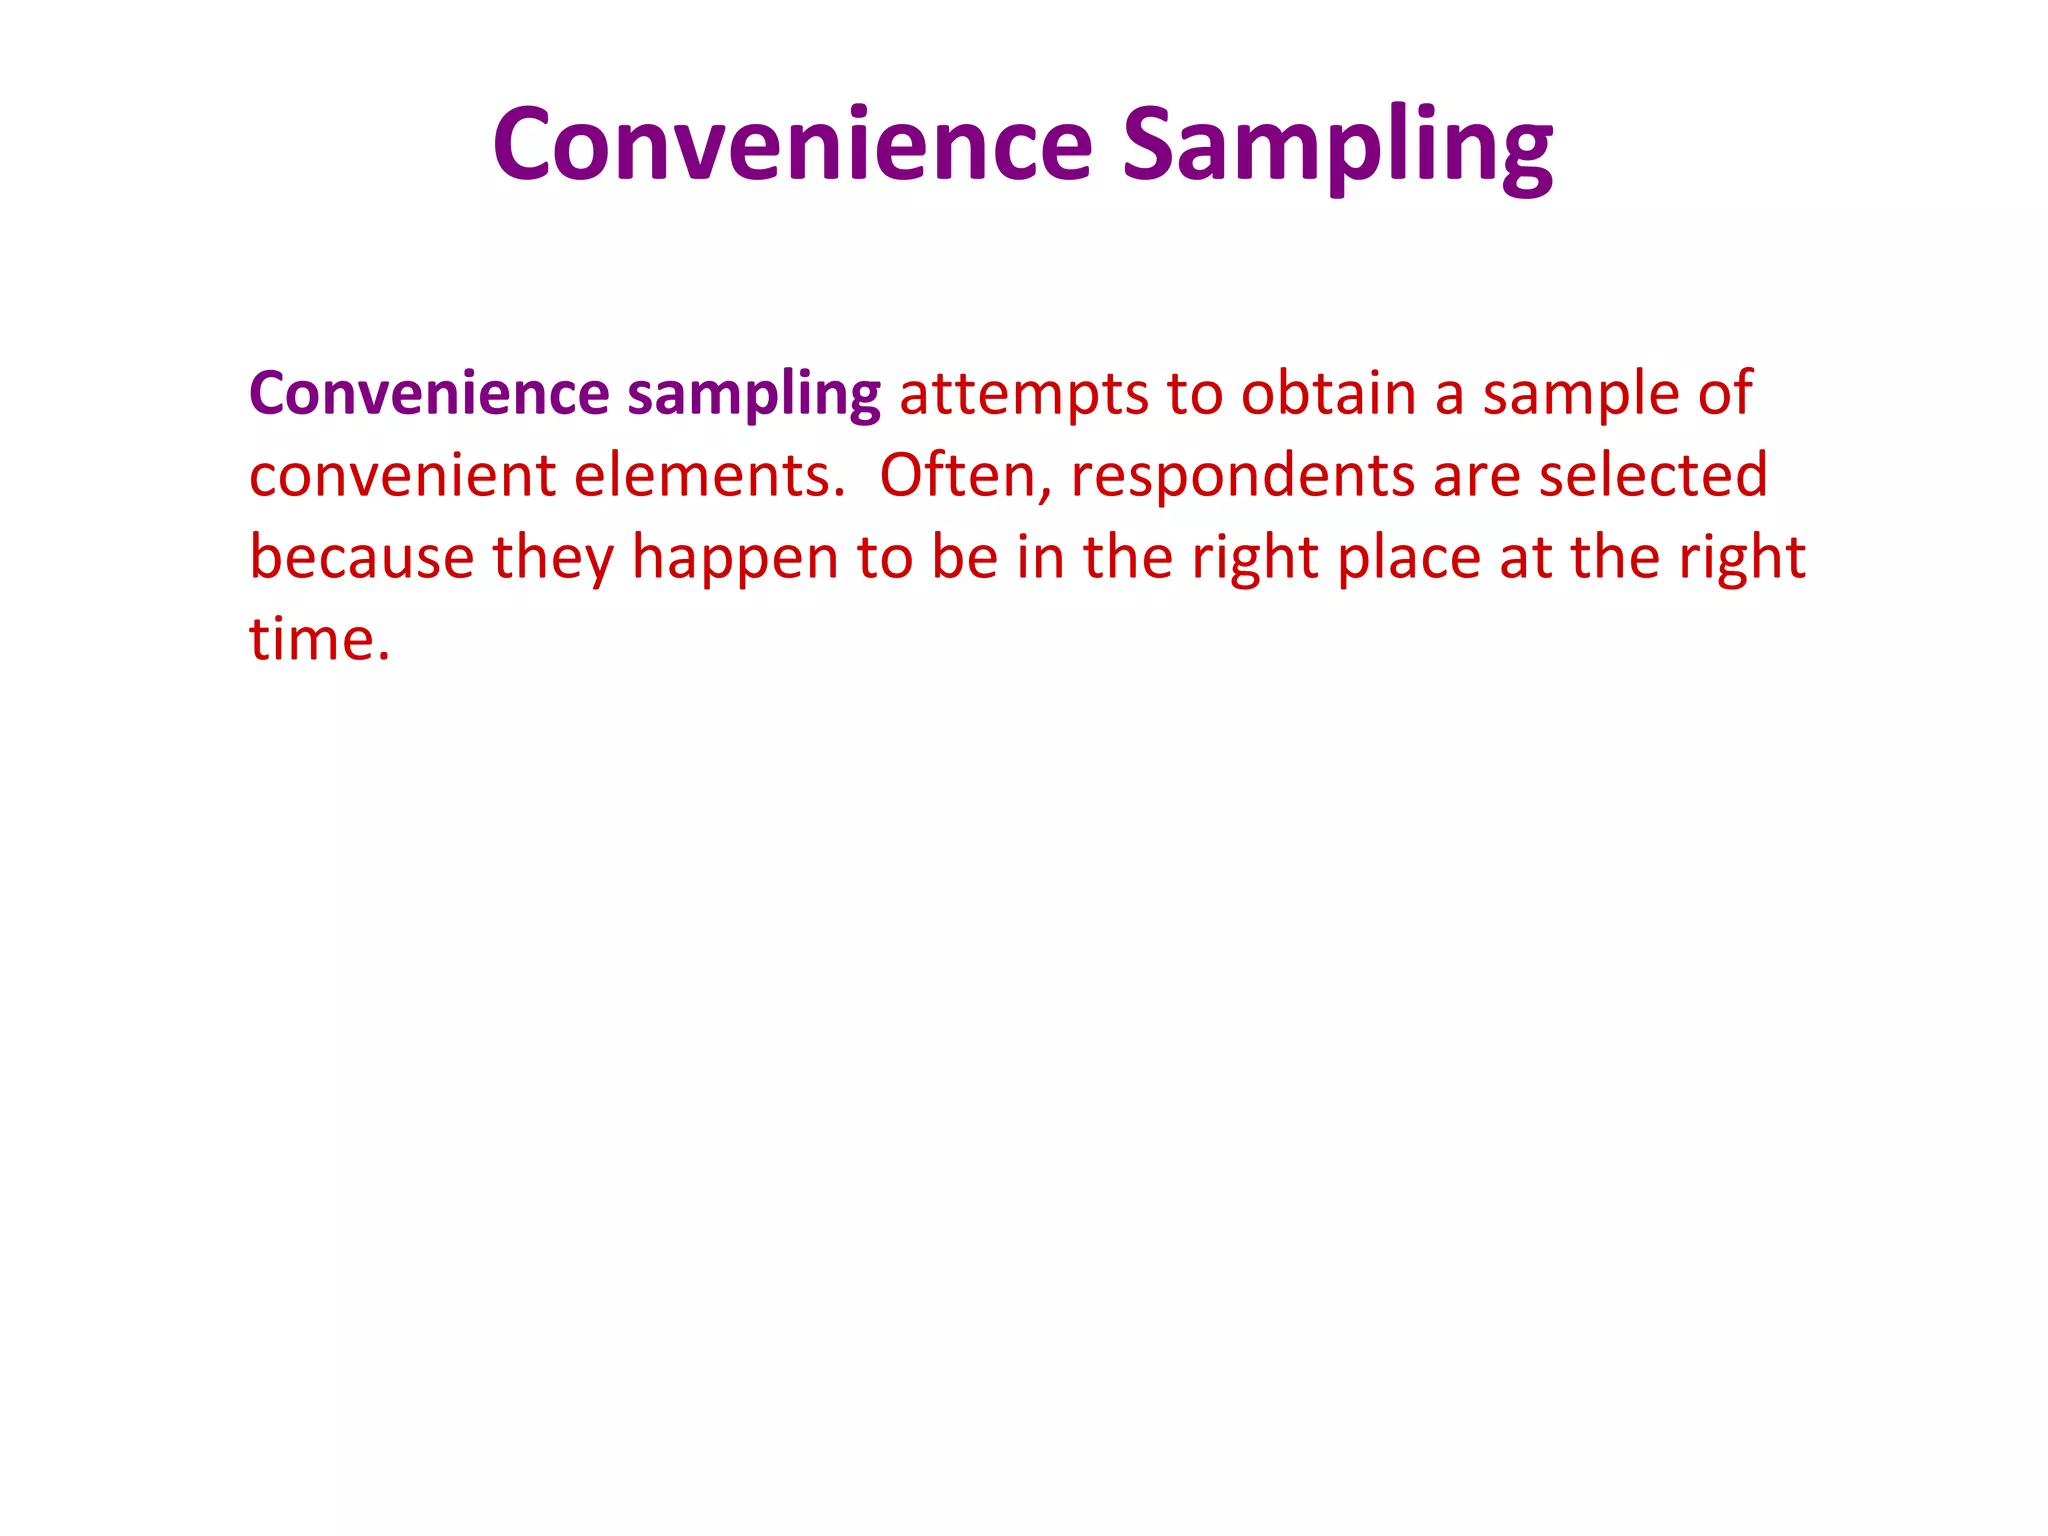
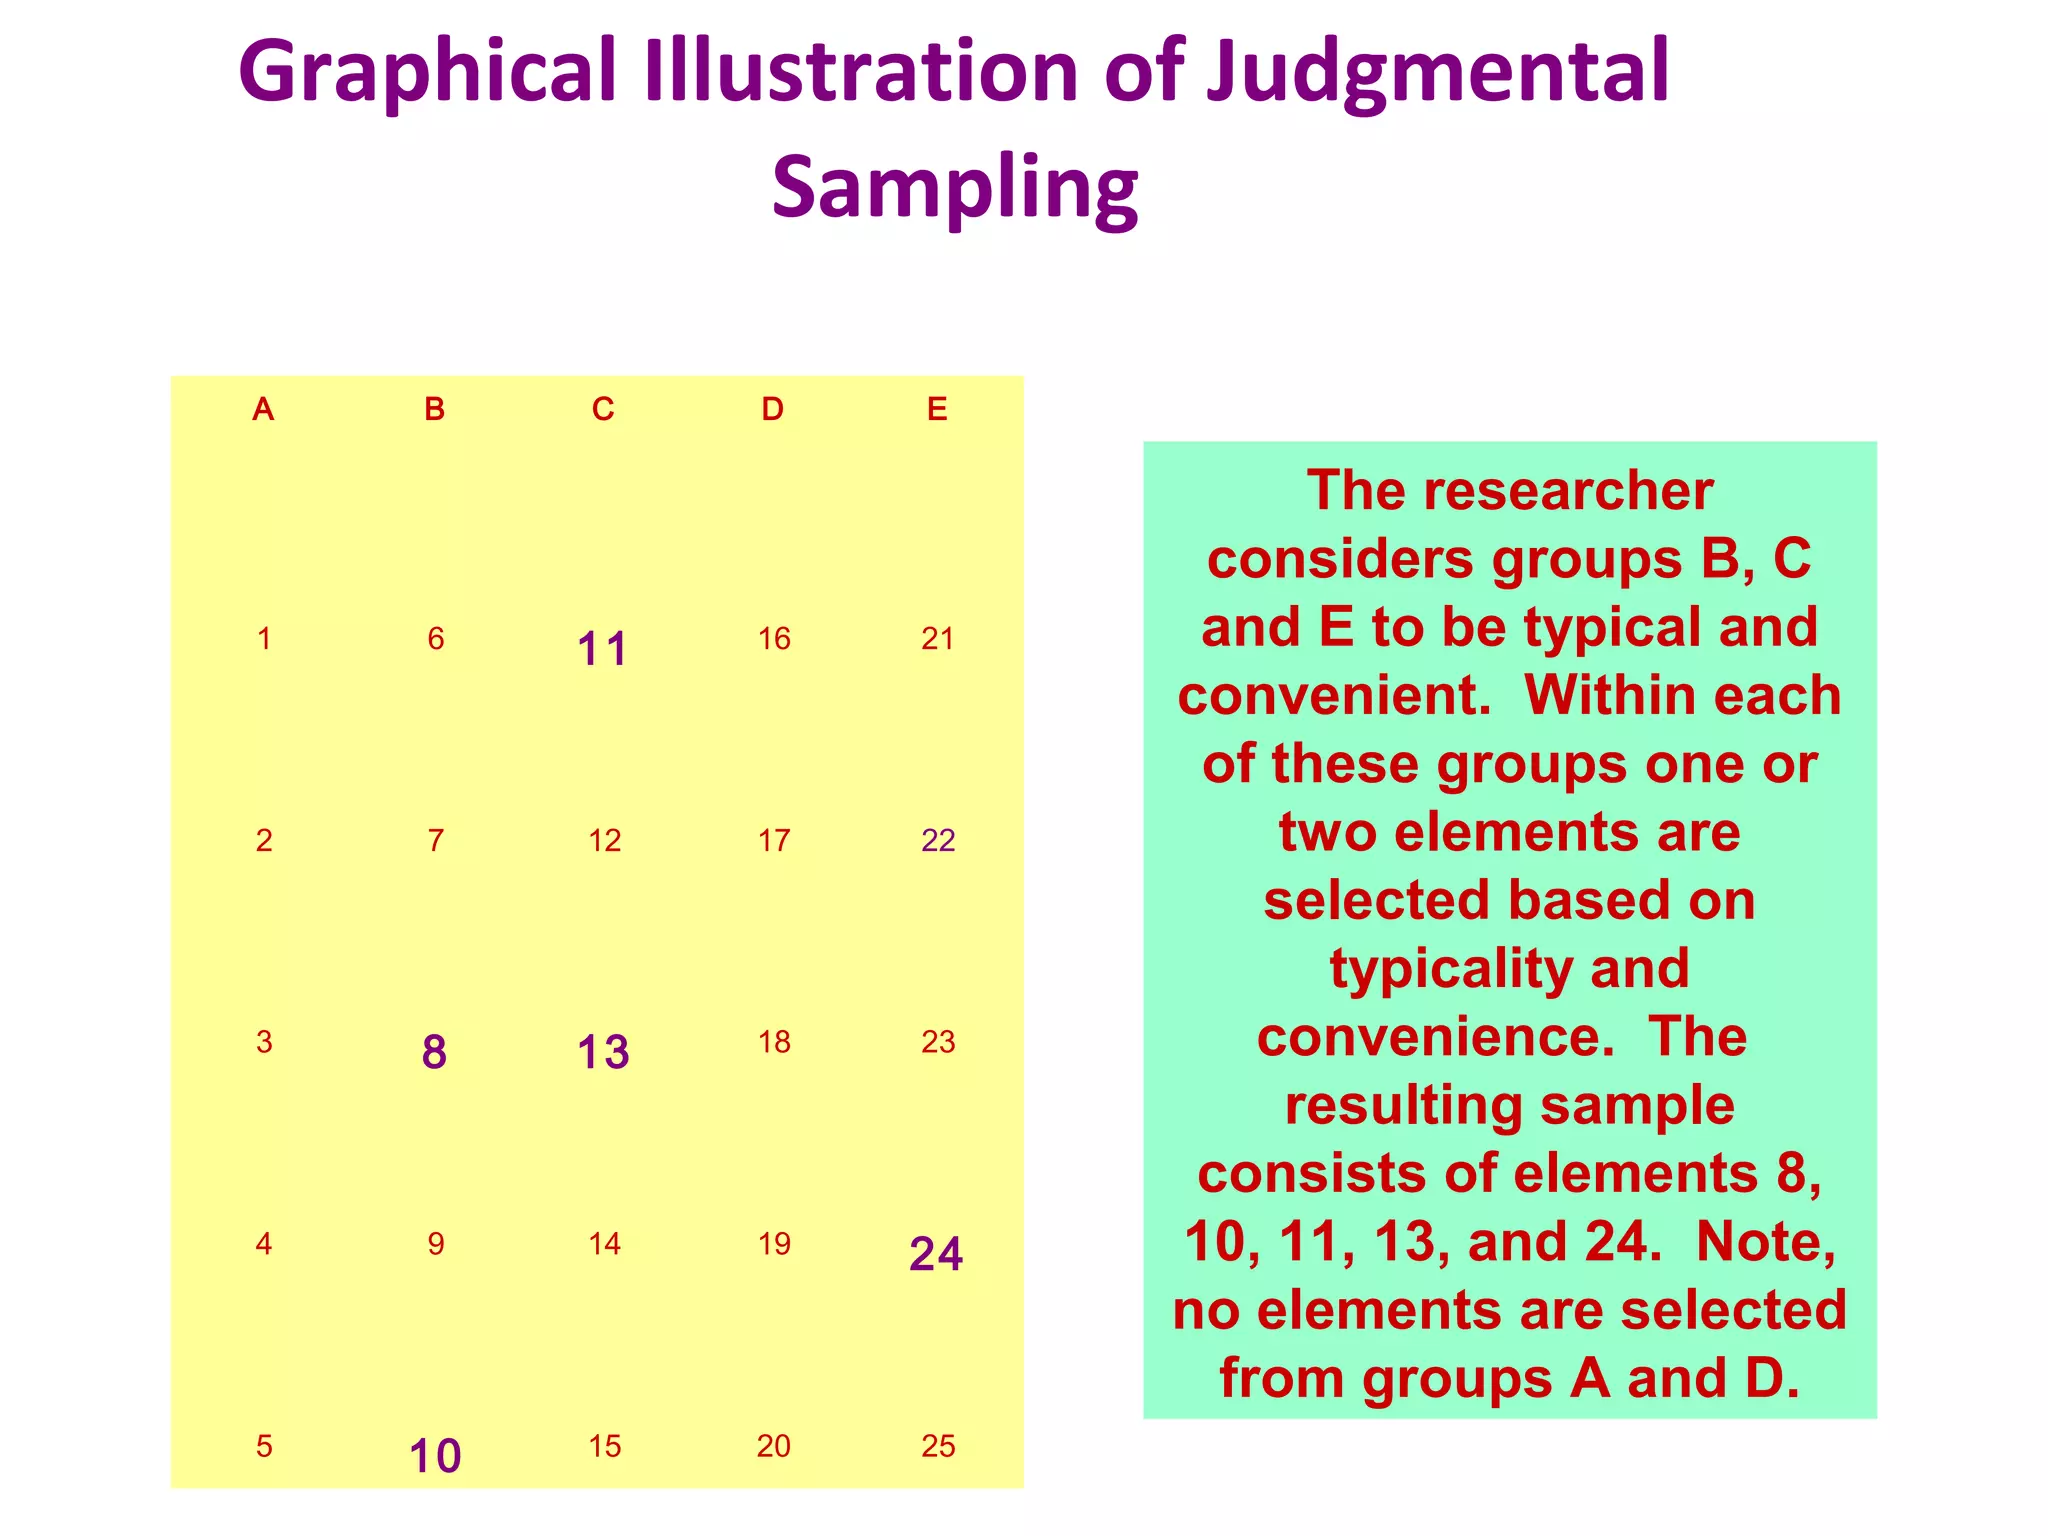
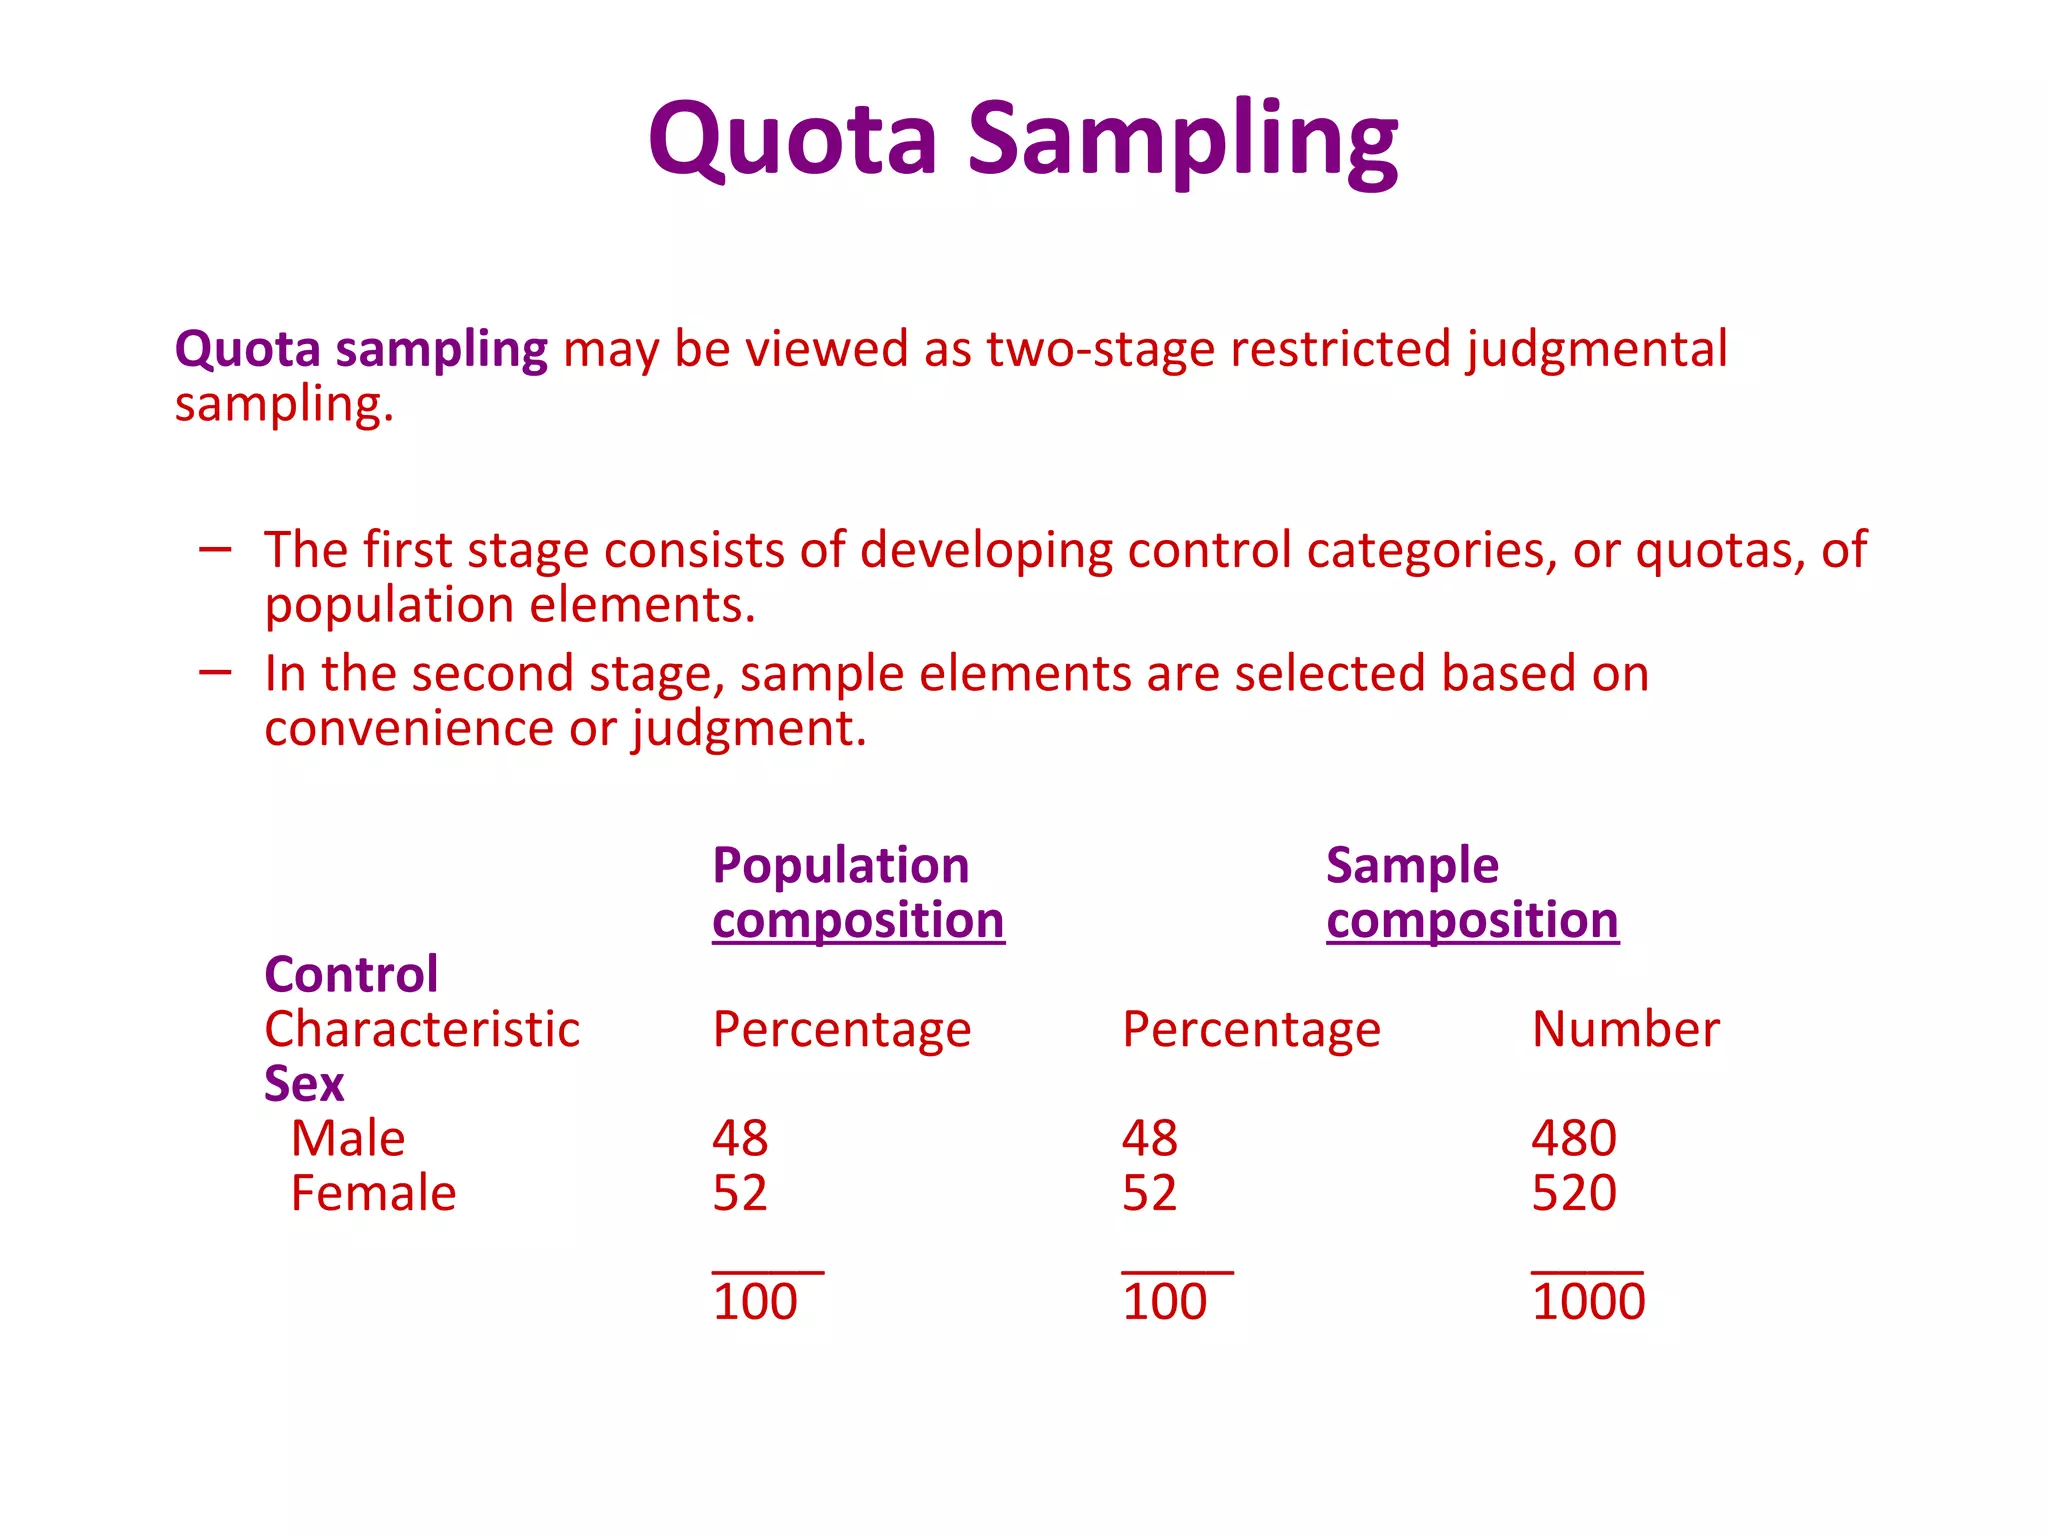
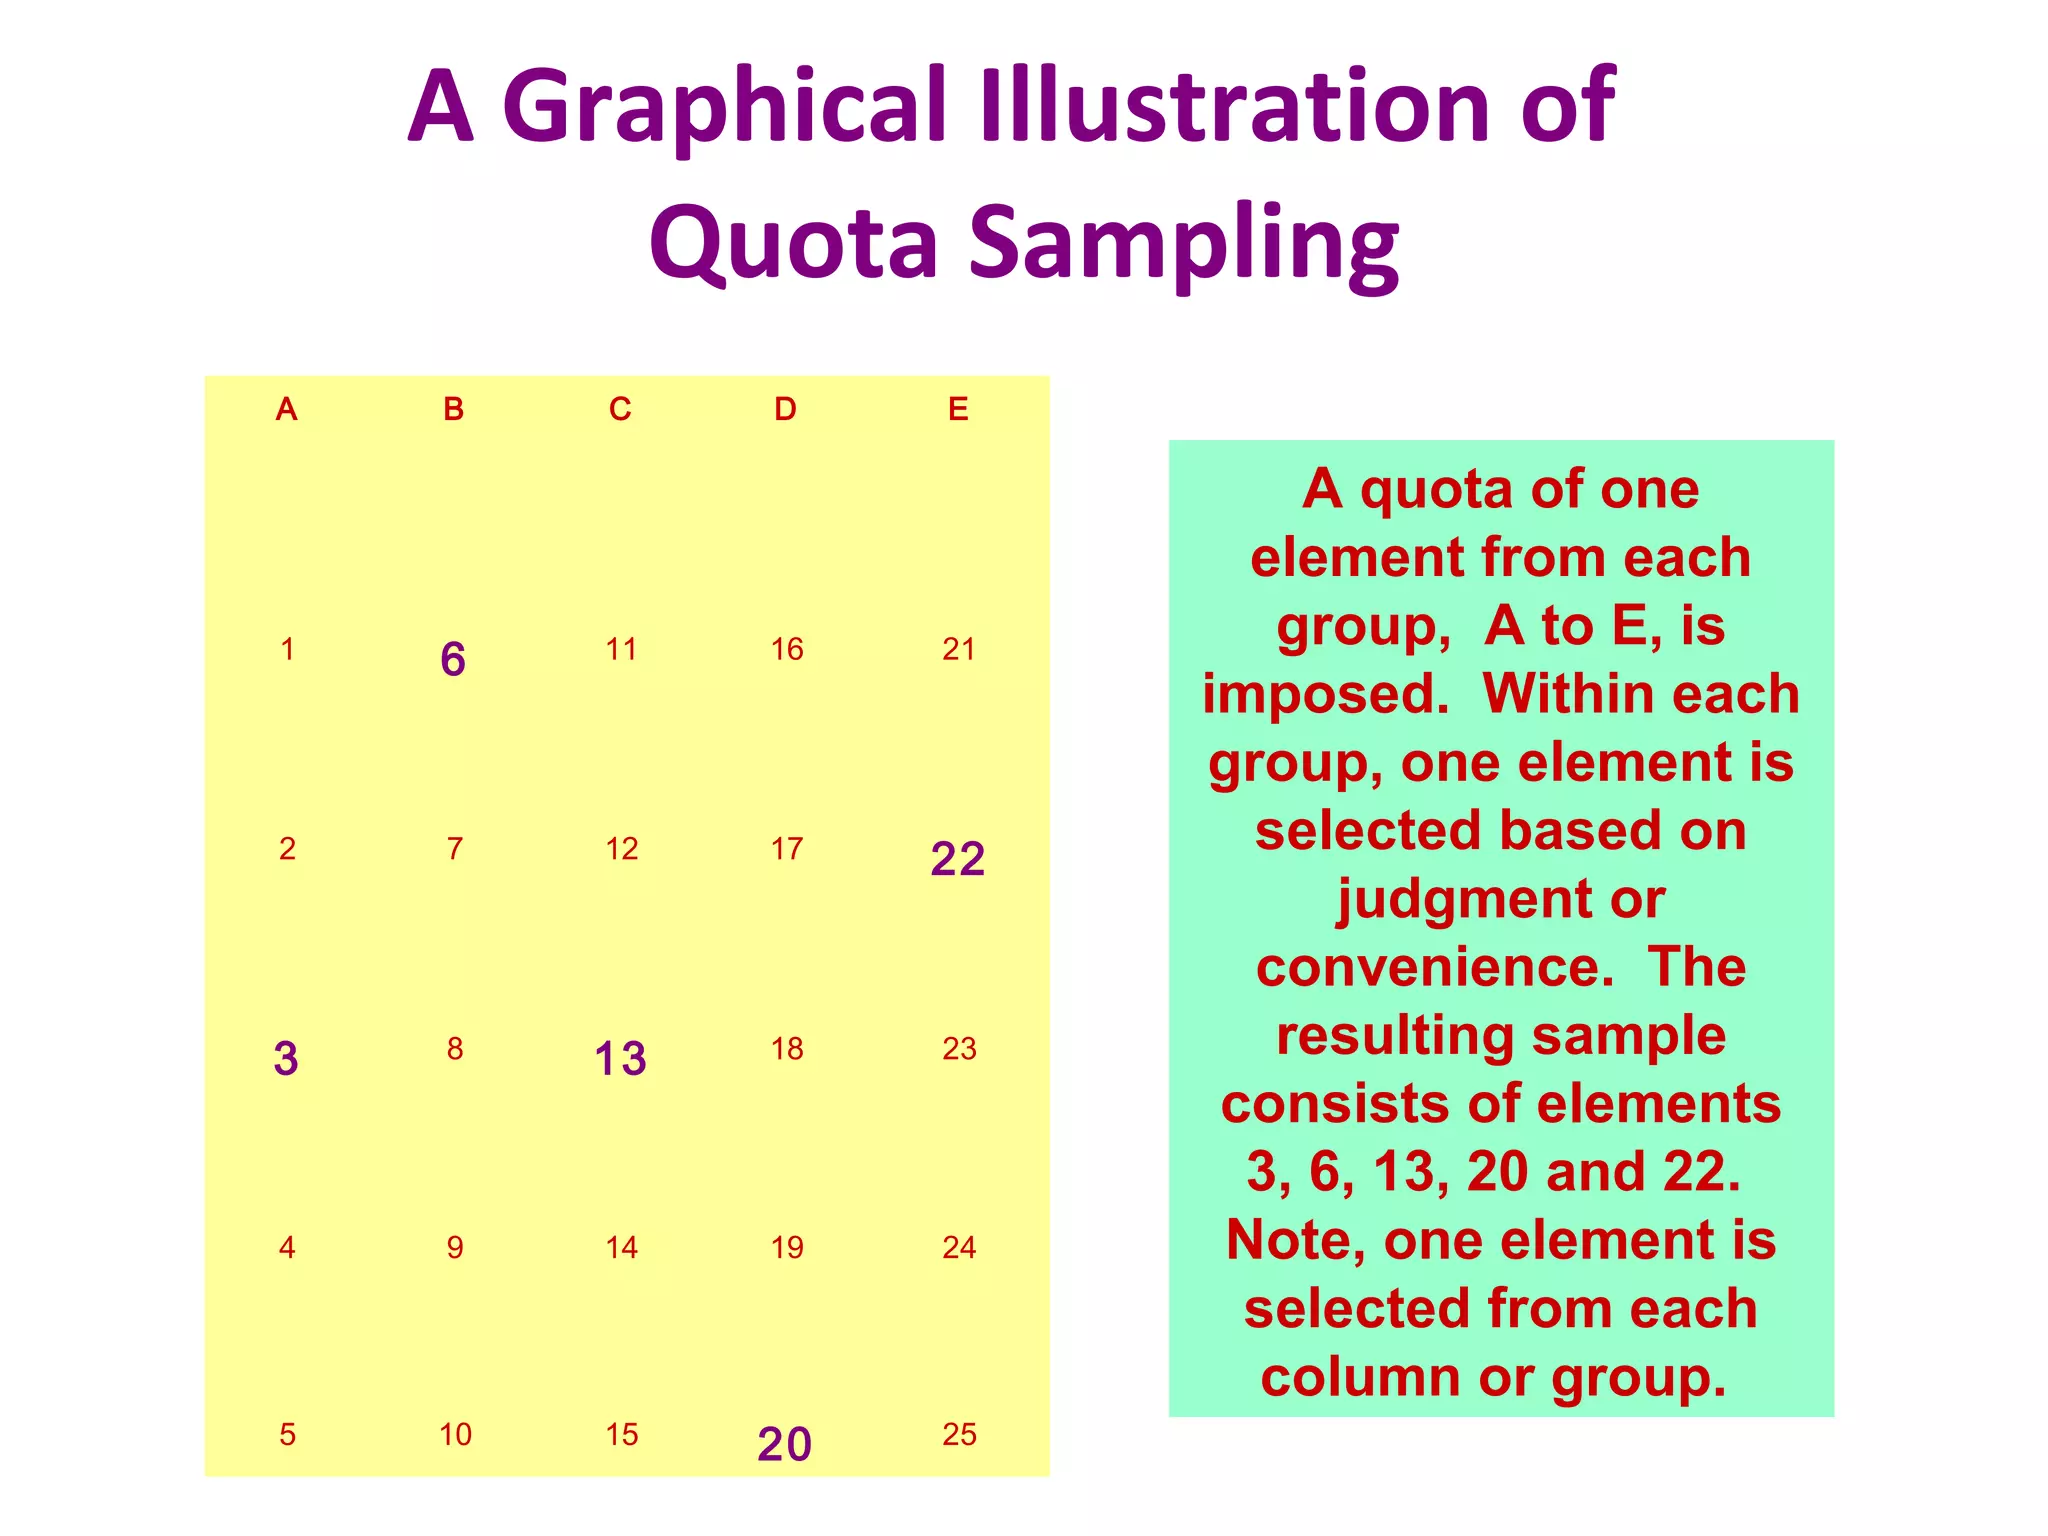
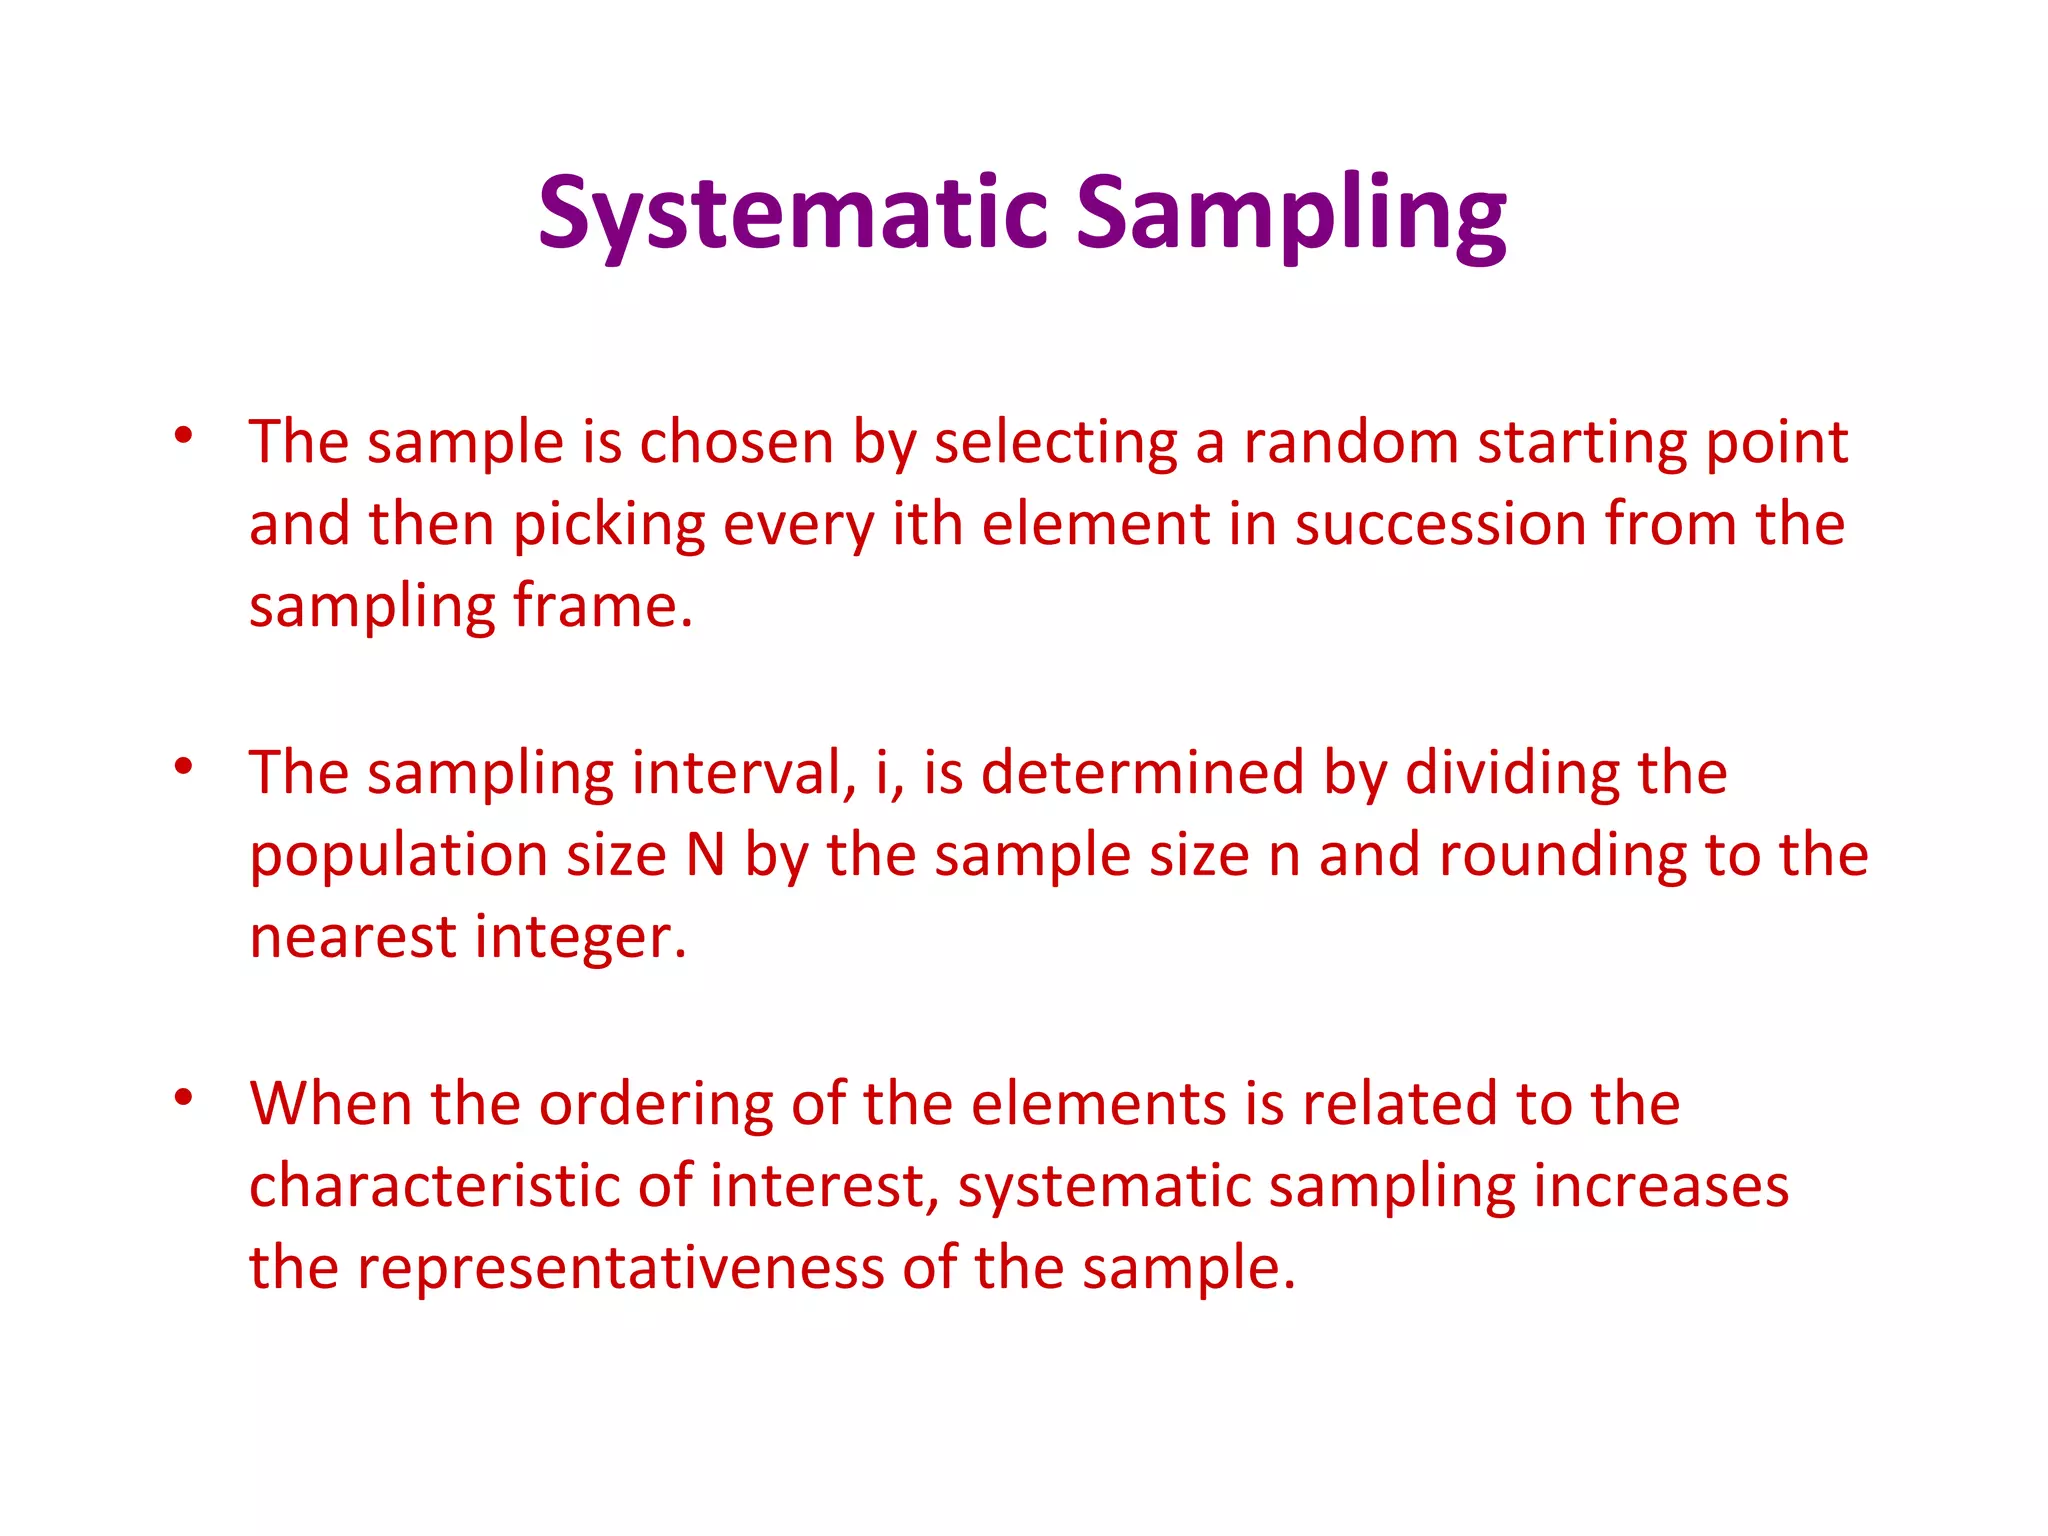
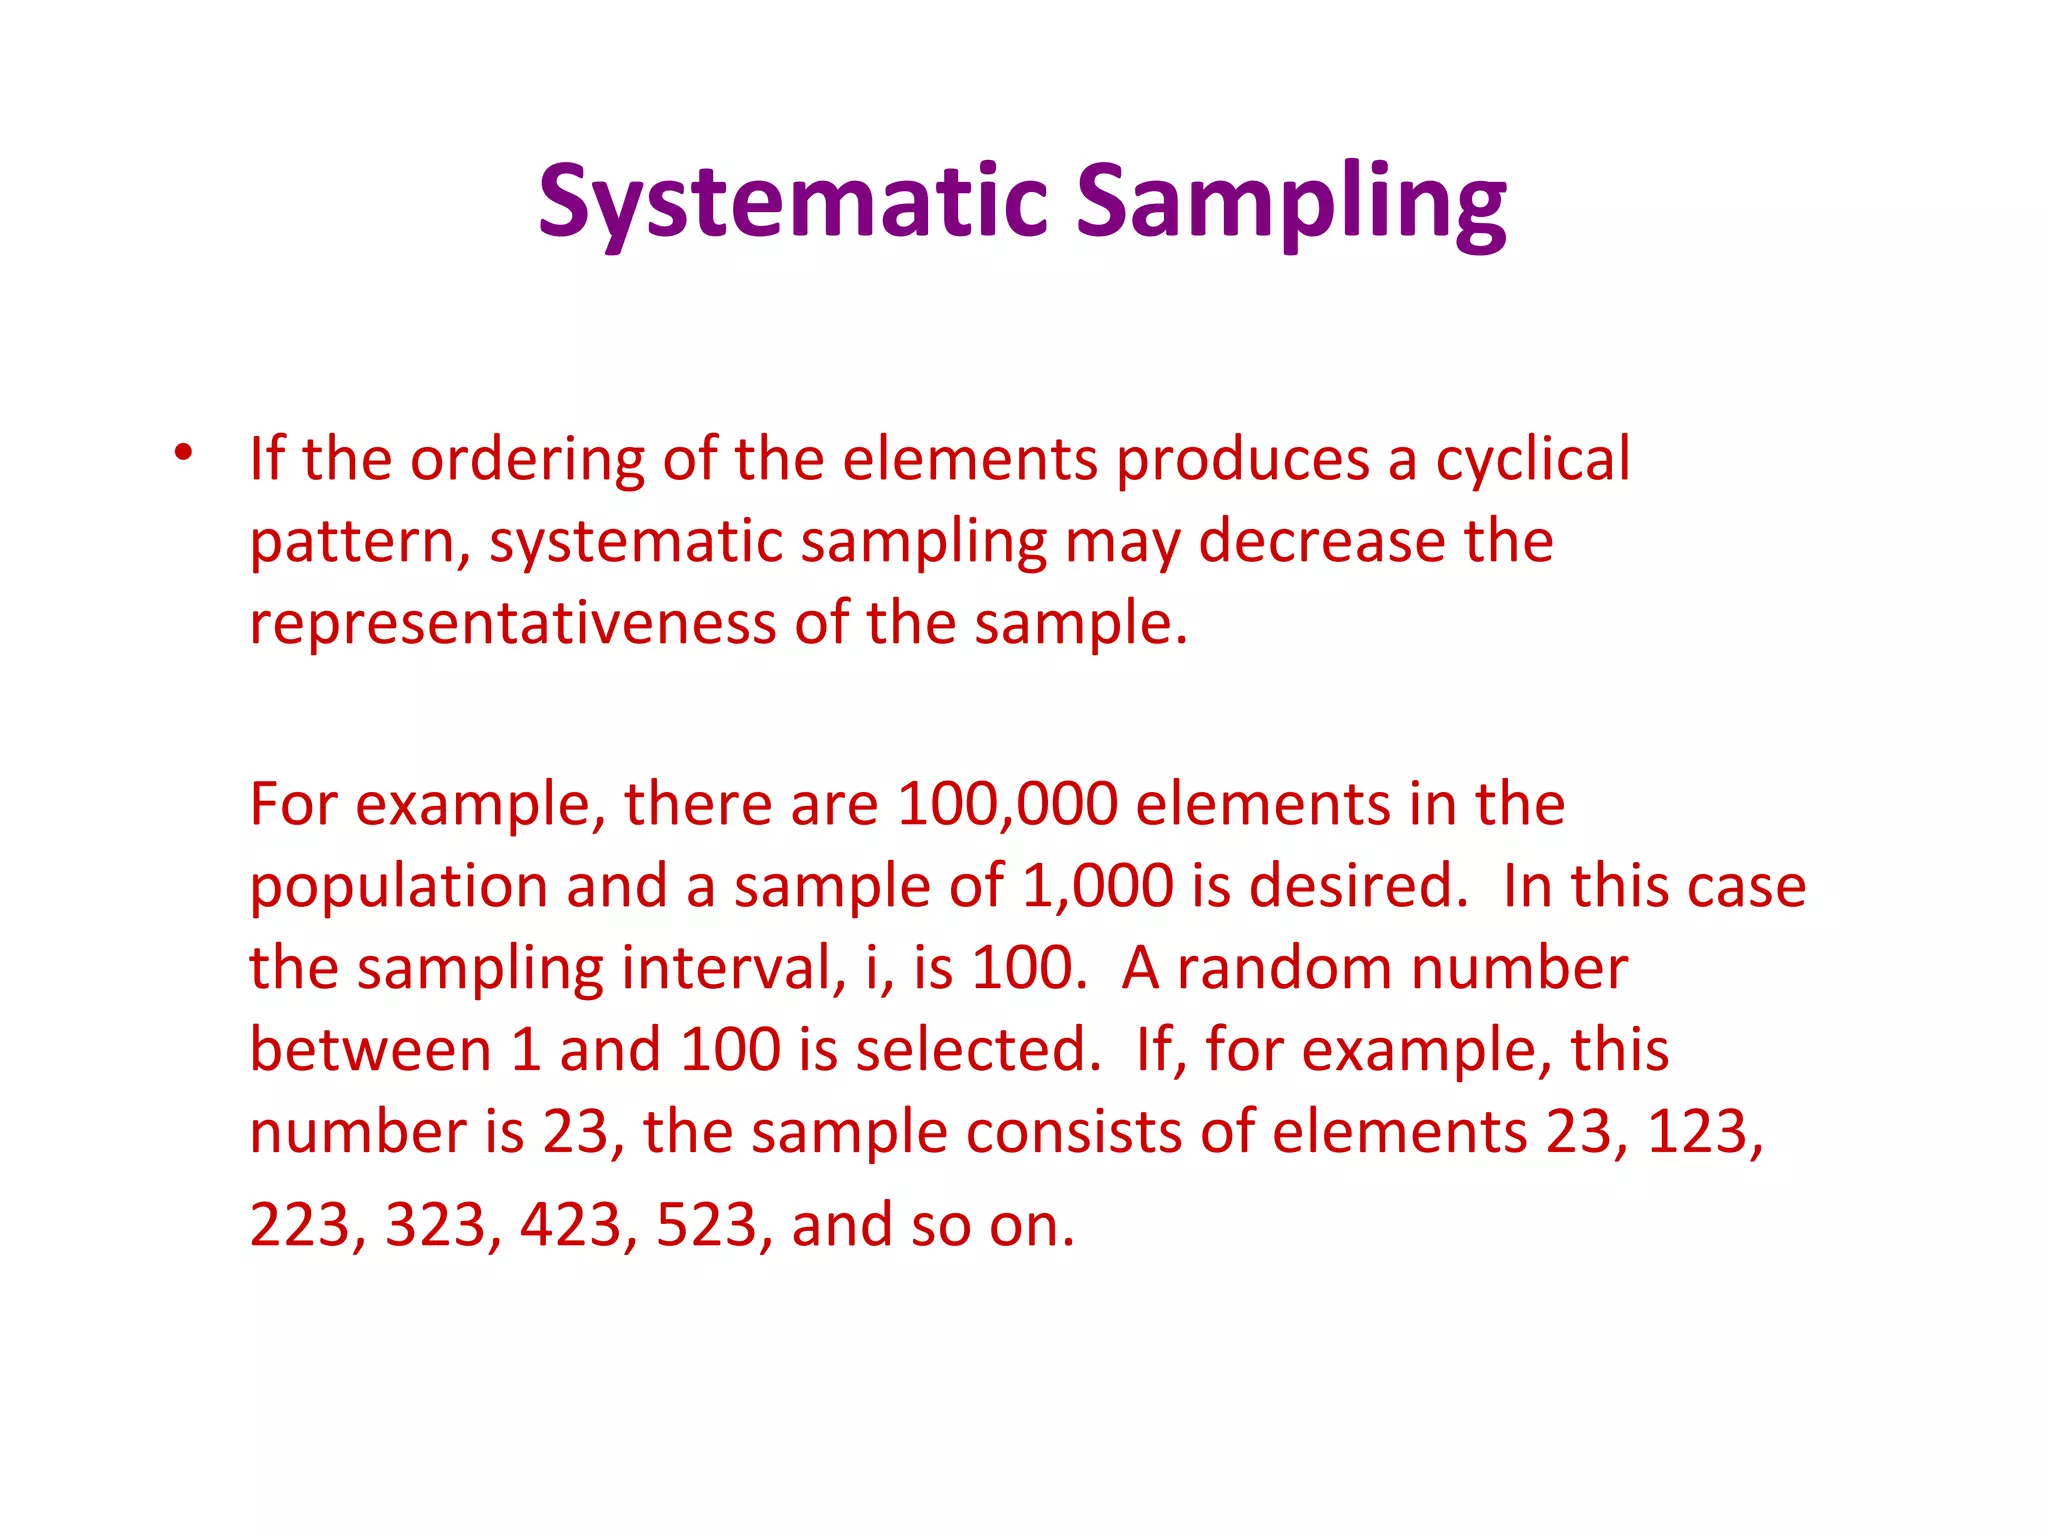
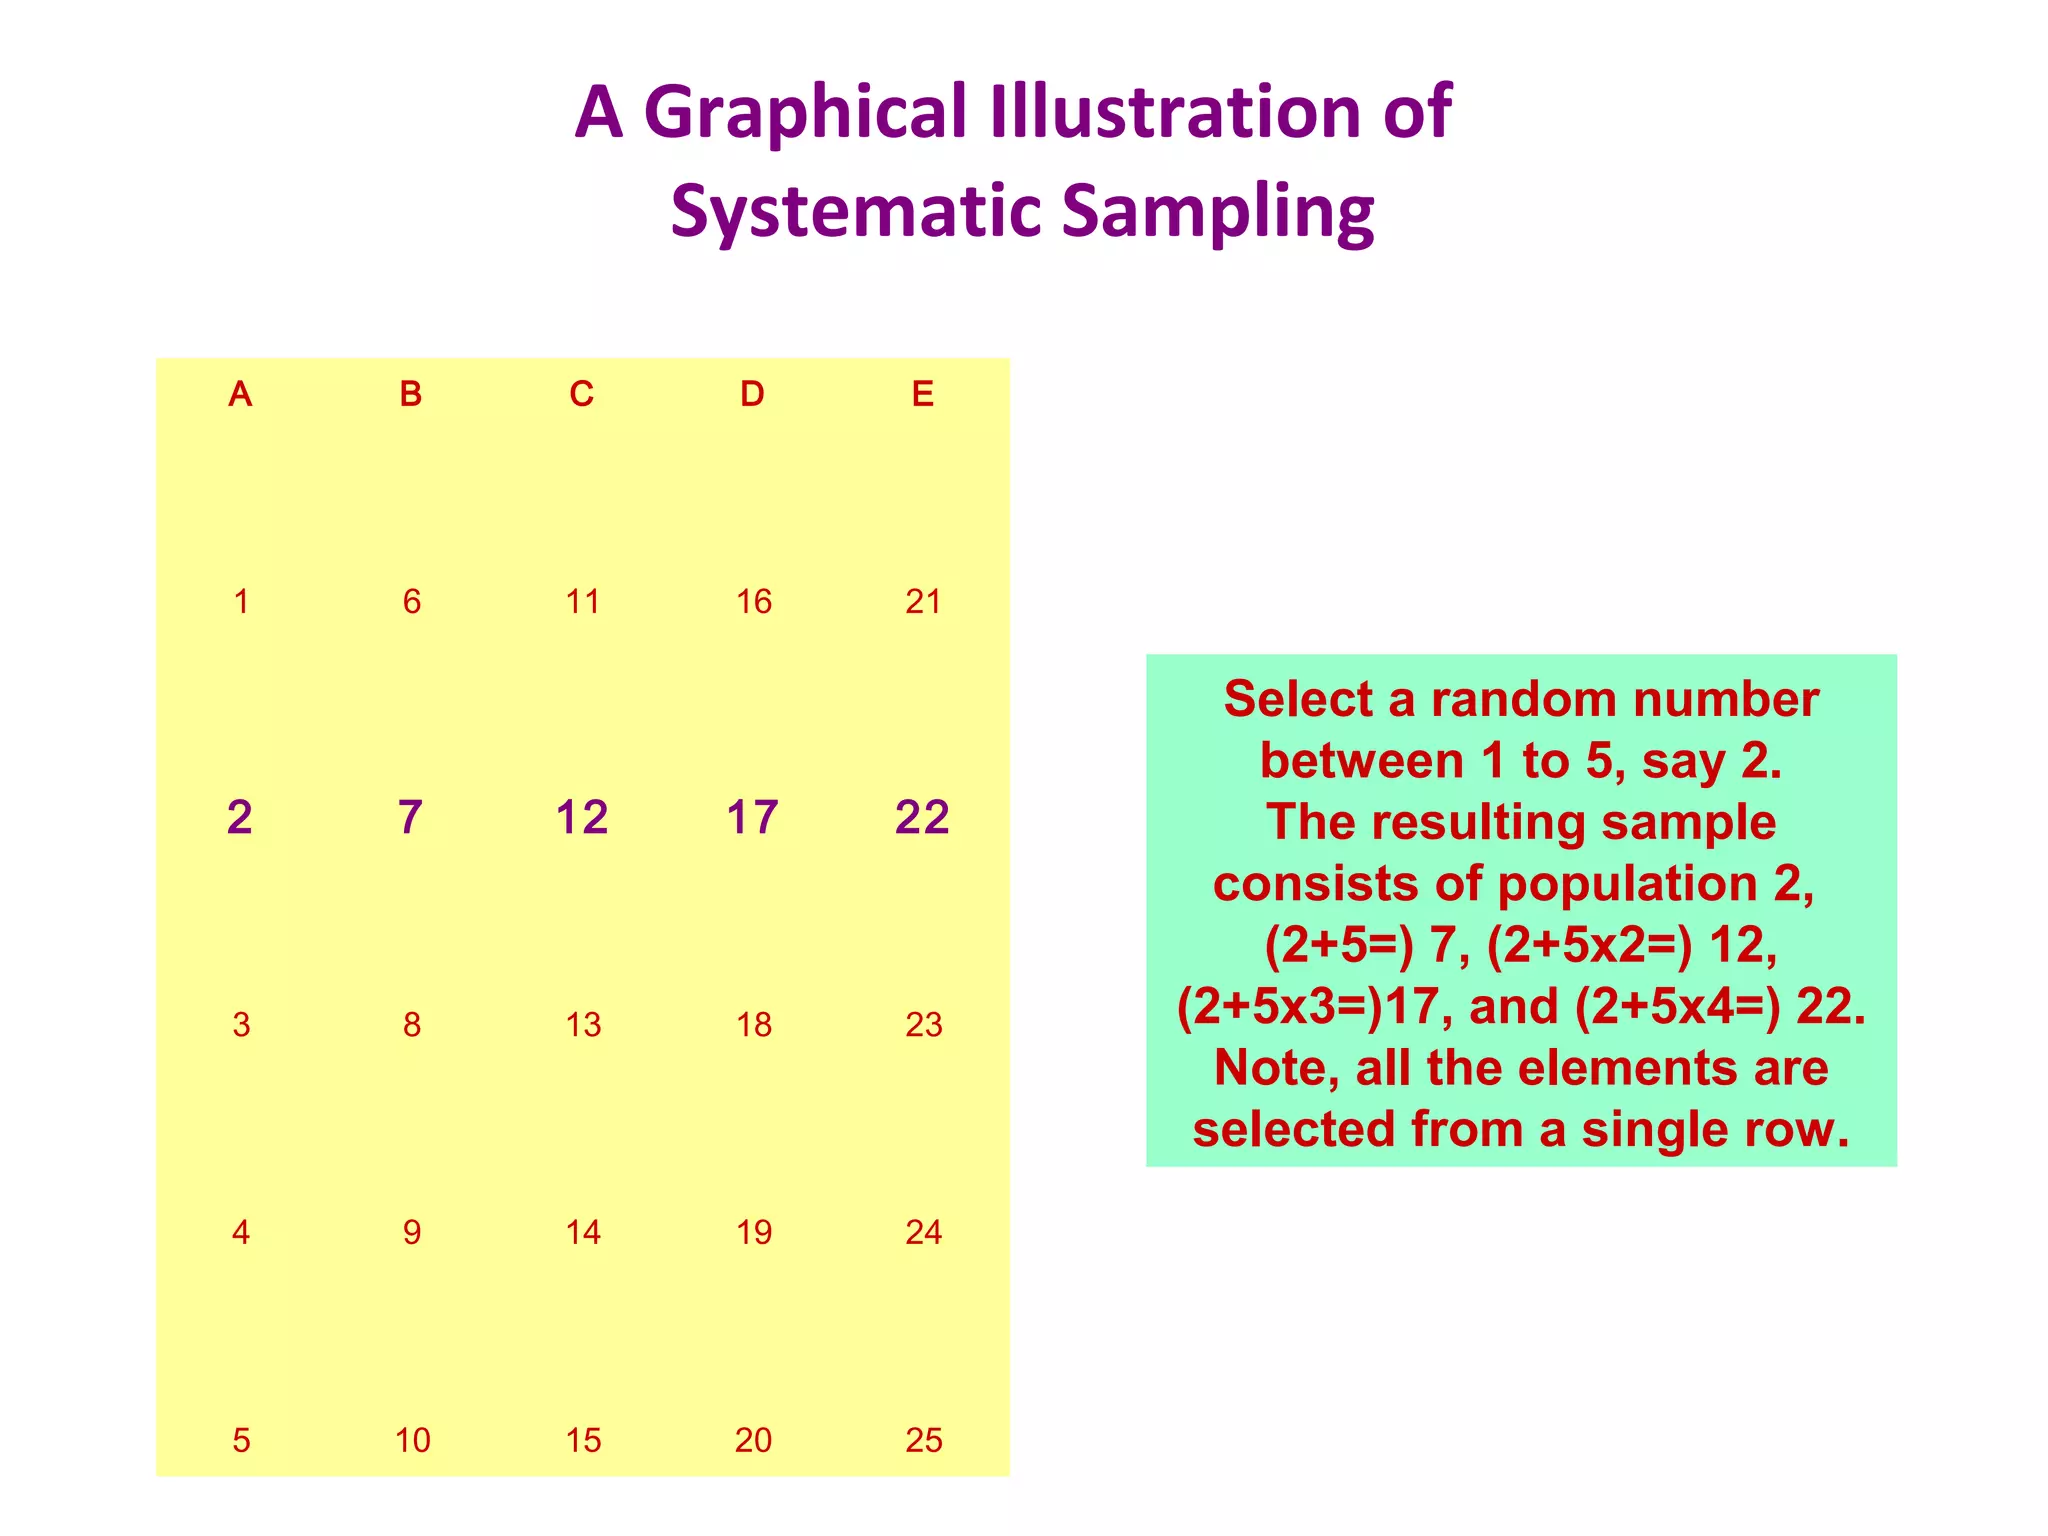
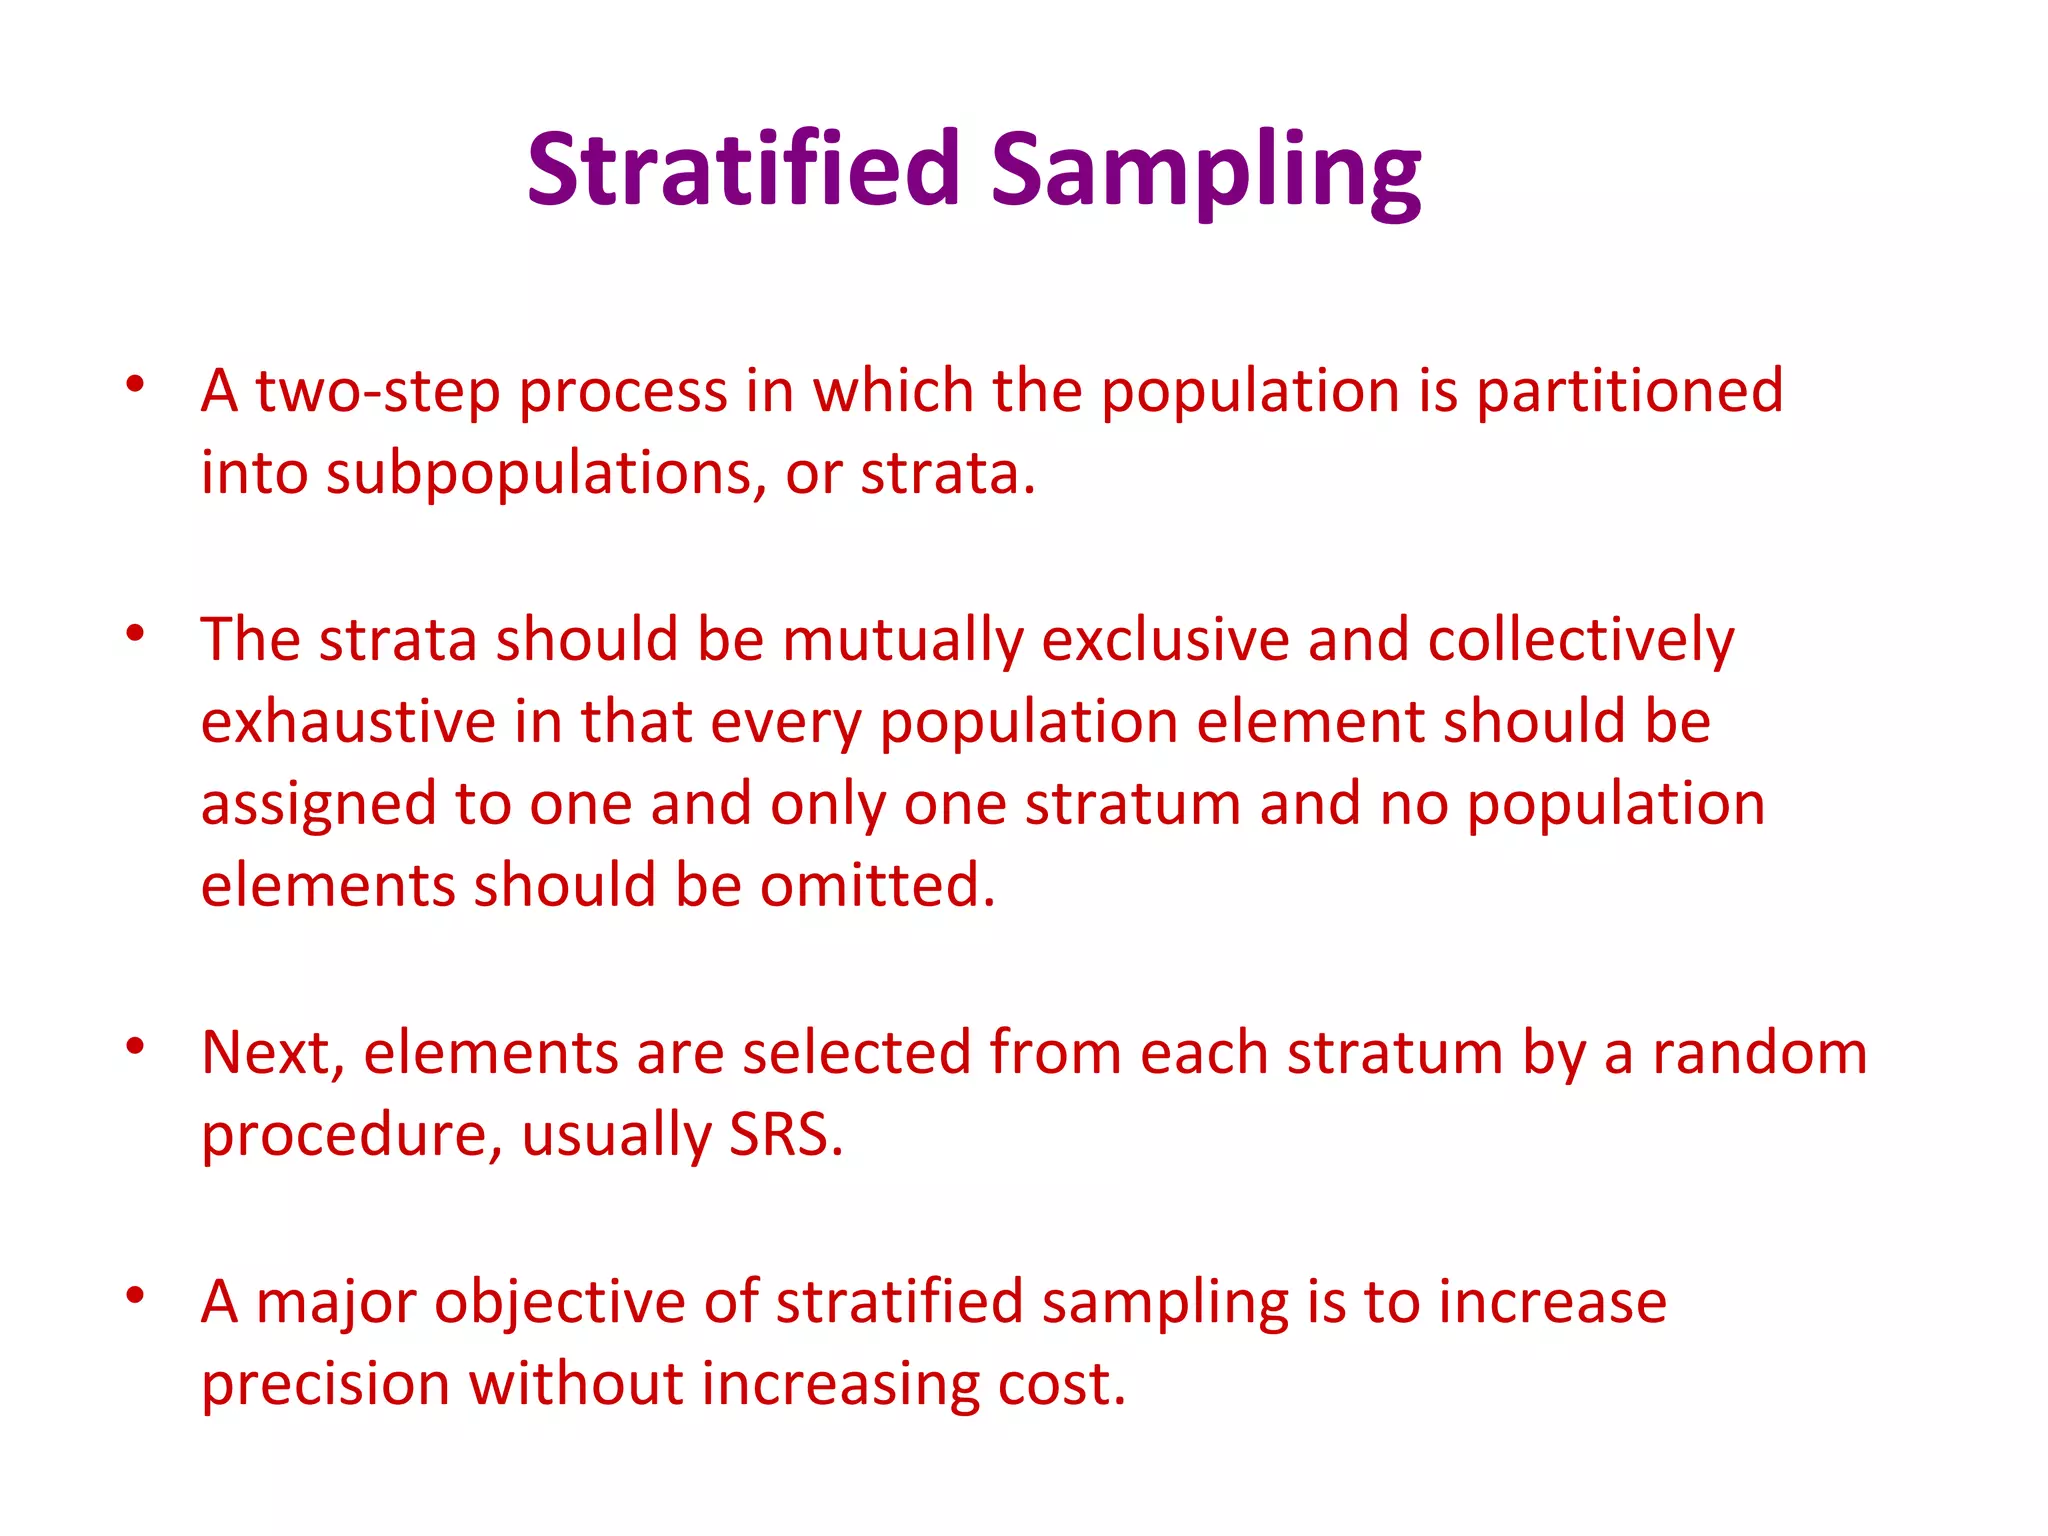
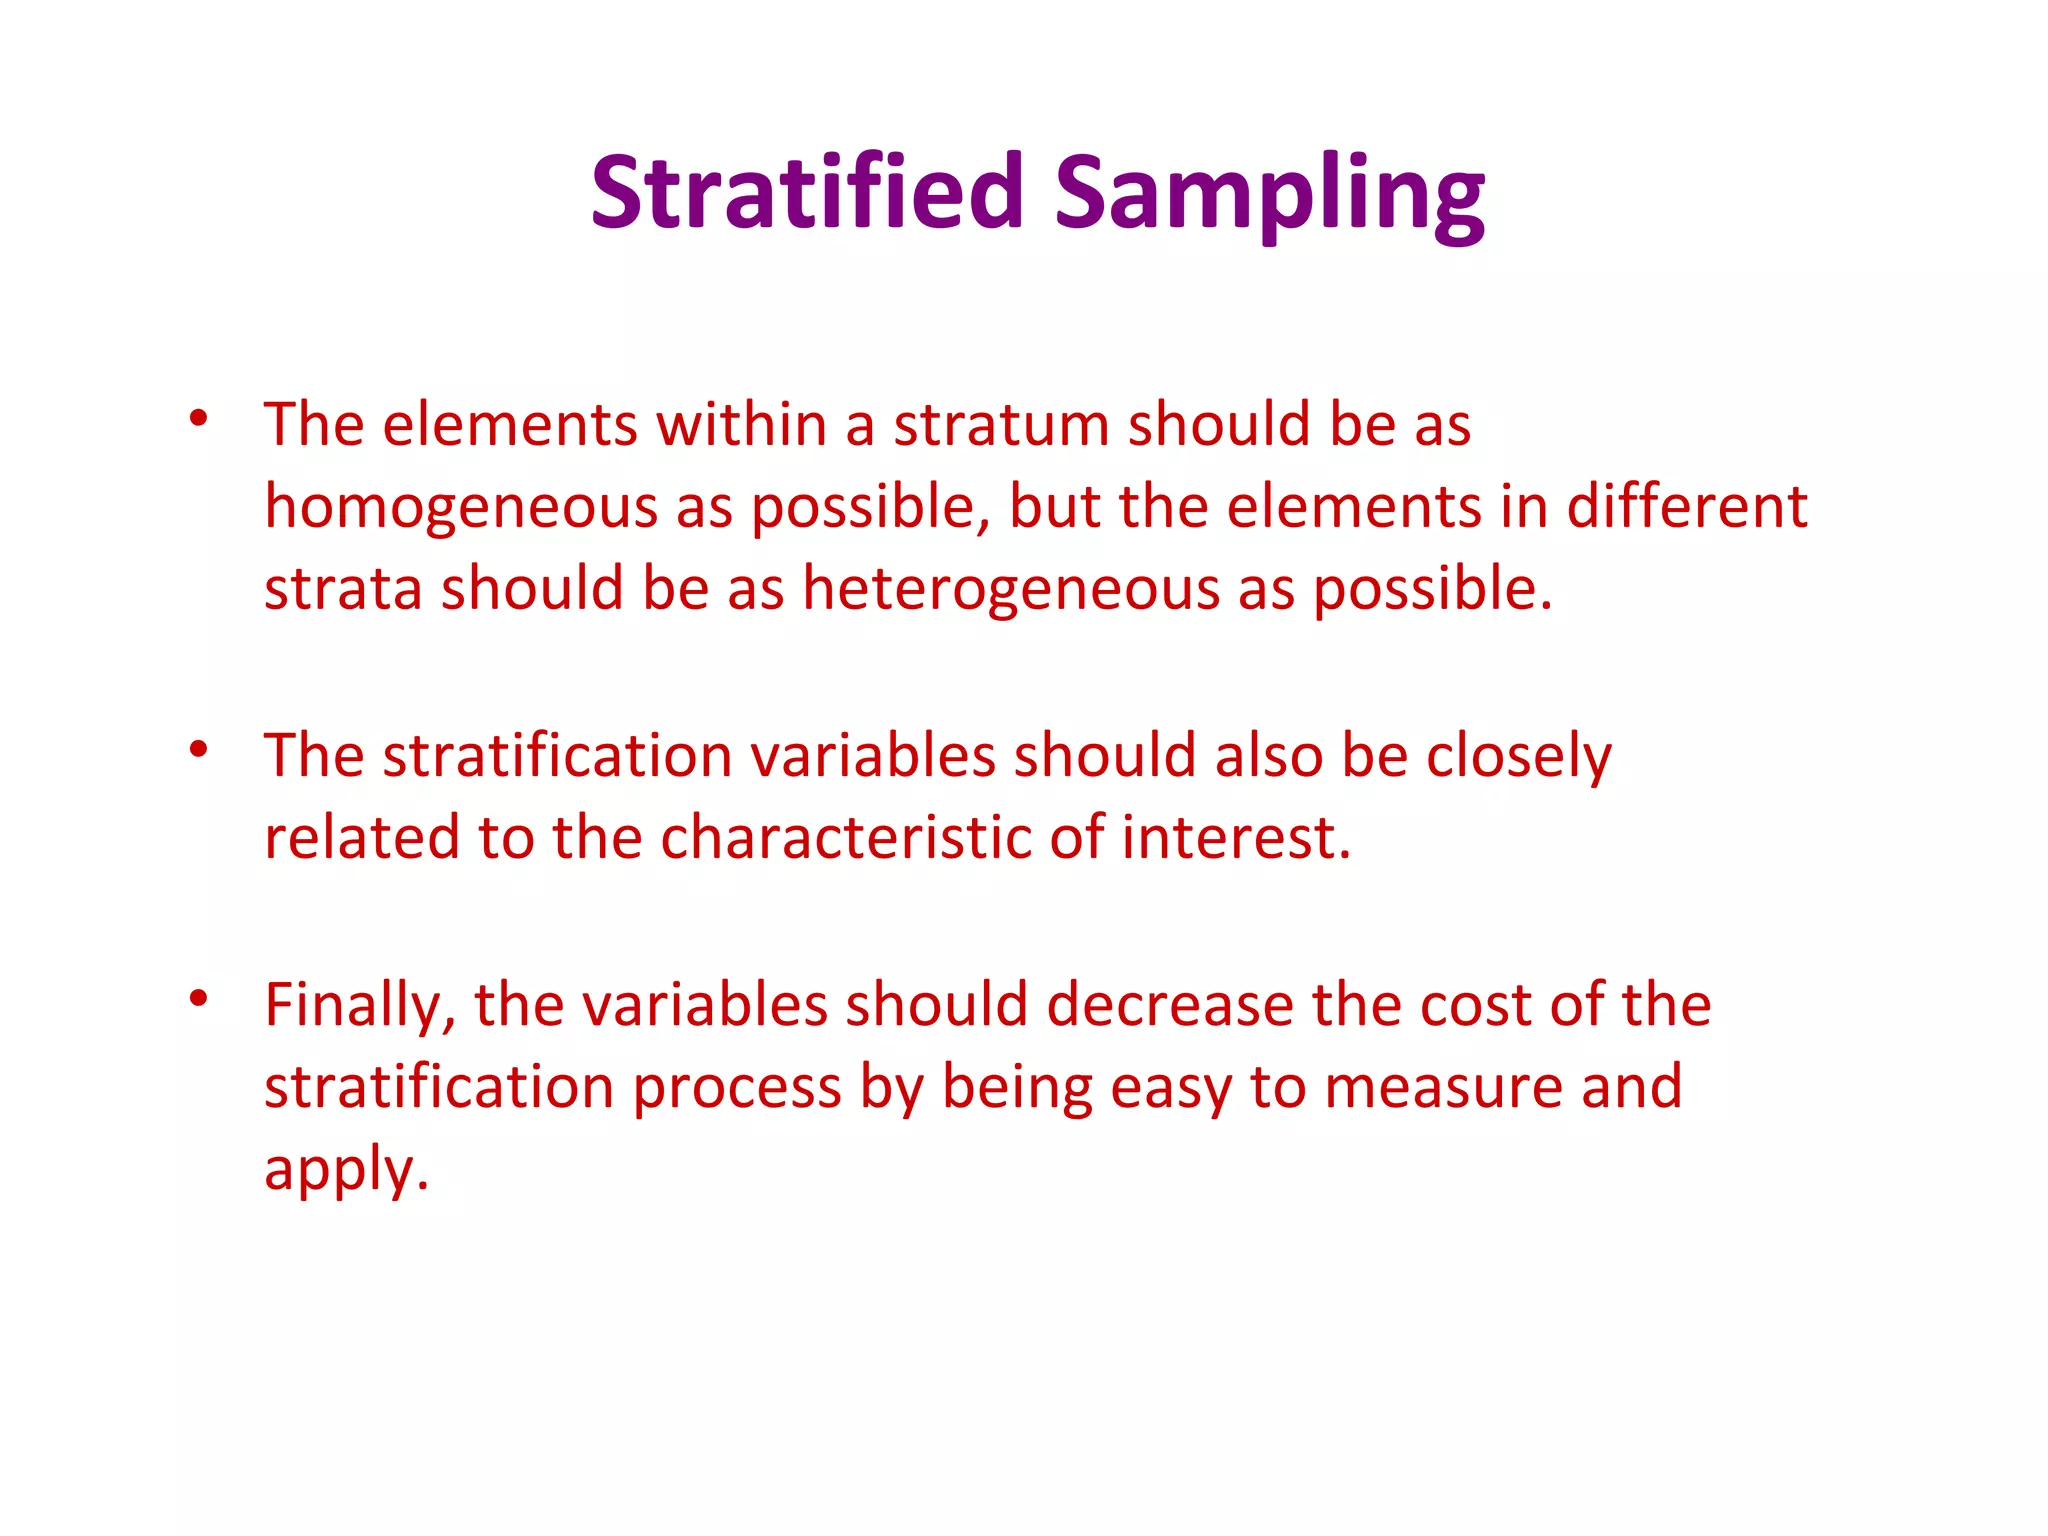
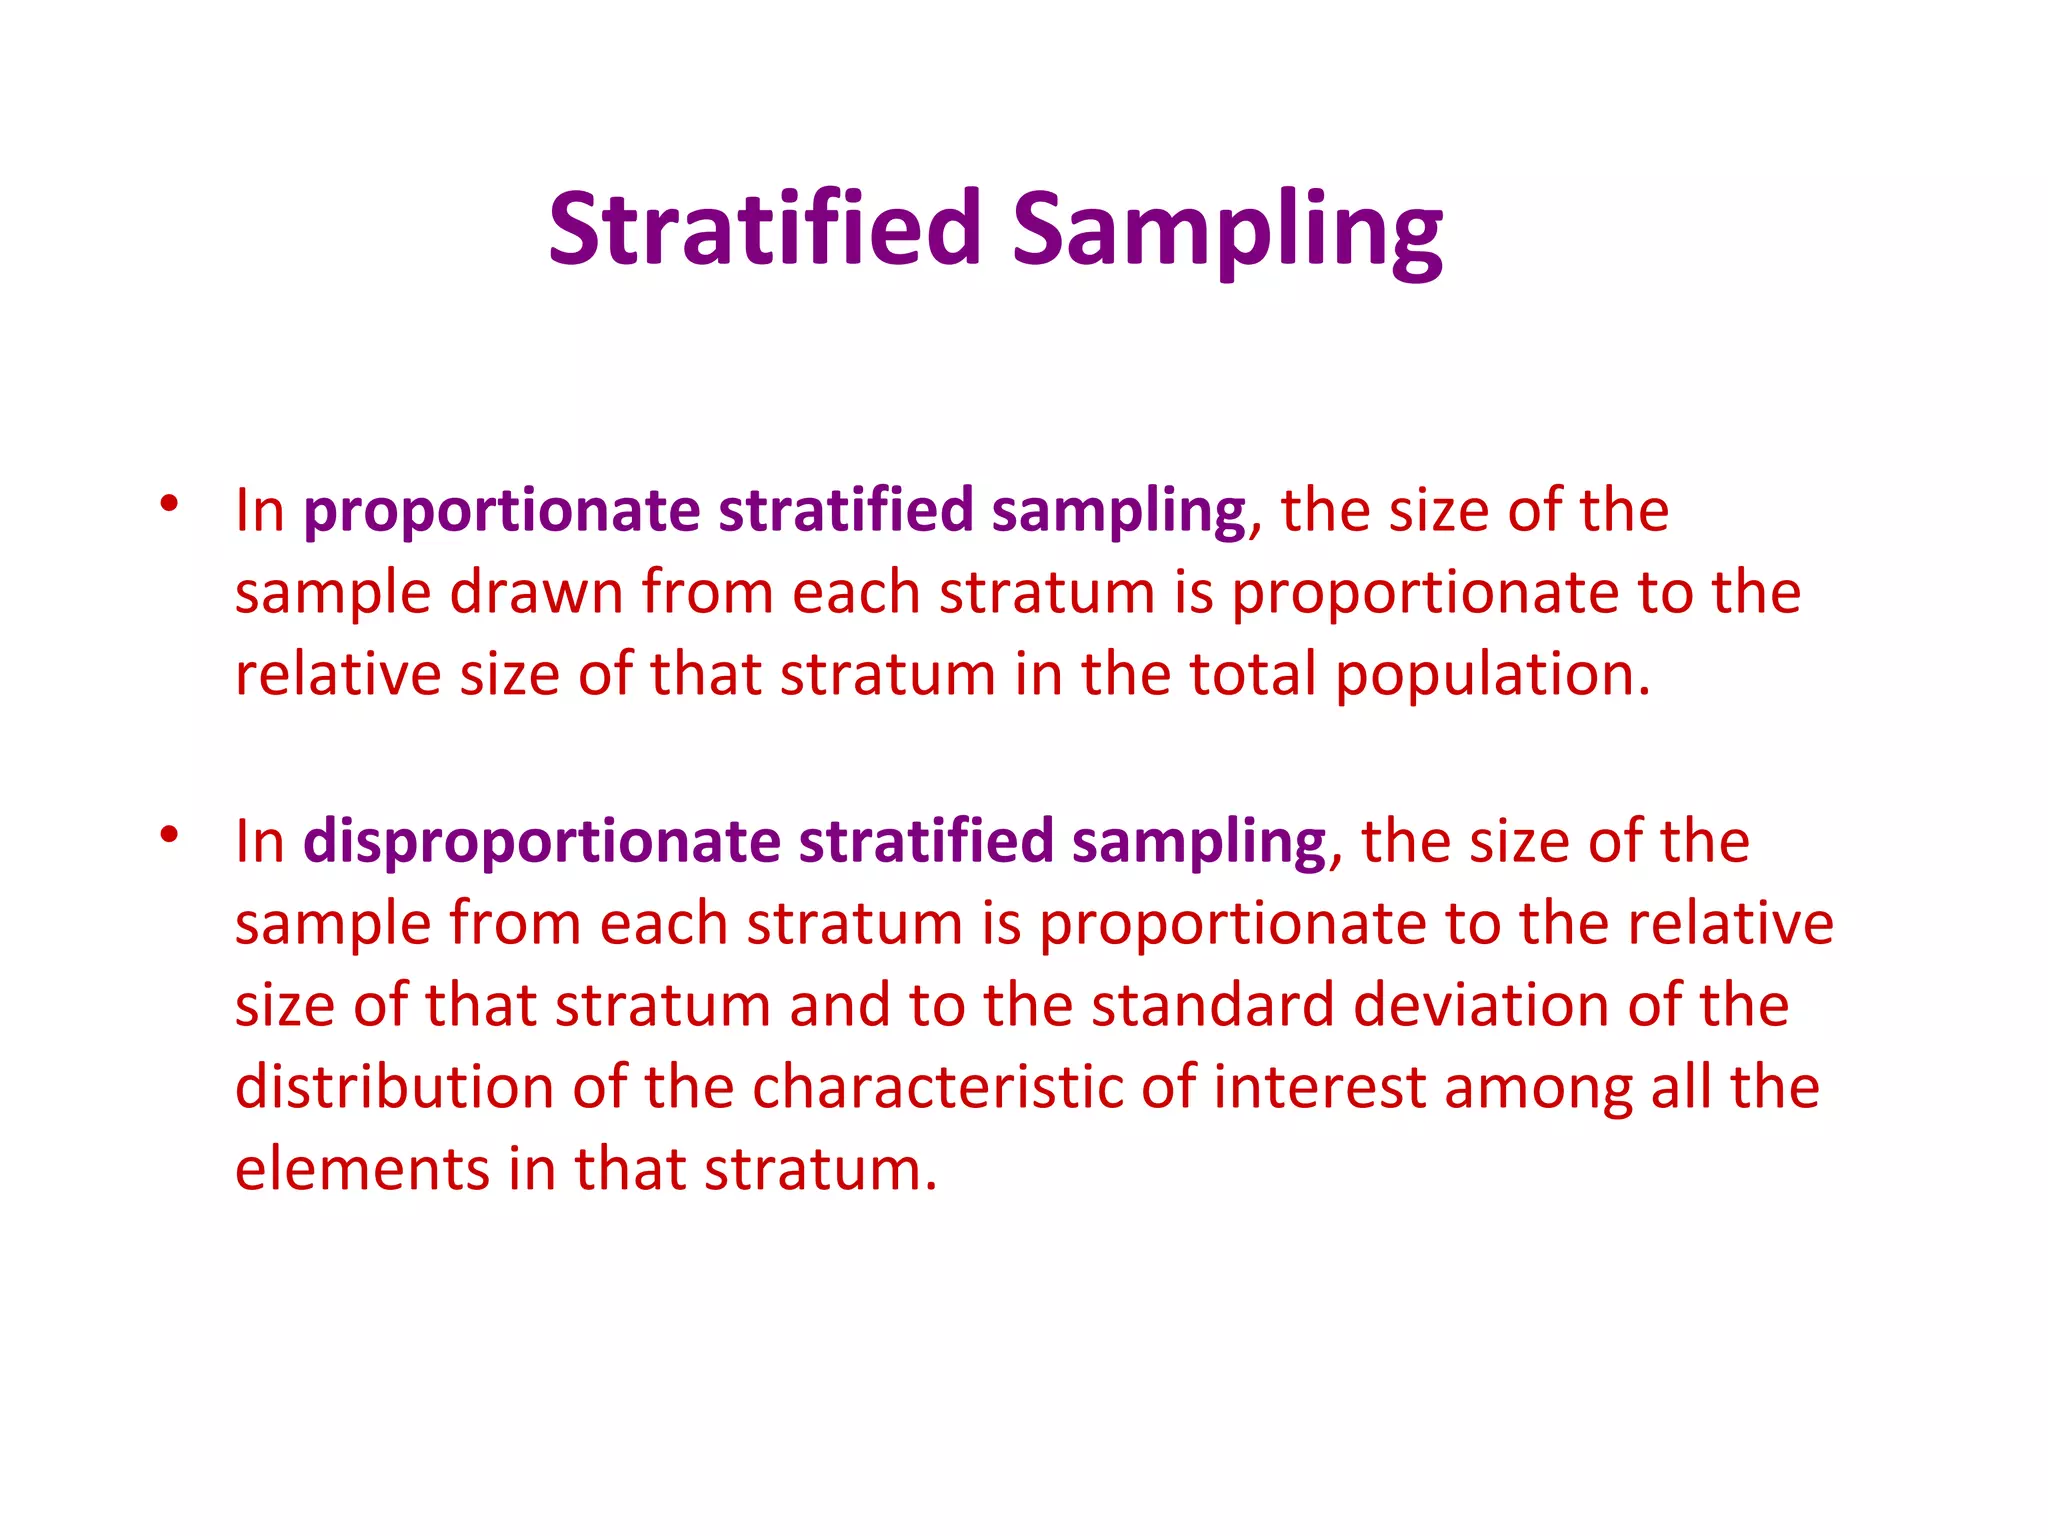
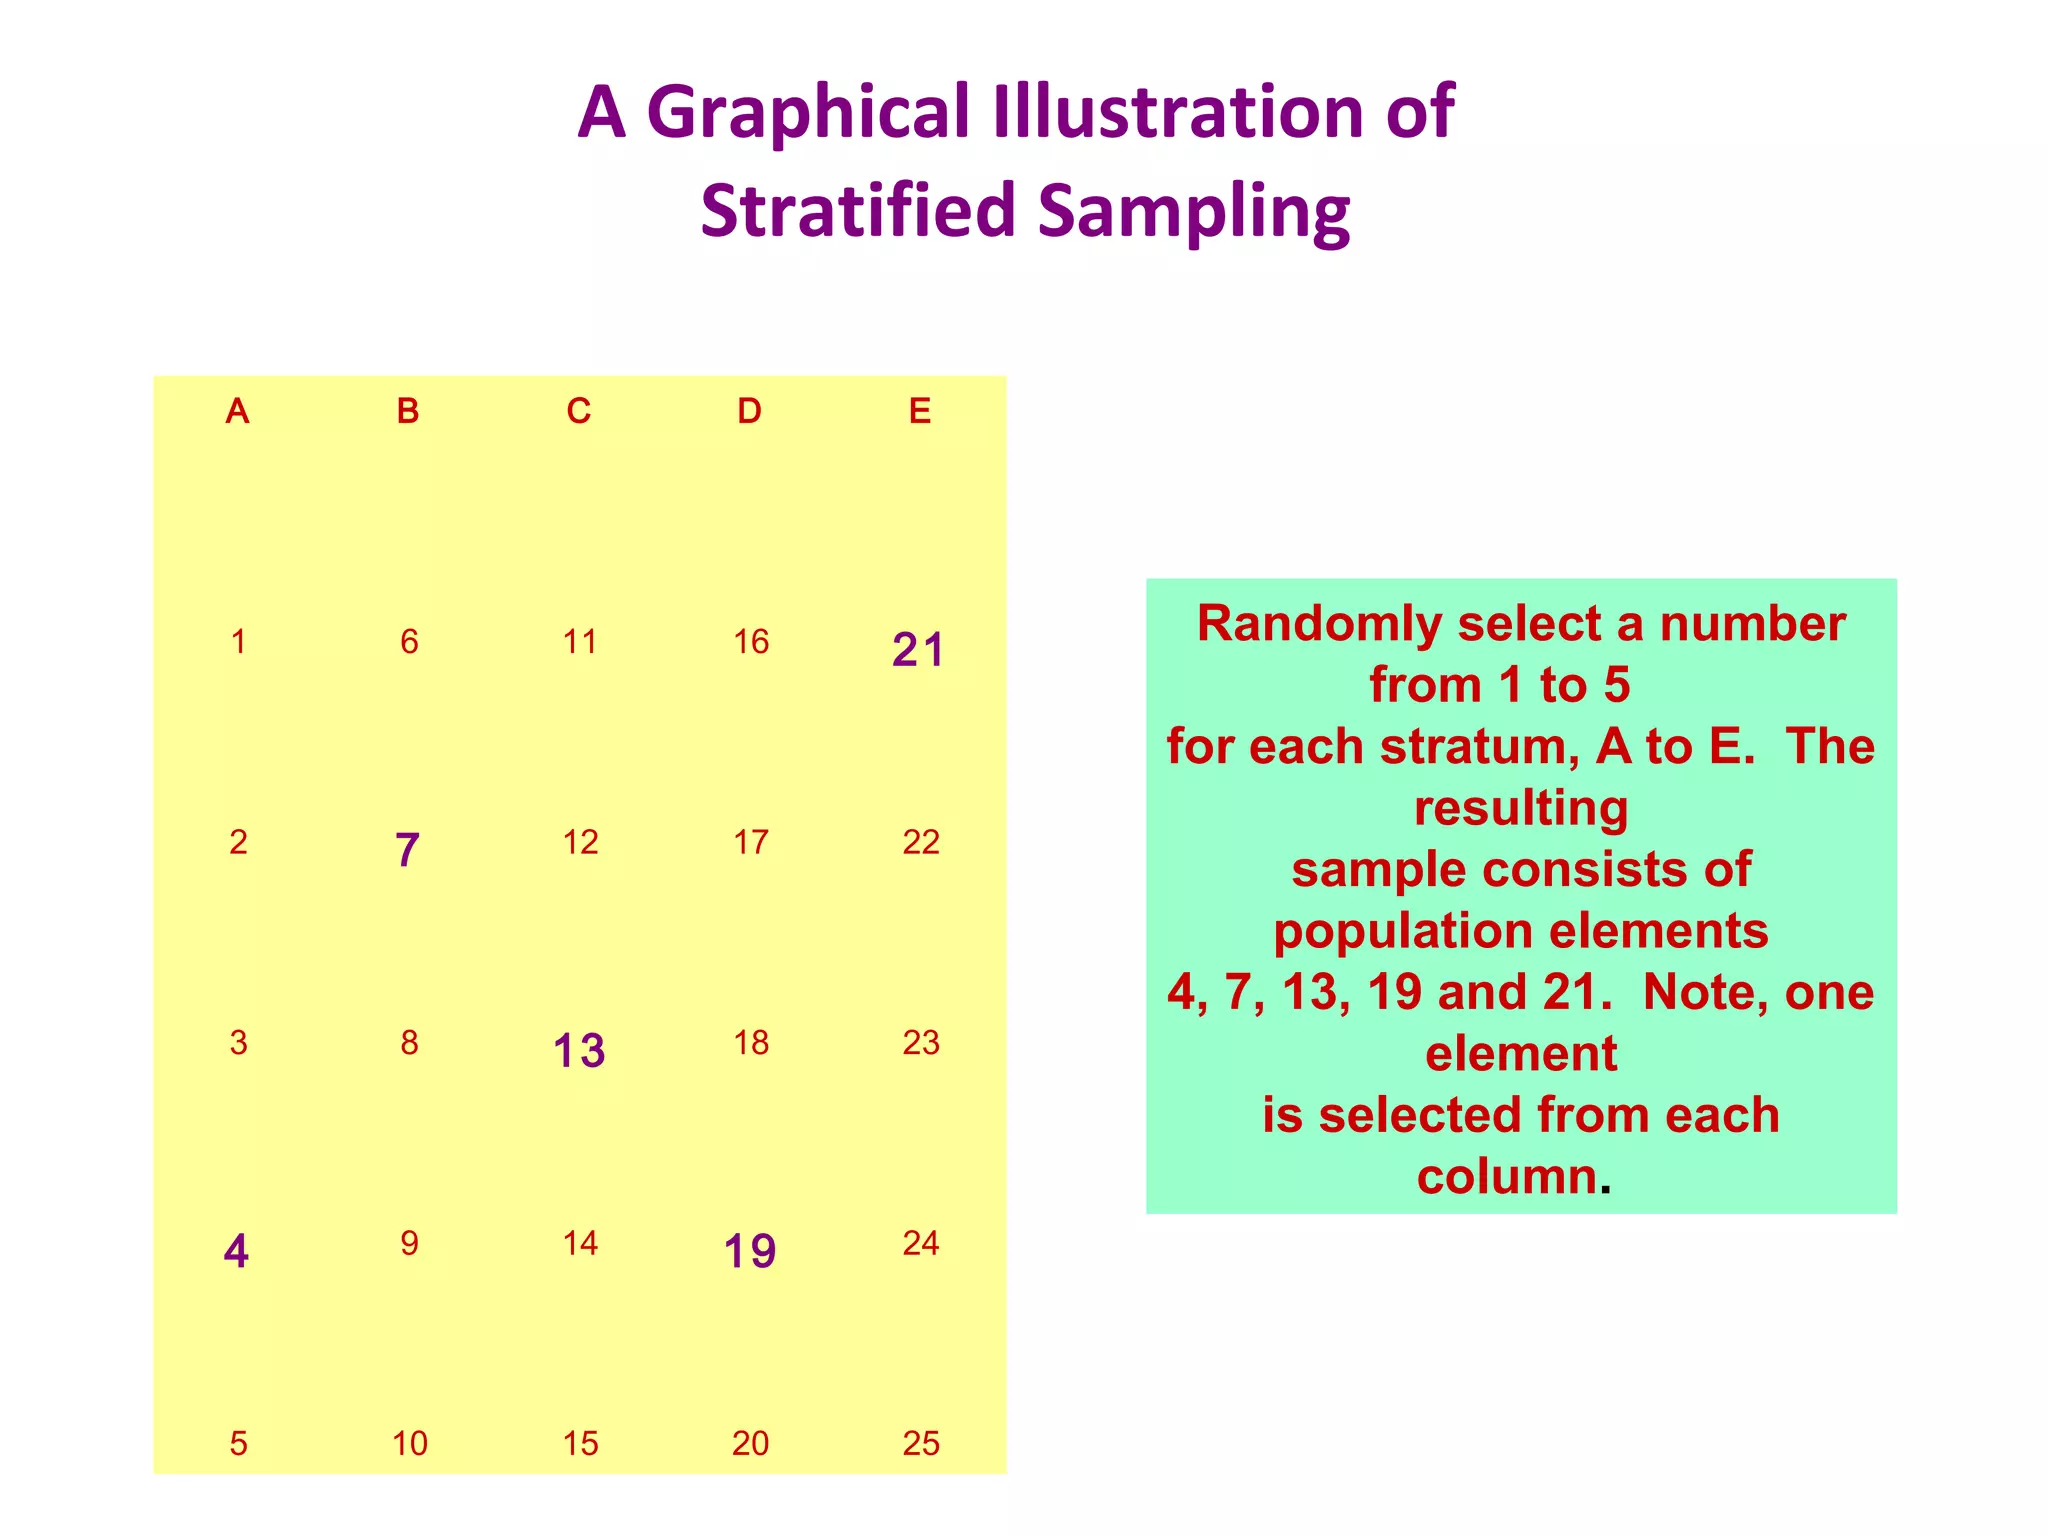
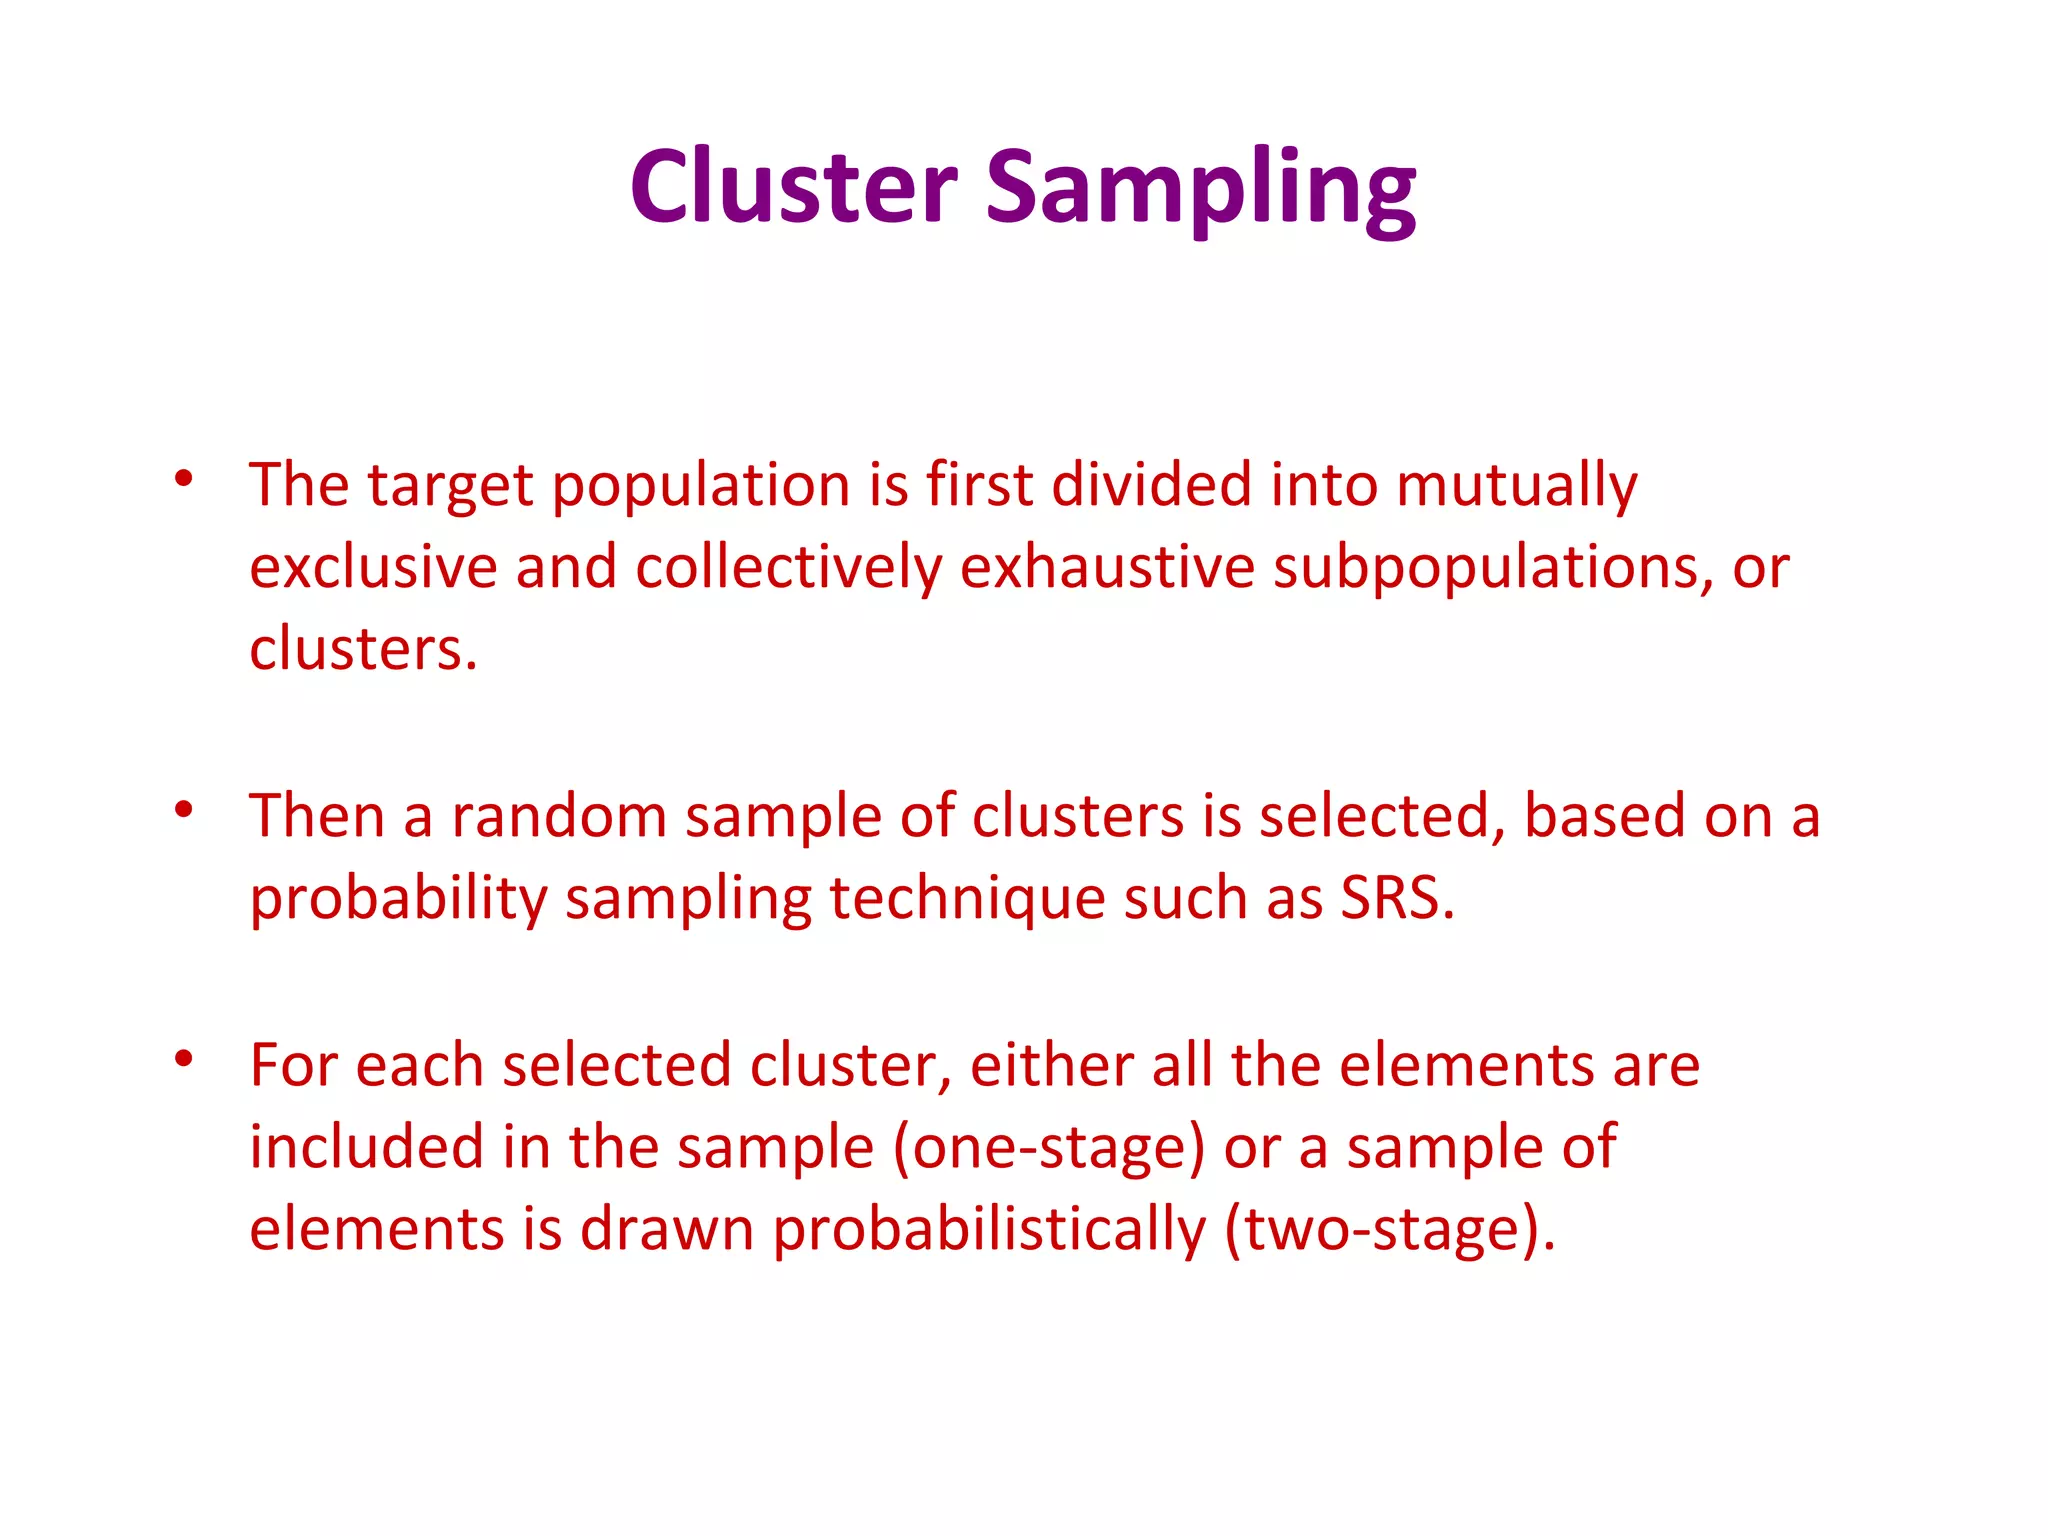
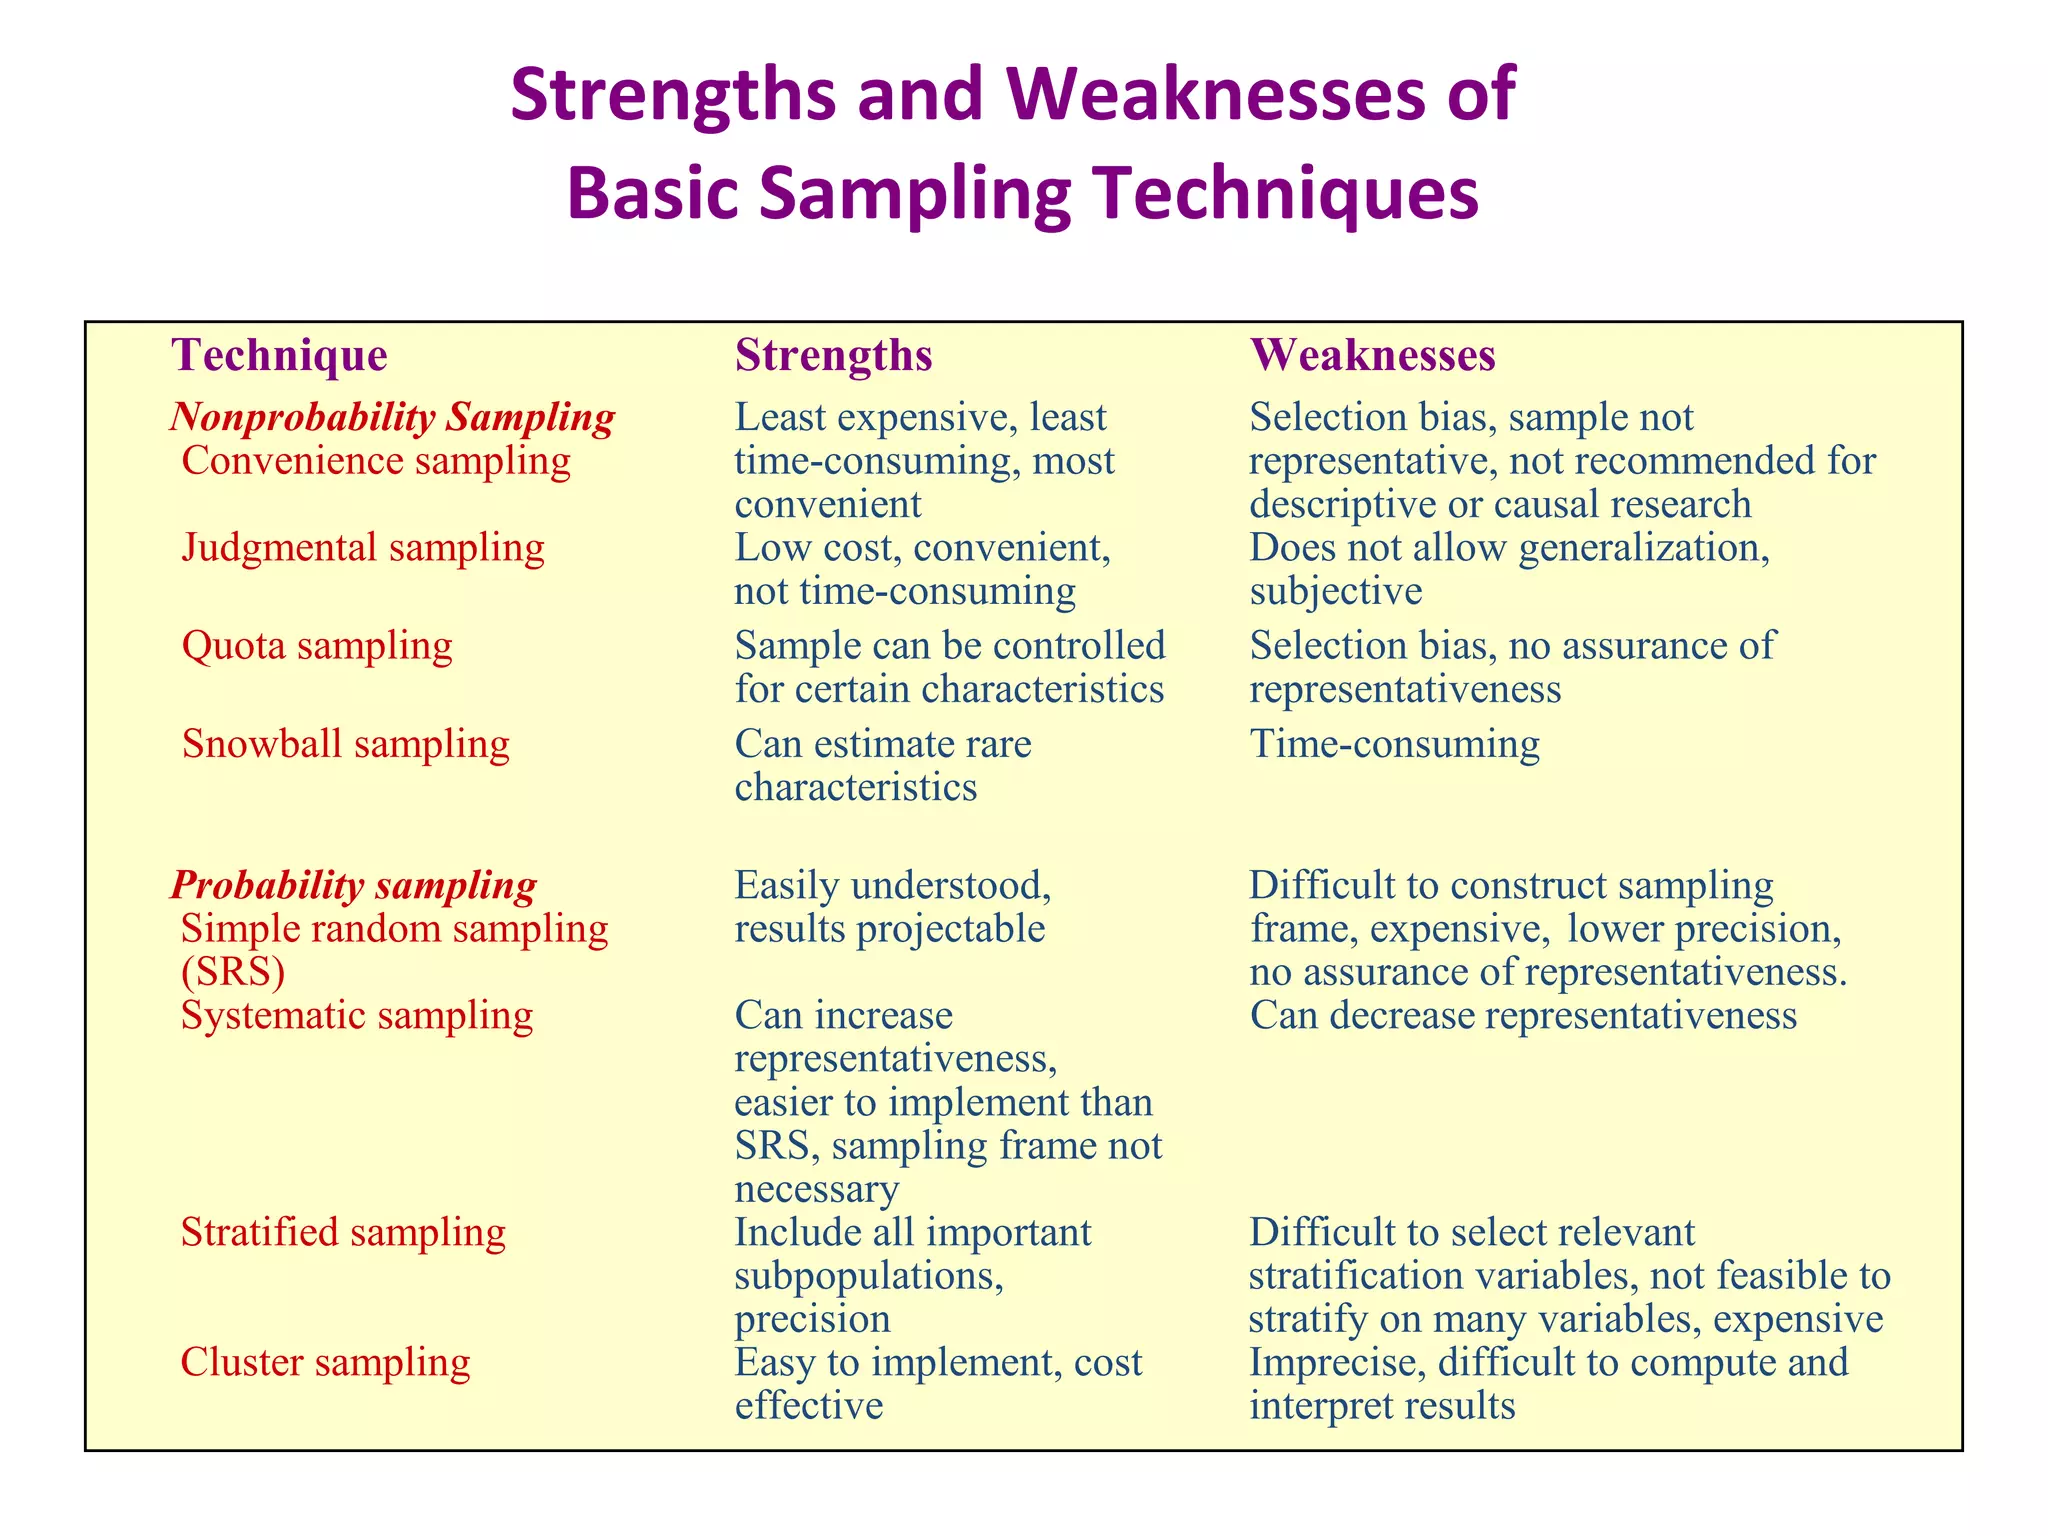

This document discusses various sampling techniques used in research. It defines key terms like population, sample, and sampling frame. It then describes and provides examples of different probability and non-probability sampling methods like simple random sampling, systematic sampling, stratified sampling, cluster sampling, convenience sampling, judgmental sampling, and quota sampling. The techniques are compared in terms of their strengths, weaknesses, and suitability for different research situations.