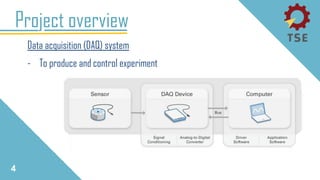
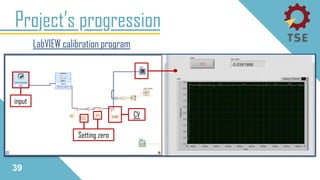
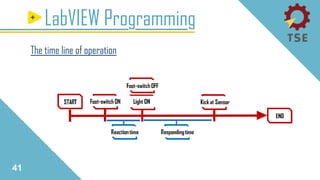
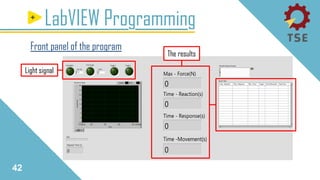
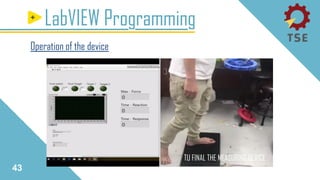
This document describes the design and development of a reaction time and impact force measuring device. The device uses sensors, a data acquisition system, and LabVIEW programming to measure impact force, reaction time, and response time during a punching bag target experiment. Prototypes were developed using various materials and components like load cells, a footswitch, and laser pointer. The device was calibrated and used to collect both static and dynamic force measurements as well as to study force loss through absorption materials. Programming in LabVIEW incorporated state machines to control the experiment sequence and collect/display the measured data.


![9
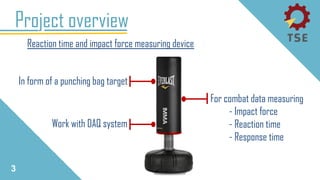
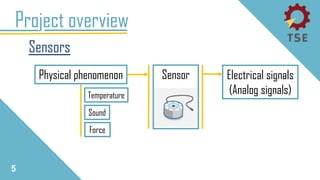
Project overview
Footswitch
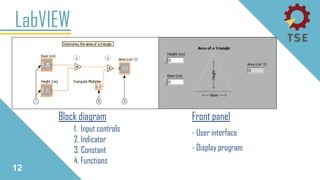
LabVIEW
Sensor
[1]
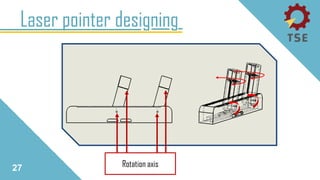
Laser pointer
Sensor
[2]](https://image.slidesharecdn.com/finalpresentdone2-190717200933/85/TU-FINAL-THE-MEASURING-DEVICE-1-9-320.jpg)


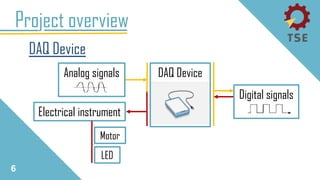
![Working problem [1]
Conclusion
59
Have delay in work Lack of knowledge
in programming
PROBLEM FROM
Learn from
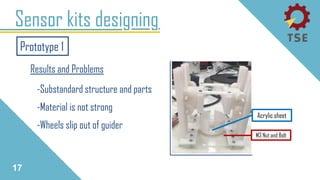
a professional
SOLUTION
Lack of knowledge
in electrical
instruments](https://image.slidesharecdn.com/finalpresentdone2-190717200933/85/TU-FINAL-THE-MEASURING-DEVICE-1-59-320.jpg)


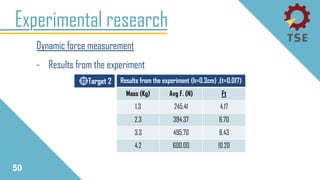
![20
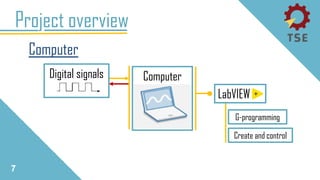
Wiring diagram
ANALOG S.
DIGITAL S.
POWER
CONTROL
Load cell 2
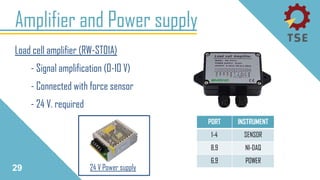
Load cell 1
W.Sensor 1
W.Sensor 2
W.Sensor 3
T.1
T.2
FS.
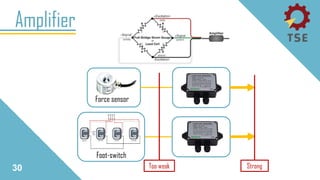
AMP
[1] [2]
AMP
[3] [4]
AMP
[5]
PS. +24V
Laser 2
Laser 1
+5V
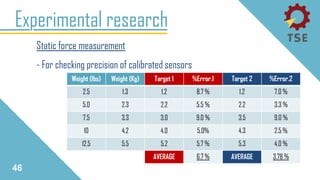
USB-6351 NI
Computer
LabVIEW](https://image.slidesharecdn.com/finalpresentdone2-190717200933/85/TU-FINAL-THE-MEASURING-DEVICE-1-63-320.jpg)
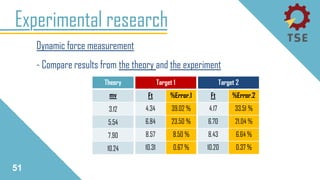
![42
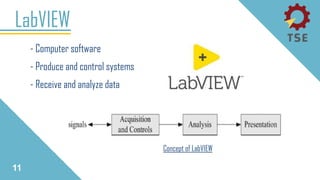
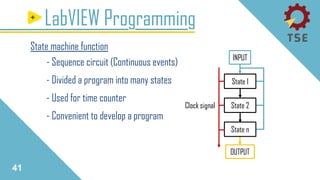
LabVIEW Programming
State .1 [initial]
Clock signals
Wait for going
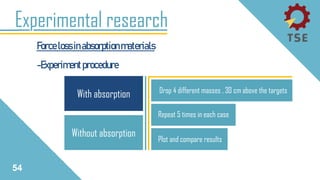
to next state
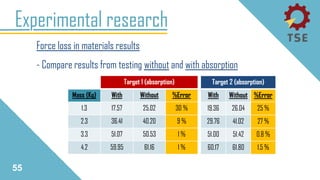
Data line](https://image.slidesharecdn.com/finalpresentdone2-190717200933/85/TU-FINAL-THE-MEASURING-DEVICE-1-67-320.jpg)
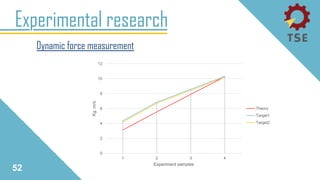
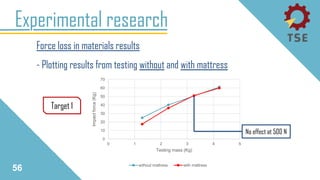
![43
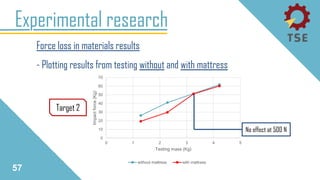
LabVIEW Programming
State .2 [ wait_foot_sw_on ]
Footswitch operation
FS. input](https://image.slidesharecdn.com/finalpresentdone2-190717200933/85/TU-FINAL-THE-MEASURING-DEVICE-1-68-320.jpg)
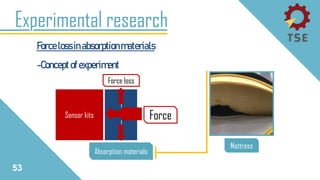
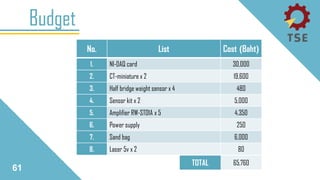
![44
LabVIEW Programming
State .3 [ delay_5_second ]
Random a delay time](https://image.slidesharecdn.com/finalpresentdone2-190717200933/85/TU-FINAL-THE-MEASURING-DEVICE-1-69-320.jpg)
![45
LabVIEW Programming
State .4 [ light_on ]
Random laser
LS. output
Count the times](https://image.slidesharecdn.com/finalpresentdone2-190717200933/85/TU-FINAL-THE-MEASURING-DEVICE-1-70-320.jpg)
![46
LabVIEW Programming
State .5 [ wait_foot_sw_off ]
FS.OFF
Stop reaction T.
Switch state
[target 1] or [target 2]
[7],[8]](https://image.slidesharecdn.com/finalpresentdone2-190717200933/85/TU-FINAL-THE-MEASURING-DEVICE-1-71-320.jpg)
![47
LabVIEW Programming
State .6 [ wait_target_1_hit ], ( Switching condition =light 1 )
Sensor calibration
Sensor inputs
Stop Response T.
Display the force](https://image.slidesharecdn.com/finalpresentdone2-190717200933/85/TU-FINAL-THE-MEASURING-DEVICE-1-72-320.jpg)
![48
LabVIEW Programming
State .7 [ wait_target_2_hit ] ,( Switching condition =light 2 )
Sensor calibration
Sensor inputs
Stop Response T.
Display the force](https://image.slidesharecdn.com/finalpresentdone2-190717200933/85/TU-FINAL-THE-MEASURING-DEVICE-1-73-320.jpg)
![49
LabVIEW Programming
State .8 [ save_data ]
END
Display and
collect data
Collect data as a table](https://image.slidesharecdn.com/finalpresentdone2-190717200933/85/TU-FINAL-THE-MEASURING-DEVICE-1-74-320.jpg)