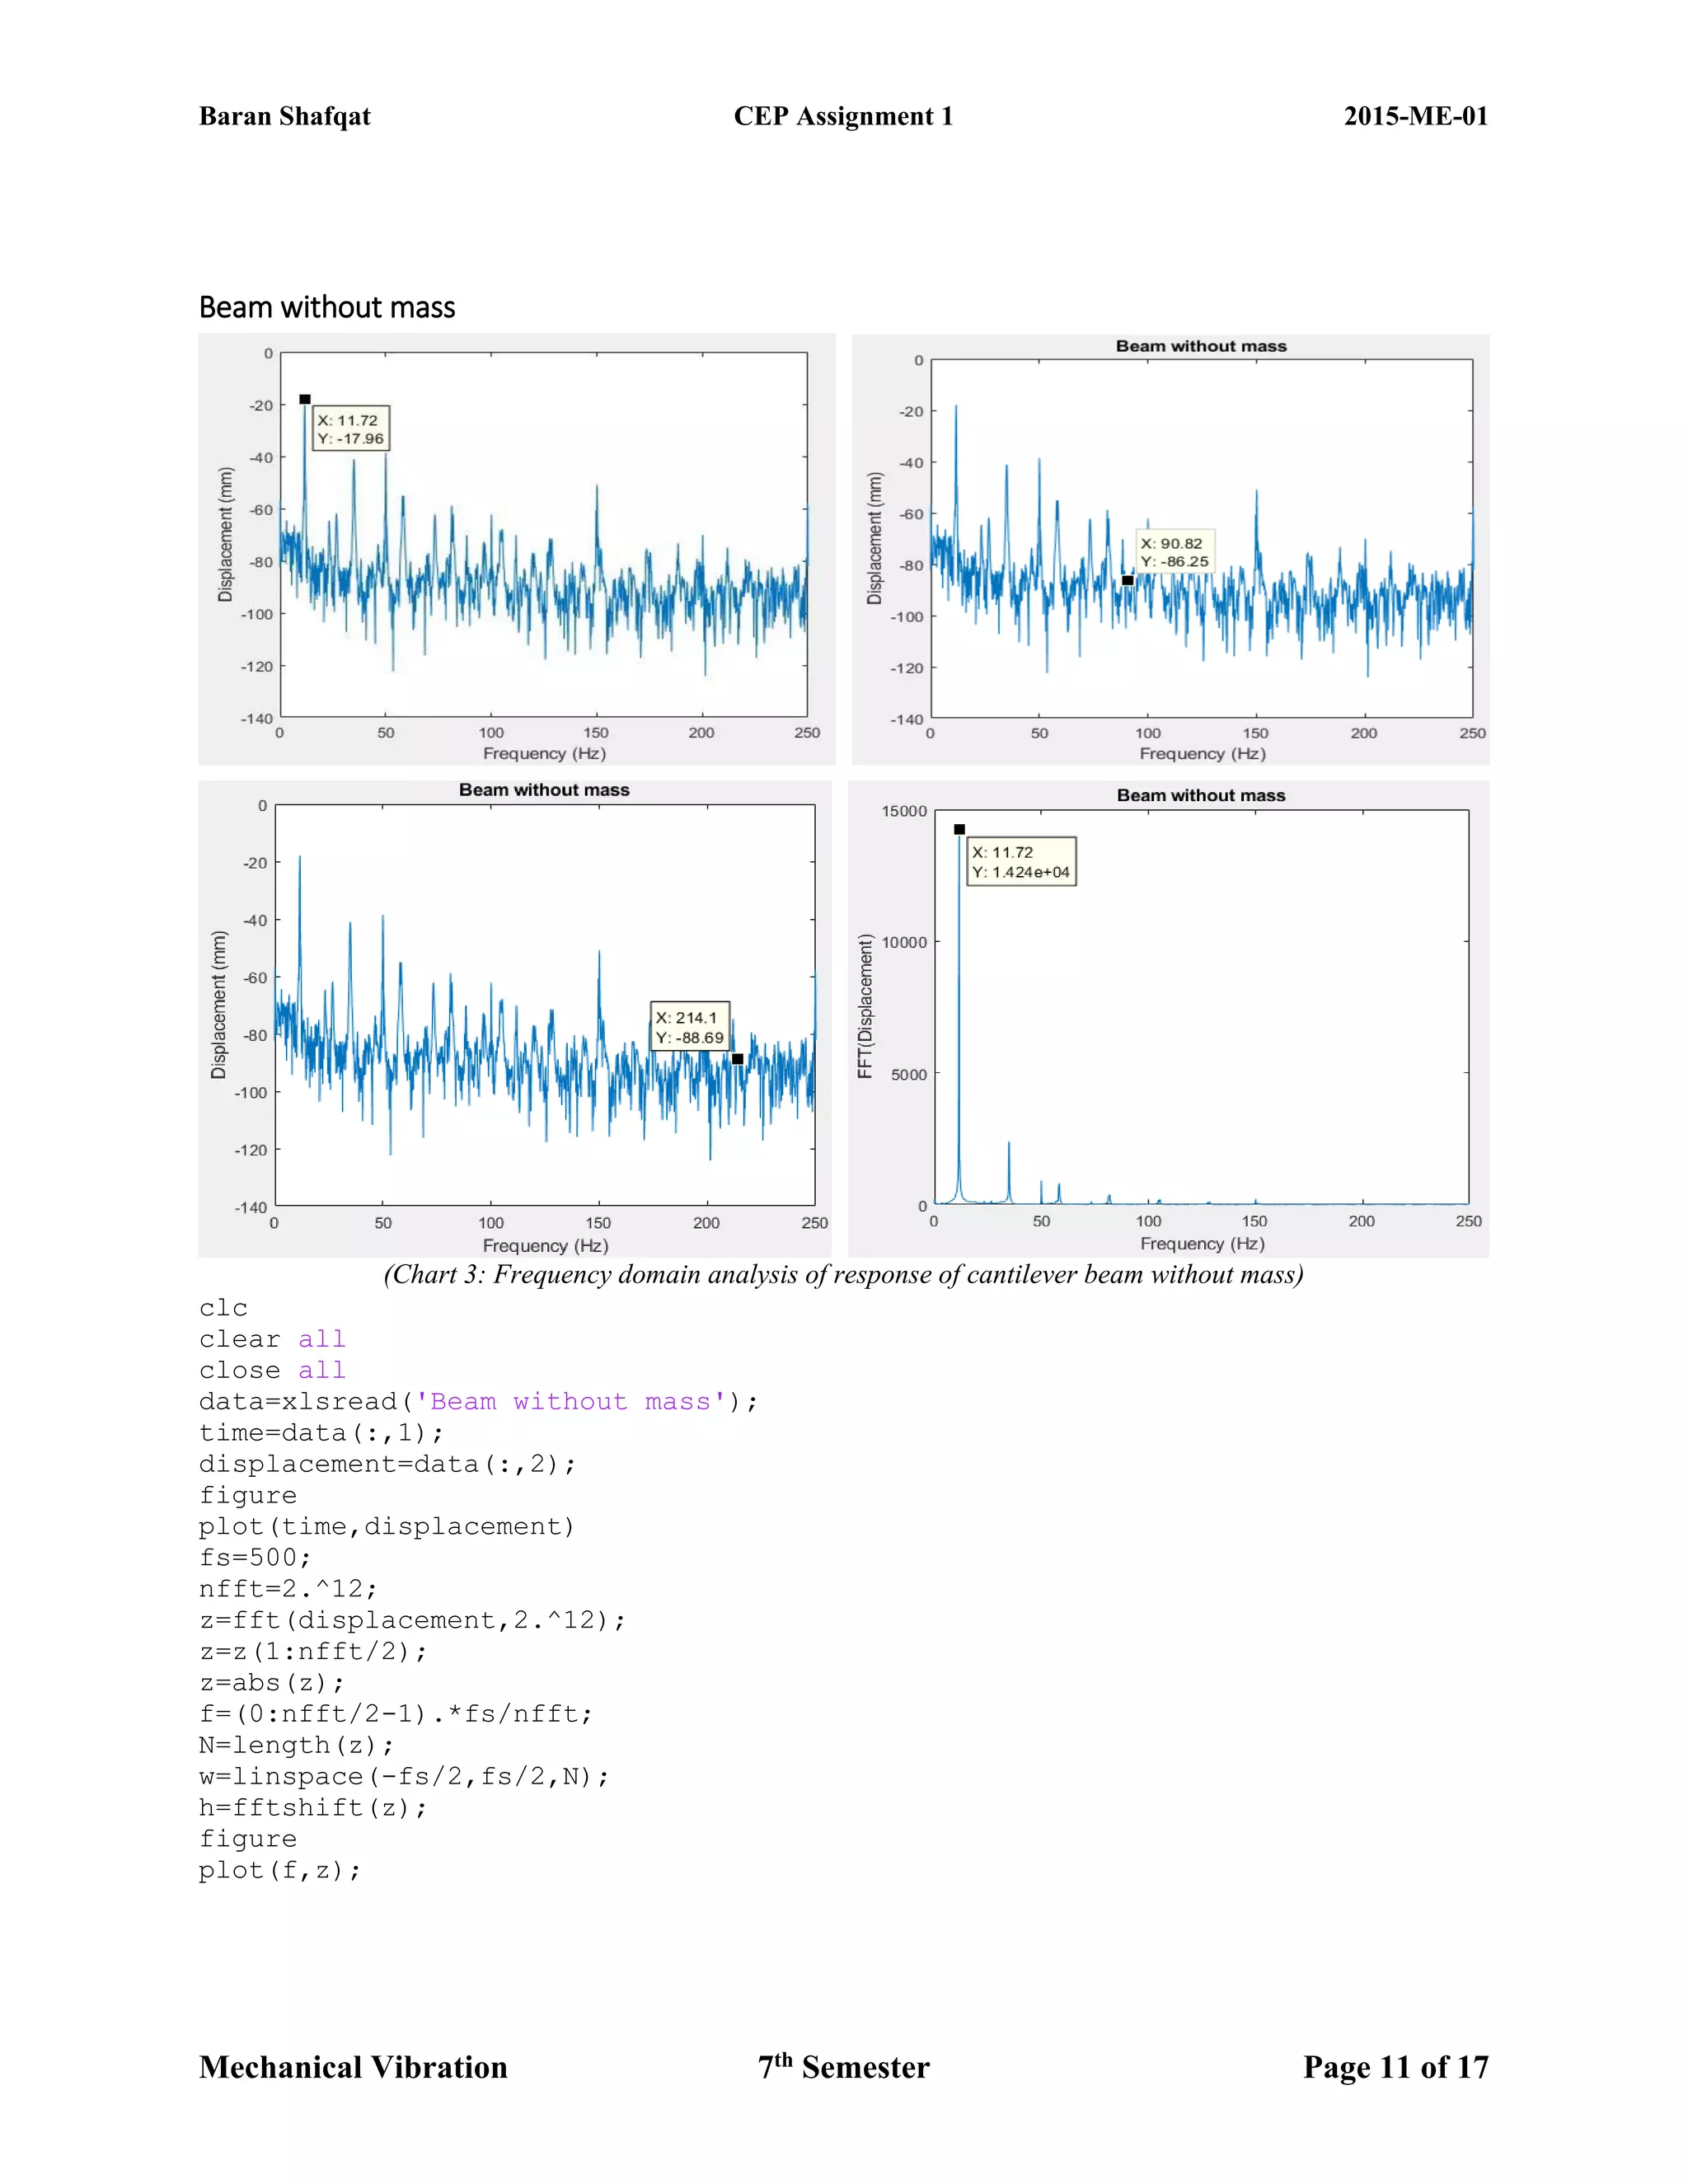
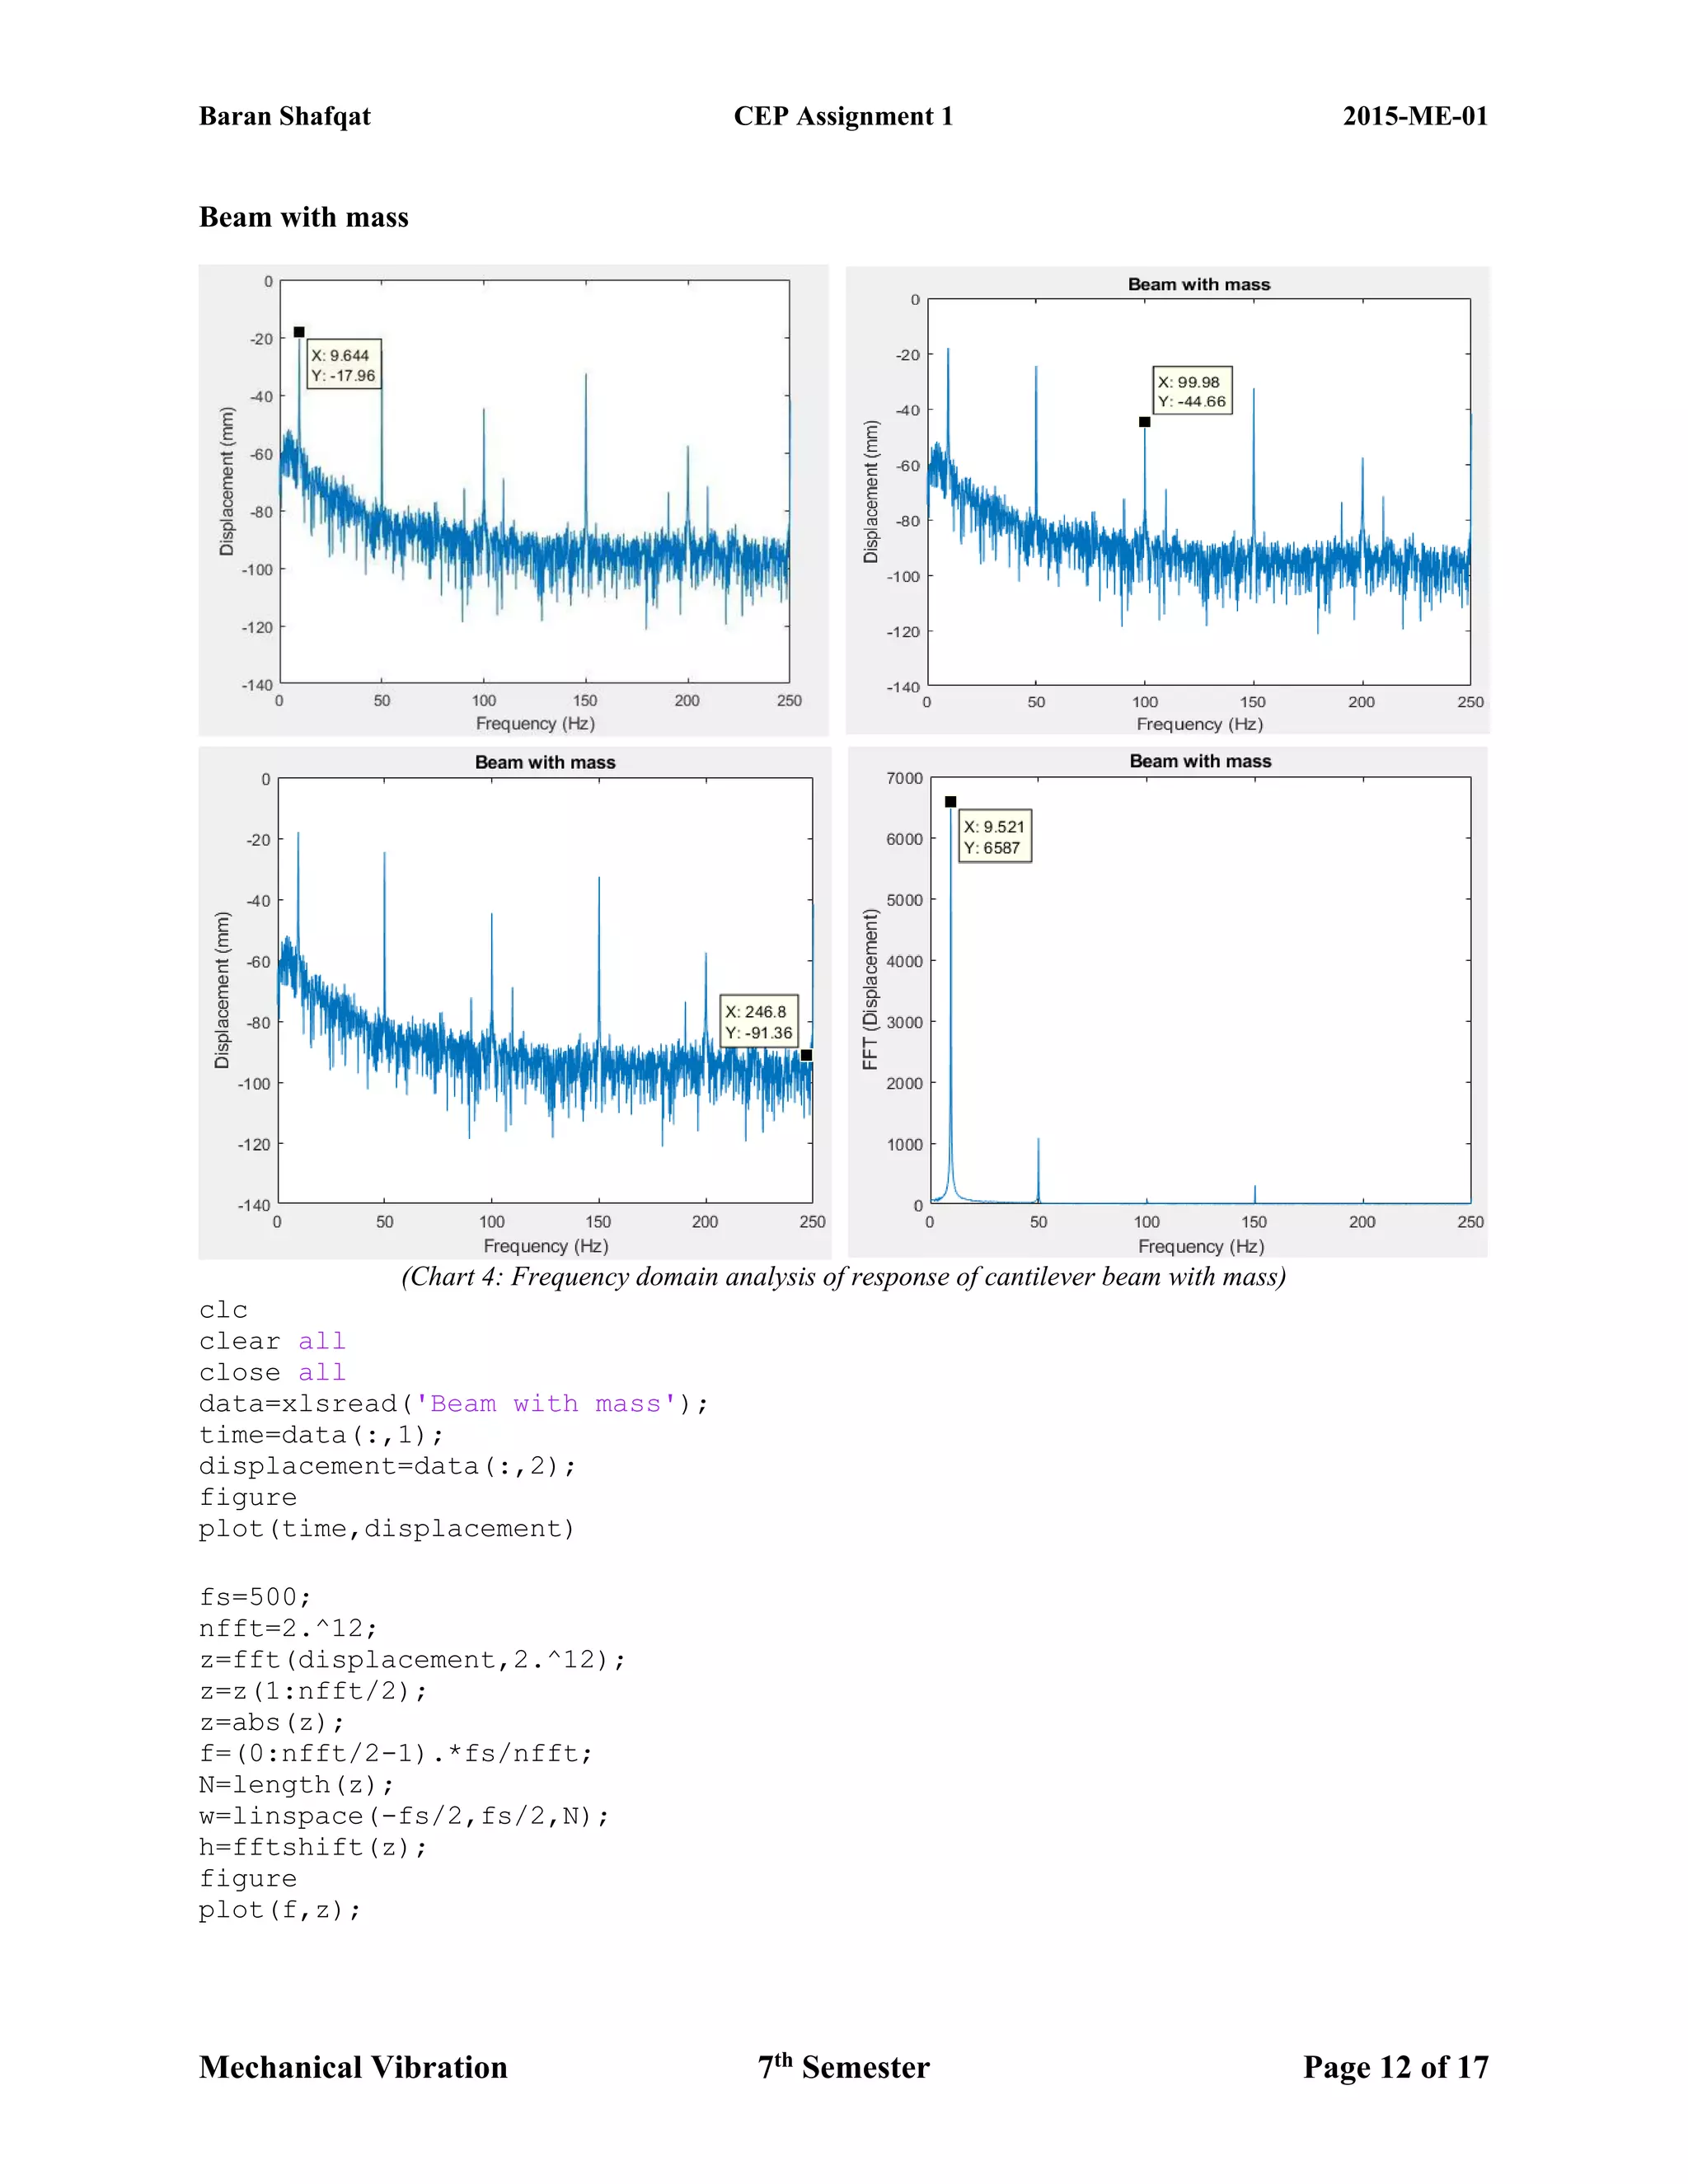
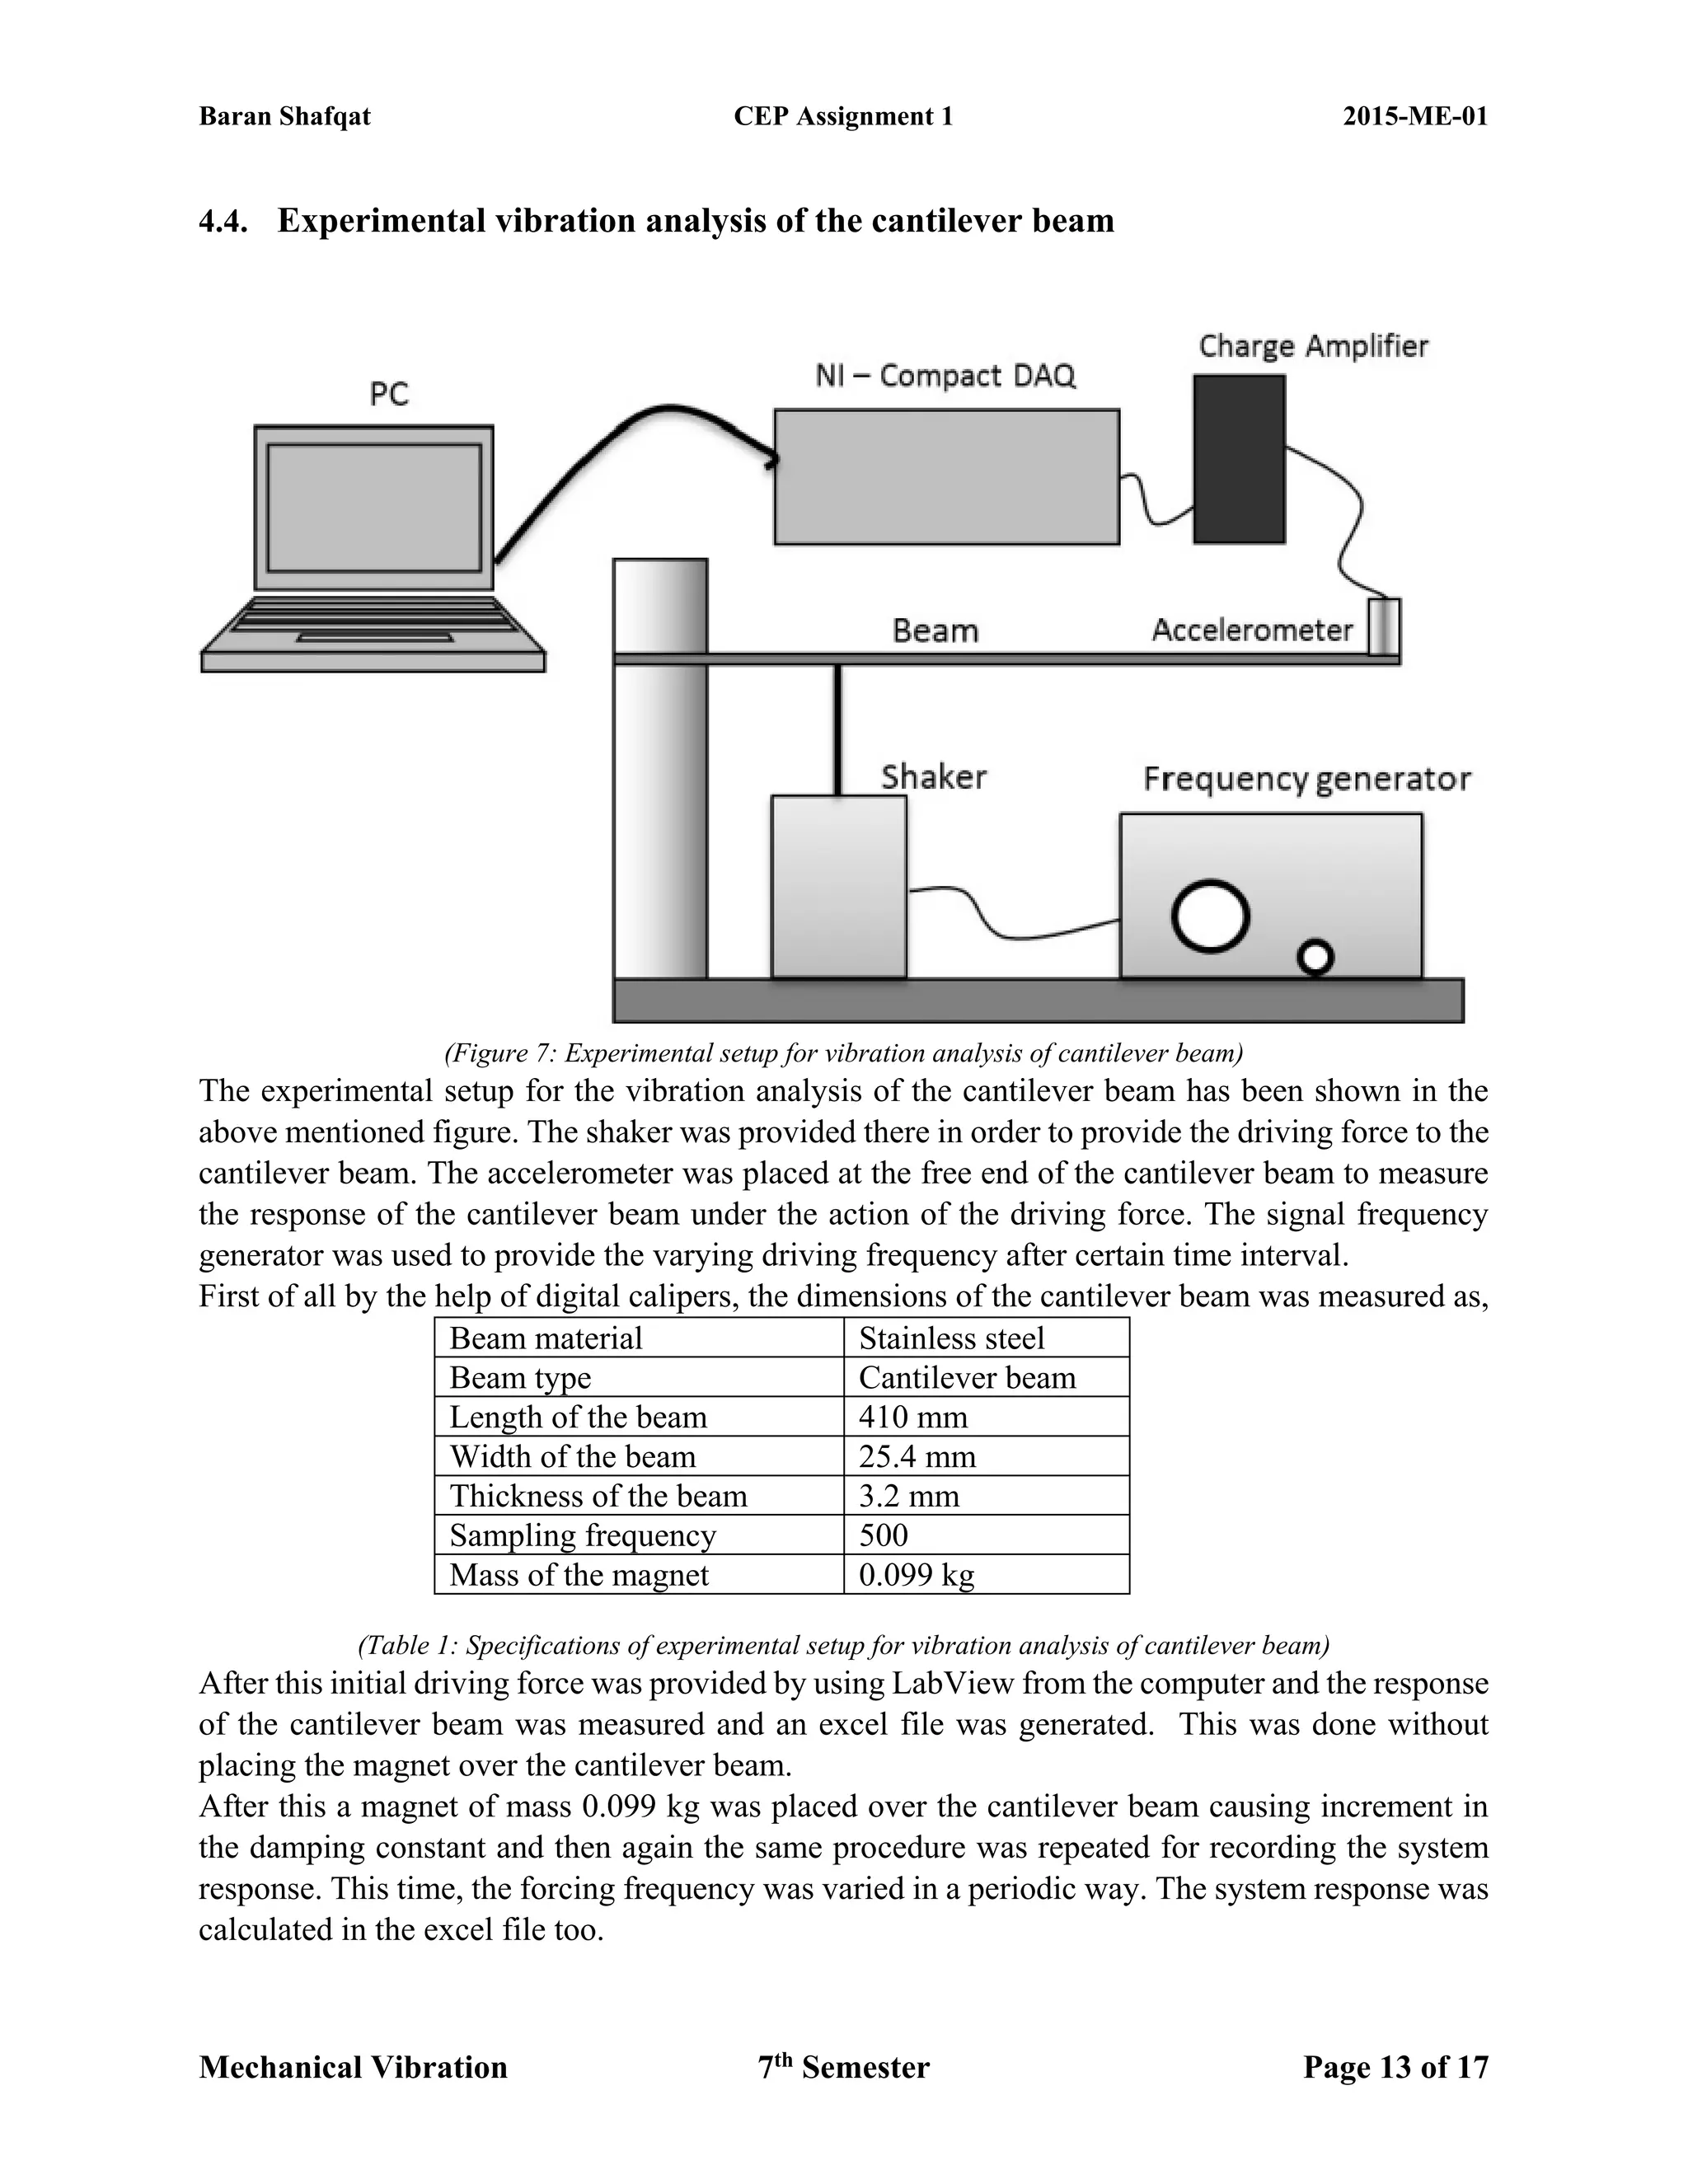
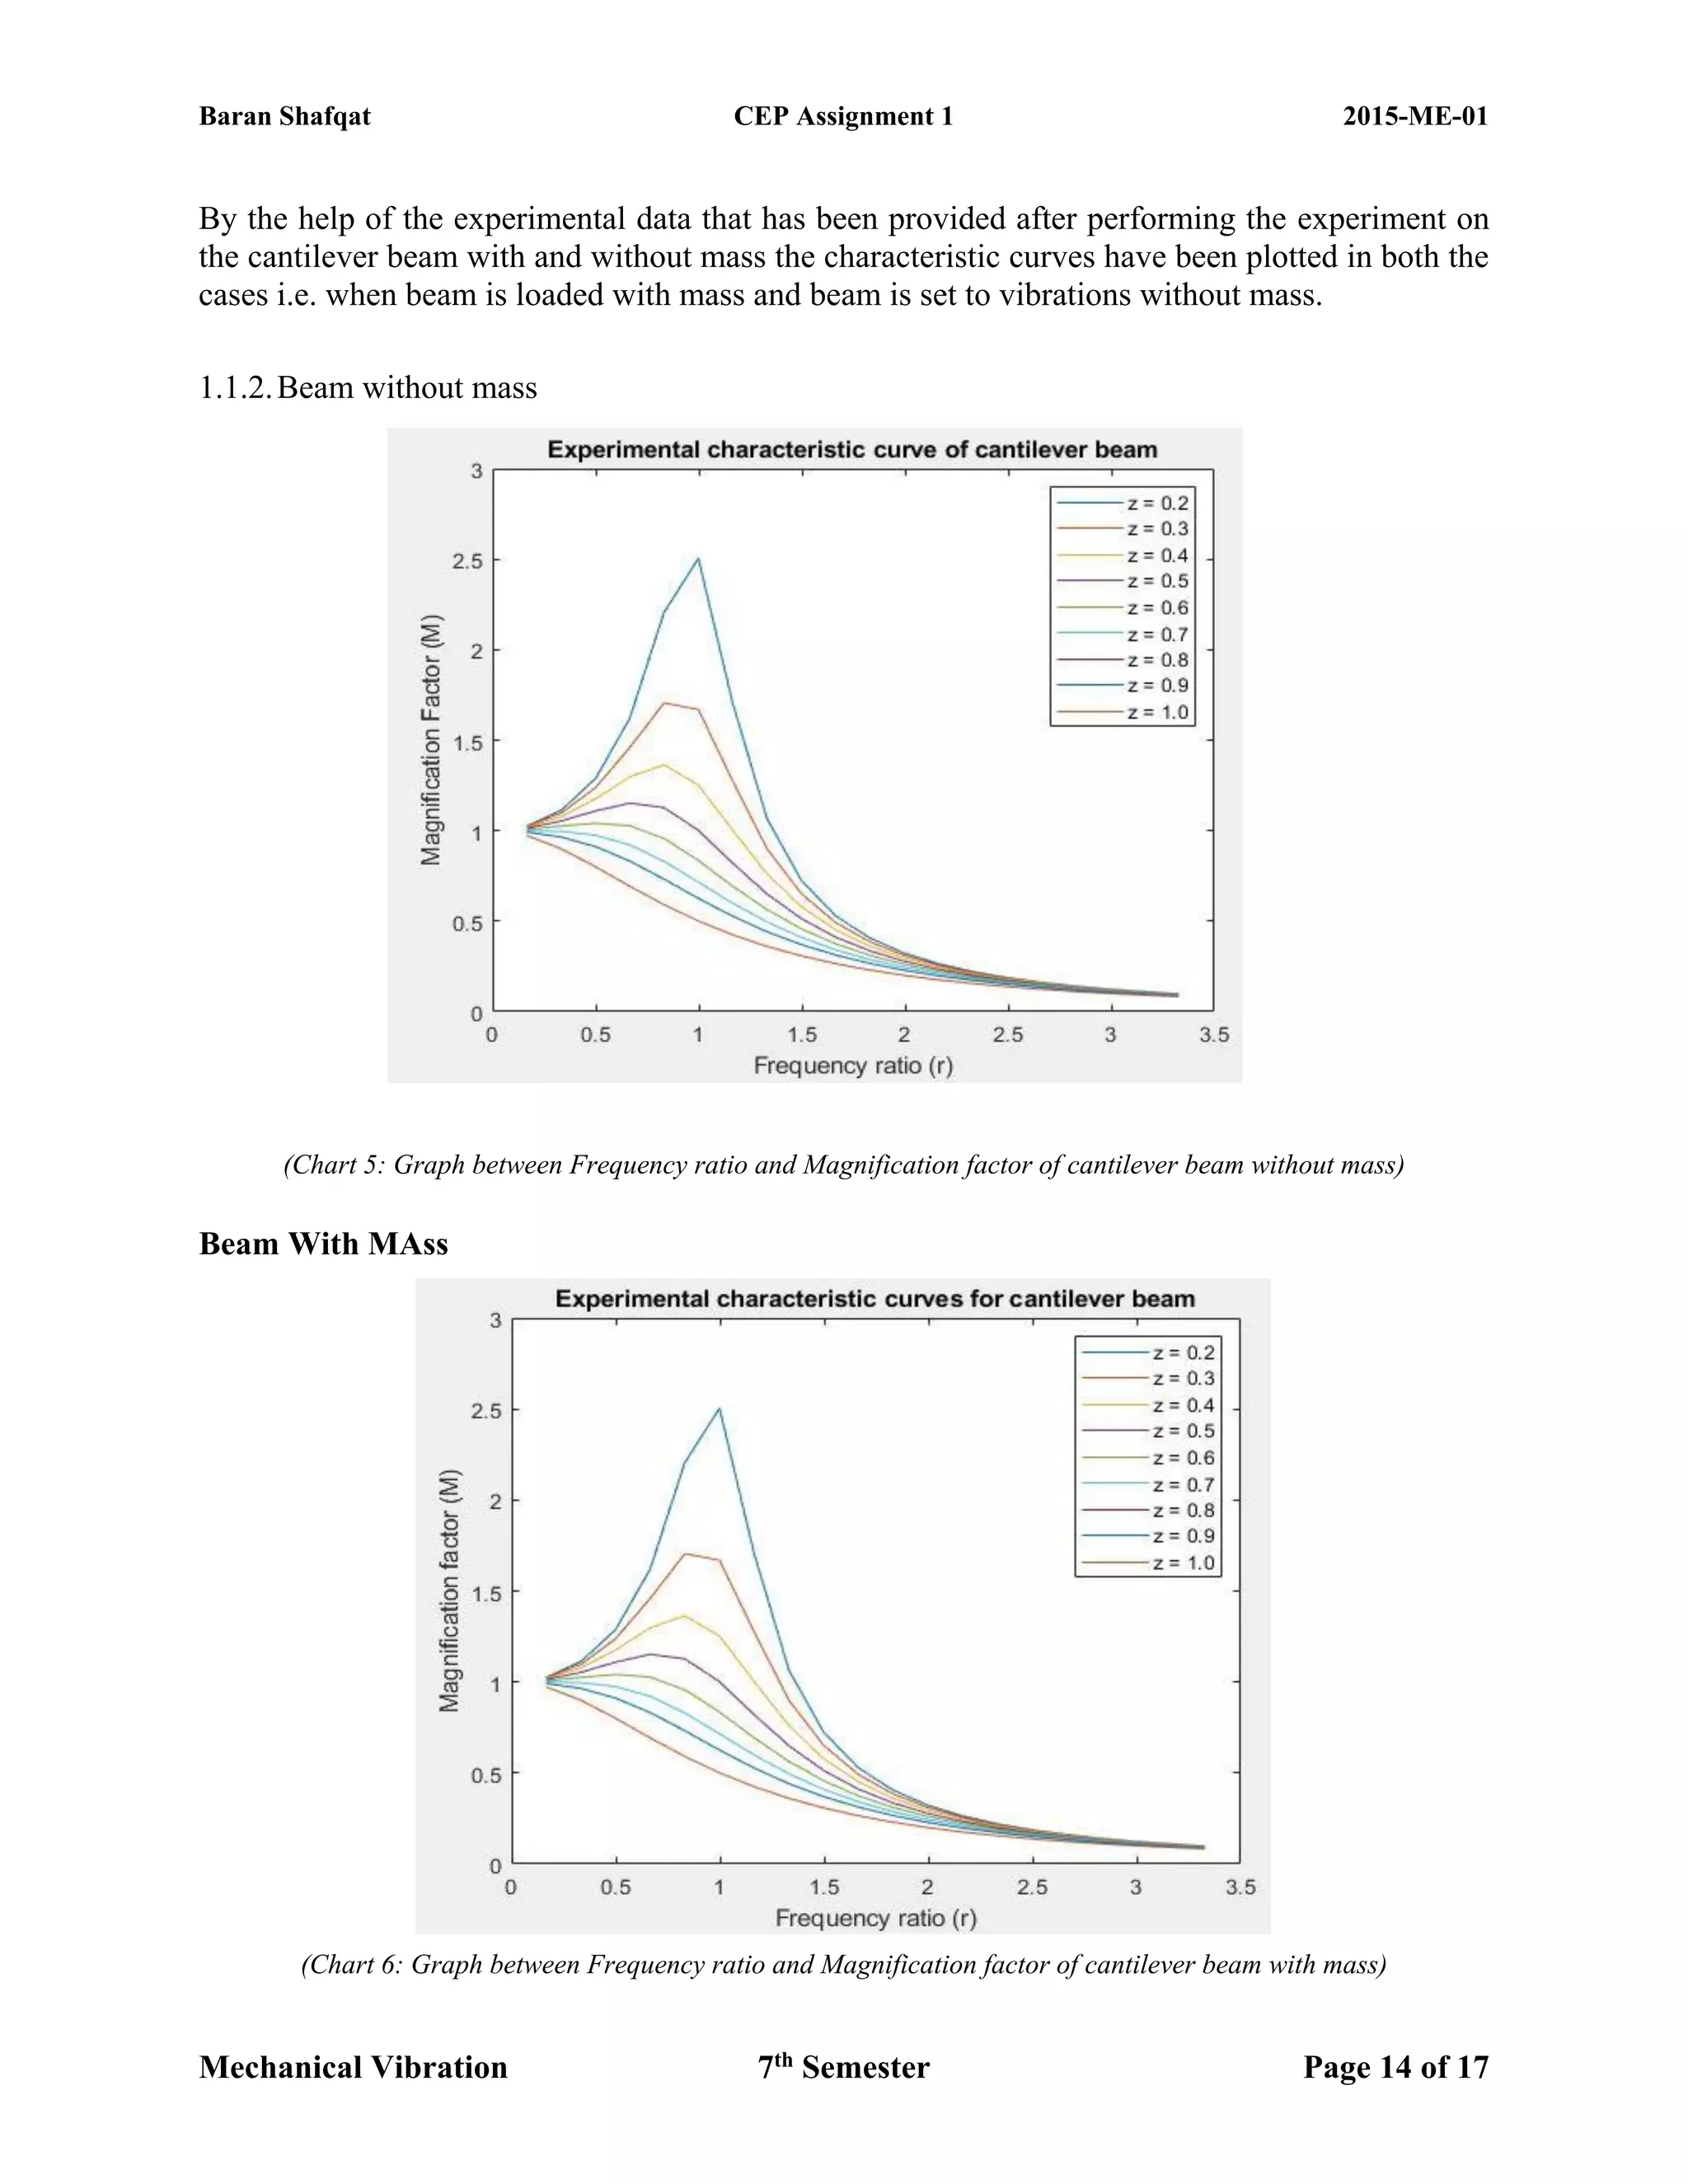
The document discusses the vibration analysis and modeling of a cantilever beam, emphasizing the significance of resonance in engineering and how it can be mitigated through various computational techniques like SolidWorks and MATLAB. The study compares results from experiments and theoretical calculations, aiming to estimate natural frequencies and implement vibration control methods. It highlights procedures including free and forced vibrations, exploring parameters like natural frequency, damping ratio, and different experimental setups to analyze the vibrational behavior of the beam.
![Baran Shafqat CEP Assignment 1 2015-ME-01
Mechanical Vibration 7th
Semester Page 1 of 17
Vibration Analysis and Modelling of a Cantilever Beam
Student Details
Your Full Name Baran Shafqat
Registration No. 2015-ME-01
Abstract
Vibration analysis and proper vibration control are most of the critical aspects of engineering that
must be taken into account so that the proper modelling of different systems can be made. The
point having the most crucial impact is resonance that occurs when the forcing frequency becomes
equal to the natural frequency of the system. In order to avoid it, vibration analysis of a cantilever
beam has been carried out so that the natural frequencies can be estimated. Different computational
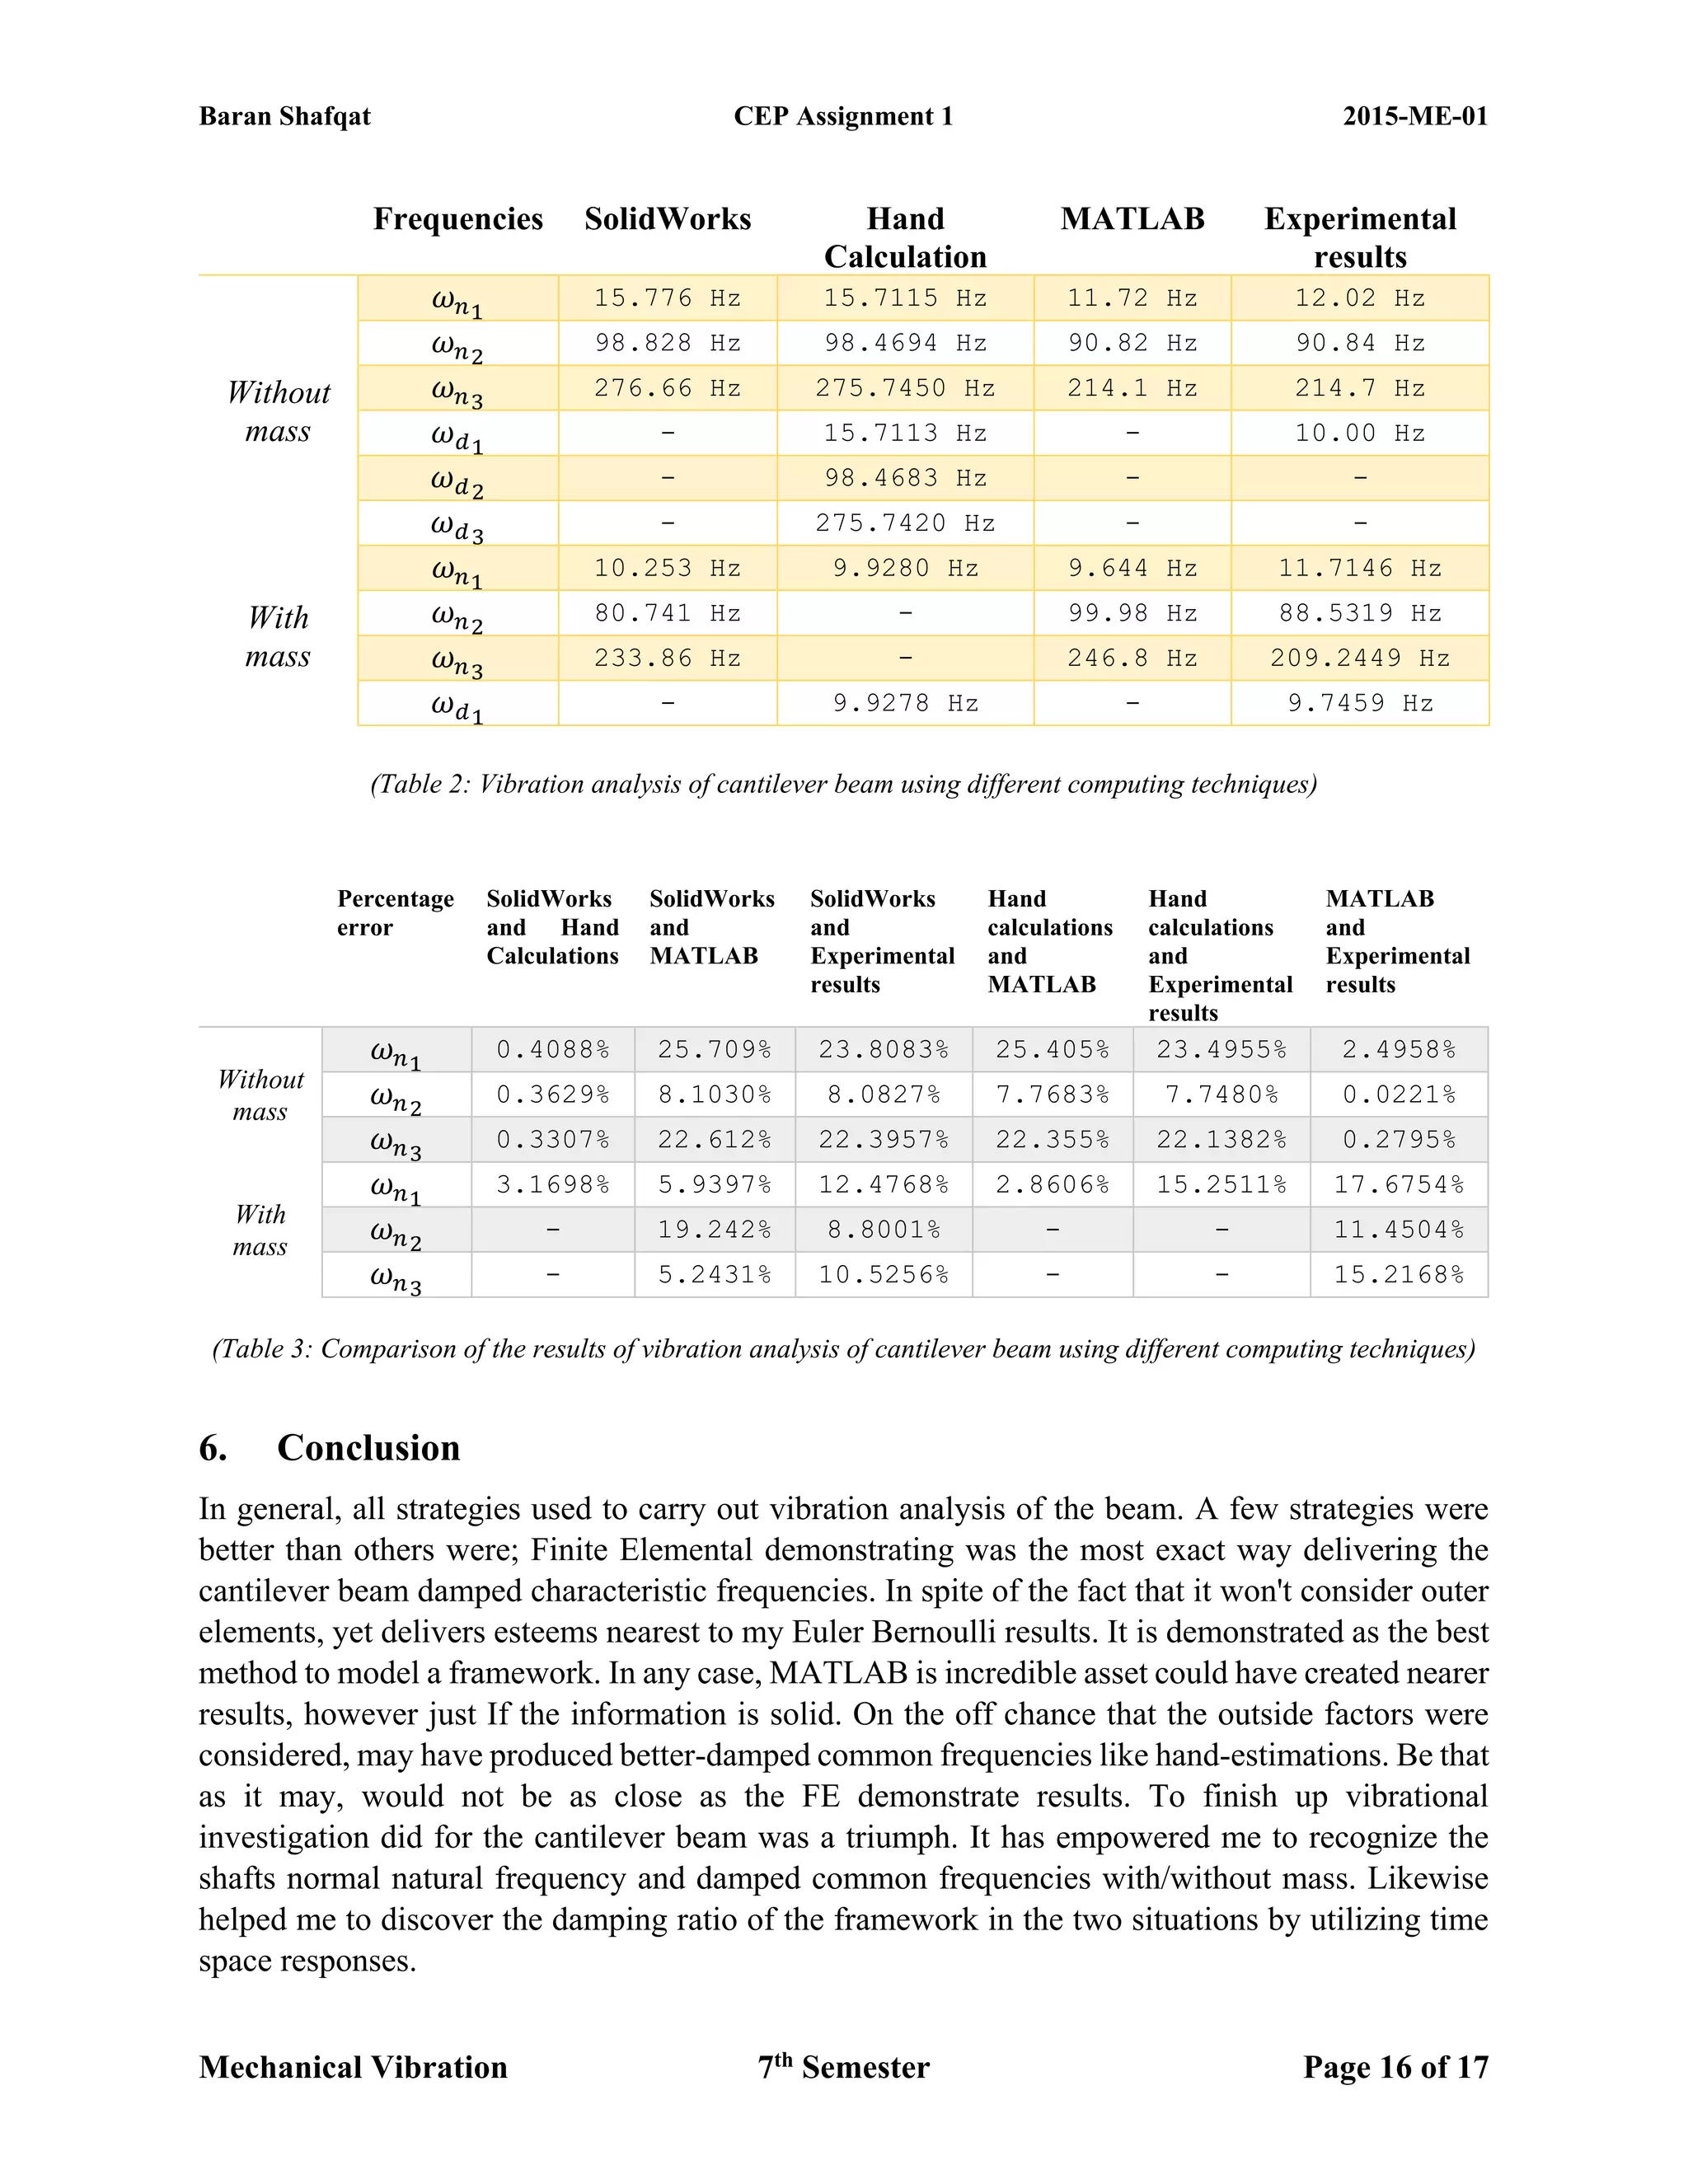
techniques have been employed in this regard like SolidWorks and MATLAB. The results of solid
works are more precise corresponding to the material selection and have minimum percentage
error with the hand calculations. As the results on MATLAB have been carried out by the help of
the experimental data so the percentage error of it with the experimental results is found minimum.
The main objective associated with this project is estimation of natural frequencies and
phenomenon of vibration control.
1. Introduction
To have a broad understanding about the vibrational behavior and vibrational analysis of different
structures and machines is mandatory for an engineer in order to make rapid progress in his field.
The effects of different forcing frequencies must be taken into account. In some cases, the effects
are negligible but the same thing does not happen in most of the cases where if the forcing
frequency matches with the natural frequency of the vibrating object, it may result in crucial
problems as the amplitude at resonance is maximum.
The impact of vibrations on a body can be exemplified as the rotor of the helicopter and the wing
of the aero-plane. Both act as cantilever beam. During maintenance operation of aircraft, proper
vibration tracing is carried out in order to avoid any harmful consequences during the flights. In
the rare cases, where the landing is made on an uneven surface, the wing of the aero-plane may
experience different nature of forcing frequency and if got match with the natural frequency of the
wing, the phenomenon of ground resonance takes place. In such situation, proper isolation is
required and to avoid ground resonance, changing the frequency ratio is made.[1]
At resonance, it becomes very difficult to avoid the vibrations. Thus it is mandatory to understand
the concept and relation between the natural frequency of the vibrating body and forcing
frequency. The vibration control can be made either by using the passive control system or active
control system. If the passive control system is unable to meet the requirements related to the
vibration control, an active control system is introduced with proportional gain and derivative
gain.[2]
In the experiment of cantilever beam, magnet was used as a system providing passive controlling.
If the vibration controlling system was not used the amplitude of vibration got very large and the
whole beam got ruptured in meanwhile. The intensity of this aspect can be realized that the](https://image.slidesharecdn.com/2015-me-01cep1-190212104208/75/Vibration-analysis-and-modelling-of-cantilever-beam-1-2048.jpg)
![Baran Shafqat CEP Assignment 1 2015-ME-01
Mechanical Vibration 7th
Semester Page 2 of 17
vibration control is also a most important criteria especially in case of the cars where engine is the
most dominant source of vibration and for the passenger ease and comfort, the vibrational
controlling system is employed in it. [3]
The main objective of this project is to make a clear understanding about the response of a single
degree of freedom system using different computational techniques or modern tools like Lab-
View, SolidWorks and MATLAB. The experiment was carried out on a cantilever beam in order
to study its vibrational behavior. The experimental data was gained by using Lab-View and the
results were then compared with the results of SolidWorks, MATLAB and theoretical calculations
employing the basic relations. [4]The results of SolidWorks and theoretical calculations were
comparable as the material selected in the SolidWorks and the material specifications used in
theoretical calculations are similar but the experimental results and the results of MATLAB were
found quite similar as MATLAB was made to use the experimental data for the further
calculations.
2. Literature Review
While dealing with the response of the system, we need to consider its displacement curves in both
time and frequency domain. The response of the system under any forcing frequency gives
information about the nature of the forcing frequency i.e. either it is periodic or non-periodic. In
order to explain it on the cantilever beam, we need to consider the effect of the mass applies and
also the mass of the beam to understand the nature of the response of the beam. First of all we need
to be clear about few of the most important terminologies that are explained below.
2.1. Free and Forced Vibration
Free vibration:
When an external force is applied on a vibrating body for a very short interval and the body is
allowed to make vibrations under its inertia, is called free vibration. In ideal cases, with the passage
of time, ignoring the damping resistive force imposed by the air and air drag, the amplitude of the
vibration remains constant (undamped oscillation) but in actual practice, the air drag decreases the
amplitude of vibration and eventually the body comes to rest after certain time of oscillation.[5]
The general equation for free vibration is,
𝑚 𝑒𝑞 𝑥̈ + 𝑐 𝑒𝑞 𝑥̇ + 𝑘 𝑒𝑞 𝑥 = 0
Where
𝑚 𝑒𝑞 = 𝐸𝑞𝑢𝑖𝑣𝑎𝑙𝑒𝑛𝑡 𝑚𝑎𝑠𝑠 𝑜𝑓 𝑡ℎ𝑒 𝑣𝑖𝑏𝑟𝑎𝑡𝑖𝑛𝑔 𝑏𝑜𝑑𝑦 (𝑘𝑔)
𝑐 𝑒𝑞 = 𝐸𝑞𝑢𝑖𝑣𝑎𝑙𝑒𝑛𝑡 𝑑𝑎𝑚𝑝𝑖𝑛𝑔 𝑐𝑜𝑛𝑠𝑡𝑎𝑛𝑡 𝑜𝑓 𝑡ℎ𝑒 𝑑𝑎𝑚𝑝𝑒𝑟 (𝑁𝑠𝑚−2
)
𝑘 𝑒𝑞 = 𝐸𝑞𝑢𝑖𝑣𝑎𝑙𝑒𝑛𝑡 𝑠𝑝𝑟𝑖𝑛𝑔 𝑐𝑜𝑛𝑠𝑡𝑎𝑛𝑡 𝑜𝑓 𝑡ℎ𝑒 𝑠𝑝𝑟𝑖𝑛𝑔 (𝑁𝑚−1
)
The response of the system in free vibrations is transient response.
Forced vibration:
When an external force is applied on a body and body is allowed to execute vibrations then after
certain time interval a periodic force is applied on the body and this force is being applied. This](https://image.slidesharecdn.com/2015-me-01cep1-190212104208/75/Vibration-analysis-and-modelling-of-cantilever-beam-2-2048.jpg)
![Baran Shafqat CEP Assignment 1 2015-ME-01
Mechanical Vibration 7th
Semester Page 3 of 17
not only increases the amplitude of the vibration but if the frequency of the externally applied force
becomes equal to the natural frequency of oscillation of the body, the phenomenon of resonance
takes place and the body is assumed to have ideal infinite magnitude displacement.[6]
The general equation for free vibration is,
𝑚 𝑒𝑞 𝑥̈ + 𝑐 𝑒𝑞 𝑥̇ + 𝑘 𝑒𝑞 𝑥 = 𝐹(𝑡)
Where
𝐹(𝑡) = 𝐸𝑥𝑡𝑒𝑟𝑛𝑎𝑙𝑙𝑦 𝑎𝑝𝑝𝑙𝑖𝑒𝑑 𝑓𝑜𝑟𝑐𝑒
The response of the system in free vibrations is steady state response.
Natural frequency (𝝎 𝒏):
The frequency with which a body oscillated when no external force or driving force is applied on
the body is called its natural frequency.
𝜔 𝑛 = √
𝑘 𝑒𝑞
𝑚 𝑒𝑞
Natural frequency is most crucial element in the designing procedure i.e. we need to take into
account the natural frequency so that the frequency of externally applied force may not get equal
to the natural frequency and results in resonance. In order to avoid resonance, information related
to natural frequency is very much important. [7]
Frequency ratio (𝒓):
It is the ratio between the frequency of the externally applied force and the natural frequency of
the vibrating body. At resonance, frequency ratio is unity.
𝑟 =
𝜔
𝜔 𝑛
Damping ratio (𝜻):
It is the ratio between the equivalent damping constant of the system and the critical damping
constant of the system. For an undamped system, 𝜁 = 0 [8]
𝜁 =
𝑐 𝑒𝑞
𝑐 𝑐
=
𝑐 𝑒𝑞
2 × 𝑚 𝑒𝑞 × 𝜔 𝑛
=
𝑐 𝑒𝑞
2 × √ 𝑚 𝑒𝑞 × 𝑘 𝑒𝑞
2.2. Magnification Factor
It is the ratio between the steady state amplitude of the vibrating body and the static deflection
experienced by the body under the action of its own weight.[9]
𝑋 =
𝐹𝑜
√(𝑘 𝑒𝑞 − 𝑚 𝑒𝑞 𝜔2)
2
+ (𝑐 𝑒𝑞 𝜔)
2
𝑋 =
𝐹𝑜
𝑘 𝑒𝑞√(1 − 𝑟2)2 + (2𝜁𝑟)2
=
𝛿𝑠𝑡
√(1 − 𝑟2)2 + (2𝜁𝑟)2
𝑀 =
𝑋
𝛿𝑠𝑡
=
1
√(1 − 𝑟2)2 + (2𝜁𝑟)2](https://image.slidesharecdn.com/2015-me-01cep1-190212104208/75/Vibration-analysis-and-modelling-of-cantilever-beam-3-2048.jpg)
![Baran Shafqat CEP Assignment 1 2015-ME-01
Mechanical Vibration 7th
Semester Page 5 of 17
4.1. Vibration analysis of the cantilever beam on SolidWorks
First of all the cantilever beam was modelled in SolidWorks by using the provided dimensions
after this from the simulation mode, frequency simulation was selected and then the material was
selected for the beam and then the fixture was applied on one of its face. Meshing was done and
then the simulation was run without applying any external mass on the beam.[10]
After this the same procedure of modelling was done and then as the mass applied to its one end
is 0.099 kg, so a box with the required assumed dimensions was generated and extruded. After this
the same simulation procedure was performed and the results were obtained.
After this the following results were generated by the solid works,
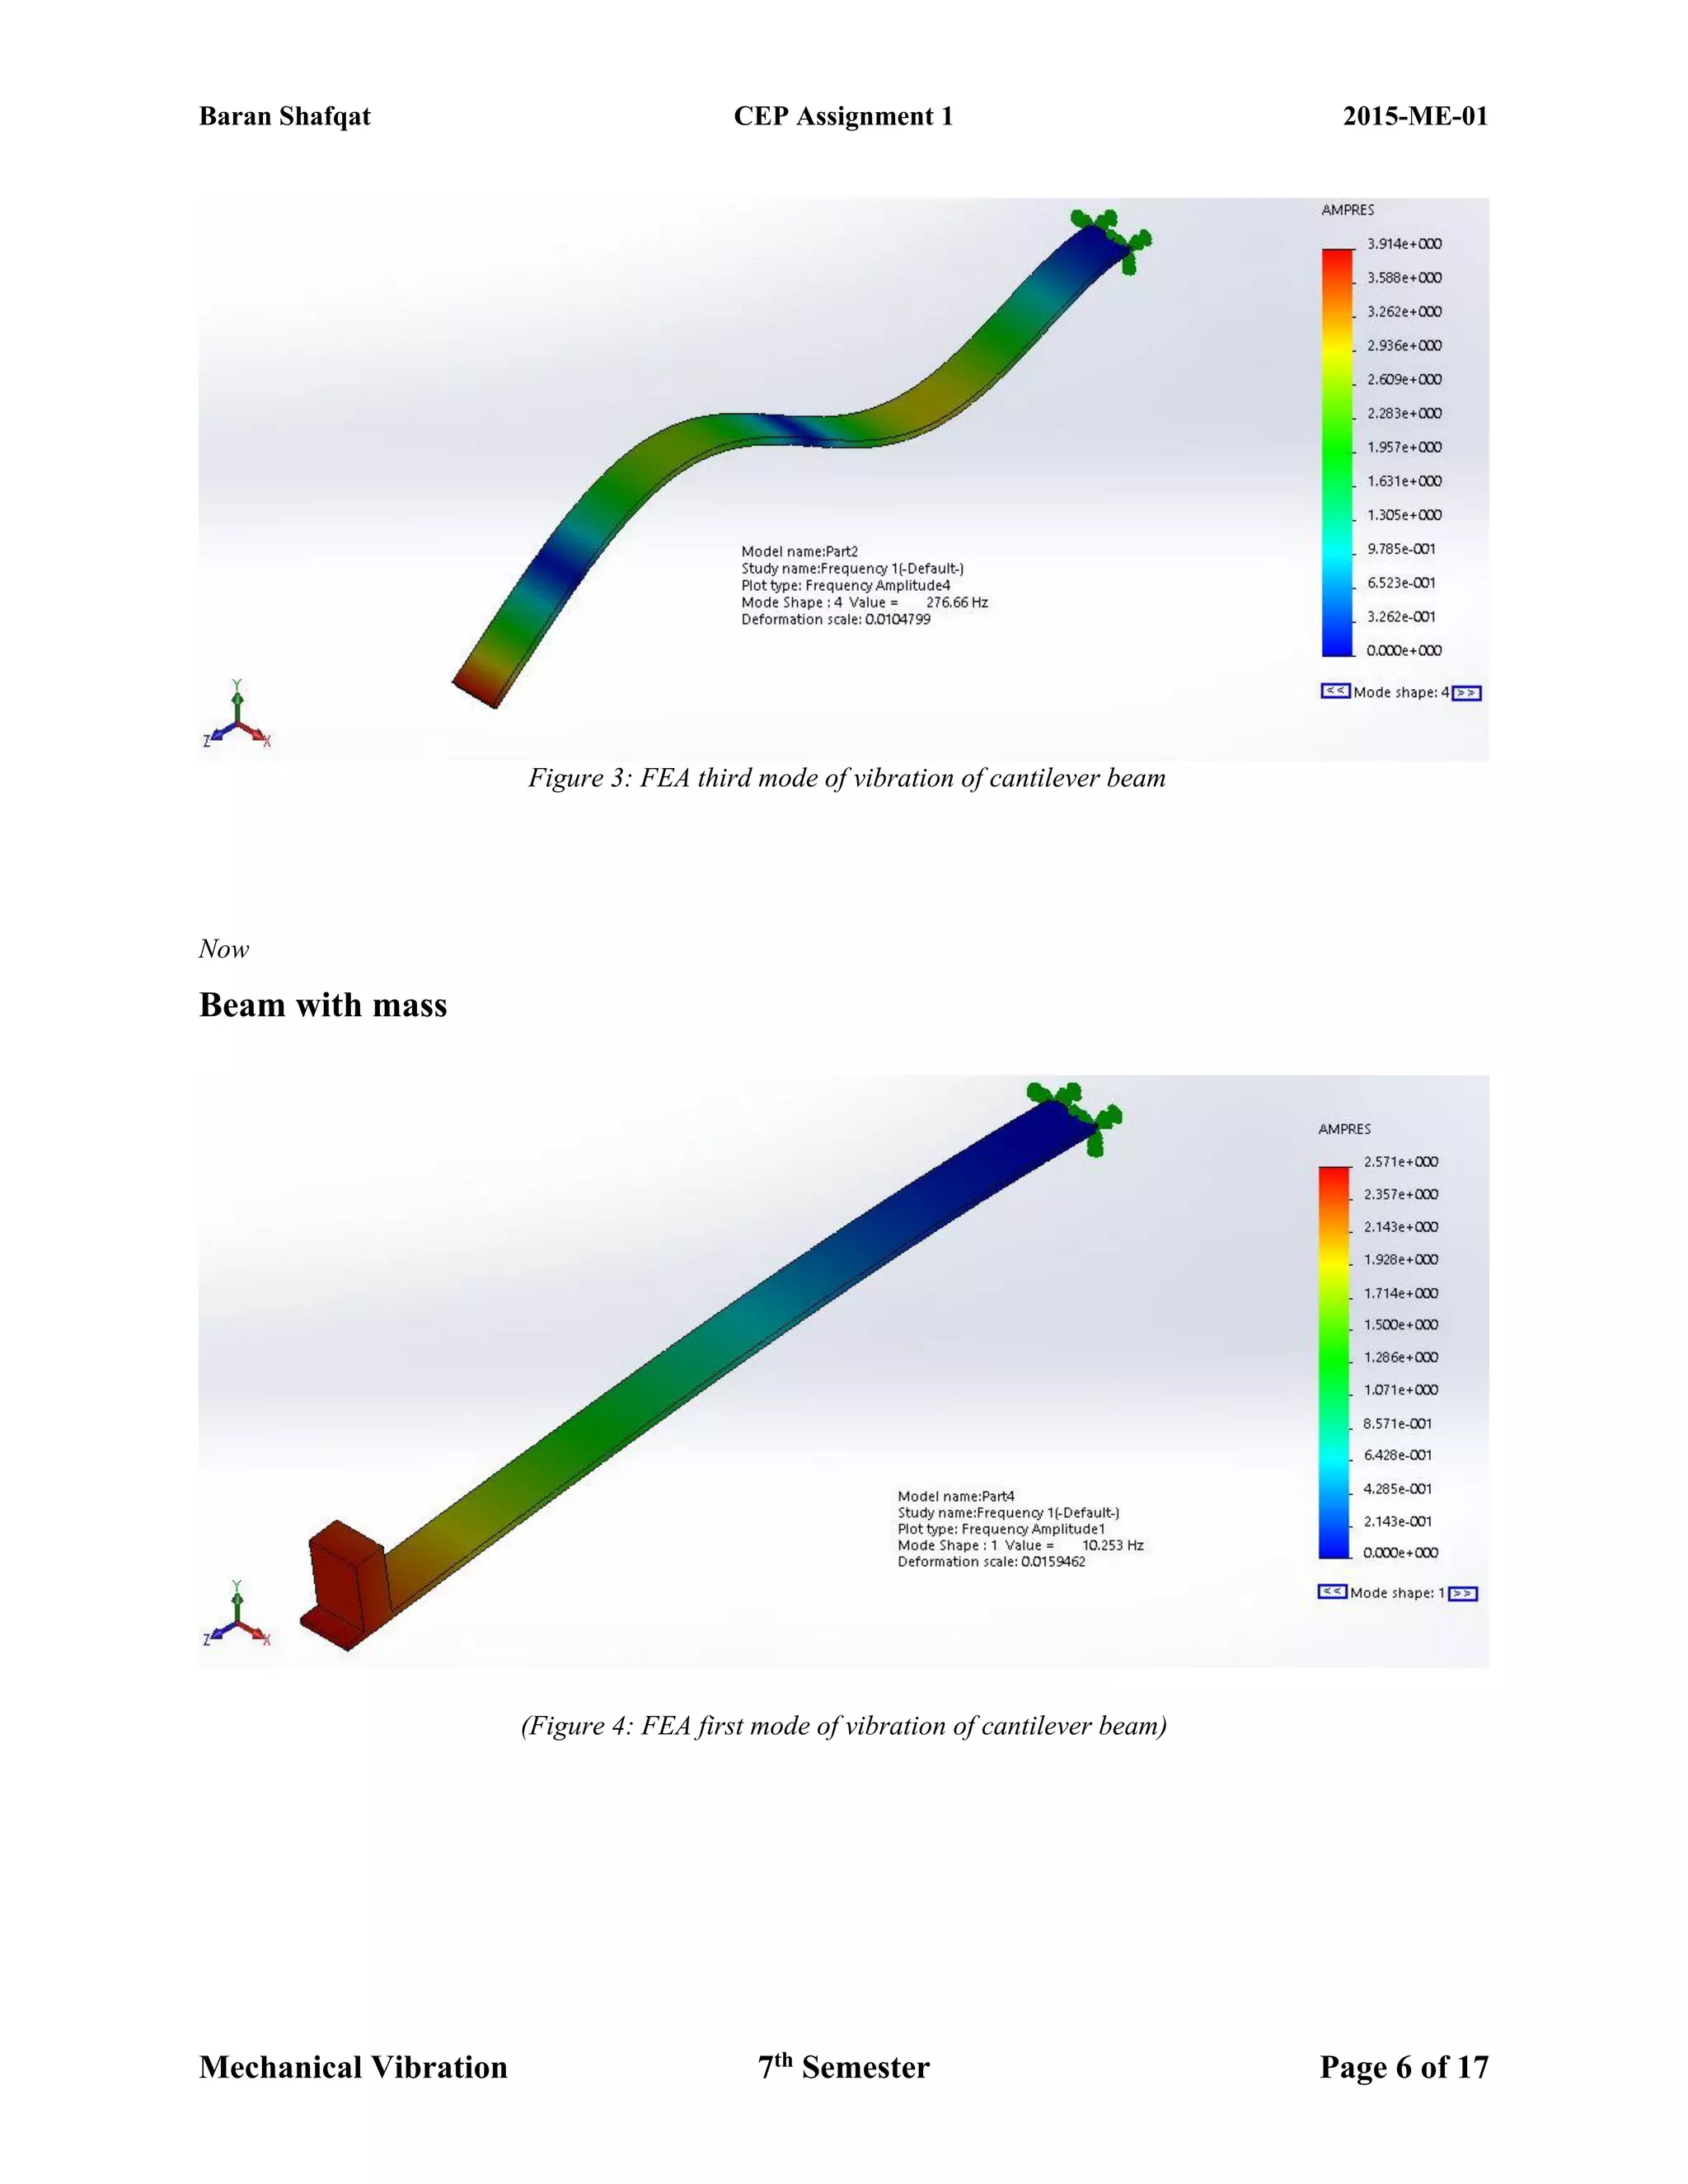
Beam without mass
(Figure 1: FEA first mode of vibration of cantilever beam)
(Figure 2: FEA second mode of vibration of cantilever beam)](https://image.slidesharecdn.com/2015-me-01cep1-190212104208/75/Vibration-analysis-and-modelling-of-cantilever-beam-5-2048.jpg)