
Download as PDF, PPTX


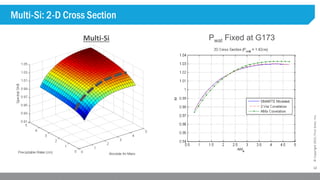


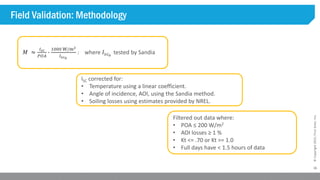
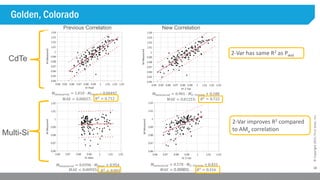
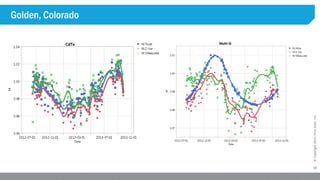
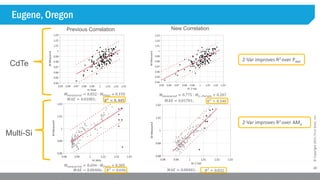
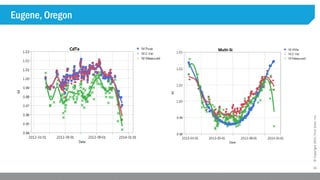
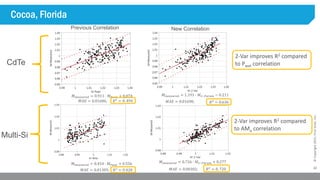
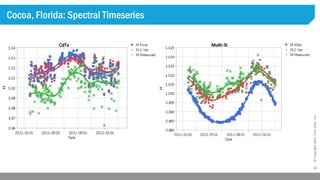
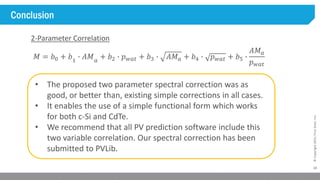


This document proposes a two-variable spectral correction model to more accurately account for the effects of changing solar spectrum on the performance of cadmium telluride (CdTe) and multicrystalline silicon (multi-Si) photovoltaic modules. It compares the proposed two-variable model, which considers both absolute air mass and precipitable water, to existing single-variable models. Validation using field data from three locations with different climates shows the two-variable model improves correlation compared to the single-variable models in most cases. The document concludes the two-variable model provides a simple functional form that works for both CdTe and multi-Si modules, and recommends its inclusion in PV performance prediction software.


