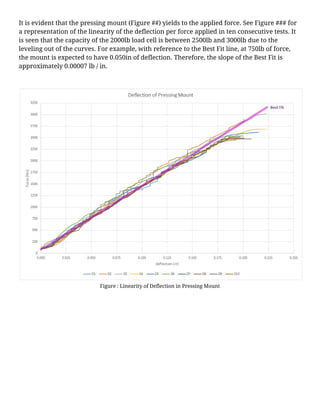
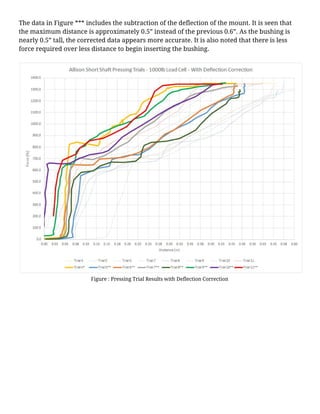
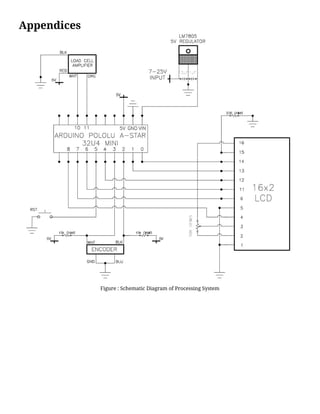
Faculty of Mechanical and Mechatronics Engineering
Design of a Stress and Strain Measuring Device for Automotive Production
A report prepared for Ontario Drive & Gear Ltd.,
New Hamburg, Ontario
By
E.V. Ostapovich
2B Mechanical Engineering
Letter of Submittal
220 Bergey Ct,
New Hamburg,
ON N3A 2J5
June 14, 2016
Professor David C. Weckman,
Associate Chair Undergraduate Studies,
Mechanical Engineering Department of Mechanical and Mechatronics Engineering
University of Waterloo
Waterloo, Ontario
N2L 3G1
Dear Professor Weckman:
This report, entitled "Design of a Stress and Strain Measuring Device for Automotive
Production" was prepared as my 2A Work Report for Ontario Drive & Gear Ltd. This is my first
work term report. The purpose of this report is to evaluate the repeatability of a newly
developed stress and strain measuring device in an automotive production environment.
This report was written entirely by me and has not received any previous academic
credit at this or any other institution. I would like to thank Mr. Ivan Chan for guiding me in
my design choices and providing information resources for the components. He also showed
me how to make the Arduino code more efficient. Lastly, he developed the C# code to
integrate the Arduino code into a User Interface. I also wish to thank Mr. Kyle M for his
metalwork expertise in the fabrication of the device and design guidance. I received no other
assistance.
Sincerely Yours,
(Your Signature goes here)
Emily V. Ostapovich
20577879
2B Mechanical Engineering
Introduction
A reliable device to measure applied force and stroke distance of a mechanical press is highly
practical in industrial workplaces. Some companies have technical specifications of a
required force for part assembly. The device should be adjustable to nearly any shaft-bearing
press. The challenge in creating this device is making its readings repeatable, as repeatability
is key for efficiency and monetary savings in a production environment. In essence, it must be
capable of reading accurately under high (approximately 3000lb) and numerous loads for
continuous use in a production environment.
The device designed for Ontario Drive & Gear Ltd. allows bushings to be pressed into shafts of
varying dimensions. The device’s functions are to record the force and stroke distance
required to insert the bushing into each shaft, and to also determine if oversize or undersize
shafts have an effect on the required force. See Figure *** for the press used for the design of
the device.
Figure : Mechanical Press
The overall concept of the device is to track the rotation of a mechanical press lever and
compare it to the applied force on a force-measuring instrument known as a load cell. The
data from the lever and the load cell is read and manipulated with software for analysis. The
key components to the device are described as follows:
Incremental encoders are used to track motor shaft rotations and are
applicable for many industrial and small-scale uses. For this device,
the encoder tracks the shaft of a mechanical press. A challenge
associated with encoders is repeatability: the deviation between
subsequent readings. In the software code, the encoder readings (100
“points” per 360°) are converted to inches. See Figure **.
Figure : Incremental Encoder
Load cells are small devices with internal
resistances. They are used to quantify applied
force by reading the varying resistances. By
connecting the load cell to a load cell amplifier
and a microcontroller, the resistance changes
can be accurately obtained. Load cells are
applicable for industrial and home uses. A
challenge for load cells is calibration and
reliability as applied force fluctuates in speed
and intensity. See Figure ***.
Figure : Load Cell and Amplifier
Arduino microcontrollers have an open-sourced software, appropriate for
home, work, and industry use. As components are interchanging and
upgrading, its ease of use allows for simple code manipulation. A challenge
with the Arduino software is the efficiency of code flow. Load cells
communicate to the Arduino through special “interrupt” pins for high
accuracy. When these pins are read, the associated information overrides
other incoming information. When many interrupt pins are used in a code,
the code can be significantly slowed. See Figure ***.
Figure : Arduino Pololu A-Star 32U4 Microcontroller
The incremental encoder and load cell data are received by the arduino microcontroller.
1. Materials and Methods
1.1 Encoder Mount
As seen in Figure ***, the 128T (toothed) gear is attached directly to the internal press shaft
and gear. It tracks the internal press shaft with a 1:1 rotation ratio. The 100PPR encoder is
attached to a 22T gear and has a 5.82:1 ratio. 100PPR indicates 100 points are read by the
encoder per 360° revolution, or full rotation, of the shaft. The 22T gear will rotate 5.82 times if
the 128T gear rotates once. Both gears have 20° pressure angle, 32° pitch, and ¼” face width.
Gears have maximum contact when their pressure angle and pitch diameter are the same.
Figure : Pressure Angle and Pitch Diameter (PD) of Gear Teeth
The gears are protected with an aluminum casing that is bolted to the mechanical press.
Figure : Encoder Mount
1.2 Pressing Mount
See Table *** for the decision making matrix associated with selecting a pressing mount
design.
Table : Decision Matrix for Pressing Mount Design on a 1-10 Scale
Weigh
t
Pin-and-Roller Straight-on Platform
Ease of
Manufacturing
and Installing
20% 4 8
Cost to
Manufacture
and Install
10% 3 6
Durable 30% 8 3
Accuracy 40% 9 4
100% 7.1 4.7
The straight-on platform is certainly easier and cheaper to build because of less required
material, but it significantly less accurate than a pin-and-roller. This is because the distance
between each support in a pin-and-roller can be calculated to be exactly equal on either side
of the press. The straight-on platform makes it difficult to exactly center the shaft on top of the
load cell. The applied force could be unreliable. Furthermore, the load cell and structure
would be subjected to approximately 1300lbs of repeated force with the straight-on platform.
With the pin-and-roller, only half (650lb) of repeated force is applied to the load cell. This
helps with accuracy and durability.
The mount is selected and manufactured as a pin-and-roller mechanical system. See Figure
*** for a representation and Figure *** for the completed version. End A is fixed, P is the force
applied onto the shaft, and end B holds the load cell. The load cell reads ½ of the applied force
(P/2), but the code multiplies the input by 2 and outputs the correct.
Figure : Pin-and-Roller Mechanical System
The most challenging constraint for creating the mounting fixture is fitting the height of the
tallest shaft (approximately 16”) between the press and the mount. See Figure ***. The cut-out
channel at the center of the horizontal bar is so the tallest shaft and bushing can fit between
the mounting fixture and pressing column. After 3 days of pressing trials, the horizontal bar
began to yield due to the missing material (or strength) of the channel. It is also yielding
because it is structural steel, not hardened steel. If the horizontal bar touches the base of the
press, the readings the load cell receives will be incorrect. This issue is mitigated by welding
horizontal plates and shimming (adding spacers) the entire mounting fixture to add space
between the channel and the base of the press. This is achieved with a loss of distance
between the pressing mechanism and bushing/shaft.
Figure : Mechanical Press and Tallest Shaft & Mounting Fixture
1.3 Data Processing System
1.3.1 Data Gathering
The data gathering system is comprised of several components. A 5V power input, load cell
connection, and encoder connection are in communications with the Arduino Pololu A-Star
32U4 Microcontroller. Its final casing is seen in Figure ***. It displays bushing distance and
force on an LCD and is equipped with a reset button to tare (or zero) the distance reading. See
Appendix A for a circuit schematic.
Figure : Data Gathering System
The data gathering system is powered by the Arduino Pololu A-Star 32U4 microcontroller and
uses Arduino coding software. The code simultaneously reads data from the encoder and load
cell, converts the information into inches and pounds, and displays the information onto an
LCD screen. The system can be powered either through a wall socket or through USB
connection.
1.3.2 User Interface System
The user interface system uses the data collected from the data gathering system. Using Visual
Studio and C#, this system creates a user interface for the operator to interact with. It also
outputs a real-time stress and strain curve as seen in Figure ####. It also saves the raw data in
a .txt file for future use.
Figure : User Interface
Results and Data
A challenge associated with load cells is accuracy. As generally seen in Table 1 and 2, the
difference between actual and read increases as force increases. The 1000lb load cell displays
less accurate results. After multiple tests of approximately 1300lb of applied force, it is seen
that the 1000lb load cell outputs a maximum value of approximately 1350lb. Because the tests
are consisting of higher than the recommended 1000lb force, the results appear to cap at
1350lb. See Figure ###.
Table 1: Calibration of 1000lb Load Cell in Pounds
Applied Load Load Cell Reading Difference
26.5 25 1.5
199 190.8 8.2
254 239.4 14.6
349 322 27
Table 2: Calibration of 2000lb Load Cell in Pounds
Applied Load Load Cell Reading Difference
63.5 58.62 4.88
127 117.42 9.58
150 140 10
188.5 178 10.5
223 214 9
315.5 306 9.5
422 416 6
Pre-Shaft pressing trials to insert various bushings into shafts are shown in Figure ##. This
graph depicts that over time, the code efficiency has improved for smoother (less step-like)
results.
Further trials depict related trends. See Figure ###. These trials are on the same type of shaft
and bushing. They all have a dramatic rise from 0 ~ 0.10inch and 600lb and have a less
dramatic rise until approximately 0.60 inch and 1350lb. The data depicts that the 1000lb load
cell has a maximum capacity of 1350lb. A 2000lb load cell is used instead.
Figure : Further Pressing Trials with Same Shaft
It is evident that the pressing mount (Figure ##) yields to the applied force. See Figure ### for
a representation of the linearity of the deflection per force applied in ten consecutive tests. It
is seen that the capacity of the 2000lb load cell is between 2500lb and 3000lb due to the
leveling out of the curves. For example, with reference to the Best Fit line, at 750lb of force,
the mount is expected to have 0.050in of deflection. Therefore, the slope of the Best Fit is
approximately 0.00007 lb / in.
Figure : Linearity of Deflection in Pressing Mount
The data in Figure *** includes the subtraction of the deflection of the mount. It is seen that
the maximum distance is approximately 0.5” instead of the previous 0.6”. As the bushing is
nearly 0.5” tall, the corrected data appears more accurate. It is also noted that there is less
force required over less distance to begin inserting the bushing.
Figure : Pressing Trial Results with Deflection Correction
Glossary
Appendices
Figure : Schematic Diagram of Processing System
 

WorkReportDRAFT

  • 1.
    Faculty of Mechanicaland Mechatronics Engineering Design of a Stress and Strain Measuring Device for Automotive Production A report prepared for Ontario Drive & Gear Ltd., New Hamburg, Ontario By E.V. Ostapovich 2B Mechanical Engineering
  • 2.
    Letter of Submittal 220Bergey Ct, New Hamburg, ON N3A 2J5 June 14, 2016 Professor David C. Weckman, Associate Chair Undergraduate Studies, Mechanical Engineering Department of Mechanical and Mechatronics Engineering University of Waterloo Waterloo, Ontario N2L 3G1 Dear Professor Weckman: This report, entitled "Design of a Stress and Strain Measuring Device for Automotive Production" was prepared as my 2A Work Report for Ontario Drive & Gear Ltd. This is my first work term report. The purpose of this report is to evaluate the repeatability of a newly developed stress and strain measuring device in an automotive production environment. This report was written entirely by me and has not received any previous academic credit at this or any other institution. I would like to thank Mr. Ivan Chan for guiding me in my design choices and providing information resources for the components. He also showed me how to make the Arduino code more efficient. Lastly, he developed the C# code to integrate the Arduino code into a User Interface. I also wish to thank Mr. Kyle M for his metalwork expertise in the fabrication of the device and design guidance. I received no other assistance. Sincerely Yours, (Your Signature goes here) Emily V. Ostapovich 20577879 2B Mechanical Engineering
  • 3.
    Introduction A reliable deviceto measure applied force and stroke distance of a mechanical press is highly practical in industrial workplaces. Some companies have technical specifications of a required force for part assembly. The device should be adjustable to nearly any shaft-bearing press. The challenge in creating this device is making its readings repeatable, as repeatability is key for efficiency and monetary savings in a production environment. In essence, it must be capable of reading accurately under high (approximately 3000lb) and numerous loads for continuous use in a production environment. The device designed for Ontario Drive & Gear Ltd. allows bushings to be pressed into shafts of varying dimensions. The device’s functions are to record the force and stroke distance required to insert the bushing into each shaft, and to also determine if oversize or undersize shafts have an effect on the required force. See Figure *** for the press used for the design of the device. Figure : Mechanical Press The overall concept of the device is to track the rotation of a mechanical press lever and compare it to the applied force on a force-measuring instrument known as a load cell. The data from the lever and the load cell is read and manipulated with software for analysis. The key components to the device are described as follows:
  • 4.
    Incremental encoders areused to track motor shaft rotations and are applicable for many industrial and small-scale uses. For this device, the encoder tracks the shaft of a mechanical press. A challenge associated with encoders is repeatability: the deviation between subsequent readings. In the software code, the encoder readings (100 “points” per 360°) are converted to inches. See Figure **. Figure : Incremental Encoder Load cells are small devices with internal resistances. They are used to quantify applied force by reading the varying resistances. By connecting the load cell to a load cell amplifier and a microcontroller, the resistance changes can be accurately obtained. Load cells are applicable for industrial and home uses. A challenge for load cells is calibration and reliability as applied force fluctuates in speed and intensity. See Figure ***. Figure : Load Cell and Amplifier Arduino microcontrollers have an open-sourced software, appropriate for home, work, and industry use. As components are interchanging and upgrading, its ease of use allows for simple code manipulation. A challenge with the Arduino software is the efficiency of code flow. Load cells communicate to the Arduino through special “interrupt” pins for high accuracy. When these pins are read, the associated information overrides other incoming information. When many interrupt pins are used in a code, the code can be significantly slowed. See Figure ***. Figure : Arduino Pololu A-Star 32U4 Microcontroller The incremental encoder and load cell data are received by the arduino microcontroller.
  • 5.
    1. Materials andMethods 1.1 Encoder Mount As seen in Figure ***, the 128T (toothed) gear is attached directly to the internal press shaft and gear. It tracks the internal press shaft with a 1:1 rotation ratio. The 100PPR encoder is attached to a 22T gear and has a 5.82:1 ratio. 100PPR indicates 100 points are read by the encoder per 360° revolution, or full rotation, of the shaft. The 22T gear will rotate 5.82 times if the 128T gear rotates once. Both gears have 20° pressure angle, 32° pitch, and ¼” face width. Gears have maximum contact when their pressure angle and pitch diameter are the same. Figure : Pressure Angle and Pitch Diameter (PD) of Gear Teeth The gears are protected with an aluminum casing that is bolted to the mechanical press. Figure : Encoder Mount
  • 6.
    1.2 Pressing Mount SeeTable *** for the decision making matrix associated with selecting a pressing mount design. Table : Decision Matrix for Pressing Mount Design on a 1-10 Scale Weigh t Pin-and-Roller Straight-on Platform Ease of Manufacturing and Installing 20% 4 8 Cost to Manufacture and Install 10% 3 6 Durable 30% 8 3 Accuracy 40% 9 4 100% 7.1 4.7 The straight-on platform is certainly easier and cheaper to build because of less required material, but it significantly less accurate than a pin-and-roller. This is because the distance between each support in a pin-and-roller can be calculated to be exactly equal on either side of the press. The straight-on platform makes it difficult to exactly center the shaft on top of the load cell. The applied force could be unreliable. Furthermore, the load cell and structure would be subjected to approximately 1300lbs of repeated force with the straight-on platform. With the pin-and-roller, only half (650lb) of repeated force is applied to the load cell. This helps with accuracy and durability. The mount is selected and manufactured as a pin-and-roller mechanical system. See Figure *** for a representation and Figure *** for the completed version. End A is fixed, P is the force applied onto the shaft, and end B holds the load cell. The load cell reads ½ of the applied force (P/2), but the code multiplies the input by 2 and outputs the correct.
  • 7.
    Figure : Pin-and-RollerMechanical System The most challenging constraint for creating the mounting fixture is fitting the height of the tallest shaft (approximately 16”) between the press and the mount. See Figure ***. The cut-out channel at the center of the horizontal bar is so the tallest shaft and bushing can fit between the mounting fixture and pressing column. After 3 days of pressing trials, the horizontal bar began to yield due to the missing material (or strength) of the channel. It is also yielding because it is structural steel, not hardened steel. If the horizontal bar touches the base of the press, the readings the load cell receives will be incorrect. This issue is mitigated by welding horizontal plates and shimming (adding spacers) the entire mounting fixture to add space between the channel and the base of the press. This is achieved with a loss of distance between the pressing mechanism and bushing/shaft. Figure : Mechanical Press and Tallest Shaft & Mounting Fixture
  • 8.
    1.3 Data ProcessingSystem 1.3.1 Data Gathering The data gathering system is comprised of several components. A 5V power input, load cell connection, and encoder connection are in communications with the Arduino Pololu A-Star 32U4 Microcontroller. Its final casing is seen in Figure ***. It displays bushing distance and force on an LCD and is equipped with a reset button to tare (or zero) the distance reading. See Appendix A for a circuit schematic. Figure : Data Gathering System The data gathering system is powered by the Arduino Pololu A-Star 32U4 microcontroller and uses Arduino coding software. The code simultaneously reads data from the encoder and load cell, converts the information into inches and pounds, and displays the information onto an LCD screen. The system can be powered either through a wall socket or through USB connection.
  • 9.
    1.3.2 User InterfaceSystem The user interface system uses the data collected from the data gathering system. Using Visual Studio and C#, this system creates a user interface for the operator to interact with. It also outputs a real-time stress and strain curve as seen in Figure ####. It also saves the raw data in a .txt file for future use. Figure : User Interface
  • 10.
    Results and Data Achallenge associated with load cells is accuracy. As generally seen in Table 1 and 2, the difference between actual and read increases as force increases. The 1000lb load cell displays less accurate results. After multiple tests of approximately 1300lb of applied force, it is seen that the 1000lb load cell outputs a maximum value of approximately 1350lb. Because the tests are consisting of higher than the recommended 1000lb force, the results appear to cap at 1350lb. See Figure ###. Table 1: Calibration of 1000lb Load Cell in Pounds Applied Load Load Cell Reading Difference 26.5 25 1.5 199 190.8 8.2 254 239.4 14.6 349 322 27 Table 2: Calibration of 2000lb Load Cell in Pounds Applied Load Load Cell Reading Difference 63.5 58.62 4.88 127 117.42 9.58 150 140 10 188.5 178 10.5 223 214 9 315.5 306 9.5 422 416 6
  • 11.
    Pre-Shaft pressing trialsto insert various bushings into shafts are shown in Figure ##. This graph depicts that over time, the code efficiency has improved for smoother (less step-like) results.
  • 12.
    Further trials depictrelated trends. See Figure ###. These trials are on the same type of shaft and bushing. They all have a dramatic rise from 0 ~ 0.10inch and 600lb and have a less dramatic rise until approximately 0.60 inch and 1350lb. The data depicts that the 1000lb load cell has a maximum capacity of 1350lb. A 2000lb load cell is used instead. Figure : Further Pressing Trials with Same Shaft
  • 13.
    It is evidentthat the pressing mount (Figure ##) yields to the applied force. See Figure ### for a representation of the linearity of the deflection per force applied in ten consecutive tests. It is seen that the capacity of the 2000lb load cell is between 2500lb and 3000lb due to the leveling out of the curves. For example, with reference to the Best Fit line, at 750lb of force, the mount is expected to have 0.050in of deflection. Therefore, the slope of the Best Fit is approximately 0.00007 lb / in. Figure : Linearity of Deflection in Pressing Mount
  • 14.
    The data inFigure *** includes the subtraction of the deflection of the mount. It is seen that the maximum distance is approximately 0.5” instead of the previous 0.6”. As the bushing is nearly 0.5” tall, the corrected data appears more accurate. It is also noted that there is less force required over less distance to begin inserting the bushing. Figure : Pressing Trial Results with Deflection Correction
  • 16.
  • 17.
    Appendices Figure : SchematicDiagram of Processing System