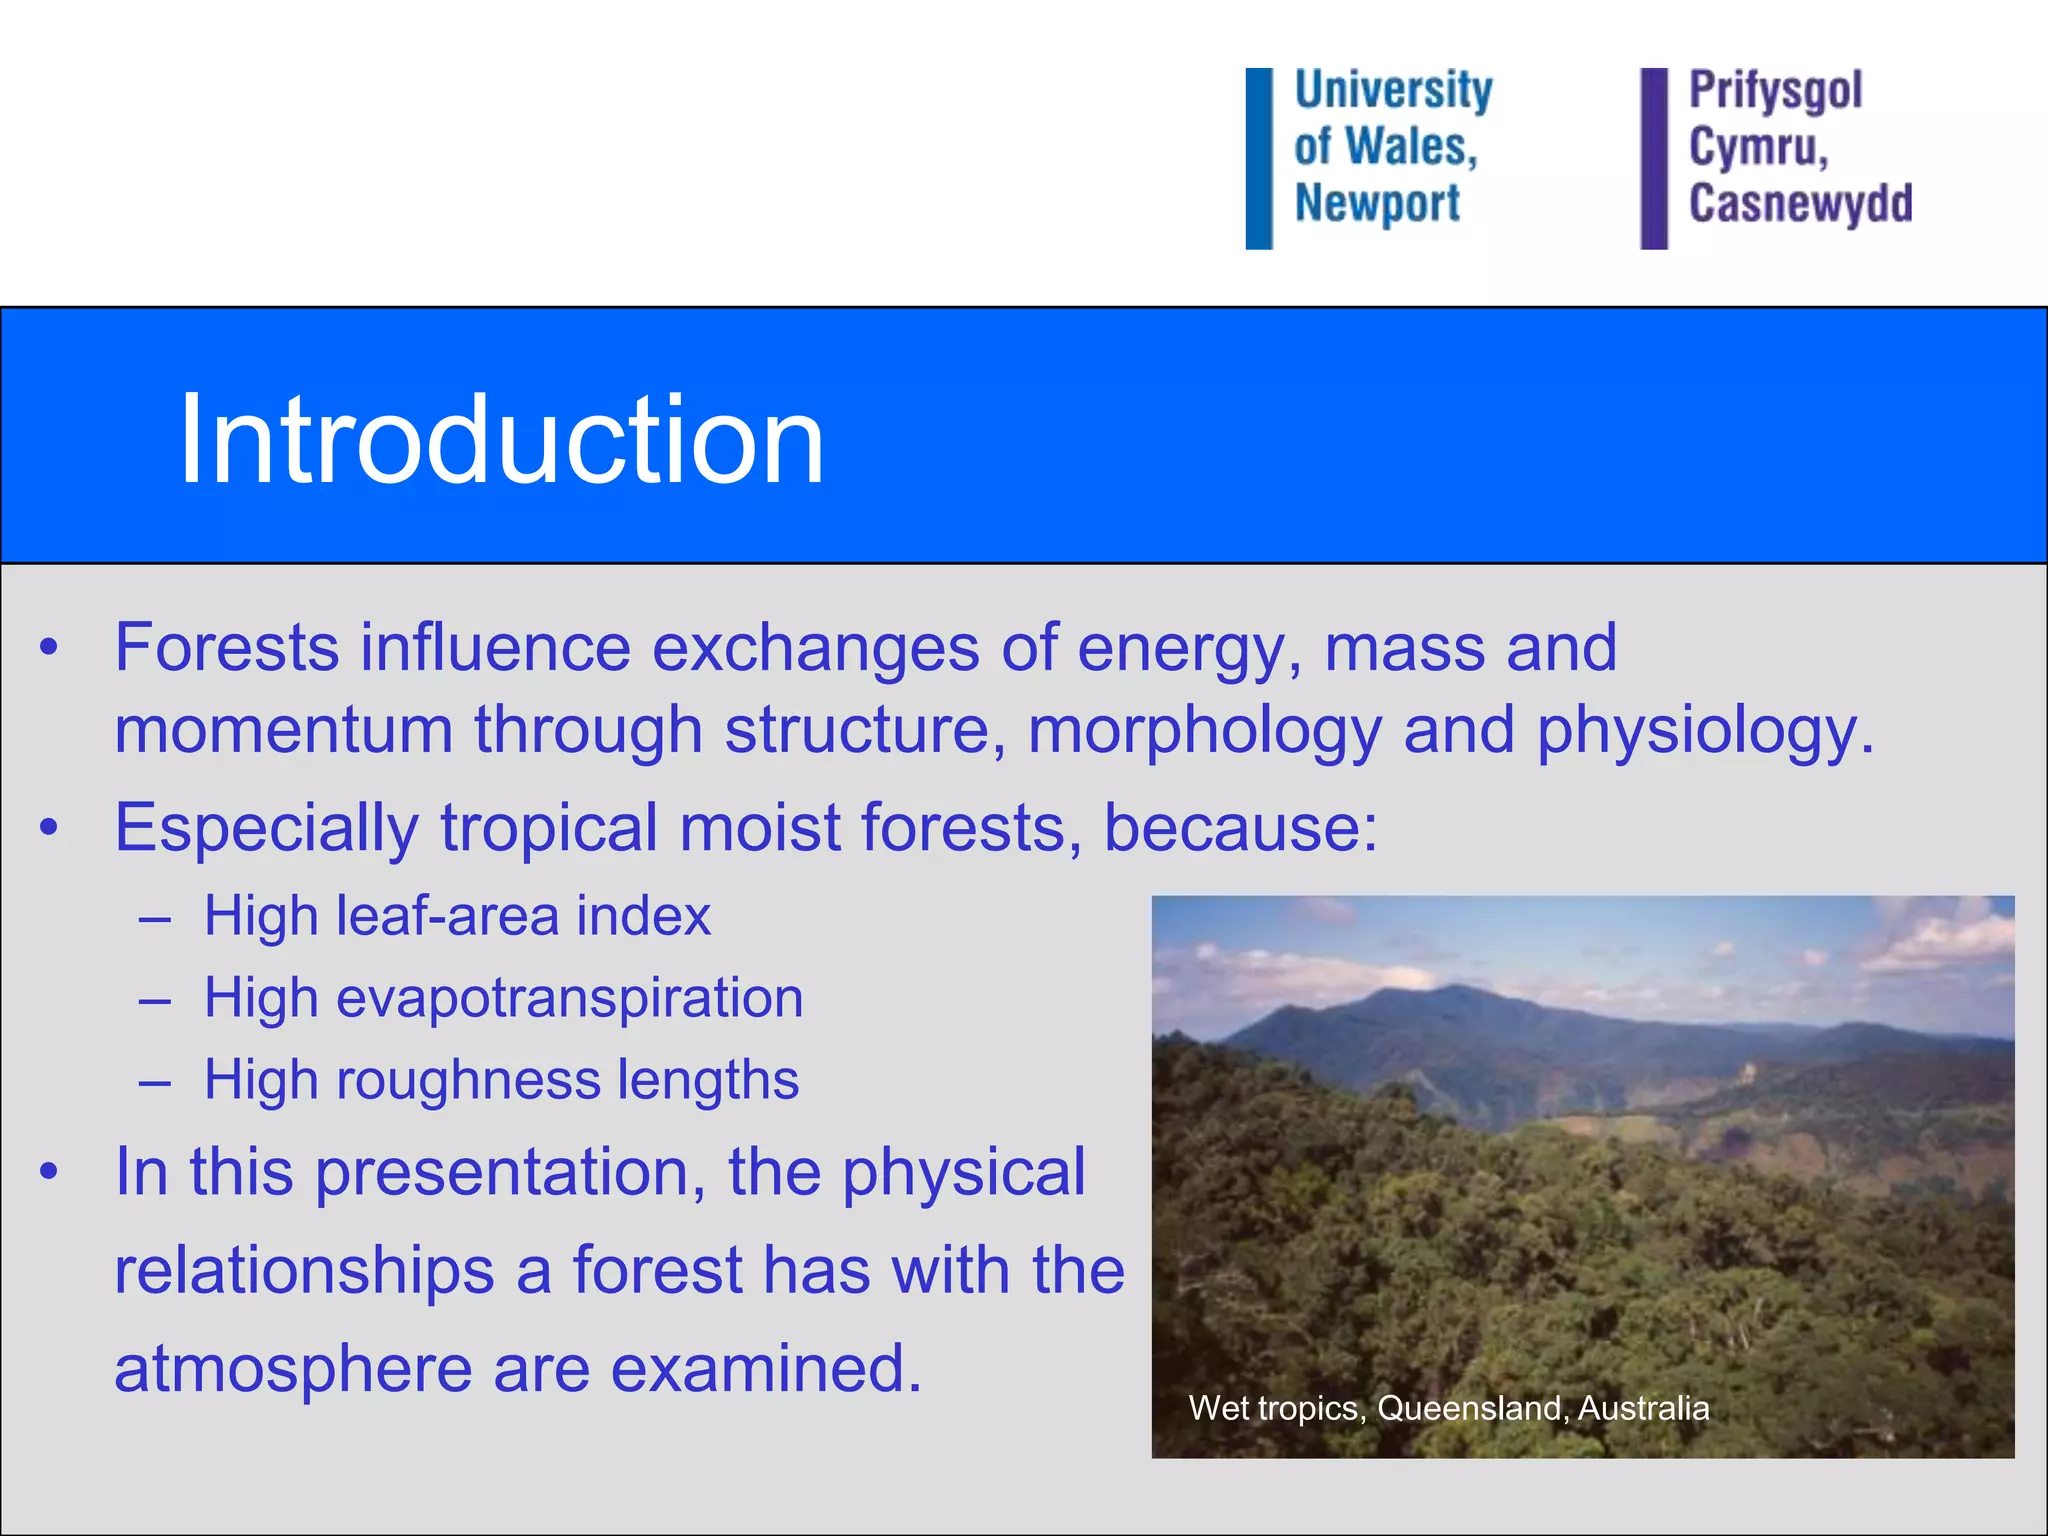
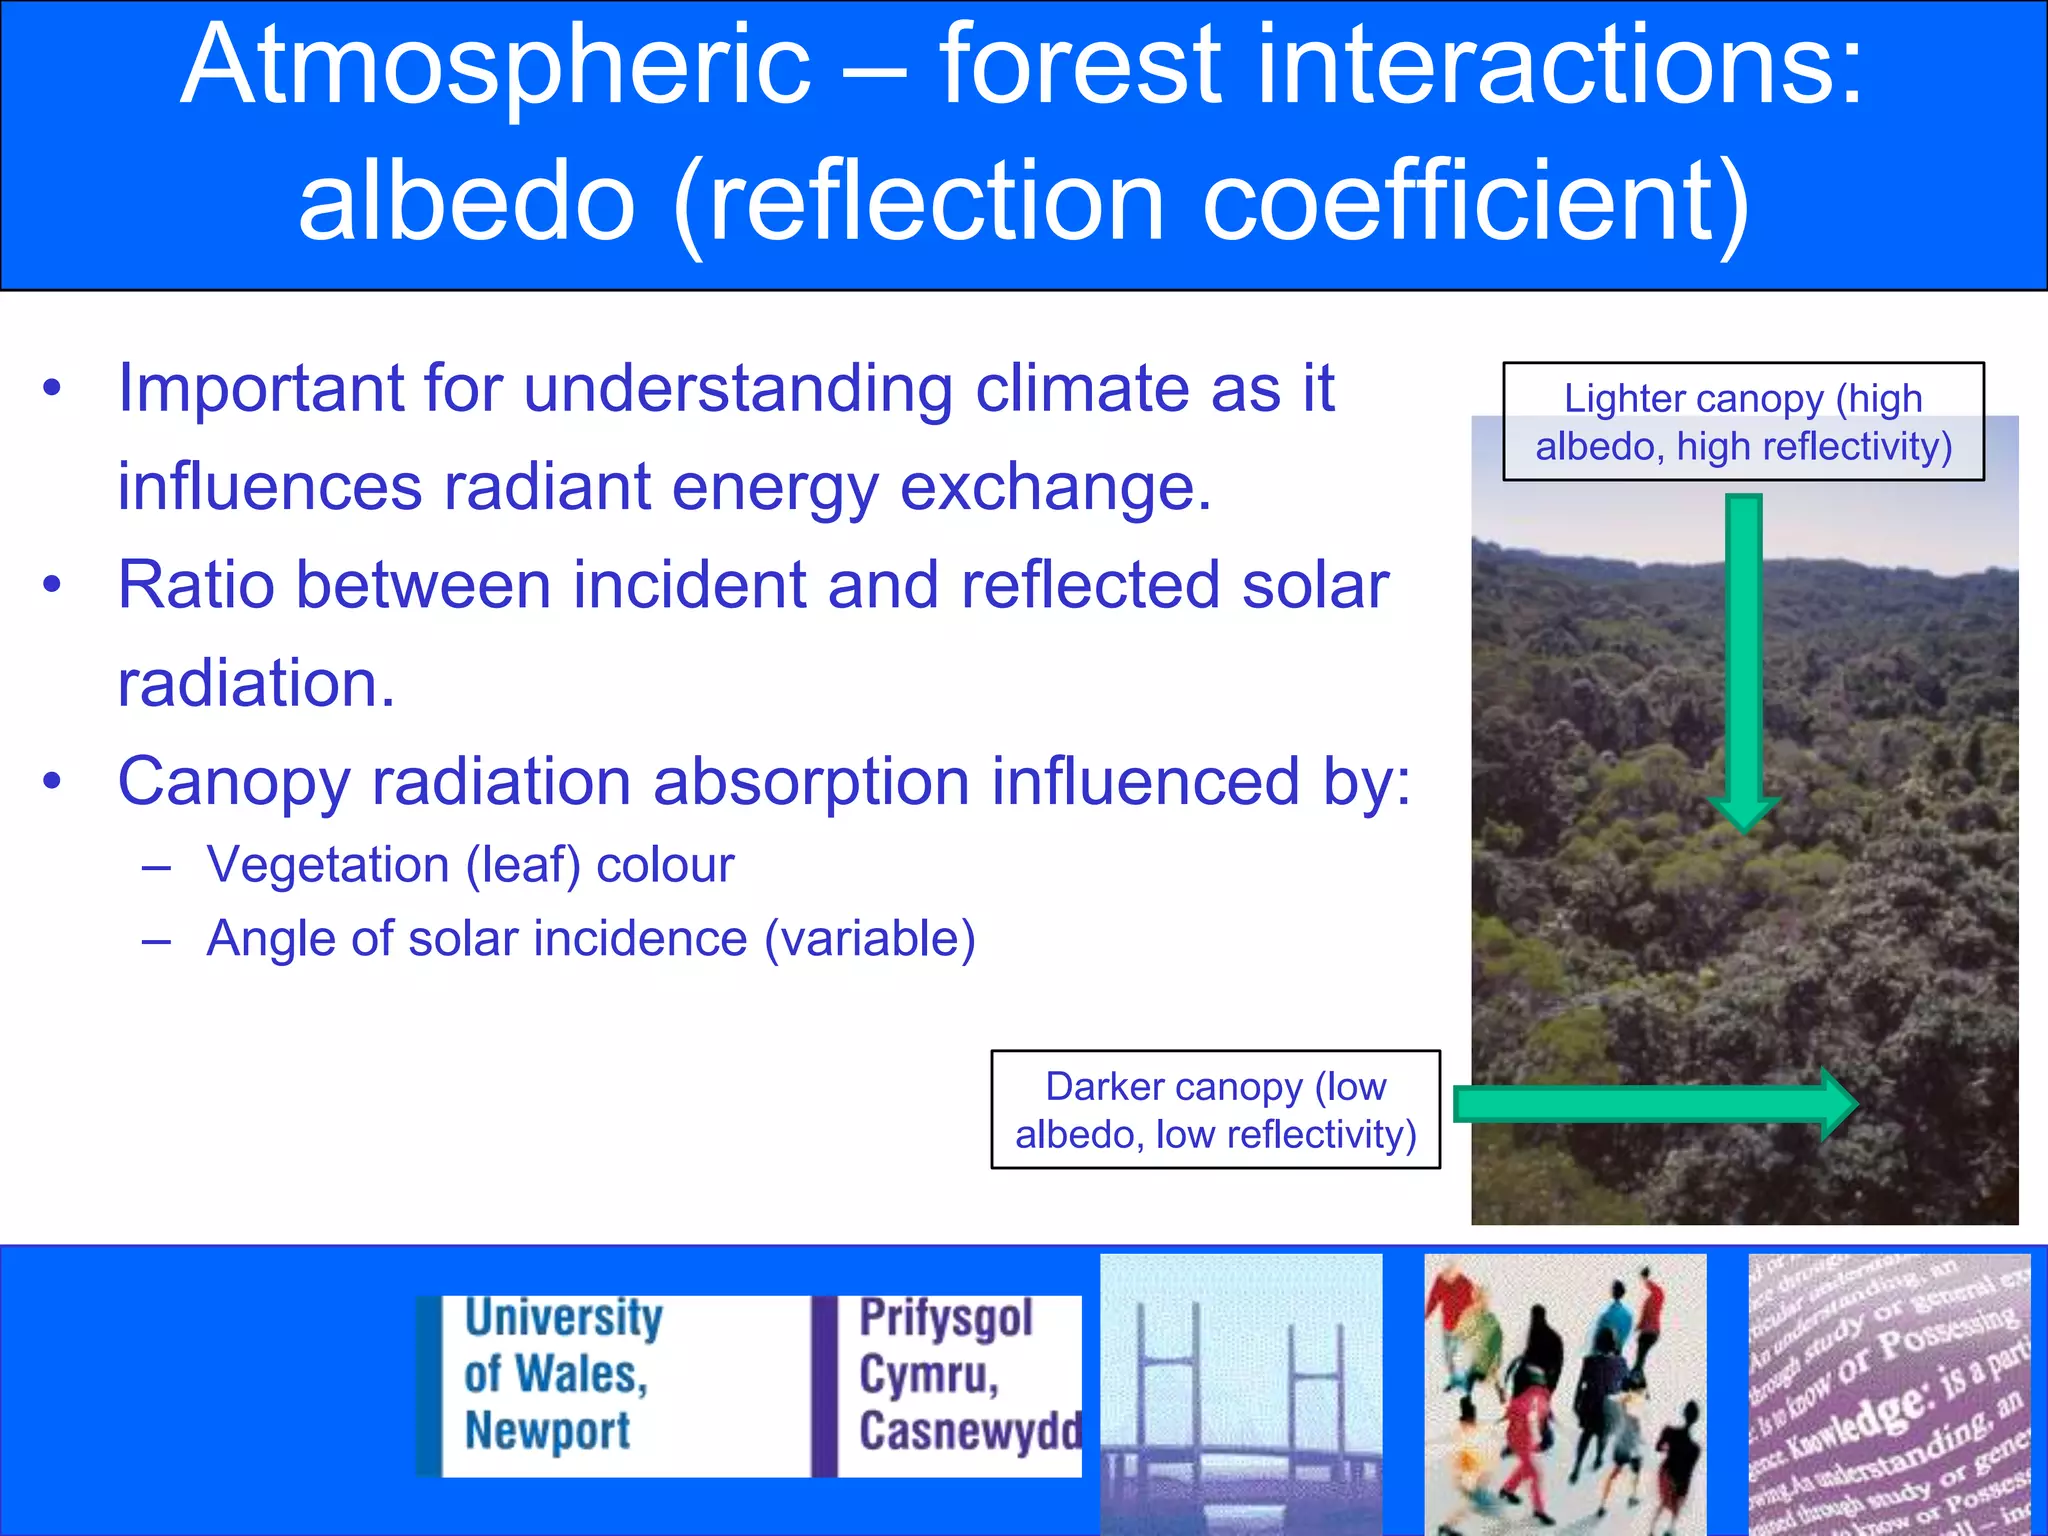
Tropical Forests and ClimateProfessor Simon K. HaslettCentre for Excellence in Learning and TeachingSimon.haslett@newport.ac.uk23rd February 2010
IntroductionForests influence exchanges of energy, mass and momentum through structure, morphology and physiology.Especially tropical moist forests, because:High leaf-area indexHigh evapotranspirationHigh roughness lengthsIn this presentation, the physical 	relationships a forest has with the	atmosphere are examined.Wet tropics, Queensland, Australia
Atmospheric – forest interactions: albedo (reflection coefficient)Important for understanding climate as it influences radiant energy exchange.Ratio between incident and reflected solar 	radiation.Canopy radiation absorption influenced by:Vegetation (leaf) colourAngle of solar incidence (variable)Lighter canopy (high albedo, high reflectivity)Darker canopy (low albedo, low reflectivity)
Atmospheric – forest interactions: albedo (reflection coefficient)Radiation penetration, radiation trapping and shading is influenced by:Leaf radiative properties (e.g. thickness)Vegetation heightVegetation structureGreater height and complexity, less penetration but more trapping.Hence, dark and humid forest floors in the tropics.
Atmospheric – forest interactions: albedo (reflection coefficient)Tropical forests have low albedos, 0.11-0.13.Deforested surfaces have high albedos, 0.17-0.25 (crops = 0.17, soil = 0.24, grass = 0.25).Deforested surface exchanges less energy.Reflected energy warms atmosphere.Cloud structure changes (cumulus         cirrus (lower albedo)), enhances greenhouse effect.
Atmospheric – forest interactions: roughness lengthRoughness length is the height above the surface at which the forest canopy has an effect on the horizontal airflow around its edges.Planetary boundary-layer airflowMore protrusions, higher roughness.Notice the roughness of the canopy.
Atmospheric – forest interactions: roughness lengthGreater roughness increases heat transfer from surface to atmosphere.Increased turbulence, particle momentum and energy exchange.Tropical forests are relatively rough and porous.Deforestation decreases energy flux between surface and atmosphere.Therefore, higher surface temperatures.
Atmospheric – forest interactions: energy partitioningAbsorbed energy is partitioned into various heat fluxes.Partitioning represented by the Bowen ratio.High Bowen ratios = decrease in evapotranspiration.Less latent heat available to cause phase change of water to vapour.Evapotranspiration operates via:Plant stomataVegetation surfaces – interception loss (12.5%)Ground surfacesEvaporate 50% rainfall
Atmospheric – forest interactions: energy partitioning70% of absorbed energy drives evapotranspiration.Deforestation increases albedo which reduces surface energy absorption.Therefore, less energy available for partitioning.Reduction in transpiration.Reduced interception loss.Soil moisture becomes important (but soil ceases to evaporate once top 5-20cm is dry).Run-off will increase, removing water from the system.Deforestation decreases evaporation by <30%.Results in higher surface temperatures.
Atmospheric – forest interactions: precipitation effectsEvapotranspiration influences precipitation e.g. 47% of Amazon rainfall is recycled via evapotranspiration.More evapotranspiration, more precipitation.Deforestation may:Increase surface run-off.Reduce evapotranspiration.Reduce atmospheric water vapour.Reduce cloud cover      	   less precipitation.Reduce total system water.Increase radiation receipt.
Atmospheric – forest interactions: precipitation effectsVertical motion in the atmosphere may also be important.High roughness lengths decrease wind speed.Force air masses to rise.Air masses rise, cool, condense, rain.Deforestation reduces roughness length and vertical motion.Wind remains cooler than surrounding air, does not rise.
Modelling deforestation and climate changeModels assume forest removal is instantaneous and complete (but in reality is often gradual and fragmentary).Models assume no regrowth of forests (might offset some impacts of deforestation).All general circulation models (GCMs) appear to agree that climate will undergo an increase in temperature and a decrease in rainfall.All GCMs are regional, not global.
ExerciseCarefully examine Table 1, based on the figures in Houghton et al. (1996), and calculate the annual flux of carbon sourced from deforestation.Table 2 gives data concerning both carbon sequestration through tropical forestation between 1995-2050 (Brown et al., 1996), and global anthropogenic emissions for the same period (Houghton et al., 1996). Using these data:Calculate the sequestered carbon for the years given both for each region and in totalPlot your results on graph paperCalculate the cumulative total of anthropogenic carbon emissions through 1995-2050Calculate the % of anthropogenic carbon emissions offset by forest carbon sequestrationTable 1. Perturbations to the carbon budget
Table 2
Table 2 answers
SummaryTropical moist forests have a particularly important interactive relationship with the atmosphere.Forest albedo is an important contributor to climate change.Tropical forests have low albedos, deforested surfaces have high albedos.Roughness length determines atmosphere-canopy exchange of any radiation that is locked within the rainforest.Most of the energy that is absorbed by a forest is used to drive evapotranspiration.Deforestation reduces the energy available for partitioning.Less evapotranspiration, less precipitation.Important ecosystem to understand when studying climate.
Further ReadingBrown, S., Sathaye, J., Cannell, M.G.R. and Kauppi, P. ‘Management of forests for mitigation of greenhouse gas emissions’. In: Watson, R.T., Zinyowera, M.C., Moss, R.H. and Dokken, D.J. eds. Climate Change 1995. Impacts, Adaptations and Mitigation of Climate Change: Scientific-Technical Analyses, contribution of Working Group II to the Second Assessment Report of the IPCC, Cambridge University Press, Cambridge, 1996, pp. 773-797.Cannell, M.G.R. 1999. Forests, Kyoto and climate. Outlook on Agriculture, 28: 171-177.Houghton, J.T., MeiroFilho, L.G., Callander, B.A., Harris, N., Kattenberg, A. and Maskell, K. ‘Climate change 1995. The science of climate change’, contribution of Working Group I to the Second Assessment Report of the Intergovernmental Panel on Climate Change, Cambridge University Press, Cambridge, 1996.O’Brien, K.L. 1996. Tropical deforestation and climate change. Progress in Physical Geography, 20(3): 311-335.Pickering, K.T. & Owen, L.A. 1997. An Introduction to Global Environmental Issues (2nd Edition).Routledge, 512pp. (pp. 129-138, 353-355).
This resource was created by the University of Wales, Newport and released as an open educational resource through the 'C-change in GEES' project exploring the open licensing of climate change and sustainability resources in the Geography, Earth and Environmental Sciences.  The C-change in GEES project was funded by HEFCE as part of the JISC/HE Academy UKOER programme and coordinated by the GEES Subject Centre. 	This resource is licensed under the terms of the Attribution-Non-Commercial-Share Alike 2.0 UK: England & Wales  license (http://creativecommons.org/licenses/by-nc-sa/2.0/uk/). 	All images courtesy of Professor Simon Haslett. However the resource, where specified below, contains other 3rd party materials under their own licenses. The licenses and attributions are outlined below:The name of the University of Wales, Newport and its logos are unregistered trade marks of the University. The University reserves all rights to these items beyond their inclusion in these CC resources.  The JISC logo, the C-change logo and the logo of the Higher Education Academy Subject Centre for the Geography, Earth and Environmental Sciences are licensed under  the terms of the Creative Commons Attribution -non-commercial-No Derivative Works 2.0 UK England & Wales license.  All reproductions must comply with the terms of that license.

Tropical forests and climate

  • 1.
    Tropical Forests andClimateProfessor Simon K. HaslettCentre for Excellence in Learning and TeachingSimon.haslett@newport.ac.uk23rd February 2010
  • 2.
    IntroductionForests influence exchangesof energy, mass and momentum through structure, morphology and physiology.Especially tropical moist forests, because:High leaf-area indexHigh evapotranspirationHigh roughness lengthsIn this presentation, the physical relationships a forest has with the atmosphere are examined.Wet tropics, Queensland, Australia
  • 3.
    Atmospheric – forestinteractions: albedo (reflection coefficient)Important for understanding climate as it influences radiant energy exchange.Ratio between incident and reflected solar radiation.Canopy radiation absorption influenced by:Vegetation (leaf) colourAngle of solar incidence (variable)Lighter canopy (high albedo, high reflectivity)Darker canopy (low albedo, low reflectivity)
  • 4.
    Atmospheric – forestinteractions: albedo (reflection coefficient)Radiation penetration, radiation trapping and shading is influenced by:Leaf radiative properties (e.g. thickness)Vegetation heightVegetation structureGreater height and complexity, less penetration but more trapping.Hence, dark and humid forest floors in the tropics.
  • 5.
    Atmospheric – forestinteractions: albedo (reflection coefficient)Tropical forests have low albedos, 0.11-0.13.Deforested surfaces have high albedos, 0.17-0.25 (crops = 0.17, soil = 0.24, grass = 0.25).Deforested surface exchanges less energy.Reflected energy warms atmosphere.Cloud structure changes (cumulus cirrus (lower albedo)), enhances greenhouse effect.
  • 6.
    Atmospheric – forestinteractions: roughness lengthRoughness length is the height above the surface at which the forest canopy has an effect on the horizontal airflow around its edges.Planetary boundary-layer airflowMore protrusions, higher roughness.Notice the roughness of the canopy.
  • 7.
    Atmospheric – forestinteractions: roughness lengthGreater roughness increases heat transfer from surface to atmosphere.Increased turbulence, particle momentum and energy exchange.Tropical forests are relatively rough and porous.Deforestation decreases energy flux between surface and atmosphere.Therefore, higher surface temperatures.
  • 8.
    Atmospheric – forestinteractions: energy partitioningAbsorbed energy is partitioned into various heat fluxes.Partitioning represented by the Bowen ratio.High Bowen ratios = decrease in evapotranspiration.Less latent heat available to cause phase change of water to vapour.Evapotranspiration operates via:Plant stomataVegetation surfaces – interception loss (12.5%)Ground surfacesEvaporate 50% rainfall
  • 9.
    Atmospheric – forestinteractions: energy partitioning70% of absorbed energy drives evapotranspiration.Deforestation increases albedo which reduces surface energy absorption.Therefore, less energy available for partitioning.Reduction in transpiration.Reduced interception loss.Soil moisture becomes important (but soil ceases to evaporate once top 5-20cm is dry).Run-off will increase, removing water from the system.Deforestation decreases evaporation by <30%.Results in higher surface temperatures.
  • 10.
    Atmospheric – forestinteractions: precipitation effectsEvapotranspiration influences precipitation e.g. 47% of Amazon rainfall is recycled via evapotranspiration.More evapotranspiration, more precipitation.Deforestation may:Increase surface run-off.Reduce evapotranspiration.Reduce atmospheric water vapour.Reduce cloud cover less precipitation.Reduce total system water.Increase radiation receipt.
  • 11.
    Atmospheric – forestinteractions: precipitation effectsVertical motion in the atmosphere may also be important.High roughness lengths decrease wind speed.Force air masses to rise.Air masses rise, cool, condense, rain.Deforestation reduces roughness length and vertical motion.Wind remains cooler than surrounding air, does not rise.
  • 12.
    Modelling deforestation andclimate changeModels assume forest removal is instantaneous and complete (but in reality is often gradual and fragmentary).Models assume no regrowth of forests (might offset some impacts of deforestation).All general circulation models (GCMs) appear to agree that climate will undergo an increase in temperature and a decrease in rainfall.All GCMs are regional, not global.
  • 13.
    ExerciseCarefully examine Table1, based on the figures in Houghton et al. (1996), and calculate the annual flux of carbon sourced from deforestation.Table 2 gives data concerning both carbon sequestration through tropical forestation between 1995-2050 (Brown et al., 1996), and global anthropogenic emissions for the same period (Houghton et al., 1996). Using these data:Calculate the sequestered carbon for the years given both for each region and in totalPlot your results on graph paperCalculate the cumulative total of anthropogenic carbon emissions through 1995-2050Calculate the % of anthropogenic carbon emissions offset by forest carbon sequestrationTable 1. Perturbations to the carbon budget
  • 14.
  • 15.
  • 16.
    SummaryTropical moist forestshave a particularly important interactive relationship with the atmosphere.Forest albedo is an important contributor to climate change.Tropical forests have low albedos, deforested surfaces have high albedos.Roughness length determines atmosphere-canopy exchange of any radiation that is locked within the rainforest.Most of the energy that is absorbed by a forest is used to drive evapotranspiration.Deforestation reduces the energy available for partitioning.Less evapotranspiration, less precipitation.Important ecosystem to understand when studying climate.
  • 17.
    Further ReadingBrown, S.,Sathaye, J., Cannell, M.G.R. and Kauppi, P. ‘Management of forests for mitigation of greenhouse gas emissions’. In: Watson, R.T., Zinyowera, M.C., Moss, R.H. and Dokken, D.J. eds. Climate Change 1995. Impacts, Adaptations and Mitigation of Climate Change: Scientific-Technical Analyses, contribution of Working Group II to the Second Assessment Report of the IPCC, Cambridge University Press, Cambridge, 1996, pp. 773-797.Cannell, M.G.R. 1999. Forests, Kyoto and climate. Outlook on Agriculture, 28: 171-177.Houghton, J.T., MeiroFilho, L.G., Callander, B.A., Harris, N., Kattenberg, A. and Maskell, K. ‘Climate change 1995. The science of climate change’, contribution of Working Group I to the Second Assessment Report of the Intergovernmental Panel on Climate Change, Cambridge University Press, Cambridge, 1996.O’Brien, K.L. 1996. Tropical deforestation and climate change. Progress in Physical Geography, 20(3): 311-335.Pickering, K.T. & Owen, L.A. 1997. An Introduction to Global Environmental Issues (2nd Edition).Routledge, 512pp. (pp. 129-138, 353-355).
  • 18.
    This resource wascreated by the University of Wales, Newport and released as an open educational resource through the 'C-change in GEES' project exploring the open licensing of climate change and sustainability resources in the Geography, Earth and Environmental Sciences. The C-change in GEES project was funded by HEFCE as part of the JISC/HE Academy UKOER programme and coordinated by the GEES Subject Centre. This resource is licensed under the terms of the Attribution-Non-Commercial-Share Alike 2.0 UK: England & Wales license (http://creativecommons.org/licenses/by-nc-sa/2.0/uk/). All images courtesy of Professor Simon Haslett. However the resource, where specified below, contains other 3rd party materials under their own licenses. The licenses and attributions are outlined below:The name of the University of Wales, Newport and its logos are unregistered trade marks of the University. The University reserves all rights to these items beyond their inclusion in these CC resources. The JISC logo, the C-change logo and the logo of the Higher Education Academy Subject Centre for the Geography, Earth and Environmental Sciences are licensed under the terms of the Creative Commons Attribution -non-commercial-No Derivative Works 2.0 UK England & Wales license. All reproductions must comply with the terms of that license.

Editor's Notes

  • #4 Incidence with which the sun’s rays hit the earth’s surfaceAlbedo – surface reflectivity
  • #5 Fragmented penetration = ‘light climates’
  • #9 Evapotranspiration is the sum of evaporation and plant transpiration from the Earth’s land surface to the atmosphere.Interception loss – water evaporates directly back into atmosphere.
  • #11 Less litter, stems and trunks to slow water running away. Normally trap precipitation which then percolates to groundwater systems, so water that is usually recycled is lost in run-off. Transpired water comes from the roots!