Download as PDF, PPTX


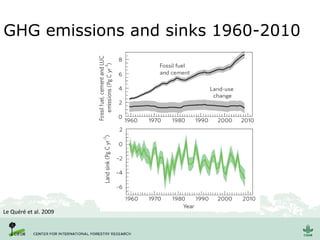
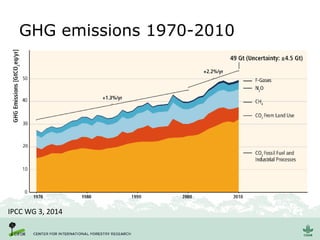
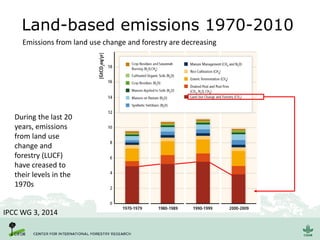
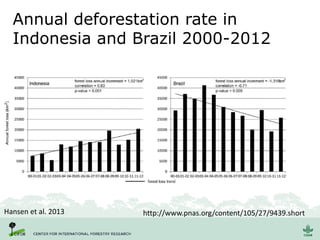
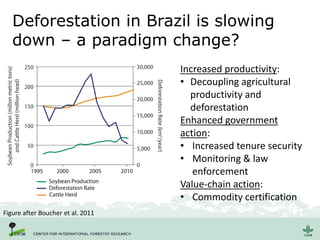
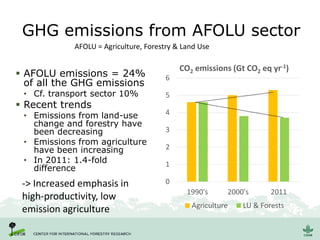
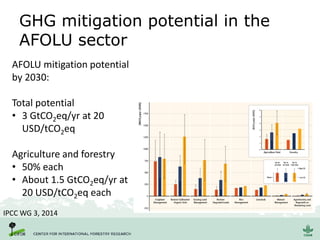
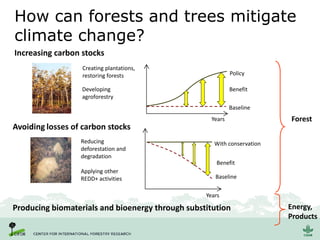
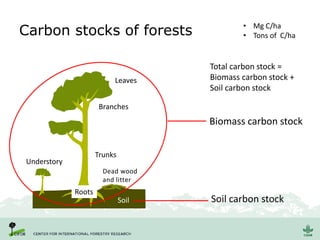
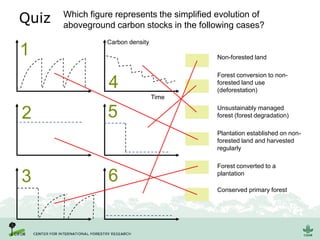

The document discusses greenhouse gas emissions and mitigation strategies in relation to land use, land use change, and forestry (LULCF) from 1960 to 2010, highlighting trends in emissions and the significant role of agriculture and forestry in carbon sequestration. It emphasizes the potential for emissions reduction through improved agricultural productivity, enhanced government policies, and forest conservation practices. The paper also outlines the importance of maintaining carbon stock and ecosystem resilience to combat climate change.