Weather versus Climate
andthen there is
CLIMATE CHANGE:
A change in average weather and local extremes
for an extended period of time
6.
Sunday, April 13,2025 6
Greenhouse gases (Gaasaska Dhulka Diiriya)
Greenhouse gases are a natural part of the Earth’s atmosphere, and include
carbon dioxide, methane, nitrous oxide, and water vapour (uumiga biyaha).
They are also produced by human activities like burning fossil fuels like
oil, gas, and charcoal, agriculture, melting mountain ice, chemical
products, and deforestation. The most common greenhouse gas is carbon
dioxide
7.
Sunday, April 13,2025 7
Warming of Africa over the past 120 years. Shades of blue
represent cooler years and red, warmer years. The overall
effect is a striking trend toward hotter temperatures in recent
decades, as a result of human-caused climate change.
8.
Origin and effectsof global warming
use of fossil fuels (oil, coal, gas)
rising concentrations of
greenhouse gas
rising temperatures (global warming)
changes in local weather
extremes
changes in local
average climate
9.
Sunday, April 13,2025 9
East Africa is warming faster than the global
average
Major cities in East Africa have witnessed an increase in temperatures
that almost double the 1.1°C warming that the globe has experienced
since pre-industrial times.
Since 1860, Addis Ababa (Ethiopia) has warmed by 2.2°C, Khartoum (Sudan)
by 2.09°C, Dar es Salaam (Tanzania) by 1.9°C, Mogadishu (Somalia) by
1.9°C, Nairobi (Kenya) by 1.9°C, Jigjiga (Ethiopia) by 2.1°C…etc (East
Africa Hazards Watch, 2023).
Sunday, April 13,2025 15
What causes climate change (Sababta)?
• NATURAL SHIFTS IN CLIMATE
The Earth’s climate has warmed and cooled many times during the
planet’s history. Scientists believe around a dozen ‘Ice Ages’ have
occurred in the past 500 million years, perhaps triggered by shifts in
ocean currents.
16.
Sunday, April 13,2025 16
• Human Activities
It is now indisputable that human activities are behind the
cause of the current changes that we are experiencing in the
world climate, making extreme climate events, including
heatwaves, heavy rainfall, and droughts, more frequent and
severe.
17.
Sunday, April 13,2025 17
Climate Change – Mitigation (Yaraynta Saamaynta)
• Mitigation refers to efforts to reduce or prevent the emissions of greenhouse gases
like carbon dioxide and methane. There are two ways of doing this:
• Reducing the amount of greenhouse gas entering the atmosphere by for instance reducing
our reliance on fossil fuels for electricity, transport, and heating or by improving buildings
to make them more energy efficient; adopting renewable energy sources like solar, wind and
small hydro; helping cities develop more sustainable transport, electric vehicles, and
biofuels; and promoting more sustainable uses of land and forests.
• Removing greenhouse gases from the atmosphere, by storing them in carbon ‘sinks’ like
forests and mangrove swamps, or turning these gases into a substance that can be buried.
18.
Sunday, April 13,2025 18
Green vs Renewable energy
Renewable energy comes from sources that are constantly
replenished. Some renewable energy sources – solar, wind,
geothermal, and hydropower - do not give off carbon
emissions, and are known as ‘green energy’ sources. Other
renewable sources, such as burning wood from sustainable
forests, do give off carbon emissions.
19.
Sunday, April 13,2025 19
Sustainable energy
• A sustainable resource is a resource that meets the needs of the present
generations without compromising the ability of future generations to
meet their own needs. Sustainable energy is about finding clean
renewable sources of energy—sources that renew themselves, rather
than sources that can be depleted.
20.
Sunday, April 13,2025 20
Carbon sequestration (Nuugida Kaarbon)
• Carbon ‘sequestration’ means capturing and storing carbon dioxide from the
atmosphere.
• It can be achieved naturally through the creation or protection of carbon
sinks like forests and mangrove swamps, or through land management
techniques like ‘agro-forestry’, where trees and shrubs are grown alongside
crops, and continue growing and absorbing CO2 between harvests. Other
natural carbon sinks include the ocean, mangroves, wetlands, savannahs,
peatland, and inland rivers and lakes with their rich vegetation.
Today –
Relating TropicalForests and Climate Change
• What is climate?
• What controls climate?
• How has climate changed?
• How do forests affect climate?
• What controls forest cover?
• How has forest cover changed?
23.
CO2
Albedo CO2 andthe carbon cycle
Evapotranspiration Aerosols
Not Volcanoes,
but forest fires
Four Ways that Forests Affect Climate
24.
1700 1800 19002000
Biggest effect:
CO2 and the carbon cycle
Albedo
Evapotranspiration
Aerosols
Role of Forests in the Global Carbon Cycle
25.
Carbon Cycle
The movementof carbon
through the atmosphere, the oceans,
the earth’s surface and living things
26.
Carbon Cycle
Fast cycle(small darker arrows)
10s-100s of years
Slow cycle (large light arrows)
millions of years
The Carbon Cycle
•Vegetation
• Atmosphere
• Oceans
• Soil
• Fossil fuels
Big
Big (active)
Twice as big
Big
Very big
Reservoirs
32.
Twice as big
TheCarbon Cycle
• Vegetation
• Atmosphere
• Oceans
• Soil
• Fossil fuels
Big
Big (active)
Big Reservoirs
Huge
(inactive deep
oceans)
Very big
33.
Pair work: Turnto your neighbor and discuss
• Estimate how much (what fraction) of each reservoir moves
into the other each year.
• Reminder: There may be more than one pathway connecting
reservoirs.
Classroom Activity
Fate of AnthropogenicCO2 Emissions
8.3±0.4 PgC/yr
+ 28%
46%
26%
Atmospheric growth
Fossil fuels and cement
Land-use change
Land sink
Ocean sink
90%
1.0±0.5 PgC/yr 10%
2.5±0.5 PgC/yr
Source: Le Quéré et al. 2012; Global Carbon Project 2012
2.6±0.8 PgC/yr
4.3±0.1 PgC/yr
40.
Effect of AnthropogenicFluxes
http://www.youtube.com/watch?v=SXHDwdd7Tf8
Small anthropogenic fluxes (about 10 Gt
per year) add up to big changes in the
atmospheric carbon pool
41.
Deep waters Marinesediments
vegetation atmosphere surface oceans soils
0
200
400
600
800
1000
1200
1400
1600
Forests
Tropical
Forests 50% of vegetation pool
50% of forest
pool
Gt
(Pg)
C
Carbon Reservoirs & Forest Pool
42.
Atmosphere
Carbon pools
fluxes
Biosphere FossilFuels Oceans
8-9 Gt
1-1.5 Gt
Photosynthesis/respiration
Combustion
Diffusion
Biomass Burning Happens in Forests, Especially
with Land Use Change in the Tropics
43.
Carbon Fluxes Criticalto Climate Mitigation
• Photosynthesis
• Respiration
• Decomposition
• Combustion
• Diffusion This is the basis of REDD+:
Maintain and expand forests
so they continue to absorb carbon
Photosynthesis: the
only real, large,
viable pathway
OUT of the
atmosphere that
humans can control
44.
•Reducing emissions fromdeforestation, forest
degradation, conservation of forests, sustainable
forest management and enhancement of forest
carbon stocks
REDD+
45.
Carbon Fluxes Criticalto Climate Mitigation
• Photosynthesis
• Respiration
• Decomposition
• Combustion
• Diffusion
Combustion- Critical
flux INTO the
atmosphere humans
can control
46.
Processes Controlling theMajor Fluxes of Carbon
• Photosynthesis
• Respiration
• Decomposition
• Combustion
• Diffusion
Critical flux INTO the
atmosphere humans
can control
Also the basis of REDD+
Avoid deforestation and release of carbon
47.
Forests are anImportant Sink for Natural & Anthropogenic Emissions
+ 1/4
1/2
1/4
48.
Forest Have AlwaysAffected Climate
How do forests affect climate?
What controls forest cover?
How has forest cover changed?
49.
Forests Impact theGlobal Carbon Cycle
How do forests affect climate?
What controls forest cover?
How has forest cover changed?
1. Forests impact the global carbon cycle
Forests are half of global vegetation pool
Tropical forests are ¼ of global vegetation
pool
Large natural flux and critical carbon sink
Small, but important anthropogenic flux
CO2
Forests and the
carbon cycle
50.
Forests Impact theGlobal Carbon Cycle
How do forests affect climate?
What controls forest cover?
How has forest cover changed?
Q: How does forest cover affect the
reflectance of incoming solar radiation?
CO2
Forests and the
carbon cycle
Albedo
51.
Albedo
How doforests affect climate?
What controls forest cover?
How has forest cover changed?
Forests (dark color) absorb
sunlight energy
52.
Albedo
How doforests affect climate?
What controls forest cover?
How has forest cover changed?
Cropland and pasture (light color) reflect
sunlight energy
53.
Albedo
How doforests affect climate?
What controls forest cover?
How has forest cover changed?
Deforestation increases albedo
54.
How doforests affect climate?
What controls forest cover?
How has forest cover changed?
2. Forests have a low albedo
This is a warming effect
Land use change in forests increases albedo
(produces a cooling effect)
CO2
Forests and the
carbon cycle
Albedo
Forests Impact the Global Carbon Cycle
55.
How doforests affect climate?
What controls forest cover?
How has forest cover changed?
Q: How does forest cover effect
evapotranspiration?
CO2
Forests Impact the Global Carbon Cycle
Evapotranspiration
56.
Evapotranspiration
• Water movesfrom
moist to dry conditions
(from soil to
atmosphere)
• Evaporation from bare
surface
• Transpiration through
plants
How doforests affect climate?
What controls forest cover?
How has forest cover changed?
3. Evapotranspiration is high in forests
Results in a cooling effect
Enhances local-regional rainfall
CO2
Forests and the carbon cycle
Albedo
Forests Impact the Global Carbon Cycle
Evapotranspiration
60.
How doforests affect climate?
What controls forest cover?
How has forest cover changed?
Q: How does forest cover affect
atmospheric aerosols?
CO2
Forests and the carbon cycle
Albedo
Forests Impact the Global Carbon Cycle
Aerosols
Evapotranspiration
61.
Aerosols
Aerosols are producedby forests via two pathways:
• Volatile organic compounds (VOC) are a natural byproduct of tree
metabolism
• Biomass burning releases VOC, smoke and soot
62.
Aerosols
• Critical tocloud formation
• Affect amount of incoming solar radiation
• Affect rainfall
• Alter chemistry of the atmosphere
63.
How doforests affect climate?
What controls forest cover?
How has forest cover changed?
4. Forests produce aerosols
Complex net effect: cooling?
CO2
Forests and the carbon cycle
Albedo
Forests Impact the Global Carbon Cycle
Aerosols
Evapotranspiration
64.
How doforests affect climate?
What controls forest cover?
How has forest cover changed?
Climate
Humans
Forests Impact the Global Carbon Cycle
Humans Cut andUse Forests
altering stand structure and forest cover on the landscape
68.
How doforests affect climate?
What controls forest cover?
How has forest cover changed?
Past 8000 years
Past 150 years
Past 40 years
Forests Impact the Global Carbon Cycle
Climate change andforests: impacts (short term)
• CO2 fertilization
• Higher temperature
(inc. growth rate)
• Nitrogen mineralization
• Longer growing season
• Range expansion
• Size/severity of forest fires, wind
damage, floods
• Rate/severity/range of native
insect and disease impacts
• Invasive species
• Feedbacks
Increased productivity Increased disturbance
74.
Current
IPCC 1995, GFDL+ MAPSS models
Temperate grasses
Grasslands
Deserts
Savanna
Tropical seasonal forests
Tropical moist forest
Wetland, mangrove etc
Agricultural land
Ice
Tundra
Boreal forests
2 x CO2
Climate change
Restricted distributions, esp. northern hemisphere
Climate change and forests: impacts (long term)
75.
• Forests andforestry cannot solve the problem of fossil C emissions, but
they can contribute to the solution
• Reduced deforestation, increased afforestation could more than offset
global carbon emissions from the transportation sector (Stern 2006)
Forests and mitigation
76.
Forests and mitigation:management options
• Maintain (or increase) forest area
• Reduce deforestation, increase afforestation
• Increase stand-level carbon density
• Partial harvest systems, reduce residue burning,
reduce regeneration delays, species selection
• Increase landscape-level carbon density
• Lengthen rotations, inc. conservation areas, protect
against disturbance
• Increase stored C in wood products, reduce
fossil C emissions through product substitution
and bioenergy
• Longer-lived products, recycling, biofuels, salvage
77.
Forests and adaptation
•Continued warming
even with emissions
held at 2000 levels
• Impacts greatest at
higher latitudes
• Increasing need for
adaptation to
accompany mitigation
efforts
From IPCC AR4 WG1 20
1st
assessment report
2nd
assessment report
3rd
assessment report
Observed
Constant from 2000
Emissions scenarios
Adaptation = adjustments in ecological, social, and economic systems in
response to the effects of climate change. (Smit et al. 2000)
78.
Forests and adaptation
•Technological
(e.g. assisted migrations, increased resilience)
• Behavioral
(e.g. altered ecosystem service requirements)
• Managerial
(e.g. altered forest practices)
• Policy
(e.g. planning regulations)
“…more extensive adaptation than is currently occurring is required to
reduce vulnerability to future climate change. There are barriers, limits
and costs, but these are not fully understood.” (IPCC AR4 WG2 2007)
A portfolio of adaptation and mitigation measures can diminish
the risks associated with climate change.
Opportunities?
#2 The Red Cross Red Crescent Climate Centre was established in 2002. We are the reference centre to the whole Red Cross Red Crescent Movement on assisting our colleagues understand and address the humanitarian implications of climate change and extreme weather events.
#3 The Red Cross Red Crescent Climate Centre was established in 2002. We are the reference centre to the whole Red Cross Red Crescent Movement on assisting our colleagues understand and address the humanitarian implications of climate change and extreme weather events.
#4 There is often confusion between weather and climate.
Weather refers to short term conditions like rain, temperature and wind over hours to days. For example the weather outside is sunny, windy, cloudy, rainy etc. [If presenting this to younger children, ask them to tell you what the weather is today.]
Climate refers to average weather conditions over a long period of time (30+ years). By monitoring the patterns in the weather over a long period of time, we can expect certain conditions to occur at different times of the year. For example: the rainy season is in Dec-Feb, or Indonesia has a tropical climate.
Climate change refers to a change in average weather and local extremes (or the state of the climate) that persists for an extended period of time (decades) for example temperatures are rising over time, the wet and dry seasons start earlier or later and stop earlier or later than was normal decades ago.
A note about climate change:
Changes in climate can be due to natural causes.
However when we talk about the climate change that is occurring today, we are talking about ‘anthropogenic’ climate change. This means climate change that is caused by human activities, such as the burning of fossil fuels or land use changes, like cutting forests.
Source pictures NASA
#5 Just like a greenhouse used in cool climates to trap heat and grow vegetables in, naturally occurring gases in our atmosphere trap the sun’s heat – keeping the temperature on Earth just right for us to live. Without these gases the temperature of the Earth would be very chilly (about -19°C). These gases are therefore known as greenhouse gases.
These natural gases in our atmosphere, including carbon dioxide, prevent the earth from lsoing too much heat into space and act like an invisible blanket. They keep the temperature at a range that we can live in.
#8 The use of fossil fuels leads to a rise in greenhouse gas concentrations, which leads to an increase in global temperatures (top three boxes).
Global warming, caused by human activities does not only have a global impact like temperature rise. The increased heat brings increased energy in the weather leading to changes in the weather and climate at the local level too. Localised average climate may change to increase or decrease rainfall and increase the average temperature over time. Localised weather extremes may also change with some places likely to experience more heatwaves or more extreme rainfall events. In the second part of this presentation we will further look at these local changes.
Futher note to presenters:
Wherever possible, provide examples of real life events that participants can connect with. It helps if these are local examples.
It is important however, not to state that any one event is the result of climate change. See FAQs for more information.
#10 Climate change will likely lead to more and heavier rainfall in many places. Many of these events will in turn lead to more floods. Flooding can lead to people losing their homes, their food crops and their belongings, and injuries and even loss of life can result. After flooding, there is the possibility of disease outbreaks, because dirty water gets mixed with the water that people drink causing people to get sick from diarrhea. Also after flooding there may be problems with for example malaria, spread by mosquitoes. Not only heavy rainfall but also shifting rainy seasons are likely to occur. These will have large impacts on agriculture and can lead to failed harvests.
#11 People all around the world depend on the weather for food – when it rains our food grows. Some areas are experiencing more severe droughts which reduces the amount of food that can be produced. In some areas where water is in short supply there can be disagreements over who should have access to the water that is available.
When people have less water, they may not wash their hands after going to the toilet and before eating. This can lead to more illness such as diarrhoea.
Also, when people do not have enough food to eat they become weak and more easily sick.
Drought also increases the chances of bush- and forest fires, that may kill people and destroy livelihoods.
#12 Melting ice on land, which runs into the ocean is an additional factor that contributes significantly to sea level rise. Conversely, ice that melts in the sea doesn’t however contribute to sea level rise. (To see this for yourself you could try placing some ice in a glass of water and measure the water level on the glass. Measure the water level on the glass when the ice has melted – it should be the same!)
The Intergovernmental Panel on Climate Change says that sea levels may rise between 0.18 and 0.59 metres this century. However, based observations that some ice sheets and glaciers have been melting faster than first thought, some sources now predict that global sea level may rise up to 1 metre by 2100.
Sea-level rise will also merge with other factors such as environmental degradation and storm surges to create problems like erosion and coastal flooding for coastal communities.
Picture: what would happen without proper coastal protection in a low-lying area with a sea level rise of 1.3 metres.
#13 Climate change will bring more heatwaves. During heatwaves, if the nights remain warm, the human body can struggle as it is not able to cool itself. This is especially problematic for elderly people, those with chronic illness and very young children, who can suffer during these periods and even die from the heatwave.
After the summer of 2003 it became clear even in Europe that heatwaves are silent killers. The figures say it all: some 72,500 people in western Europe died. Most western societies were not prepared to deal with heatwaves including the public health system, voluntary social organizations and the housing and planning sectors.
The first and most straightforward implication of a warmer climate is that there will be more hot days and nights and more heatwaves. Of course, an extreme heatwave like 2003 remains an unusual event. However, the likelihood of such an extreme increases rapidly as the average temperature rises. Some estimates show the likelihood of such a heatwave has already doubled due to global warming.
By the 2040s, every other summer could well be as hot as the one of 2003, and according to some emission scenarios at the end of the twenty-first century a summer like 2003 might well be considered “cold”.
#14 Dengue fever is a disease that is passed by mosquitoes. Dengue produces a high fever and can result in death. There is no vaccine. We have already observe a significant increase in dengue around the world. Mosquitoes like these in the picture use small pools of water as their breeding ground, and for laying eggs. There is concern that climate change will bring more of the types of conditions that mosquitoes like to breed in.
Examples: hibernation of North American mosquitoes starts about nine days later than 30 years ago. That gives mosquitoes more time to transfer disease.
#22 KEY MESSAGES:
Reminder of previous lecture: The last lecture covered the first four topics listed.
Today’s lecture: Today’s lecture is going to focus on how forests affect climate, what factors control the amount and location of forests and how forest cover has changed over time
Photo Source:
Photo courtesy of Deborah Lawrence
#23 KEY MESSAGES:
Evapotranspiration is very important particularly at local to regional scales.
Notes:
In addition to the 4 climate drivers we have already discussed forests can influence climate through evapotranspiration: the movement of water from the soil to the atmosphere through the trees.
Image source:
Evaporation image source: http://en.wikipedia.org/wiki/Evapotranspiration
Fire image source: http://www.fire.uni-freiburg.de/GFMCnew/2013/07/25/indonesia_oli_2013176.jpg
Source of albedo image: NASA's Aqua satellite shows the state of Arctic sea ice on September 10 2008 Photo: REUTERS
Source of graphic of gh effect: Mann and Kump 2007
#24 KEY MESSAGES:
There are four ways that forests affect climate, but the biggest impact comes from the role forests play in the global carbon cycle. It is important to understand the carbon cycle and the role forests play in order to understand climate change.
Image Source:
Source of graphic of greenhouse effect: Mann, M.E. and L.R. Kump. 2008. Dire Predictions: Understanding global warming. The illustrated guide to the findings of the IPCC (Intergovernmental Panel on Climate Change). DK, Publishing, NY, NY. ISBN 978-0-7566-3995-2.
Fire image source: http://www.fire.uni-freiburg.de/GFMCnew/2013/07/25/indonesia_oli_2013176.jpg
Source of albedo image: NASA's Aqua satellite shows the state of Arctic sea ice on September 10 2008 Photo: REUTERS
Source of evapotranspiration image: Evaporation image source: http://en.wikipedia.org/wiki/Evapotranspiration
#25 KEY MESSAGES:
The carbon cycle describes the movement of carbon atoms through the atmosphere, the oceans, the biota (living things) and the earth’s surface (minerals or rocks). There are many paths connecting these components.
Image Source:
modified from: http://dataintheclassroom.noaa.gov/Documents/OA%20Level%202.pdf
#26 KEY MESSAGES:
As I said in the previous slide, there are many pathways connecting the cycle’s components and while the slow cycle gives an overview of a broad pattern occurring over millions of years, looking at the cycles on shorter time scales (decades to centuries) you can see more of the details and the multiple pathways between the atmosphere the biota etc.
Notes:
The slow cycle (over millions of years): carbon is taken from the atmosphere by plants and moves into the soil when the plant dies and decomposes. Then the carbon in the soil is washed into the ocean by erosion where it has a long residence time. Eventually through geologic uplift, the carbon in the ocean bottom is brought up to the land surface where it can once again be released to the atmosphere and the cycle begins again.
Image Source:
modified from: http://dataintheclassroom.noaa.gov/Documents/OA%20Level%202.pdf
#27 KEY MESSAGES:
The C cycle can be described by studying C stocks (or reservoirs, circles) and fluxes (lines showing transfers between reservoirs).
Notes:
Reservoirs or stocks are components that can store carbon for long periods and they include the atmosphere, the deep ocean, the ocean bed, forests, carbonate minerals and fossil fuel reserves (oil, coal and natural gas). Fluxes are another essential part of the carbon cycle (both the fast and slow cycles) and they represent the transfer from one reservoir to another. The rate of fluxes and the size of the reservoirs are both important to understanding the carbon cycle.
Image Source:
modified from: http://dataintheclassroom.noaa.gov/Documents/OA%20Level%202.pdf
#28 KEY MESSAGES:
This graph gives the sizes of some of the major carbon reservoirs on Earth. You can see that soils are a very important reservoir- twice the size of the atmosphere. Also a good chance to review units- a Gigaton is the same as a Petagram or 10^15 grams.
Image Source:
Graph created with data from: Schlesinger Biogeochemistry 1997 and 2013 editions.
Full citation for 2013 edition: Schlesinger, W.H. and E.S. Bernhardt. 2013. Biogeochemistry: An analysis of global change. 3rd Edition. Elsevier, Amsterdam.
#29 KEY MESSAGES:
- Fossil fuel reservoirs are almost 7 times larger than the soil reservoir.
Until the industrial age fossil fuels were not an active pool – pools are hard to estimate
Image Source:
Graph created with data from: Schlesinger Biogeochemistry 1997 and 2013 editions.
Full citation for 2013 edition: Schlesinger, W.H. and E.S. Bernhardt. 2013. Biogeochemistry: An analysis of global change. 3rd Edition. Elsevier, Amsterdam.
Fossil fuel data from Sudquist and Visser 2005 cited in Schlesinger & Bernhardt 2013
#30 KEY MESSAGES:
Deep oceans are the largest carbon reservoir and are not actively exchanging with the other reservoirs on the time scale of decades to centuries-
Image Source:
Graph created with data from: Schlesinger Biogeochemistry 1997 and 2013 editions.
Full citation for 2013 edition: Schlesinger, W.H. and E.S. Bernhardt. 2013. Biogeochemistry: An analysis of global change. 3rd Edition. Elsevier, Amsterdam.
#31 KEY MESSAGES:
In summary here are the carbon cycle reservoirs active on in the short term cycle and their relative sizes.
#32 KEY MESSAGES:
Deep oceans are a significant reservoir but as I said previously they are also very inactive and only exchange with the other reservoirs on much longer time scales ( 100’s of thousands of years)
#33 KEY MESSAGES:
Classroom activity to encourage students to actively learn!
Notes: You can assign specific pools to each pair of students and ask them to estimate how much (what fraction) of each reservoir moves into the other each year. There may be more than one pathway connecting reservoirs. When they are done discussing have the pairs come to the board and see if together the class can reconstruct the C cycle diagram based on their discussions
#34 KEY MESSAGES:
In addition to the reservoirs the carbon cycle is driven by the fluxes between reservoirs- each flux is driven by a different process. The processes in green are biological in nature, in red both natural and driven by human activities and in blue physical/ chemical
#35 KEY MESSAGES:
Here, remind students that because climate change is driven by changes in ATMOSPHERIC CO2, we focus on and are concerned about fluxes into or out of the atmosphere.
Brainstorming Question: What processes are controlling the accumulation of CO2 in the atmosphere?
#36 KEY MESSAGES:
Looking at just the annual fluxes between the atmosphere and the other reservoirs you can see that the largest fluxes are in balance (equal amounts going in and out of the atmosphere on an annual basis- for example the exchanges with the oceans and the biosphere).
Notes:
Data sources for the #s shown in this slide are missing. A similar graphic with different values for atmosphere-ocean fluxes and fossil fuel flux is at this link.
Reference:
http://eesc.columbia.edu/courses/ees/slides/climate/carbon_res_flux.gif. SkepticalScience.com provides a graphic (at the following link), which shows fluxes of similar magnitude (as the one in this slide) but lower flux for fossil fuels: http://upload.wikimedia.org/wikipedia/commons/thumb/8/82/Carbon_cycle-cute_diagram.svg/1000px-Carbon_cycle-cute_diagram.svg.png
#37 KEY MESSAGES:
These balanced fluxes are “natural” fluxes- note that in the absence of fossil fuel burning and land cover change (and burning) the carbon fluxes are close to balanced
Notes:
Data sources for the #s shown in this slide are missing. A similar graphic with different values for atmosphere-ocean fluxes and fossil fuel flux is at this link.
Reference:
http://eesc.columbia.edu/courses/ees/slides/climate/carbon_res_flux.gif. SkepticalScience.com provides a graphic (at the following link), which shows fluxes of similar magnitude (as the one in this slide) but lower flux for fossil fuels: http://upload.wikimedia.org/wikipedia/commons/thumb/8/82/Carbon_cycle-cute_diagram.svg/1000px-Carbon_cycle-cute_diagram.svg.png
#38 KEY MESSAGES:
Anthropogenic fluxes (those driven by human activities) are much smaller but important because they are not balanced by an equal flux out of the atmosphere the anthropogenic flux from the biosphere represents deforestation and biomass burning
Notes:
Data sources for the #s shown in this slide are missing. A similar graphic with different values for atmosphere-ocean fluxes and fossil fuel flux is at this link.
Reference:
http://eesc.columbia.edu/courses/ees/slides/climate/carbon_res_flux.gif. SkepticalScience.com provides a graphic (at the following link), which shows fluxes of similar magnitude (as the one in this slide) but lower flux for fossil fuels: http://upload.wikimedia.org/wikipedia/commons/thumb/8/82/Carbon_cycle-cute_diagram.svg/1000px-Carbon_cycle-cute_diagram.svg.png
#39 KEY MESSAGES:
Only about half of the flux attributed to human activity ends up in the atmosphere. Vegetation and the ocean take up the other half.
Land sink Calculated as the residual of all other flux components: atmospheric and ocean sinks can be measured (ie the Keeling curve we saw in the last lecture): So almost half of the carbon emitted each year from human activities ends up in the atmosphere. Increases in atmospheric CO2 would be much more rapid if oceans and vegetation on land were not taking up the other half of human emissions
Notes:
The #s shown in this slide are continually updated by The Global Carbon Project. The latest update (based on 2004-2013 averages) is available at this link:
Reference:
http://www.globalcarbonproject.org/carbonbudget/14/files/GCP_budget_2014_lowres_v1.02.pdf
Image Source:
Le Quéré et al. 2012; Global Carbon Project 2012
#40 KEY MESSAGES:
The embedded video shows the change in atmospheric CO2 over multiple time scales- the early part (1979- to present) is due to anthropogenic fluxes and you can compare their impact to other forces over the past several hundred thousand years of Earth’s history- If you are not going to have internet access in the classroom you might want to download at least a set of key screenshots to show the main points of the video
#41 KEY MESSAGES:
Going back to the graph on active carbon reservoirs, forests represent 50% of the vegetation pool and tropical forests are 50% of the forest pool (or 25% of the total vegetation pool)
Notes:
Ask students -- Now that you have a general sense of the carbon cycle both the rapid and the slow components where do the forests fit in?
What role do forests play in the carbon cycle?
Image Source:
Graph created with data from: Schlesinger Biogeochemistry 1997 and 2013 editions.
Full citation for 2013 edition: Schlesinger, W.H. and E.S. Bernhardt. 2013. Biogeochemistry: An analysis of global change. 3rd Edition. Elsevier, Amsterdam.
#42 KEY MESSAGES:
Tropical forests are also a major source of biomass burning and if the burning is associated with land use change (rather than a natural fire followed by regrowth) there is no balancing flux down from the atmosphere into forest regrowth
#43 KEY MESSAGES:
This is the fundamental idea behind REDD+ : increase the flux of CO2 out of the atmosphere by maintaining and expanding tropical forests.
Note that we cannot alter the rate of photosynthesis, but rather we alter the amount of land where photosynthesis occurs and we alter the size of the trees doing photosynthesis.
#44 KEY MESSAGES:
REDD stands for Reducing emissions from deforestation and forest degradation and the + indicates the inclusion of sustainable forest management, forest conservation and enhancement of forest carbon stocks
#45 KEY MESSAGES:
Combustion is also largely under human control and we can reduce CO2 flux to the atmosphere by reducing biomass burning
#46 KEY MESSAGES:
Burning in tropical forests is generally associated with deforestation and land use change and is included in REDD+
Notes:
Processes controlling the major fluxes of carbon
#47 KEY MESSAGES:
Forests absorb about one quarter of the emissions from human activities
Another quarter is absorbed by the ocean resulting in only half of the emissions stay in the atmosphere. Without the forest and ocean sinks, atmospheric CO2 concentrations today would be significantly higher.
Image Source:
Le Quéré et al. 2012; Global Carbon Project 2012
The latest update (based on 2004-2013 averages) is available at this link: http://www.globalcarbonproject.org/carbonbudget/14/files/GCP_budget_2014_lowres_v1.02.pdf
#48 Photo Source:
Photo courtesy of Deborah Lawrence
#49 KEY MESSAGES:
This slide reviews what we have discussed so far about how forests affect the global carbon cycle.
Notes: It’s important at this stage to help students loop back to previous understanding of factors influencing climate and how forests influence those factors so students can clearly see link between forests, C pools and fluxes, and climate
Photo Source:
Photo courtesy of Deborah Lawrence
#50 KEY MESSAGES:
So now we are going to consider how forests affect albedo…
Notes: may need to remind students about definition of albedo
Photo Source:
Photo courtesy of Deborah Lawrence
#51 KEY MESSAGES:
Forest cover has a very low albedo reflecting back only a small fraction of the sunlight energy it receives and absorbing most of it. On average forests reflect back only 10% of the sunlight they receive.
Photo Source:
Photo courtesy of Megan McGroddy
#52 KEY MESSAGES:
In contrast pastures and grasslands have a higher albedo and reflect about 25% of the sunlight received back as shortwave radiation absorbing only 75%.
Photo Source:
Photo courtesy of Megan McGroddy
#53 KEY MESSAGES:
So converting a forest to a grassland results in a doubling of the amount of energy reflected back to space and a net cooling of the land surface
Photo Source:
Photo courtesy of Megan McGroddy
#54 KEY MESSAGES:
In summary forests absorb 90% of the sunlight they receive (low albedo) and warm the environment. Converting forests to pastures results in a decrease in sunlight absorbed and a net cooling effect
Photo Source:
Photo courtesy of Deborah Lawrence
#55 KEY MESSAGES:
So now we will turn to the third way in which forests affect climate: evapotranspiration
Photo Source:
Photo courtesy of Deborah Lawrence
#56 KEY MESSAGES:
Evapotranspiration moves water from the ground to the atmosphere; some of the water may move directly from soil to the air and some flows from the ground through vegetation to the air. The net result (not shown on the graphic) is cooling. Take some time with students to discuss how this process works.
Brainstorming question: How does evapotranspiration work?
Notes:
Evaporation is a physical process where water moves directly from the soil to the atmosphere and is driven by the difference in water concentration ( moves from moist soil to dry air).
In transpiration: Trees transport water from a moist environment (the soil) up through the stem and out to the atmosphere through their leaves.
In both processes water moves from the moist soil to the drier air but transpiration requires transport through the plants and evaporation is most effective at a bare surface (greatest contact between moist soil and dry air). Because it is difficult to determine whether an individual molecule of water moved from the soil to the atmosphere via evaporation or via transpiration we generally refer to the two processes together as evapotranspiration.
Image source:
http://en.wikipedia.org/wiki/Evapotranspiration
#57 KEY MESSAGES:
Higher rates of evapotranspiration mean greater cooling.
Notes:
Ask students: How does that work?
Because plants can actively take up water from the soil and from fairly deep in the soil as well as surface layers and because forests can have several meters of leaf surface per meter of soil surface evapotranspiration in forested areas is much stronger than in deforested areas. Converting water from liquid to gas form requires energy and results in a net cooling (just as it does for us when we sweat)
Image source:
http://en.wikipedia.org/wiki/Evapotranspiration
#58 KEY MESSAGES:
In addition to the cooling effect of evapotranspiration there is also a positive effect on rainfall.
As the air above the forest moves upward (now with lots of water vapor) it cools and the water vapor condenses out and falls back to the ground as rain. So ET also acts as a pump- allowing rainfall to be recycled from the soil back to the atmosphere.
Image source:
http://en.wikipedia.org/wiki/Evapotranspiration
#59 KEY MESSAGES:
In summary high levels of ET in forests result in cooler temperatures and higher rainfall at the local to regional scale.
The next factor I am going to present is the effect of forests on atmospheric aerosols. We discussed in the last lecture how aerosols like those from volcanoes can reflect sunlight back to space from the atmosphere resulting in a net cooling effect. Large volcanic eruptions are easily detected in the record of mean global temperatures.
Image Source:
Source of graphic of greenhouse effect: Mann, M.E. and L.R. Kump. 2008. Dire Predictions: Understanding global warming. The illustrated guide to the findings of the IPCC (Intergovernmental Panel on Climate Change). DK, Publishing, NY, NY. ISBN 978-0-7566-3995-2.
Source of albedo image: NASA's Aqua satellite shows the state of Arctic sea ice on September 10 2008 Photo: REUTERS
Source of evapotranspiration image: Evaporation image source: http://en.wikipedia.org/wiki/Evapotranspiration
#60 KEY MESSAGES:
The next factor I am going to present is the effect of forests on atmospheric aerosols. We discussed in the last lecture how aerosols like those from volcanoes can reflect sunlight back to space from the atmosphere resulting in a net cooling effect. Large volcanic eruptions are easily detected in the record of mean global temperatures.
Image Source:
Source of graphic of greenhouse effect: Mann, M.E. and L.R. Kump. 2008. Dire Predictions: Understanding global warming. The illustrated guide to the findings of the IPCC (Intergovernmental Panel on Climate Change). DK, Publishing, NY, NY. ISBN 978-0-7566-3995-2.
Source of albedo image: NASA's Aqua satellite shows the state of Arctic sea ice on September 10 2008 Photo: REUTERS
Source of evapotranspiration image: Evaporation image source: http://en.wikipedia.org/wiki/Evapotranspiration
Fire image source: http://www.fire.uni-freiburg.de/GFMCnew/2013/07/25/indonesia_oli_2013176.jpg
#61 KEY MESSAGES:
In the last lecture we talked about the effects of aerosols from volcanoes. Forests also emit aerosols both as part of normal tree metabolism (VOCs) as well as during burning. While the effect is not as dramatic as that seen in the case of volcanic eruptions it is still significant
#62 KEY MESSAGES:
VOCs and other aerosols emitted by trees or biomass burning affect rainfall through their role as cloud condensation nuclei- this is a complex relationship and the size and nature of the aerosol determines the direction of the effect on rainfall. As with aerosols emitted by volcanoes some aerosols emitted by trees either through natural metabolism or biomass burning reflect the sunlight back before it reaches the Earth’s surface thereby cooling the planet’s surface. Finally VOCs are reactive and interact with one another and other molecules in the atmosphere leading to changes in the atmosphere
Image source:
http://www.atmo.arizona.edu/students/courselinks/fall12/atmo170a1s1/coming_up/week_8/nucleus_droplet_raindrop.jpg
#63 KEY MESSAGES:
As discussed in the previous slide the effect of aerosols from both metabolism and biomass burning are complex but overall it is thought they generally act to cool the Earth’s surface slightly.
#64 KEY MESSAGES:
So we have looked at how forests affect climate in various ways. Now we are going to look at what controls forest cover- where forests are and how large and dense they grow. There are two major factors to consider: climate and human activity
#65 KEY MESSAGES:
Forests can be found almost everywhere on the Earth. On this map you can see that forests and woodlands are the most common ecosystem types.
Image Source:
http://www.plantsciences.ucdavis.edu/gepts/pb143/LEC10/Pb143l10.htm
#66 KEY MESSAGES:
The image shows the distribution of biomes related to temperature and precipitation. Here you can clearly see that forest cover is strongly linked to temperature and precipitation. As climate gets warmer and drier forests are replaced by woodland/grasslands and then deserts.
Image Source:
http://www.globalchange.umich.edu/globalchange1/current/lectures/kling/ecosystem/ecosystem.html
#67 KEY MESSAGES:
Humans have had an enormous impact on the extent of forest cover cutting and burning forests for timber products and to convert forests to pastures, crops and cities.
Image source:
http://understory.ran.org/2010/02/24/cargill-leaves-a-palm-oil-mess-in-papua-new-guinea/
http://www.ens-newswire.com/ens/may2007/2007-05-30-03.asp
#68 KEY MESSAGES:
Use this slide to review and consolidate lessons from previous slides, and to ask students how forest cover has changed in the past 8000 years.
Question for discussion: So given that climate controls where forests can occur and humans have actively altered forest cover what do we know about how forest cover has changed at different time scales?
Notes: the embedded animation at this link <http://www.youtube.com/watch?v=gBTlIaf12-4> covers the time period from 8000 years ago up to current.
Be prepared to pause the animation at 200 years ago to allow the students to focus on the more recent changes (150 years approximately at 1:17 and 40 year 1:20 time periods). There is an English language narration which you can use or mute as you see fit.
First let’s look at the longest time scale: how has forest cover changed over the past 8000 years- since humans began to practice agriculture.
As you watch the video you can see natural vegetation cover disappear as different cultures develop starting in the Fertile Crescent and China. The final seconds of the video representing the last 150- 100 years show a much more dramatic and widespread change in vegetation cover
#69 KEY MESSAGES:
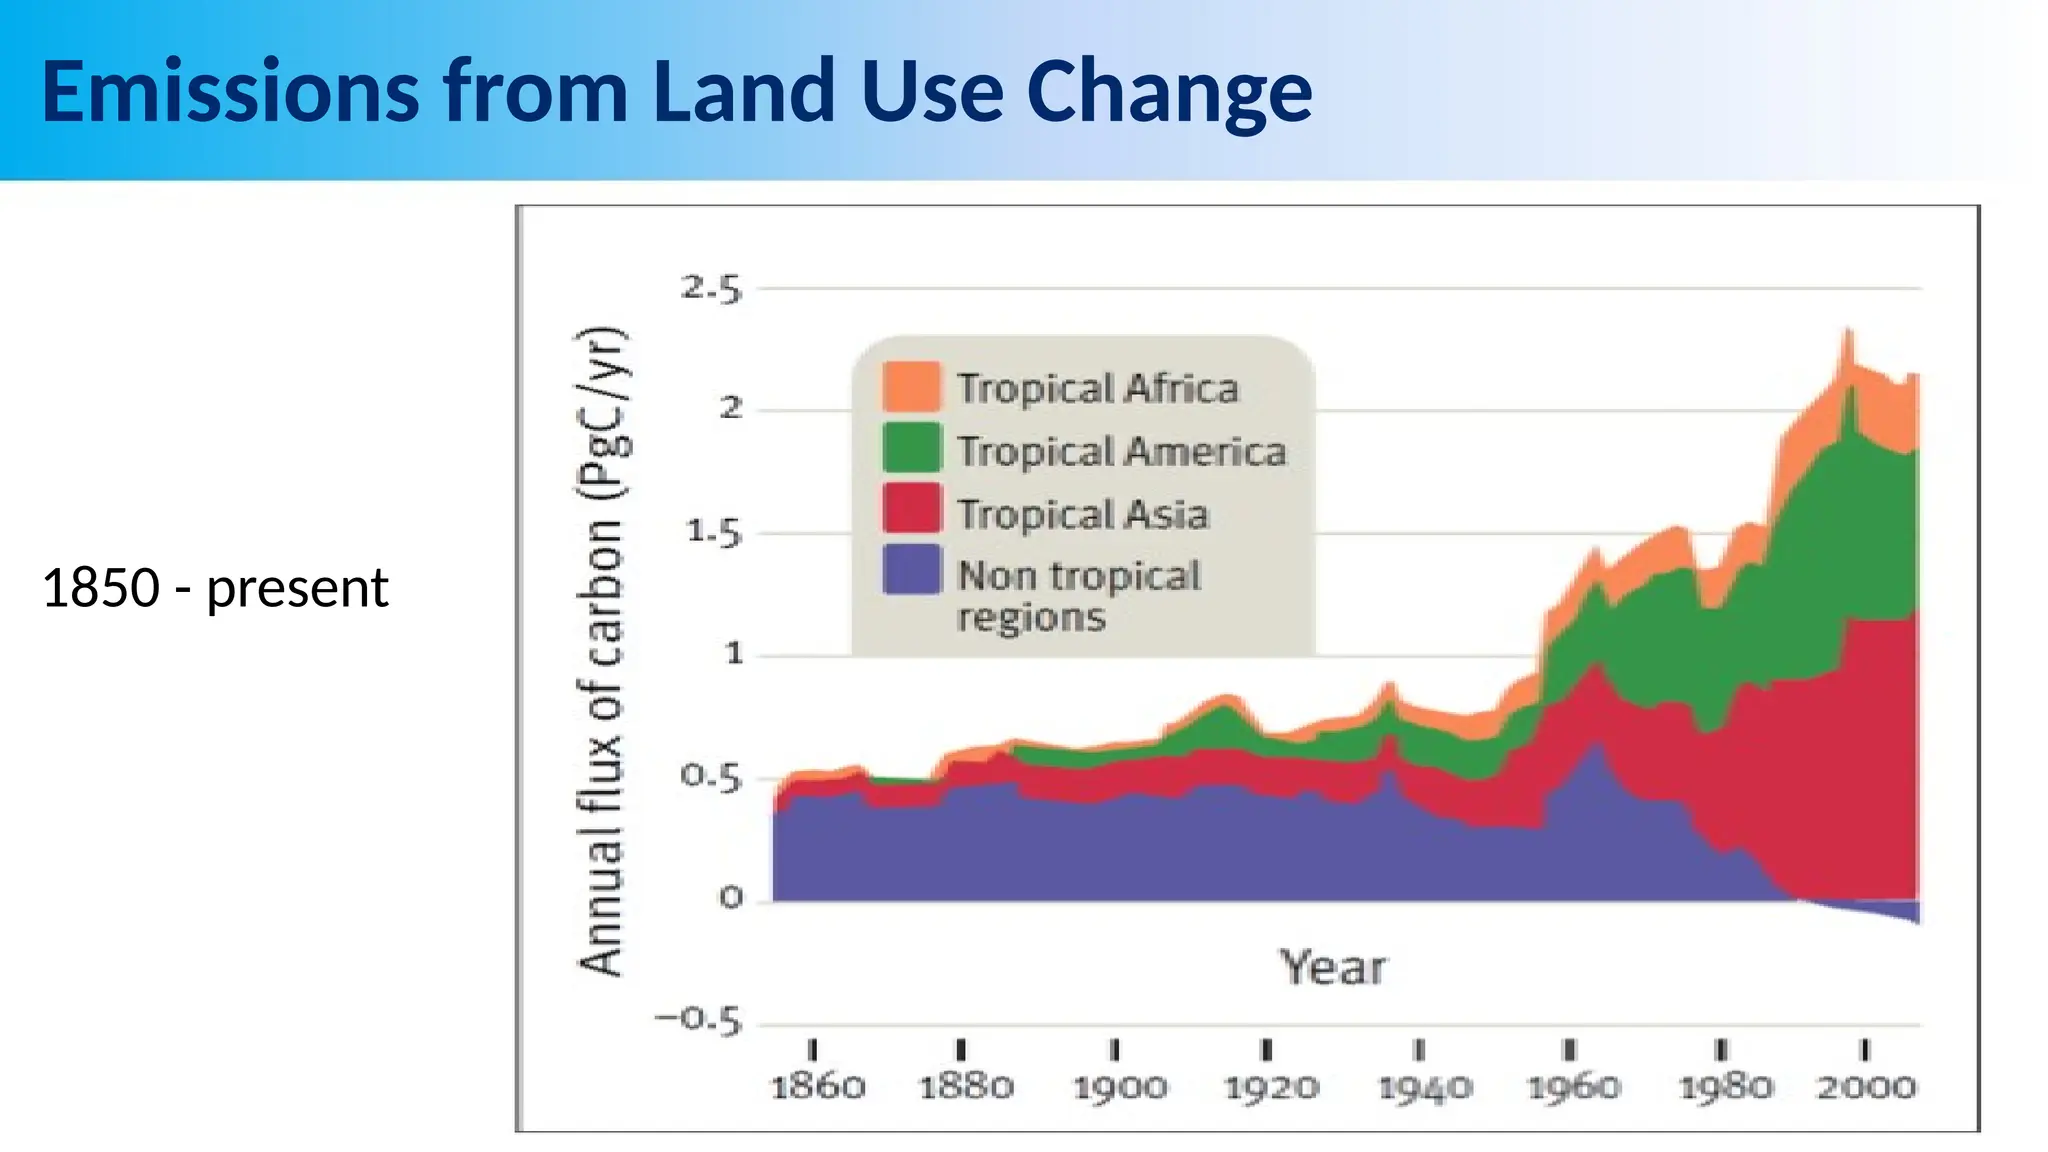
The effect of changing patterns in land cover change are reflected in measurements of C flux. This graph shows the flux of C from land use change since 1860 roughly the period we refer to as the Industrial Age
Reference:
Image: Houghton 2005 in Moutinho and Schwarzmann. Found at http://www.desdemonadespair.net/2009/11/graph-of-day-annual-carbon-flux-from.html
#70 KEY MESSAGES:
The pattern in temperate regions has been a decline since the 1960s ( remember this is only C flux from land cover change not totals)
Reference:
Houghton 2005 in Moutinho and Schwarzmann. Found at http://www.desdemonadespair.net/2009/11/graph-of-day-annual-carbon-flux-from.html
#71 KEY MESSAGES:
Tropical regions in contrast saw a rapid rise in land cover associated C emissions starting in the 1960s and only slowing recently.
Reference:
Houghton 2005 in Moutinho and Schwarzmann. Found at http://www.desdemonadespair.net/2009/11/graph-of-day-annual-carbon-flux-from.html
#72 KEY MESSAGES:
This graph shows the patterns in CO2 emissions from land use change and industrial emissions for the last 50 years.
While in the last graph we saw a shift in source from temperate to tropical areas as the major source of C from land use change we see here that globally the total emissions have declined slightly despite the increase in deforestation in tropical regions and as a percent of total C emissions land use has declined significantly due to the sharp increase in fossil fuel and cement emissions.
Total global emissions: 10.5 ± 0.7 GtC in 2012, 43% above 1990 emissions
Percentage attributed to land-use change: 38% in 1960, 17% in 1990, 8% in 2012 mostly from shifting cultivation and burning in the tropics
Reference:
Le Quéré et al 2013; CDIAC Data; Houghton & Hackler (in review); Global Carbon Project 2013.
Image Source:
http://www.globalcarbonproject.org/carbonbudget/14/files/GCP_budget_2014_lowres_v1.02.pdf
#74 Emphasize that the RATE of change and the stresses are of concern.