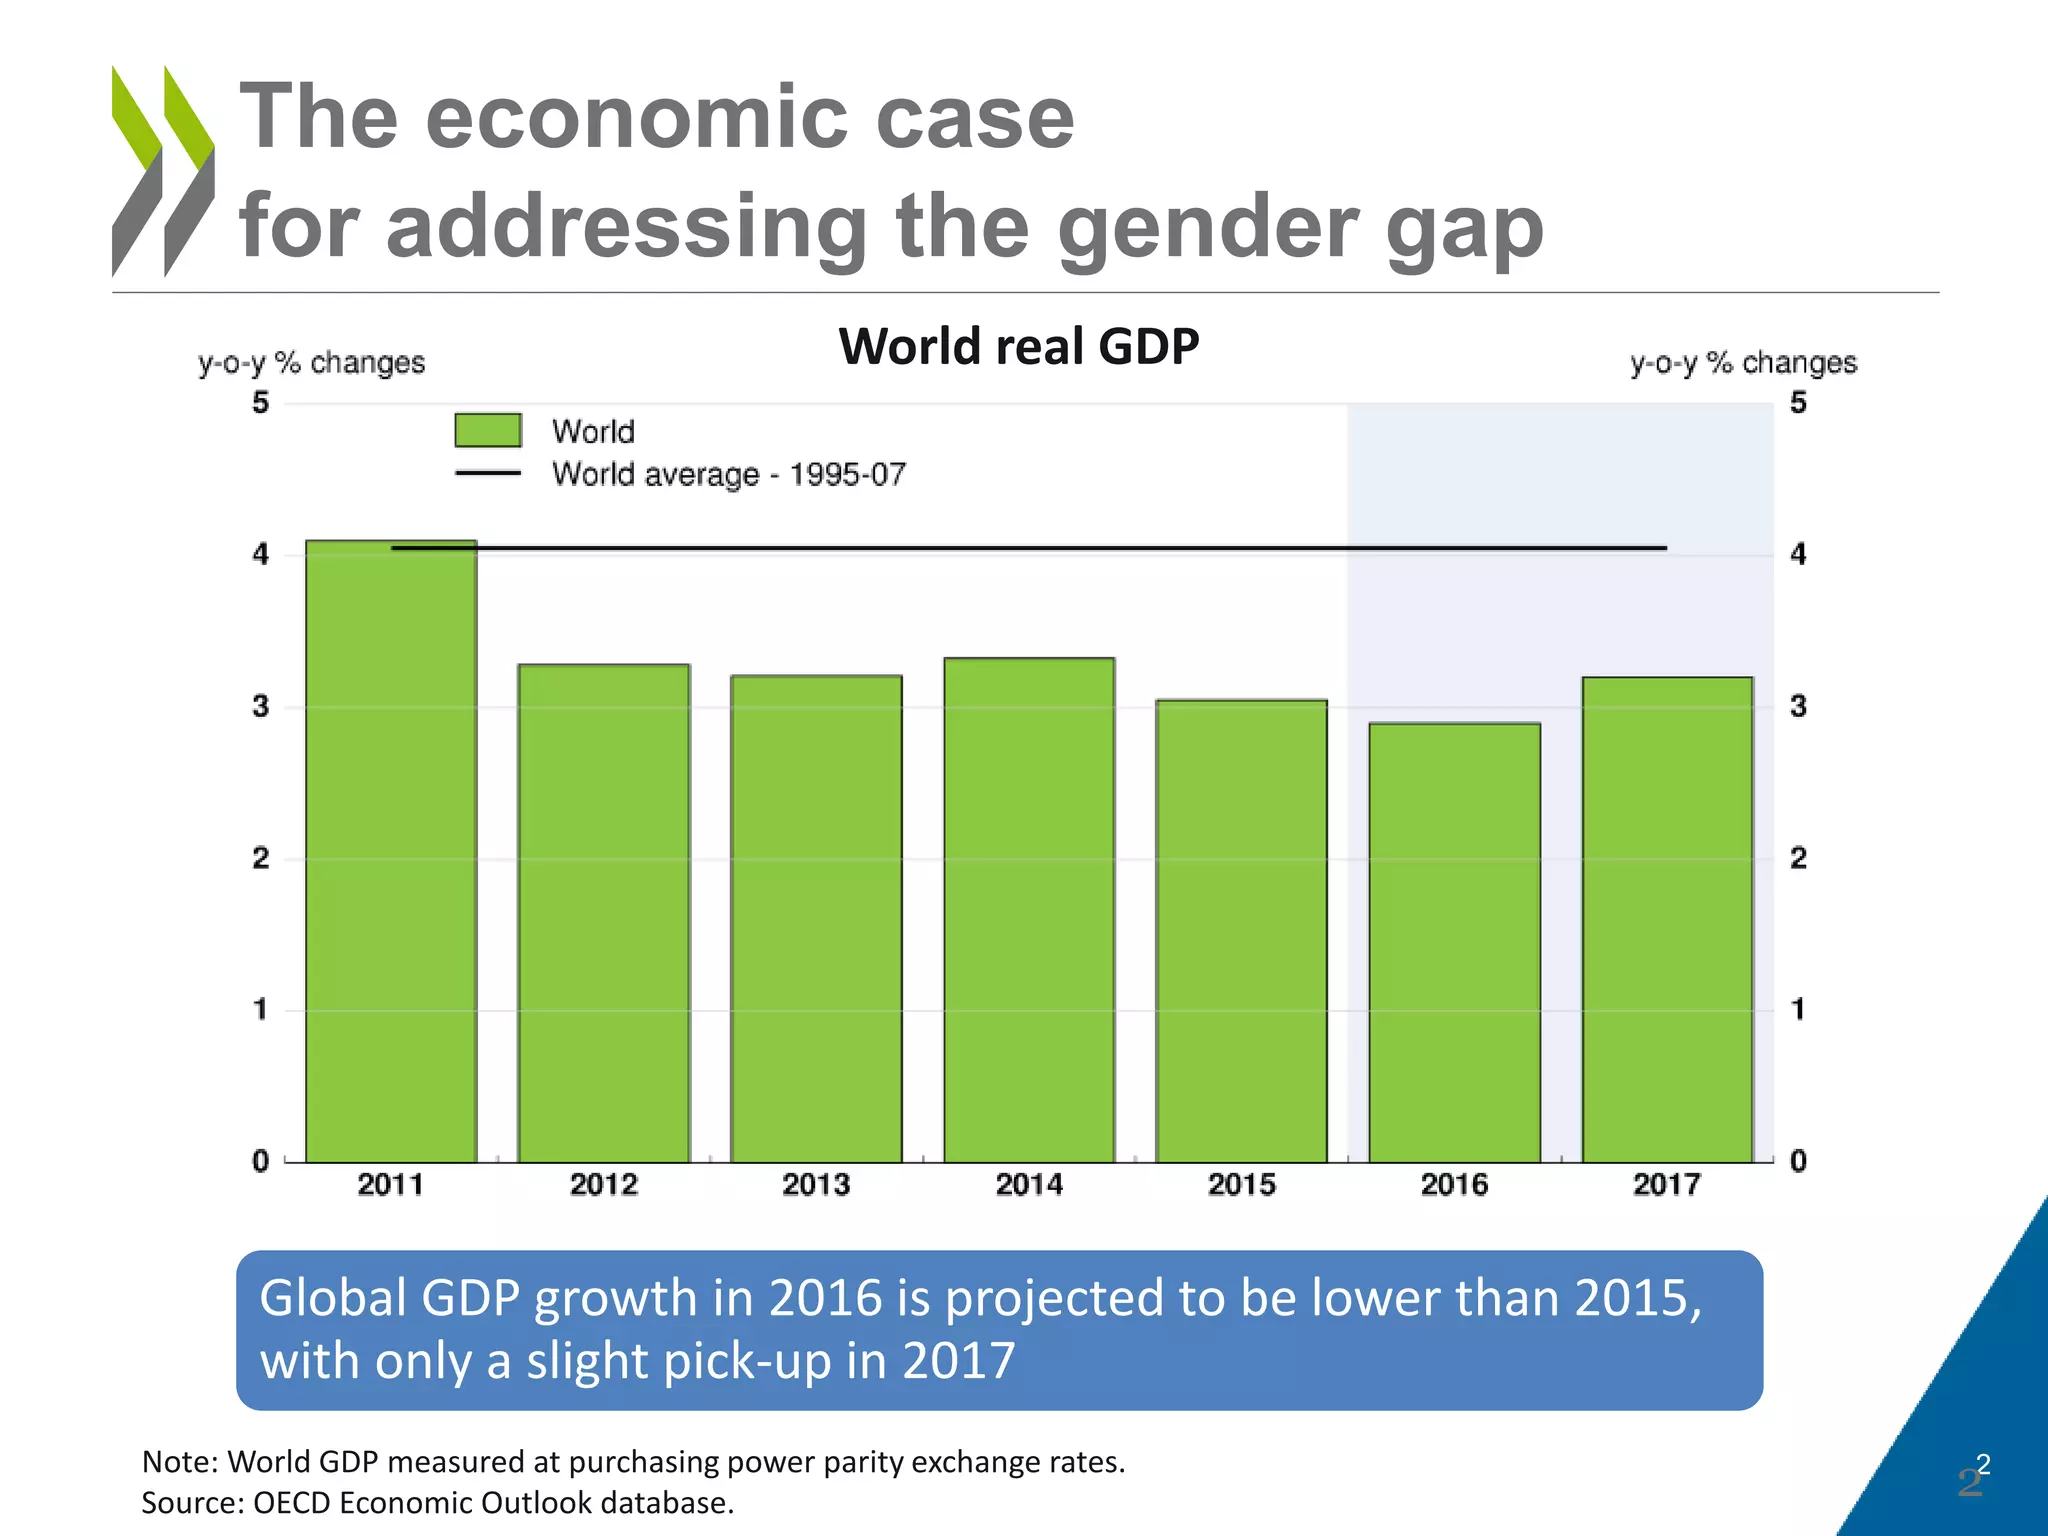
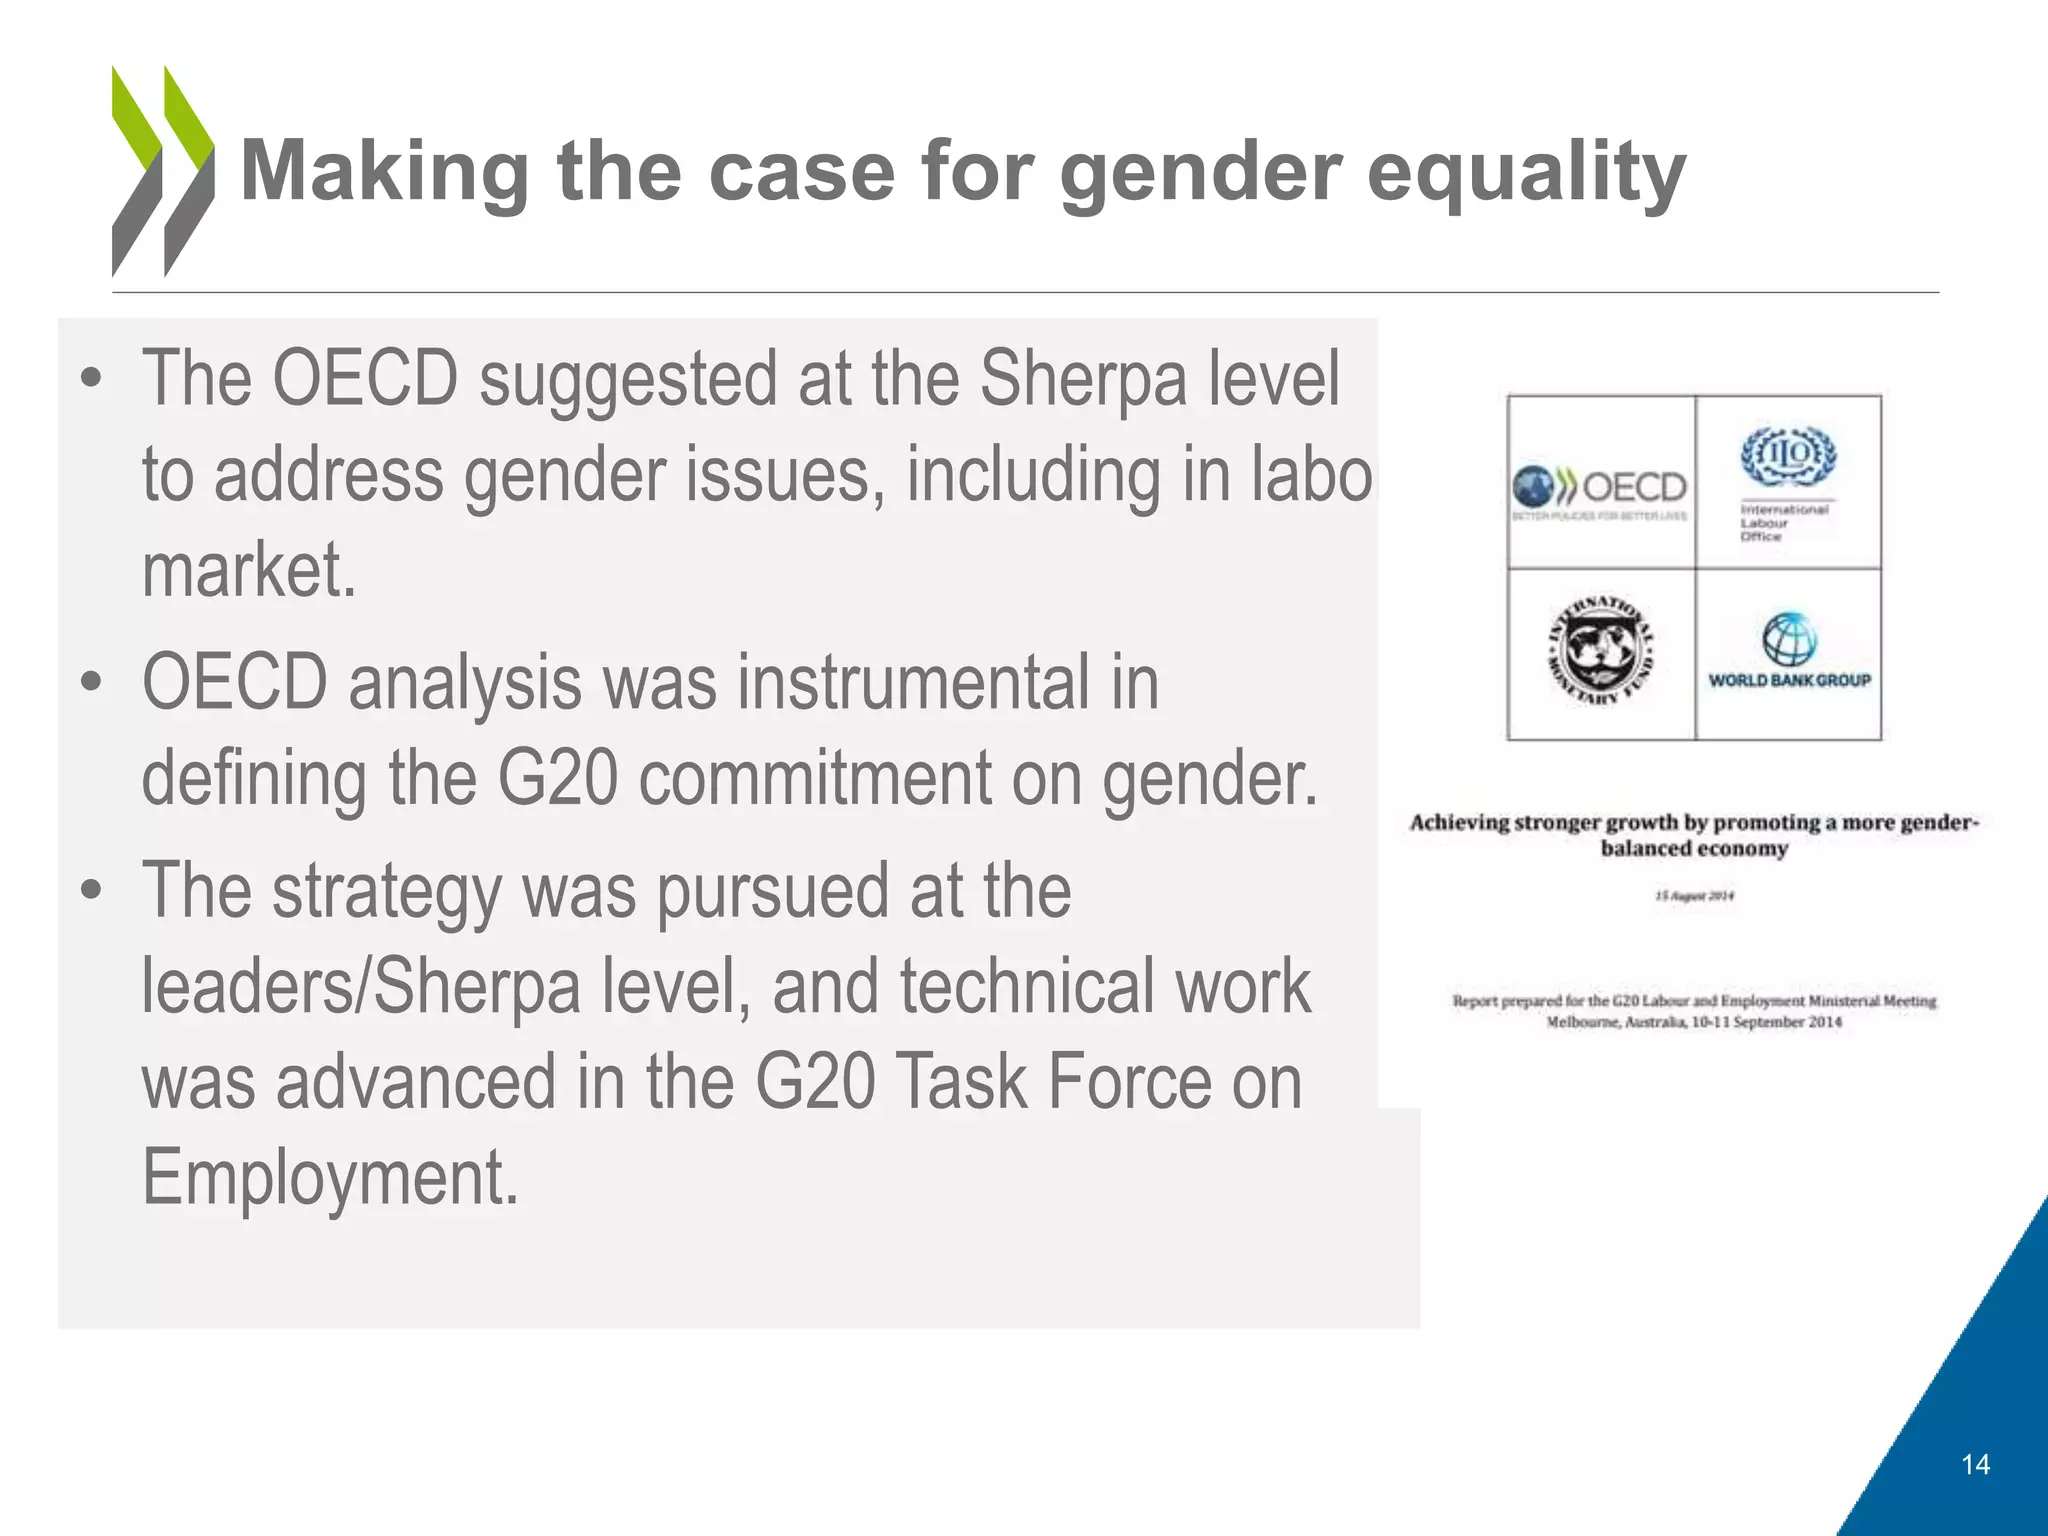
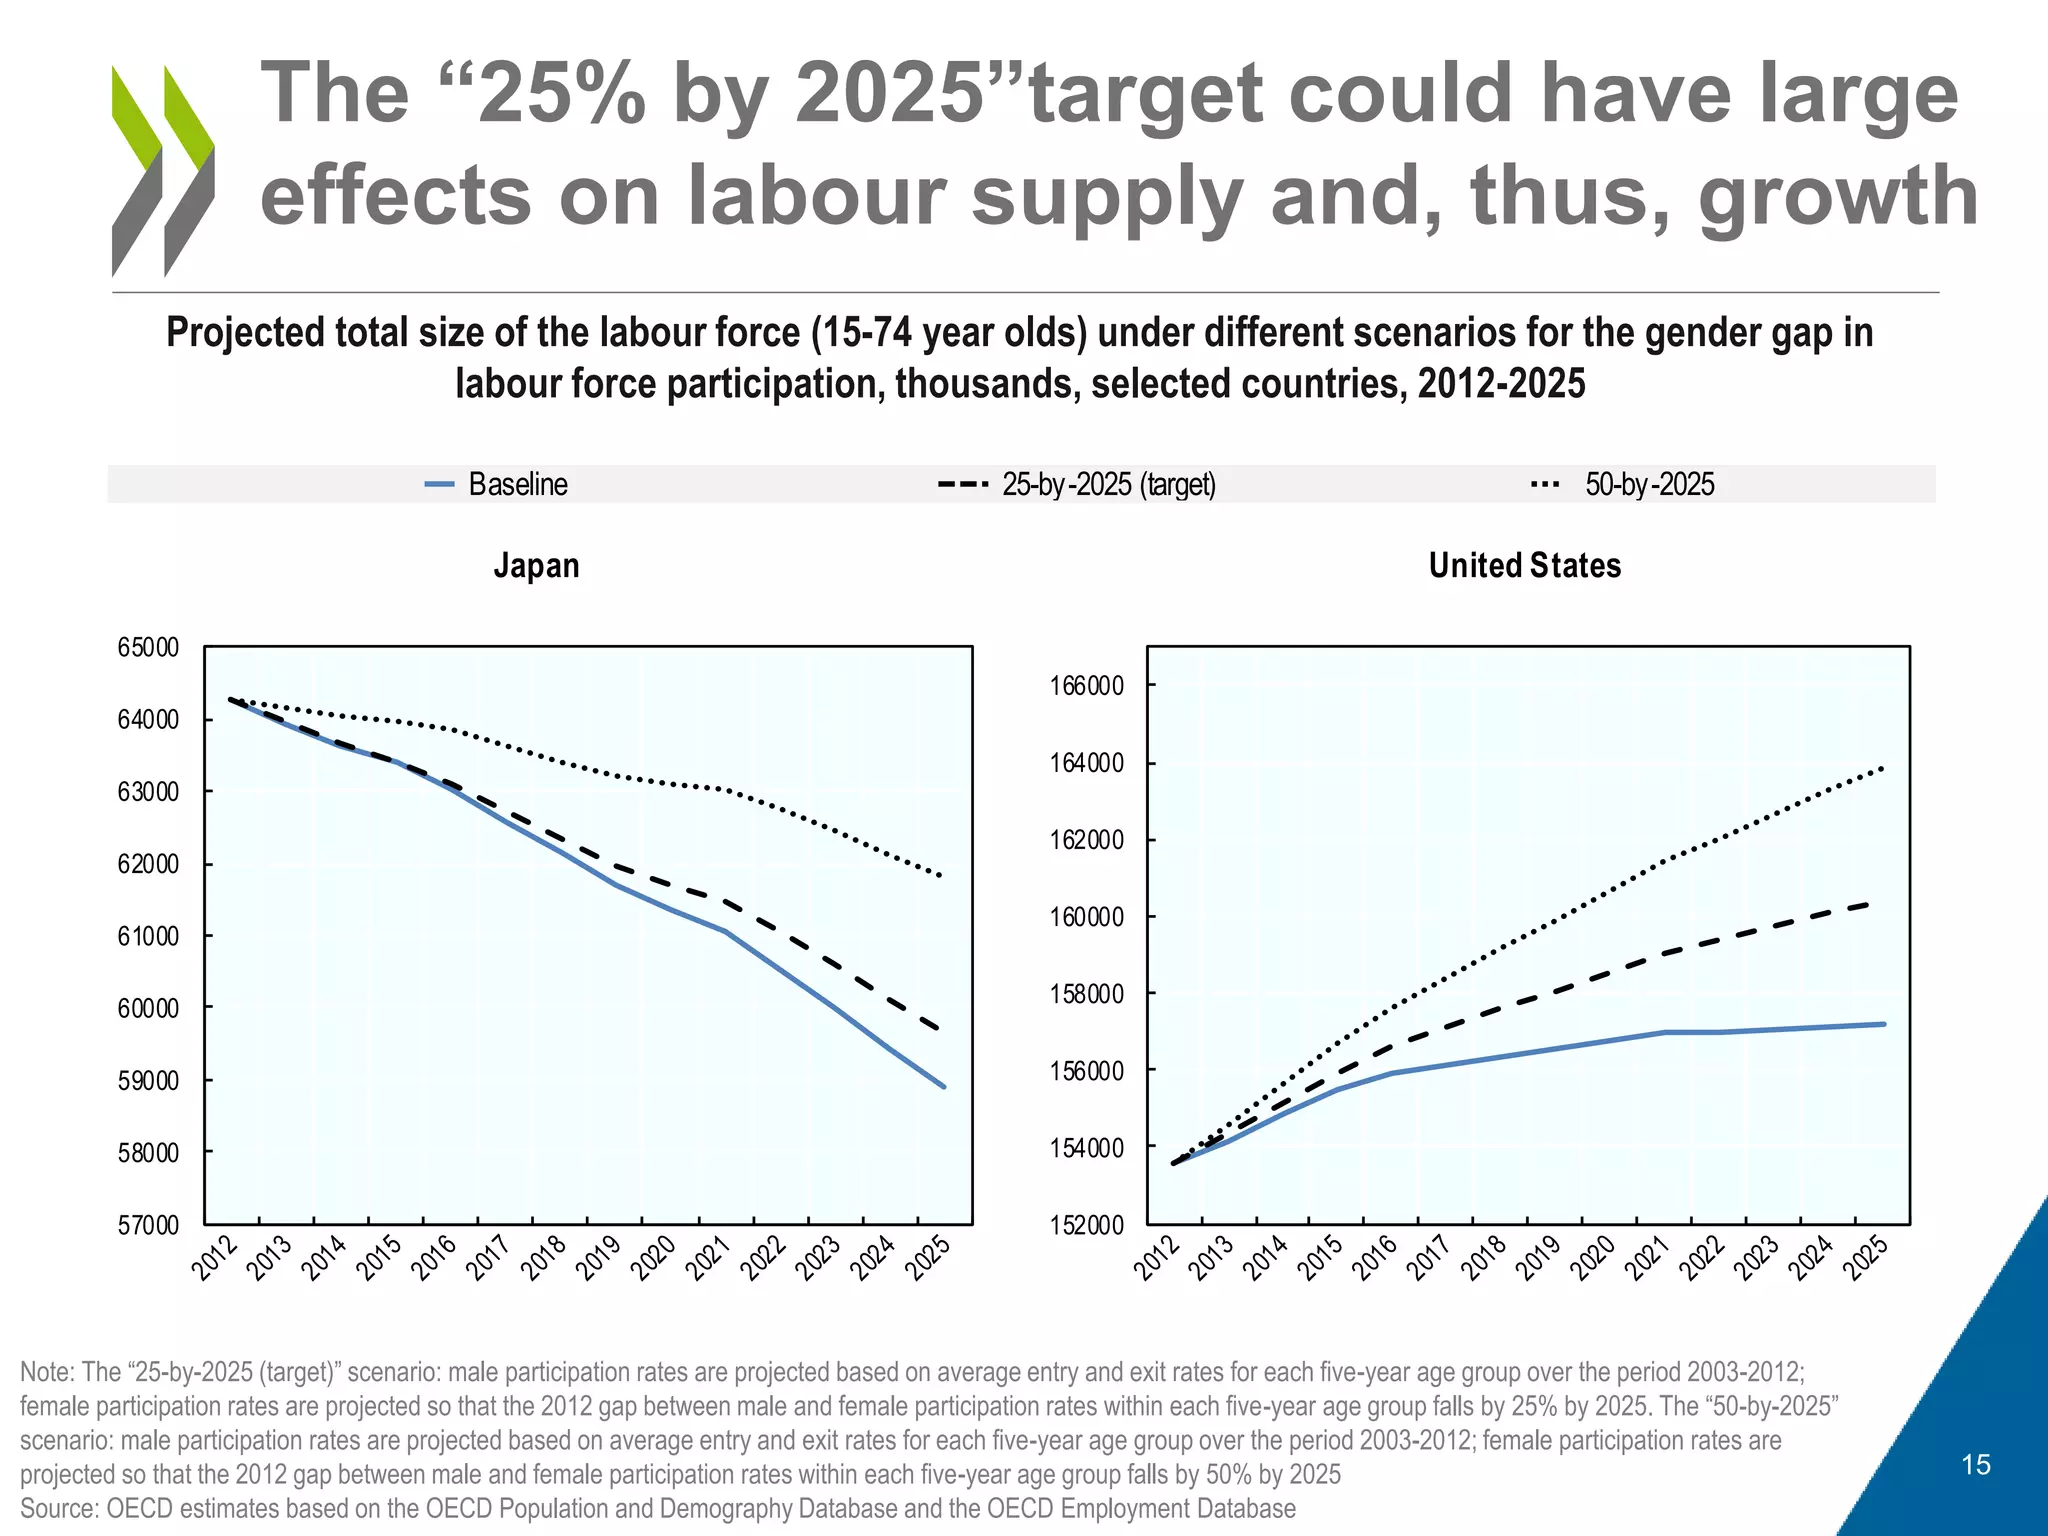
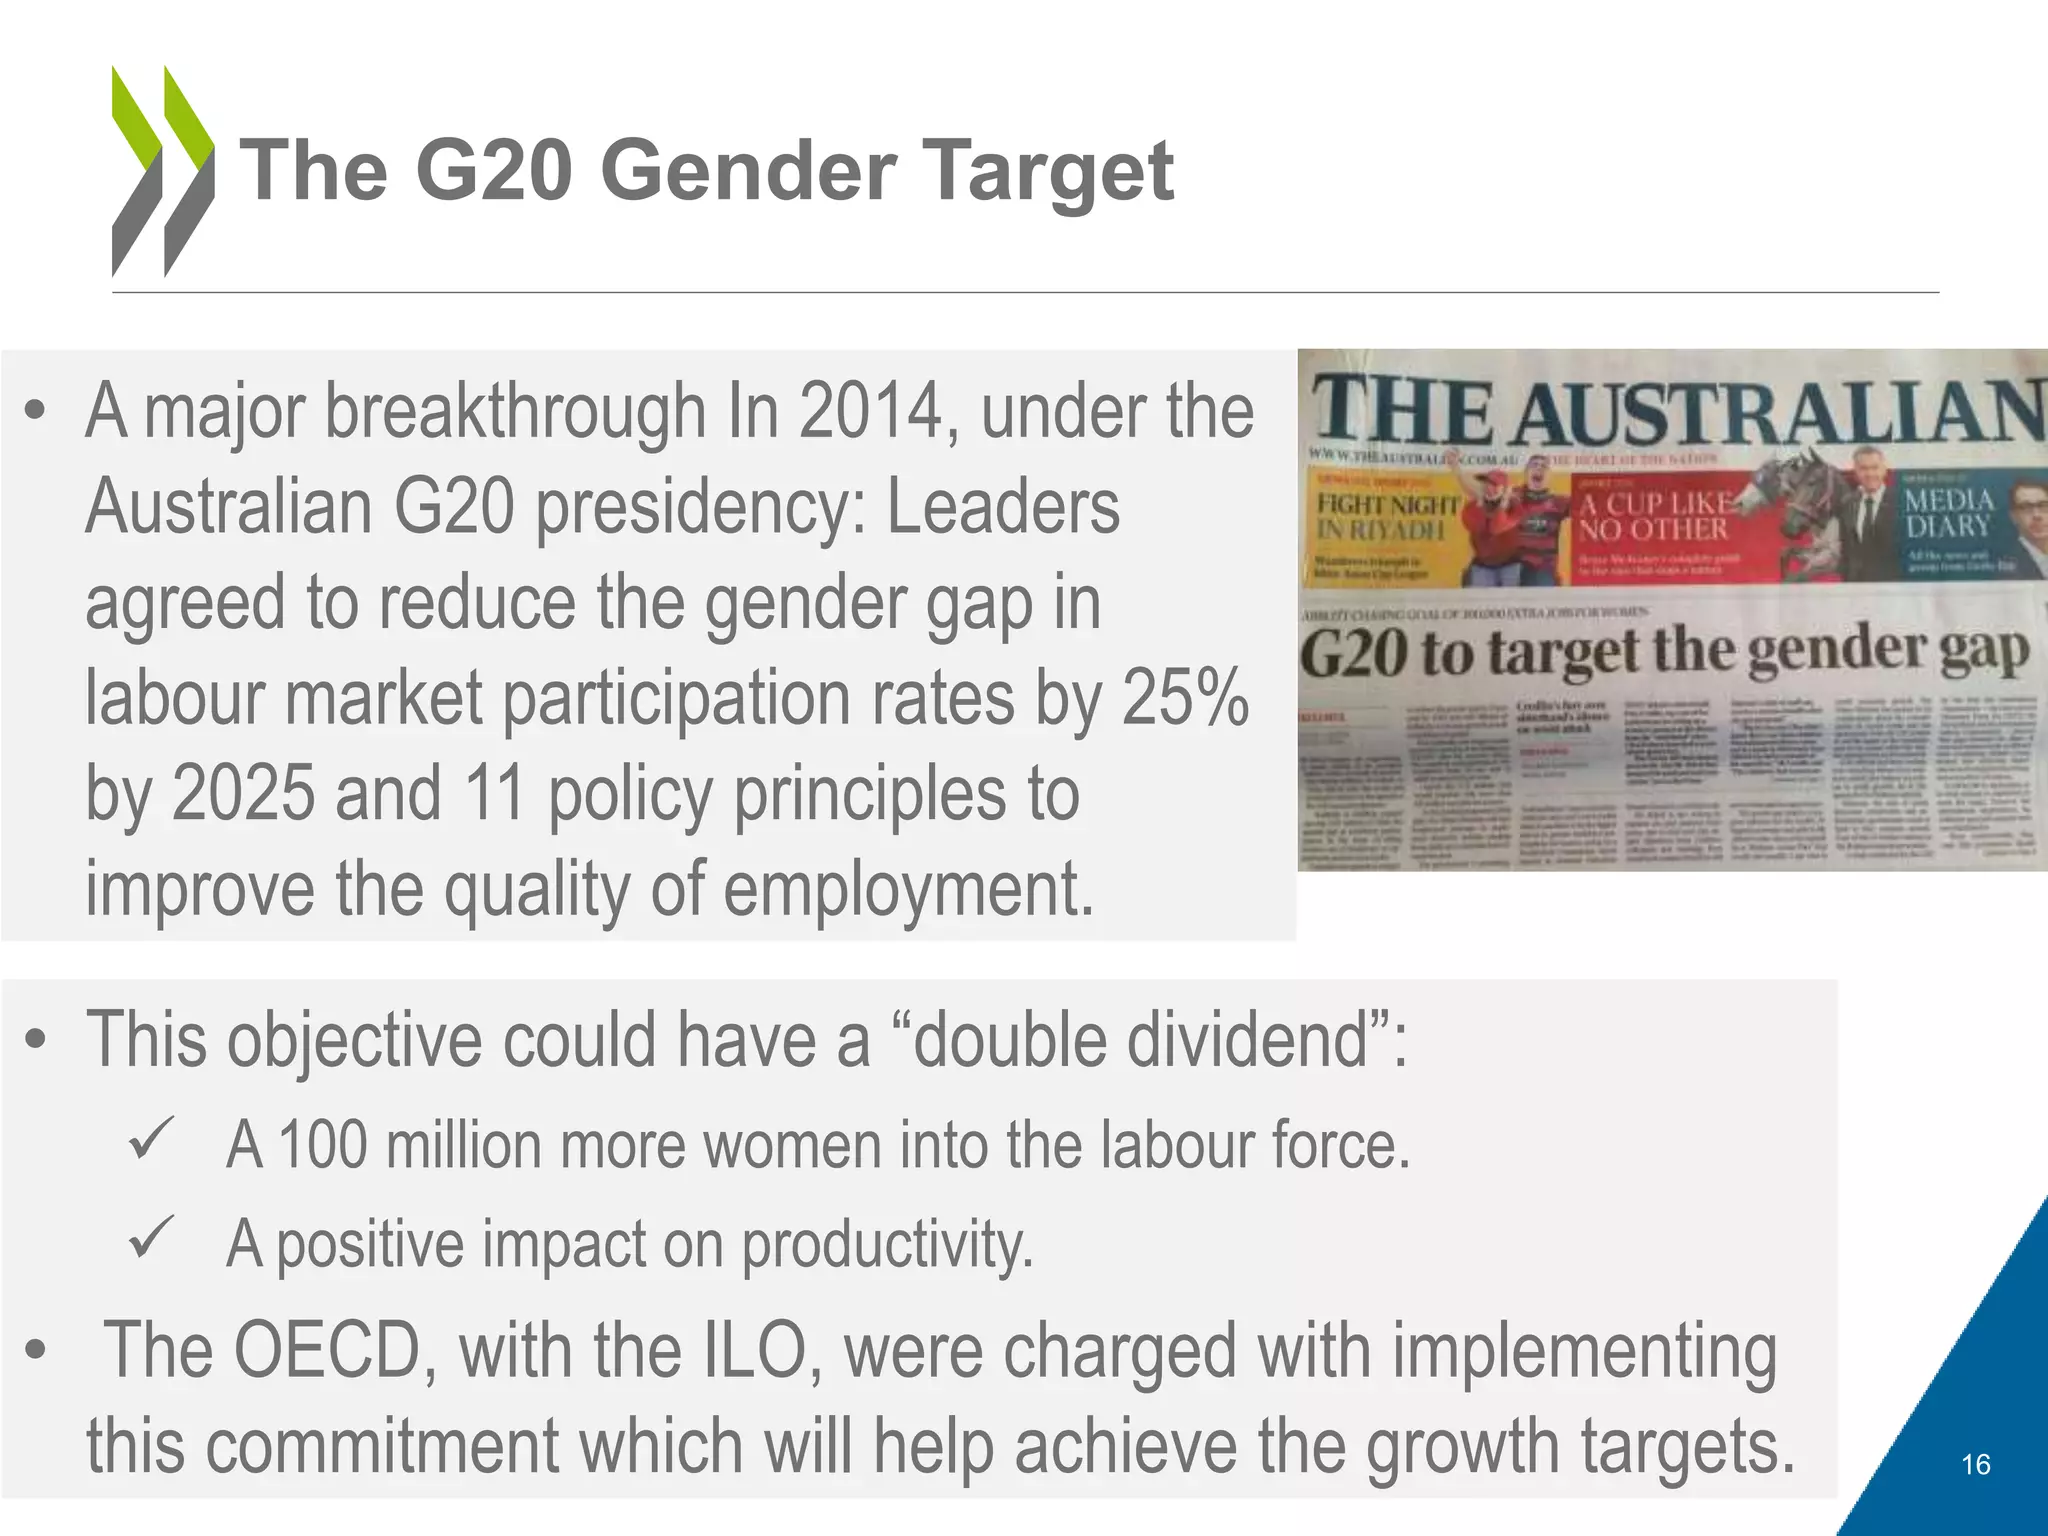
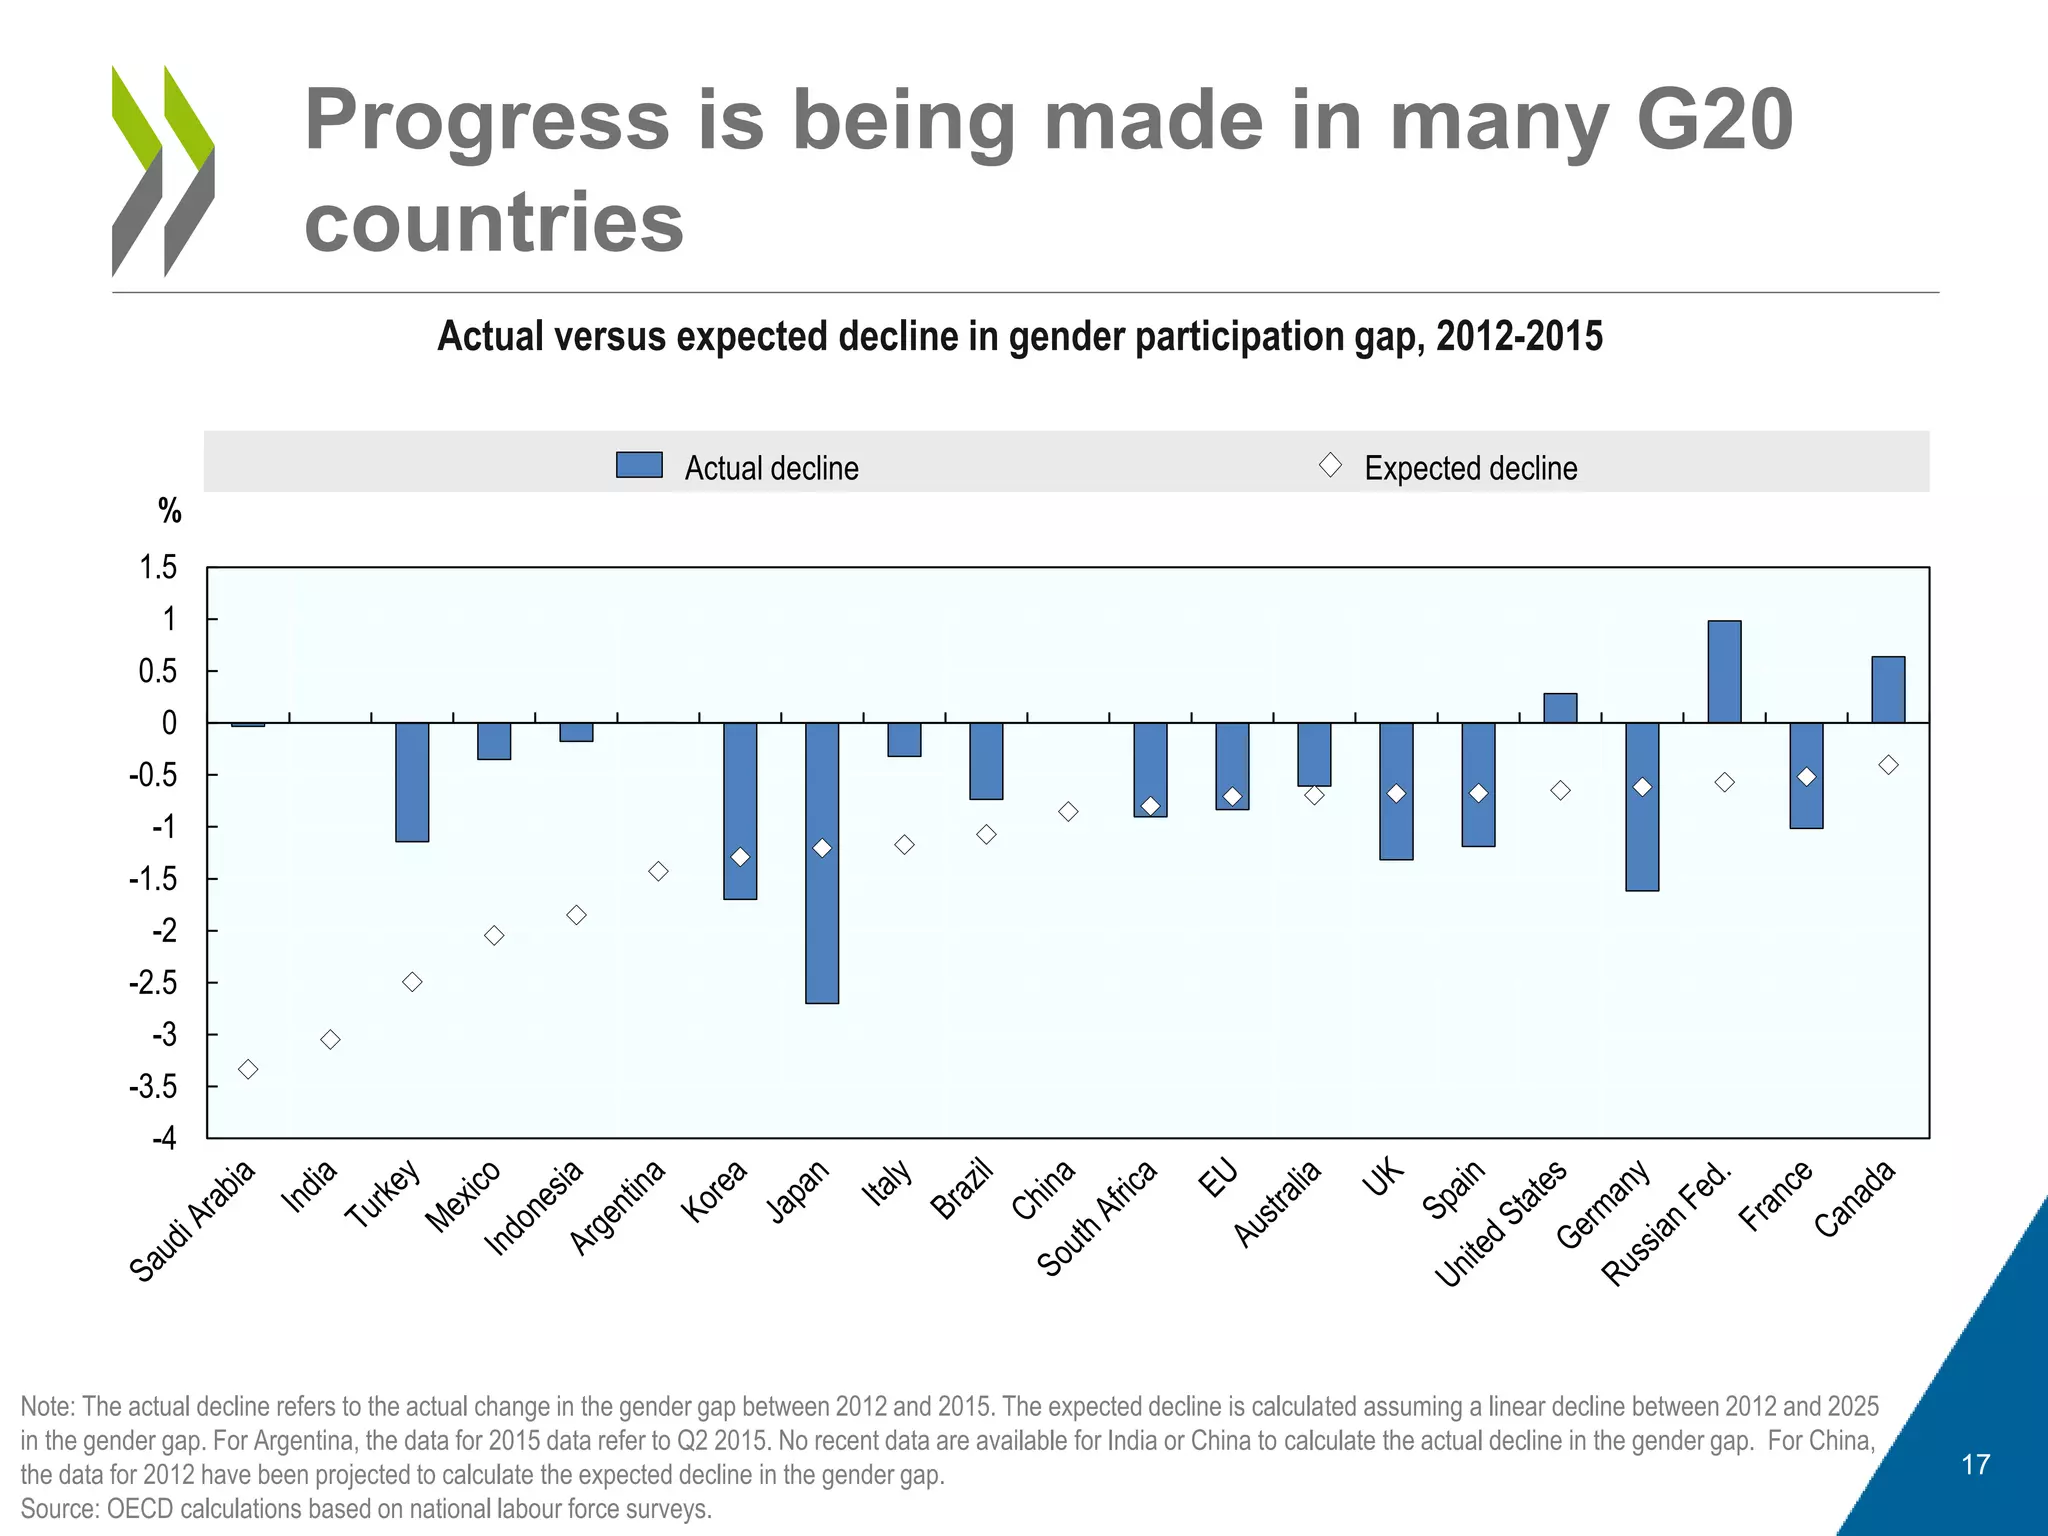
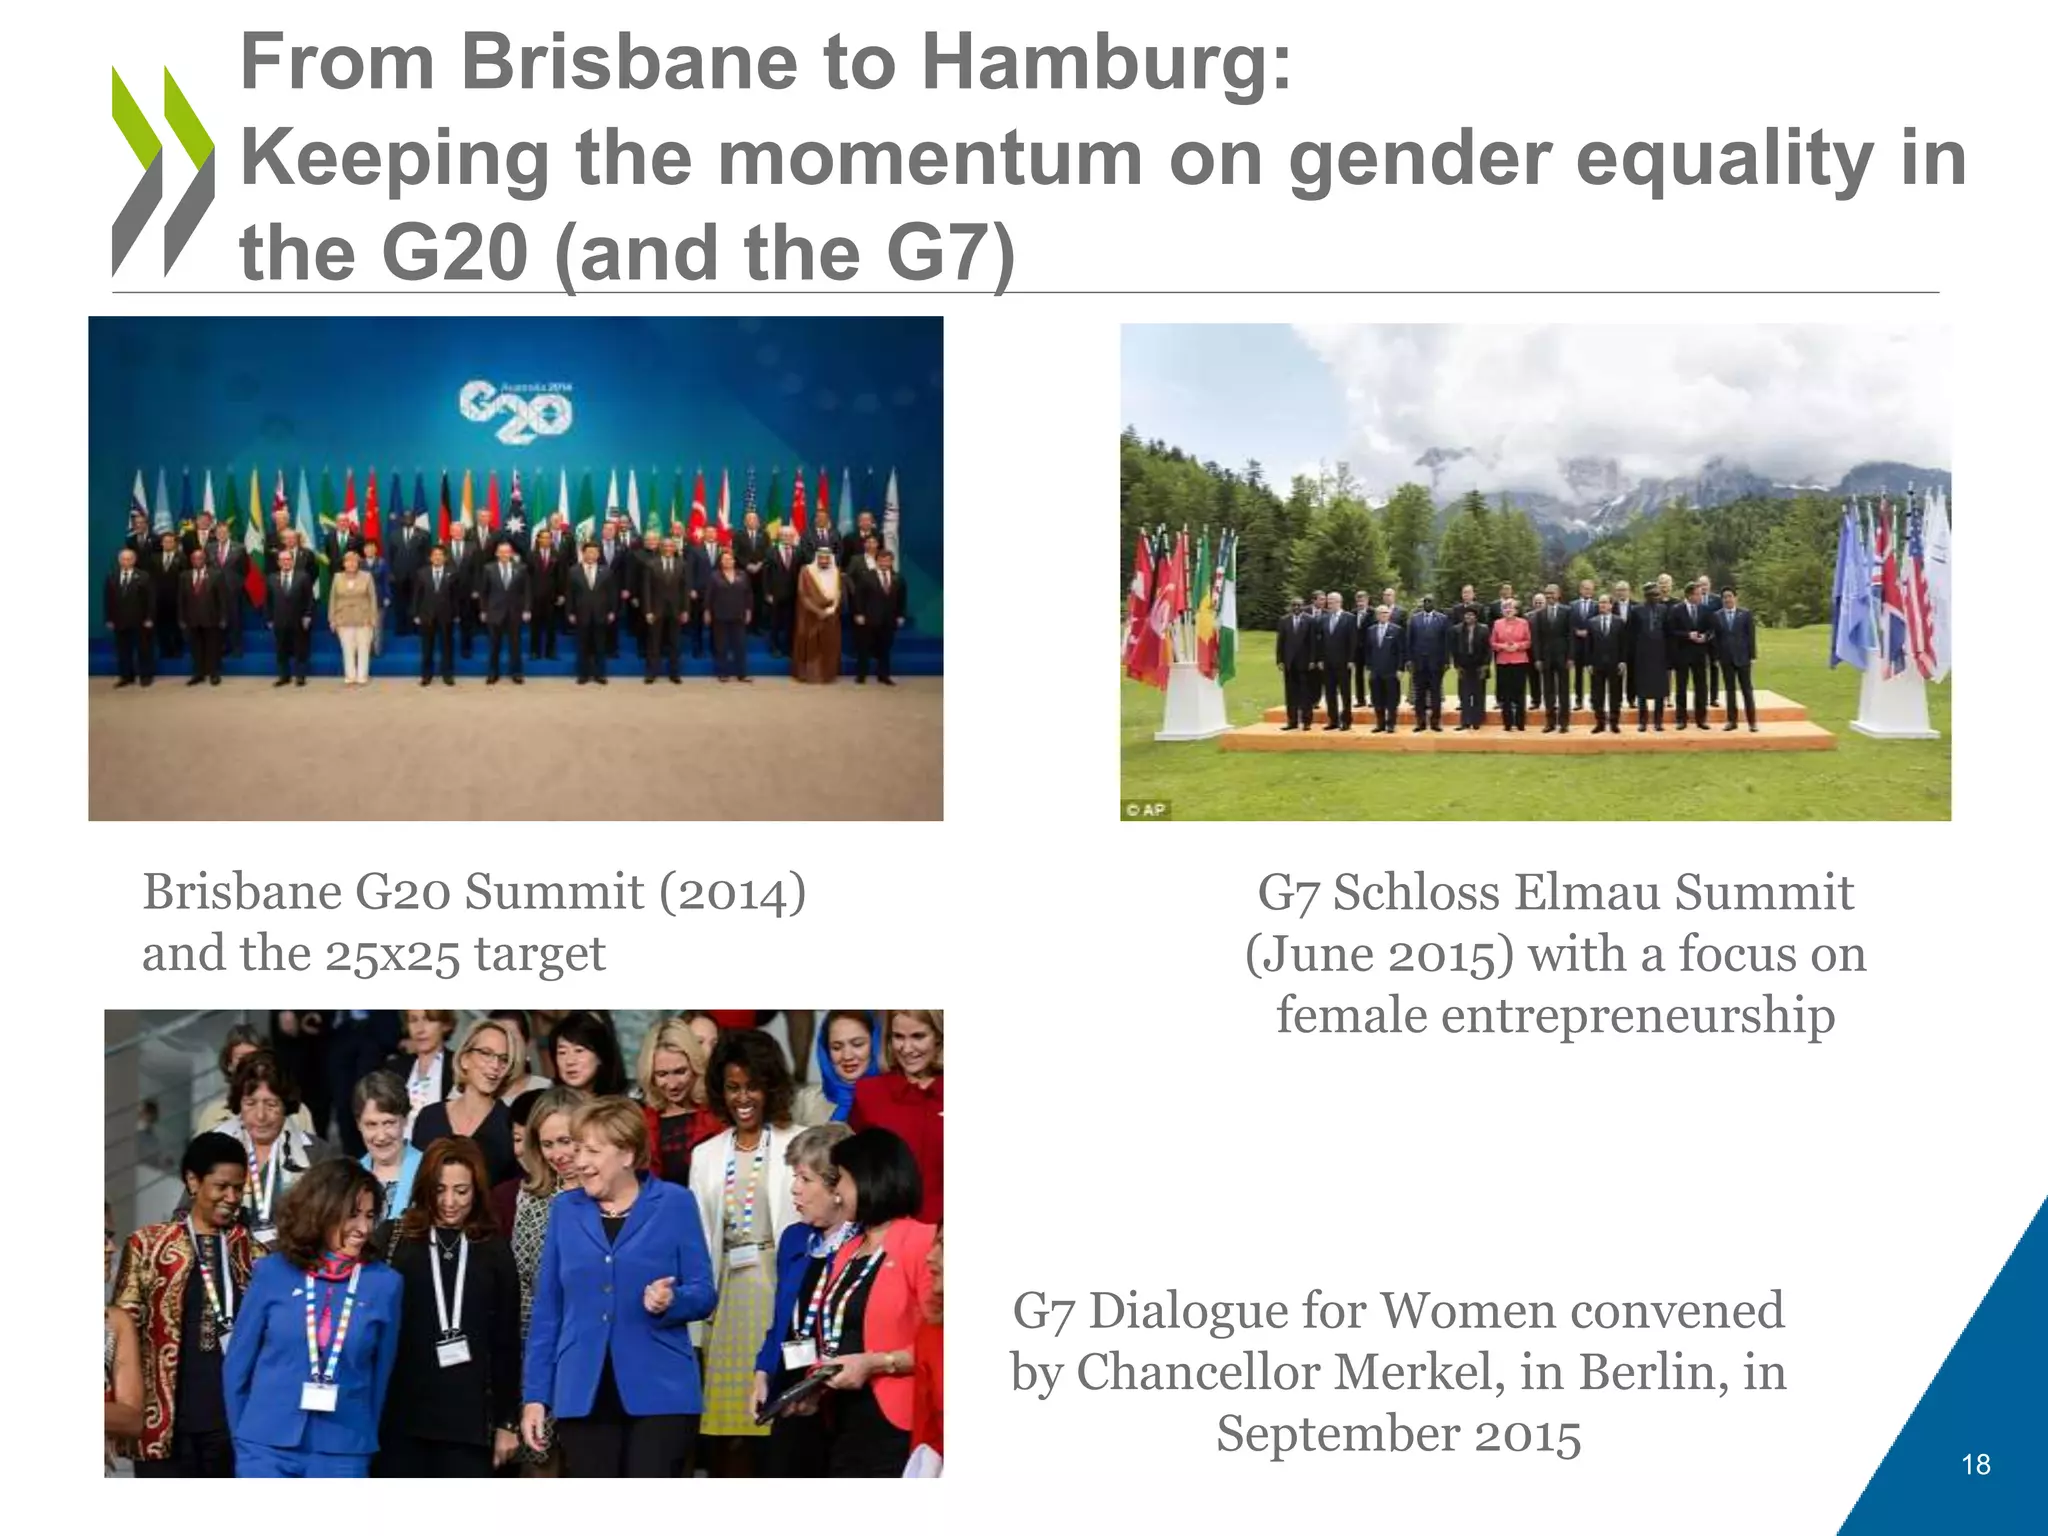
MAKING GENDER TARGETS COUNT:
TIME FOR G20 LEADERS TO DELIVER
Gabriela Ramos
OECD Chief of Staff, Special Counsellor to the OECD
Secretary-General, and Sherpa to the G20
The economic case
for addressing the gender gap
2
2
Global GDP growth in 2016 is projected to be lower than 2015,
with only a slight pick-up in 2017
World real GDP
Note: World GDP measured at purchasing power parity exchange rates.
Source: OECD Economic Outlook database.
The economic case
for addressing the gender gap
3
Source: OECD June 2016 Economic Outlook database; OECD calculations.
Contributions to potential output per capita growth in the OECD
Nowadays, young women are likely to be
more highly educated than young men
Data for China and Indonesia refer to 2010, and for Brazil, France and South Africa to 2014
OECD Education at a Glance 2016
4
Share (%) of the population that have attained tertiary education (ISCED2011 levels 5 to 8), 25-34 year olds,
by gender, 2015 or latest available
0
10
20
30
40
50
60
70
80
Share (%) attained tertiary
education
Women Men
Gender gaps in labour force participation
are very different across the G20
Gender gaps and female labour force participation rates (15-64 year olds), 2015 or latest
available
Data for China refer to 2010 and for India to 2011-12
OECD Employment Database and OECD estimates based on national labour force surveys for Argentina and Saudi Arabia.
ARG
AUS
BRA
CAN
CHN
EU
FRA
DEU
IND
IDN
ITA
JPN
KOR
MEX
RUS
SAU
ZAF
ESP
TUR
GBR
USA
0
10
20
30
40
50
60
70
0 5 10 15 20 25 30 35 40 45 50 55 60 65 70 75 80
Gender gap in the labour
force participation rate
(15/16-16 year olds) (%)
Female labour force participation rate (15/16-64 year olds) (%)
5
Gender pay gaps are substantial
across the G20
Note: Data for India and South Africa refer to 2012, and for Korea and Turkey to 2013. Data refer to hourly wage for full time employees (working more than 30 hour per week in the
main job), except for India and South Africa for which they refer to monthly earnings of full-time employees.
Sources: OECD estimates based on EU-SILC for EU countries, Encuesta Permanente de Hogares for Argentina, Household, Income and Labour Dynamics for Australia, Labour force
Survey for Canada, Pesquisa Nacional por Amostra de Domicílio for Brazil, National labour force survey for Korea, Labour Force Survey for Japan, National Sample Survey for India,
National Labour Force Survey (Sakernas) for Indonesia, Encuesta Nacional de Ocupación y Empleo (ENOE) for Mexico, General Household Survey for South Africa, National Labour
Force Survey for Turkey and the Current Population Survey, ASEC Supplement for the United States.
Gender pay gap in median hourly wages, full-time employees, 2014 or latest available
-60%
-50%
-40%
-30%
-20%
-10%
0%
6
Around the G20, women do more
unpaid work
Gender gaps in paid and unpaid work (female minus male), in minutes per day, 15-64 year
olds, latest years
Data for Australia are for the over 15 year-olds. Reference years vary from country to country: Australia, 2006; Canada, 2010;
China, 2008; France, 2009; Germany, 2001 02; India, 1999; Italy, 2008 09; Japan, 2011; Korea, 2009; Mexico, 2009; South
Africa, 2010; Turkey, 2006; the United Kingdom, 2005; and the United States, 2014.
Source: OECD Gender Data Portal
7
-300
-200
-100
0
100
200
300
400
Minutes
Paid work Unpaid work Total work
Women
do more
Men do
more
The 2013 OECD Gender
Recommendation
• Superseded the 1980 OECD Declaration on Policies for the
Employment of Women
• Sets out policy measures that governments should consider:
• Promote good quality education for boys and girls and
gender equality in educational choices;
• Promote family-friendly policies and working conditions
and combat discrimination;
• Reduce the gender gap in entrepreneurship activity.
• Countries are called to reinforce the production of gender-
specific data and monitor progress
8
Women are less likely to study engineering,
manufacturing and construction
Source: OECD Education at a Glance 2015
Female share (%) of graduates in engineering, manufacturing and construction, all tertiary levels
(ISCED2011 levels 5 to 8), 2014 or latest available
9
0
10
20
30
40
50
60
Female share (%) of
graduates in engineering,
manufacturing and
construction
Public policy needs to do much more
for very young children…
Notes to Panel A: Data generally include children in centre-based services, organised day care and pre-school (both public and private) and those who are cared for by a
professional childminder. Exact definitions may however differ slightly across countries. Data for Mexico do not include services provided by the private sector. Data for Japan refer
to 2010, and for Australia, Mexico and the United States to 2011.
Notes to Panel B: Data include children enrolled in early childhood (pre-primary) education (ISCED2011 level 02) and, in countries where the entry age to primary school is 5 or
lower, primary education (ISCED2011 level 1). Data do not include children using services that are not classified as ISCED2011 level 02 or 1.
Source: OECD Family Database.
Participation in early childhood education and care, 2013 or latest year
10
0 20 40 60 80 100
France
United Kingdom
Korea
Australia
OECD average
Germany
United States
Japan
Italy
Mexico *
Panel A. Participation rates for 0-2 year olds in formal
childcare and pre-school services
0 20 40 60 80 100
France
Italy
United Kingdom
Germany
Korea
Japan
OECD average
Mexico
Russia
Australia
United States
Brazil
Turkey
Indonesia
Panel B. Enrollment rates for 3-5 year olds in pre-primary
or primary education (ISCED2011 levels 02 and 1)
… and so do fathers.
Note: Information refers to entitlements to paternity leave, 'father quotas' or periods of parental leave that can be used only by the father and cannot be transferred to the mother, and
any weeks of sharable leave that must be taken by the father or second parent in order for the family to qualify for 'bonus' weeks of parental leave. Information as of April 2015.
Source: OECD Family Database.
Duration of paid leave reserved for fathers (paid paternity leave and/or father-specific parental leave) in
weeks, 2015
11
0
10
20
30
40
50
60
Weeks
Gender gaps in entrepreneurship
The share of the employed who are employers is defined as the Number of self-employed who have employees as a proportion of total employed. Data for Brazil and South
Africa refer to 2013.
Source: OECD Gender Data Portal
Share (%) of employed who are employers, all ages, by gender, 2014 or latest available
0
1
2
3
4
5
6
7
8
9
Share (%) of employed who
are employers
Women Men
12
Promote gender quality in public and private
leadership - e.g. women in parliament
Data refer to share of women parliamentarians recorded as of 1 June 2016, and 25 October 25 2002. Data for South Africa do not include the 36 special rotating delegates
appointed on an ad hoc basis and refer to the 54 permanent seats only. Bars in light blue represent countries with lower or single house parliaments with legislated candidate
quotas and/or reserved seat quotas. Italy, India and South Africa do not have lower or single house parliaments with legislated candidate quotas and/or reserved seat quotas
but do have legislation requiring candidate quotas for sub-national elections. In Australia, Canada, Germany, Italy, South Africa, Turkey and the United Kingdom some political
parties operate voluntary party quotas.
Source: OECD Gender Review of Mexico (forthcoming) for OECD member countries; Inter-Parliamentary Union (IPU) PARLINE database and IDEA Quota Project for non-
OECD countries (accessed 15-09-2016).
Female share (%) of seats in lower or single house legislative bodies, 2002 and 2016
13
0
5
10
15
20
25
30
35
40
45
50
Female share (%) of seats
2016 2002
Making the case for gender equality
• The OECD suggested at the Sherpa level
to address gender issues, including in labor
market.
• OECD analysis was instrumental in
defining the G20 commitment on gender.
• The strategy was pursued at the
leaders/Sherpa level, and technical work
was advanced in the G20 Task Force on
Employment.
14
The “25% by 2025”target could have large
effects on labour supply and, thus, growth
Note: The “25-by-2025 (target)” scenario: male participation rates are projected based on average entry and exit rates for each five-year age group over the period 2003-2012;
female participation rates are projected so that the 2012 gap between male and female participation rates within each five-year age group falls by 25% by 2025. The “50-by-2025”
scenario: male participation rates are projected based on average entry and exit rates for each five-year age group over the period 2003-2012; female participation rates are
projected so that the 2012 gap between male and female participation rates within each five-year age group falls by 50% by 2025
Source: OECD estimates based on the OECD Population and Demography Database and the OECD Employment Database
Projected total size of the labour force (15-74 year olds) under different scenarios for the gender gap in
labour force participation, thousands, selected countries, 2012-2025
15
Baseline 25-by-2025 (target) 50-by-2025
57000
58000
59000
60000
61000
62000
63000
64000
65000
Japan
152000
154000
156000
158000
160000
162000
164000
166000
United States
The G20 Gender Target
• A major breakthrough In 2014, under the
Australian G20 presidency: Leaders
agreed to reduce the gender gap in
labour market participation rates by 25%
by 2025 and 11 policy principles to
improve the quality of employment.
16
• This objective could have a “double dividend”:
 A 100 million more women into the labour force.
 A positive impact on productivity.
• The OECD, with the ILO, were charged with implementing
this commitment which will help achieve the growth targets.
Progress is being made in many G20
countries
Note: The actual decline refers to the actual change in the gender gap between 2012 and 2015. The expected decline is calculated assuming a linear decline between 2012 and 2025
in the gender gap. For Argentina, the data for 2015 data refer to Q2 2015. No recent data are available for India or China to calculate the actual decline in the gender gap. For China,
the data for 2012 have been projected to calculate the expected decline in the gender gap.
Source: OECD calculations based on national labour force surveys.
Actual versus expected decline in gender participation gap, 2012-2015
-4
-3.5
-3
-2.5
-2
-1.5
-1
-0.5
0
0.5
1
1.5
%
Actual decline Expected decline
17
From Brisbane to Hamburg:
Keeping the momentum on gender equality in
the G20 (and the G7)
18
Brisbane G20 Summit (2014)
and the 25x25 target
G7 Dialogue for Women convened
by Chancellor Merkel, in Berlin, in
September 2015
G7 Schloss Elmau Summit
(June 2015) with a focus on
female entrepreneurship
• OECD will monitor the delivery of the gender target.
• As part of our broader mission to promote better policies for
better lives, in 2017 we will publish a report monitoring
progress on our Gender Recommendation.
• There are many other work: Recommendation of Gender
Equality in Public Life; Gendernet (Development Cooperation
Assistant; Index of Social Institutions and Gender Index (SIGI
OECD Development Center)
• Country work; Mexico, Austria, Pacific Alliance
Concluding remarks
19
Thank you - Further information
Contact: Gabriela.ramos@oecd.org
Follow me: @gabramosp
OECD Gender Data Portal
OECD Closing the Gender Gap - Act Now
www.oecd.org/gender
www.genderindex.org
www.oecd.org/dac/genderdevelopment/aboutgendernet
www.oecd.org/inclusive-growth
OECD Better Life Initiative
http://www.oecd.org/statistics/how-s-life-23089679.htm 20

Making Gender Targets Count: Time for G20 Leaders to Deliver

  • 1.
    MAKING GENDER TARGETSCOUNT: TIME FOR G20 LEADERS TO DELIVER Gabriela Ramos OECD Chief of Staff, Special Counsellor to the OECD Secretary-General, and Sherpa to the G20
  • 2.
    The economic case foraddressing the gender gap 2 2 Global GDP growth in 2016 is projected to be lower than 2015, with only a slight pick-up in 2017 World real GDP Note: World GDP measured at purchasing power parity exchange rates. Source: OECD Economic Outlook database.
  • 3.
    The economic case foraddressing the gender gap 3 Source: OECD June 2016 Economic Outlook database; OECD calculations. Contributions to potential output per capita growth in the OECD
  • 4.
    Nowadays, young womenare likely to be more highly educated than young men Data for China and Indonesia refer to 2010, and for Brazil, France and South Africa to 2014 OECD Education at a Glance 2016 4 Share (%) of the population that have attained tertiary education (ISCED2011 levels 5 to 8), 25-34 year olds, by gender, 2015 or latest available 0 10 20 30 40 50 60 70 80 Share (%) attained tertiary education Women Men
  • 5.
    Gender gaps inlabour force participation are very different across the G20 Gender gaps and female labour force participation rates (15-64 year olds), 2015 or latest available Data for China refer to 2010 and for India to 2011-12 OECD Employment Database and OECD estimates based on national labour force surveys for Argentina and Saudi Arabia. ARG AUS BRA CAN CHN EU FRA DEU IND IDN ITA JPN KOR MEX RUS SAU ZAF ESP TUR GBR USA 0 10 20 30 40 50 60 70 0 5 10 15 20 25 30 35 40 45 50 55 60 65 70 75 80 Gender gap in the labour force participation rate (15/16-16 year olds) (%) Female labour force participation rate (15/16-64 year olds) (%) 5
  • 6.
    Gender pay gapsare substantial across the G20 Note: Data for India and South Africa refer to 2012, and for Korea and Turkey to 2013. Data refer to hourly wage for full time employees (working more than 30 hour per week in the main job), except for India and South Africa for which they refer to monthly earnings of full-time employees. Sources: OECD estimates based on EU-SILC for EU countries, Encuesta Permanente de Hogares for Argentina, Household, Income and Labour Dynamics for Australia, Labour force Survey for Canada, Pesquisa Nacional por Amostra de Domicílio for Brazil, National labour force survey for Korea, Labour Force Survey for Japan, National Sample Survey for India, National Labour Force Survey (Sakernas) for Indonesia, Encuesta Nacional de Ocupación y Empleo (ENOE) for Mexico, General Household Survey for South Africa, National Labour Force Survey for Turkey and the Current Population Survey, ASEC Supplement for the United States. Gender pay gap in median hourly wages, full-time employees, 2014 or latest available -60% -50% -40% -30% -20% -10% 0% 6
  • 7.
    Around the G20,women do more unpaid work Gender gaps in paid and unpaid work (female minus male), in minutes per day, 15-64 year olds, latest years Data for Australia are for the over 15 year-olds. Reference years vary from country to country: Australia, 2006; Canada, 2010; China, 2008; France, 2009; Germany, 2001 02; India, 1999; Italy, 2008 09; Japan, 2011; Korea, 2009; Mexico, 2009; South Africa, 2010; Turkey, 2006; the United Kingdom, 2005; and the United States, 2014. Source: OECD Gender Data Portal 7 -300 -200 -100 0 100 200 300 400 Minutes Paid work Unpaid work Total work Women do more Men do more
  • 8.
    The 2013 OECDGender Recommendation • Superseded the 1980 OECD Declaration on Policies for the Employment of Women • Sets out policy measures that governments should consider: • Promote good quality education for boys and girls and gender equality in educational choices; • Promote family-friendly policies and working conditions and combat discrimination; • Reduce the gender gap in entrepreneurship activity. • Countries are called to reinforce the production of gender- specific data and monitor progress 8
  • 9.
    Women are lesslikely to study engineering, manufacturing and construction Source: OECD Education at a Glance 2015 Female share (%) of graduates in engineering, manufacturing and construction, all tertiary levels (ISCED2011 levels 5 to 8), 2014 or latest available 9 0 10 20 30 40 50 60 Female share (%) of graduates in engineering, manufacturing and construction
  • 10.
    Public policy needsto do much more for very young children… Notes to Panel A: Data generally include children in centre-based services, organised day care and pre-school (both public and private) and those who are cared for by a professional childminder. Exact definitions may however differ slightly across countries. Data for Mexico do not include services provided by the private sector. Data for Japan refer to 2010, and for Australia, Mexico and the United States to 2011. Notes to Panel B: Data include children enrolled in early childhood (pre-primary) education (ISCED2011 level 02) and, in countries where the entry age to primary school is 5 or lower, primary education (ISCED2011 level 1). Data do not include children using services that are not classified as ISCED2011 level 02 or 1. Source: OECD Family Database. Participation in early childhood education and care, 2013 or latest year 10 0 20 40 60 80 100 France United Kingdom Korea Australia OECD average Germany United States Japan Italy Mexico * Panel A. Participation rates for 0-2 year olds in formal childcare and pre-school services 0 20 40 60 80 100 France Italy United Kingdom Germany Korea Japan OECD average Mexico Russia Australia United States Brazil Turkey Indonesia Panel B. Enrollment rates for 3-5 year olds in pre-primary or primary education (ISCED2011 levels 02 and 1)
  • 11.
    … and sodo fathers. Note: Information refers to entitlements to paternity leave, 'father quotas' or periods of parental leave that can be used only by the father and cannot be transferred to the mother, and any weeks of sharable leave that must be taken by the father or second parent in order for the family to qualify for 'bonus' weeks of parental leave. Information as of April 2015. Source: OECD Family Database. Duration of paid leave reserved for fathers (paid paternity leave and/or father-specific parental leave) in weeks, 2015 11 0 10 20 30 40 50 60 Weeks
  • 12.
    Gender gaps inentrepreneurship The share of the employed who are employers is defined as the Number of self-employed who have employees as a proportion of total employed. Data for Brazil and South Africa refer to 2013. Source: OECD Gender Data Portal Share (%) of employed who are employers, all ages, by gender, 2014 or latest available 0 1 2 3 4 5 6 7 8 9 Share (%) of employed who are employers Women Men 12
  • 13.
    Promote gender qualityin public and private leadership - e.g. women in parliament Data refer to share of women parliamentarians recorded as of 1 June 2016, and 25 October 25 2002. Data for South Africa do not include the 36 special rotating delegates appointed on an ad hoc basis and refer to the 54 permanent seats only. Bars in light blue represent countries with lower or single house parliaments with legislated candidate quotas and/or reserved seat quotas. Italy, India and South Africa do not have lower or single house parliaments with legislated candidate quotas and/or reserved seat quotas but do have legislation requiring candidate quotas for sub-national elections. In Australia, Canada, Germany, Italy, South Africa, Turkey and the United Kingdom some political parties operate voluntary party quotas. Source: OECD Gender Review of Mexico (forthcoming) for OECD member countries; Inter-Parliamentary Union (IPU) PARLINE database and IDEA Quota Project for non- OECD countries (accessed 15-09-2016). Female share (%) of seats in lower or single house legislative bodies, 2002 and 2016 13 0 5 10 15 20 25 30 35 40 45 50 Female share (%) of seats 2016 2002
  • 14.
    Making the casefor gender equality • The OECD suggested at the Sherpa level to address gender issues, including in labor market. • OECD analysis was instrumental in defining the G20 commitment on gender. • The strategy was pursued at the leaders/Sherpa level, and technical work was advanced in the G20 Task Force on Employment. 14
  • 15.
    The “25% by2025”target could have large effects on labour supply and, thus, growth Note: The “25-by-2025 (target)” scenario: male participation rates are projected based on average entry and exit rates for each five-year age group over the period 2003-2012; female participation rates are projected so that the 2012 gap between male and female participation rates within each five-year age group falls by 25% by 2025. The “50-by-2025” scenario: male participation rates are projected based on average entry and exit rates for each five-year age group over the period 2003-2012; female participation rates are projected so that the 2012 gap between male and female participation rates within each five-year age group falls by 50% by 2025 Source: OECD estimates based on the OECD Population and Demography Database and the OECD Employment Database Projected total size of the labour force (15-74 year olds) under different scenarios for the gender gap in labour force participation, thousands, selected countries, 2012-2025 15 Baseline 25-by-2025 (target) 50-by-2025 57000 58000 59000 60000 61000 62000 63000 64000 65000 Japan 152000 154000 156000 158000 160000 162000 164000 166000 United States
  • 16.
    The G20 GenderTarget • A major breakthrough In 2014, under the Australian G20 presidency: Leaders agreed to reduce the gender gap in labour market participation rates by 25% by 2025 and 11 policy principles to improve the quality of employment. 16 • This objective could have a “double dividend”:  A 100 million more women into the labour force.  A positive impact on productivity. • The OECD, with the ILO, were charged with implementing this commitment which will help achieve the growth targets.
  • 17.
    Progress is beingmade in many G20 countries Note: The actual decline refers to the actual change in the gender gap between 2012 and 2015. The expected decline is calculated assuming a linear decline between 2012 and 2025 in the gender gap. For Argentina, the data for 2015 data refer to Q2 2015. No recent data are available for India or China to calculate the actual decline in the gender gap. For China, the data for 2012 have been projected to calculate the expected decline in the gender gap. Source: OECD calculations based on national labour force surveys. Actual versus expected decline in gender participation gap, 2012-2015 -4 -3.5 -3 -2.5 -2 -1.5 -1 -0.5 0 0.5 1 1.5 % Actual decline Expected decline 17
  • 18.
    From Brisbane toHamburg: Keeping the momentum on gender equality in the G20 (and the G7) 18 Brisbane G20 Summit (2014) and the 25x25 target G7 Dialogue for Women convened by Chancellor Merkel, in Berlin, in September 2015 G7 Schloss Elmau Summit (June 2015) with a focus on female entrepreneurship
  • 19.
    • OECD willmonitor the delivery of the gender target. • As part of our broader mission to promote better policies for better lives, in 2017 we will publish a report monitoring progress on our Gender Recommendation. • There are many other work: Recommendation of Gender Equality in Public Life; Gendernet (Development Cooperation Assistant; Index of Social Institutions and Gender Index (SIGI OECD Development Center) • Country work; Mexico, Austria, Pacific Alliance Concluding remarks 19
  • 20.
    Thank you -Further information Contact: Gabriela.ramos@oecd.org Follow me: @gabramosp OECD Gender Data Portal OECD Closing the Gender Gap - Act Now www.oecd.org/gender www.genderindex.org www.oecd.org/dac/genderdevelopment/aboutgendernet www.oecd.org/inclusive-growth OECD Better Life Initiative http://www.oecd.org/statistics/how-s-life-23089679.htm 20

Editor's Notes

  • #3 Context: - slow growth, weak recovery (low productivity growth, and half performing engines of trade and investment, slowing growth in the EMEs)
  • #4 Context: + Long term impact of the crisis: low level of investment, long-term unemployment (hysteresis effect) and reduced labour market participation, resulting in reduced potential output, i.e. the ability of our economies to grow over the LT. . Make the case for a bold policy response: Need to harness all sources of growth, including rasiing labour market participation by increasing women’s participation in the LM (=reducing the gender gap). This is the reason why the OECD pushed very hard to inject this dimension and called vigourously for concrete commitments (the target) from the G20 membership in this area.
  • #5 But let me start by providing an overview of the various dimensions and facts of this gender gap: First, in most OECD countries and in Many G20 countries young women now obtain a higher level of educational attainment than young men. In fact , in many OECD countries there are serious concerns about buys dropping out of school, while in other G20 economies, keeping adolescent girls in school remains a challenge.
  • #6 This chart shows how labour force participation rates differ across the G20 In Mexico, Turkey and India and Saudi Arabia , female labour force participation rates are below 50% and the gender gap ranges from 33% in Mexico to 58 percentage points in Saudi Arabia. In many European and North-American OECD economies about two-thirds of women of working-age is in the labour force, but in these countries the labour force participation gap with men is still around 10 to 20 percentage points. Furthermore, in a sense this chart underestimates the gap in the overall intensity of participation as women are more likely than men to work part-time, especially in some European countries. For example almost 4 out of 10 employment in Germany work on a part-time basis.
  • #7 Many other factors such as high rates of workforce withdrawal and career interruption among young and prime-age (i.e., childbearing age) women; low-paying jobs; gender segregation in occupation and sectors, the under-representation of women in senior management and on company boards, high levels of informality; attitudes and social institutions; and, discrimination, all contribute to the persistence of large gender pay gaps. The gender pay gap in terms of gross hourly wages, estimated at the median of the distribution, is higher in emerging economies compared to most OECD countries. India, Indonesia, Korea, Mexico and South Africa show pay gaps above 30%. Gender pay gaps in the OECD are 15% on average. Gender pay gaps are low in Italy and Turkey, but please remember that pay gaps only concern those that are in paid work: in Italy and Turkey many women with childcaring responsibilities are not in employment.
  • #8 Women are more involved in unpaid work (caring and household chores) everywhere, but the gender gap in unpaid work is larger than 3.5 hours per day in Italy, Japan, Turkey, Mexico and India.
  • #10 Across the OECD on average, young women make up 24% of graduates in engineering, manufacturing and construction. These outcomes are not so much linked to ability but more to attitudes: young girls, even when they are good at maths, have less self-confidence than boys in their own maths problem solving ability and girls often express strong feeling of anxiety towards mathematics. There is growing awareness of the importance of career opportunities in generating interest among students. Raising the profile of career opportunities and role models can help to promote greater gender equality in all fields of study. In the United States, the Department of Education’s “Race to the Top” programme prioritises improving STEM achievement overall and within under-represented groups – including women and girls – in awarding grants to states. TO help a more gender equal representation across fields of study OECD countries also have taken actions to review educational resources to avoid stereotyped representations, help teacher become aware of unconscious gender bias, and provide better information to boys and girls about educational pathways. With the evidence from OECD PISA work and OECD Education at a Glance in hand, the OECD continues to raise the issue also on the international leadership agenda: The OECD contributed to the G7 Ise-Shima Summit, and the Leadership declaration includes a commitment to empowering women and girls, including through capacity-building such as education and training as well as promoting the active role of women in Science, Technology, Engineering and Mathematics (STEM) fields.
  • #11 Employment patterns for men and woman often start to diverge when they become parents. Is it therefore so important that policy supports BOTH parents with balancing their work and family commitments. Access to childcare and out-of-school-hours care for children in primary school can help both parents, but in practice a lack of access is a significant determinant of mothers’ labour force participation. In most countries coverage for 3-5 year olds is quite high, but there are often serious gaps in coverage for younger children aged between 0 and 2. Germany, Korea and Mexico are among the G20 countries that have rolled out childcare supports over the past 10 years. In Mexico, the legislation of compulsory pre-primary education in 2002 led to an enormous increase in the number of three-to-five-year-olds enrolled in ECEC. Mexico’s introduction of the Programa de Estancias Infantiles para Apoyar a Madres Trabajaodras, in which at-home caregivers are subsidized to provide care for one-to-three-year-olds, offers a useful example of rapidly expanding childcare access at low cost, although caregiver quality remains a concern.
  • #12 More and more countries are introducing paid leave for fathers to incentivize them to contribute to childcare and changing behaviour around childbirth is most likely to have permanent effects. In view of low fertility, governments in Japan and Korea try to help both parents to combine work and family, and they have introduced individual entitlements to one year of leave for father. In 2014 Korea also introduced a so-called ‘Daddy Month’, whereby, when both parents take parental leave, the first month of the leave taken by the second parent (usually the father) is paid at 100% of earnings (as opposed 40% for the standard period). This ‘Daddy month’ period was extended to 3 months in 2016. Nevertheless in both countries only around 2% of fathers use the leave as they fear the career consequences and the reaction of their colleagues. Other examples of changes to paid leave reserved (or effectively reserved) for fathers since 2012 in G20-OECD member countries include Australia – which introduced ‘Dad and Partner Pay’ in 2013, providing fathers with up to two weeks of payments set at the level of the national minimum wage – and Turkey, which in 2015 introduced a statutory five-day paid paternity leave for working fathers. Since 2014, France has effectively reserved at least 6 months of parental leave payments for fathers (extending to up to 12 months for families with two or more children, and in addition to two weeks of paid paternity leave), but the parental leave payment rate is low. In North America, paid leave for fathers is available in California and New Jersey (6 weeks) and Rhode Island (4 weeks) and the Canadian province of Québec which has five-week paid paternity leave paid at 70% of earnings. Note: Other policy actions to strengthen gender equality in labour force participation include: designing tax-benefit systems so that both parents have broadly similar financial incentives to work Encouraging firms to support more flexibility in working arrangements for both men and women
  • #13 The gender gaps in entrepreneurship, are such that across countries men are generally twice as likely to employ staffers in their company than women. A mix of cultural and economic barriers generates differences in business ownership rates and entrepreneurial “success” of women and men. Stereotypes - such as the belief that entrepreneurship is a man’s job - and lower exposure of women to role models can explain why women report a lower interest in an entrepreneurial career, and often believe they are not capable to become successful entrepreneurs. Market failures . Women rely more heavily on internal than on external sources of capital for start-ups, and raise smaller amounts of capital for financing their activity. This can stifle the potential of their enterprises to innovate, develop new products and services, hire skilled employees, and grow and access international markets. Policy actions include: Ensure equal access to finance for women entrepreneurs: Reduce barriers to (female) entrepreneurship and administrative burden on firms Support training programs, awareness campaigns and networks for female entrepreneurs
  • #14 The OECD Gender Recommendation promotes measures that help women to pursue their career opportunities and enter positions of Leadership. Affirmative action measures such as gender quotas and parity principles are being used to accelerate women’s representation in all levels of government or as political candidates in various OECD countries and beyond. In Mexico, quotas and the subsequent introduction of the parity principle in Article 41 of the Federal Constitution have strongly influenced increasing women’s access to elected bodies, both at the federal and state level. However, Quota requirements in the electoral law are not sufficient to increase women’s representation in politics. Other measures laid out in the 2015 OECD Recommendation on Gender Equality in Public Life public life include ensuring women have leadership opportunities (e.g., participate in committee work as chairs) and have a gender-sensitive work environment. In getting women into any type of (public or private) leadership role, it is also important to fix holes in the “leaky pipeline” to ensure that well-qualified women can make it to the top – for example by providing childcare supports, flexible workplace practices, and reasonable work hours.
  • #15 In this context, characterized on the one hand by slow growth and reduced potential growth and on the other hand by a lingering under-utilisation of women’s skills and competences in the labour market, we worked hard to build with the G20 membership a powerful agenda aimed at reducing the gender gap in the labour market, focused on the achievement of a target, the 25 by 25; The US Sherpa asked the OECD , with the other institutions, to document how much gender participation would add to growth. We patiently built the case: the issue was indeed transferred to the WG on Employment of the G20 where our director for employment, Stefano Scarpetta, led the charge for the analytical substance and definitions, and convincing experts that it was not only necessary but possible (and even fighting the ILO which was not helpful). We had to show how the achievement of this target would contribute to reaching the Brisbane “2 in 5” objective which was the sort of cornerstone of the Australian Presidency in 2014. These efforts were supported by the US, by the Australian G20 Presidency, but also by Japanese Prime Minister Shinzo Abe, who unveiled domestic policies to encourage more women to return to work after the birth of their first child.
  • #16 As I said we provided very compelling evidences, including the growth dividend from closing the gender gap in participation rates. For the target setting on the gender gap in labour force participation by 25% by 2025, a baseline scenario was developed which accounts for changes in the labour force participation of men and women that are likely to occur in the future in the absence of any policy reforms. The baseline scenario does not assume fixed participation rates, but constant labour force entry and exit rates for 5-year age groups at their historical average over the period 2003-2012, and while in many there has been a trend increase in the participation of women, this did not apply the United States. The potential “growth dividend” from closing gender gaps in participation rates and boosting the size of the labour force could be substantial for many G20 countries. For example: JAPAN – Meeting the 25% by 2025 target could, by mitigating looming declines in the size of the labour force, potentially add 0.07 percentage points to the projected average annual rate of growth in GDP per capita for the period 2013-2025. Going further and halving the gender gap in labour force participation by 2025 could add 0.25 percentage points to projected average annual growth. Over the period as a whole, this extra annual growth could add, respectively, 1.0 and 3.9 percentage points in addition to the projected growth in Japanese GDP per capita predicted under the baseline. UNITED STATES - Meeting the 25% by 2025 target could, by preventing stagnation in the size of the U.S. labour force, potentially add 0.11 percentage points to the projected average annual rate of growth in GDP per capita for the period 2013-2025. Halving the gender gap in labour force participation by 2025 could add 0.22 percentage points to projected average annual growth. Over the period as a whole, this extra annual growth could add, respectively, 1.7 and 3.6 percentage points to the projected growth in U.S. GDP per capita already predicted under the baseline.
  • #17 In the end, we brought it then to the leaders table, when discussing the Communiqué in Brisbane, and we still had to fight hard, as there were Sherpas (including Mexico and China, that thought that this was not a leader's level subject). This is when we asked the Japanese to push hard, as he was empowered by his government. G20 members agreed to implement measures across a range of key policy areas, subject to national circumstances, including to (G20 LEMM Declaration, 2014): 1. Support lifelong access to education and training, matched with the needs of business and communities 2. Provide access to affordable and quality child care, paid parental leave, family-friendly work opportunities and conditions, and support for elderly care 3. Support women to pursue self-employment and become entrepreneurs, including through equal property rights, improved financial literacy, access to financial markets and advisory services 4. Widen access to services for women (in the formal or informal economies) in order to support their employment prospects and mobility, including tailored employment services, active labour market programmes and skills development opportunities 5. Address legal, regulatory, cultural and behavioural barriers to employment opportunities for women 6. Promote non-discriminatory practices at the workplace, including on pay and career progression 7. Extend social protections, especially to those in poor households or those working in the informal economy, including in regard to work safety, health services, pensions and income security 8. Improve work incentives, income support, other transfer payments and related forms of social security. 9. Enhance the female share of executive positions in the public and private sectors 10. Work with social partners to develop new employment opportunities for women 11. Collect and report timely data related to gender. These priorities were informed by ILO conventions and recommendations on equality of opportunity and treatment and the OECD Gender Recommendation.
  • #18 Since 2012, there has already been progress in reducing gender gaps in labour force participation across G20 countries, but much remains to be done to achieve the gender target by 2025. The average gender gap for countries with available data declined from 20.3% in 2012 to 19.6% in 2015. The greatest reductions (exceeding the rate of decline needed to meet the target) occurred in Japan (2.7 percentage points), Korea (1.7 p.p.), Germany (1.6 p.p.), Australia (1.3 p.p.) and Spain (1.2 p.p.). However, in some countries, where the gender gap was small it increased (the Russian Federation, Canada and the United States ), and the gap remains very large in others: over 50 percentage points in Saudi Arabia and India, 42 p.p. in Turkey, 35 p.p. in Mexico and 32 p.p. in Indonesia.
  • #19  At the G7 Summit in Elmau G7 leaders committed to increasing the number of women and girls technically and vocationally educated and trained in developing countries through G7 measures by one third (compared to “business as usual”) by 2030 (G7 leaders’ declaration p. 2 and p. 16; annex p. 1). The “G7 Forum  for Dialogue with Women” hosted by German Federal Chancellor Angela Merkel in Berlin on 16 September 2015 was a follow-up event to the G7 Schloss Elmau Summit where G7 leaders asked the OECD to monitor progress on promoting women’s entrepreneurship. Also: Japan’s chairmanship of the G7 focused on women in STEM: Women: “We commit to create a society where all women and girls are empowered and actively engaged for sustainable, inclusive and equitable economic growth. We commit to empowering women and girls, including through capacity-building such as education and training as well as promoting active role of women in Science, Technology, Engineering and Mathematics (STEM) fields. We endorse to the G7 Guiding Principles for Building the Capacity of Women and Girls as common guiding principles for our actions.” Launch of the launch a G7 initiative, Women’s Initiative in Developing STEM Career (WINDS), to catalyze global momentum to promote the advancement of women in STEM fields and careers, in partnership with the OECD, UNWomen, and other international agencies and stakeholders. - Italy and Germany will also put much emphasis on gender issues this in the context of their presidencies of the G7 and G20 resp.