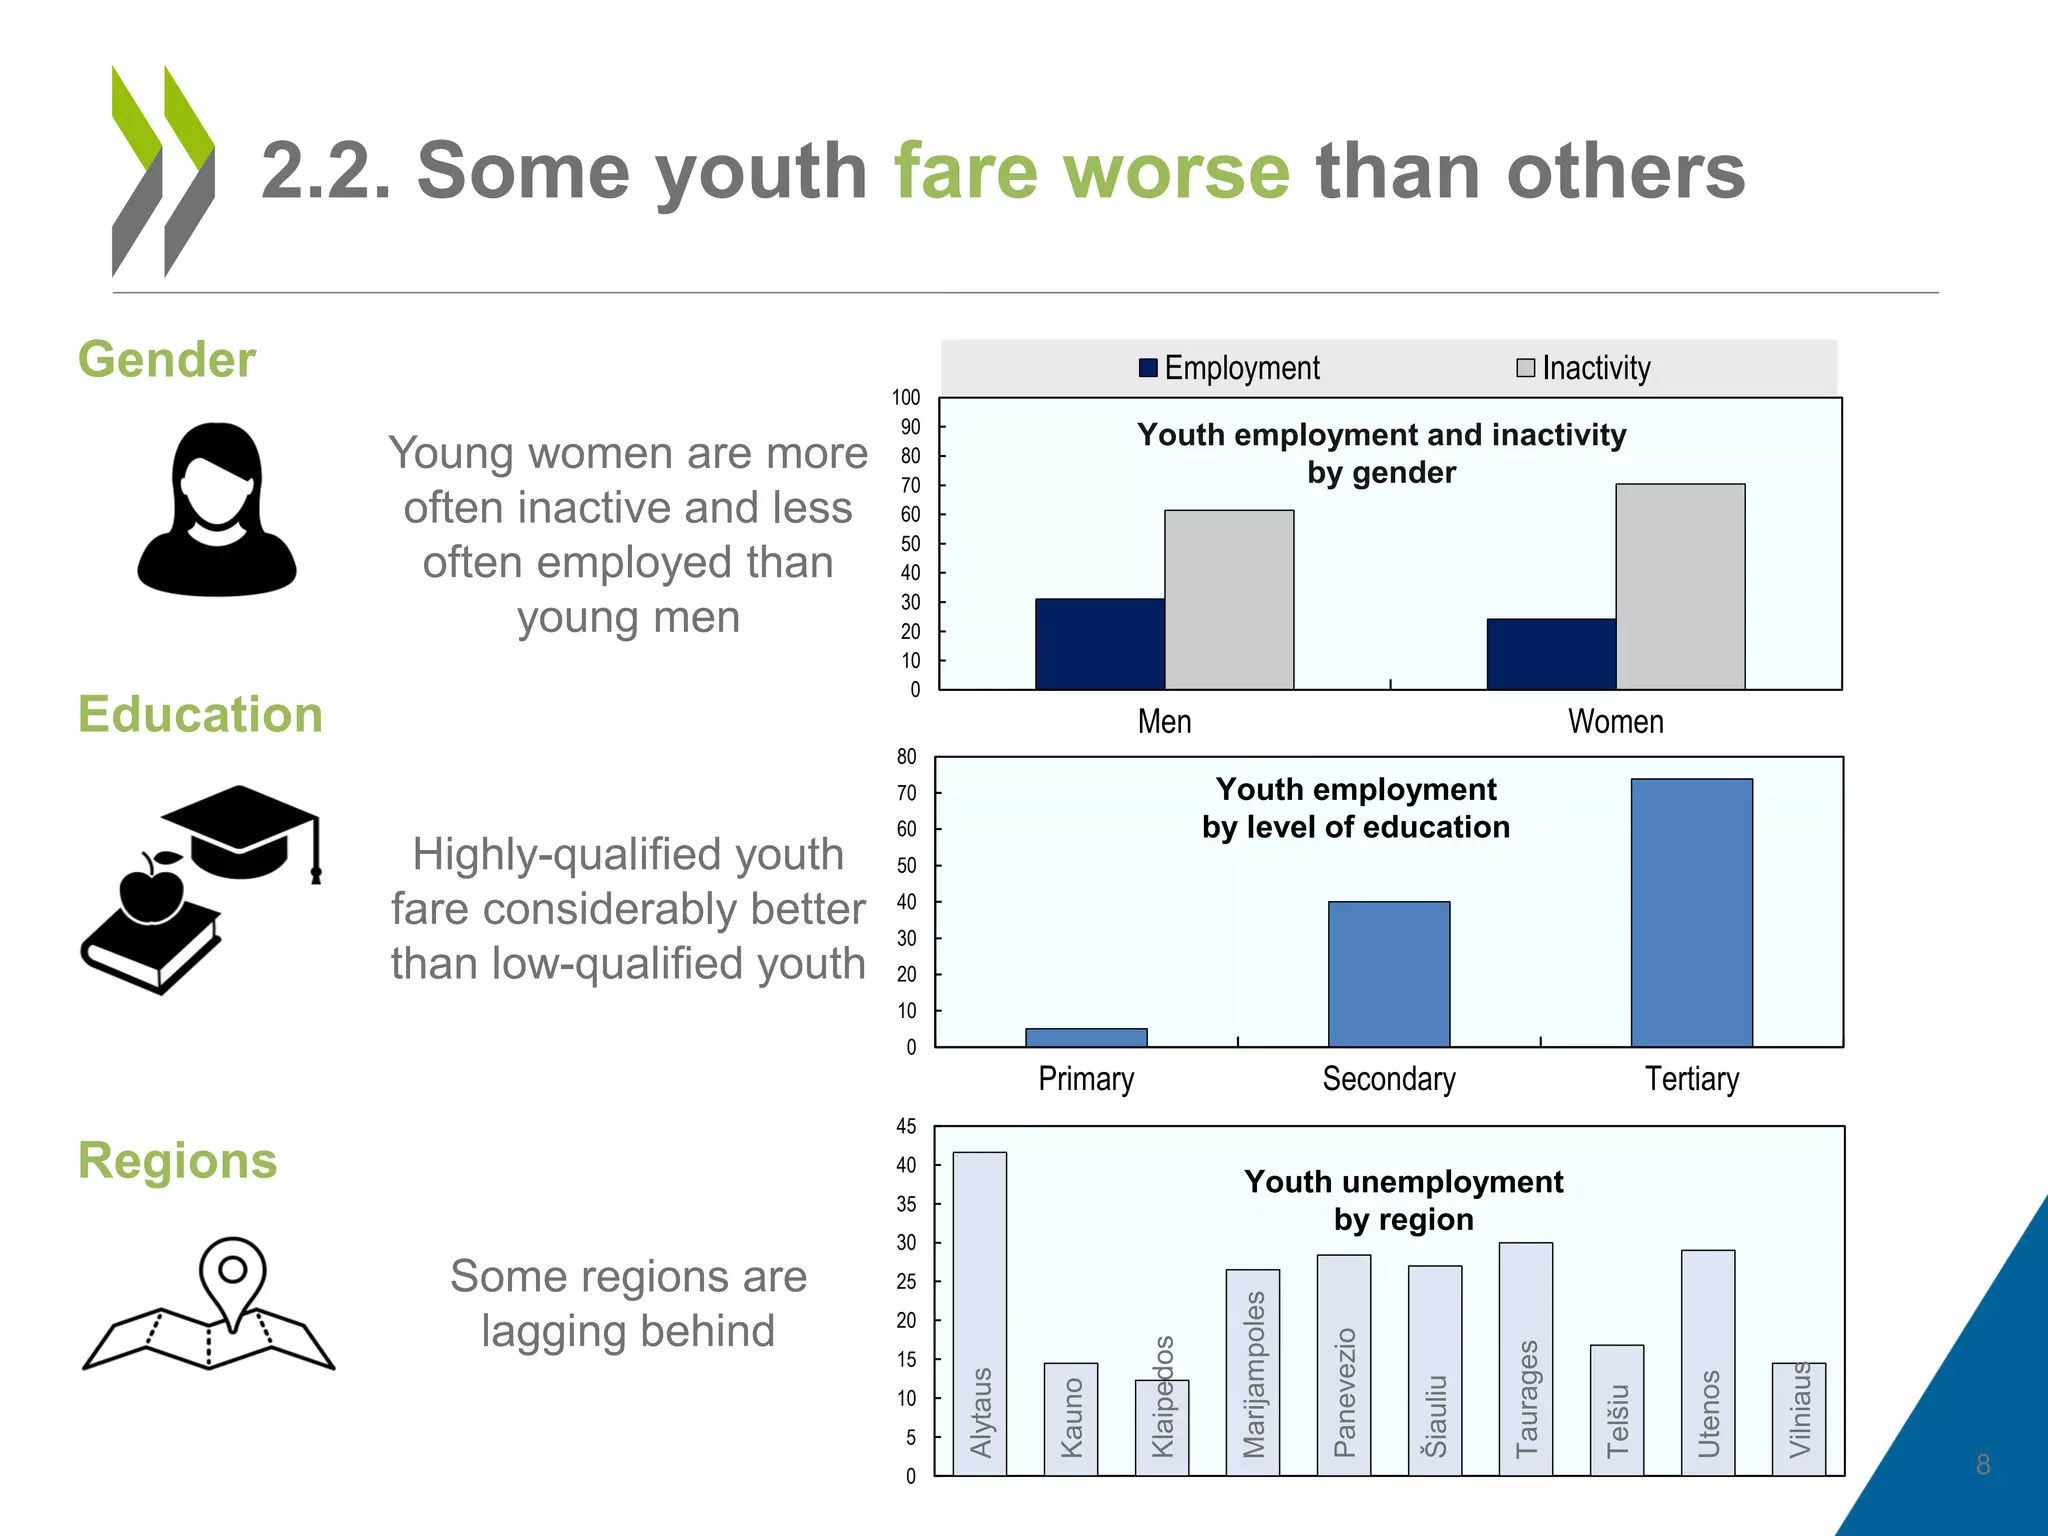
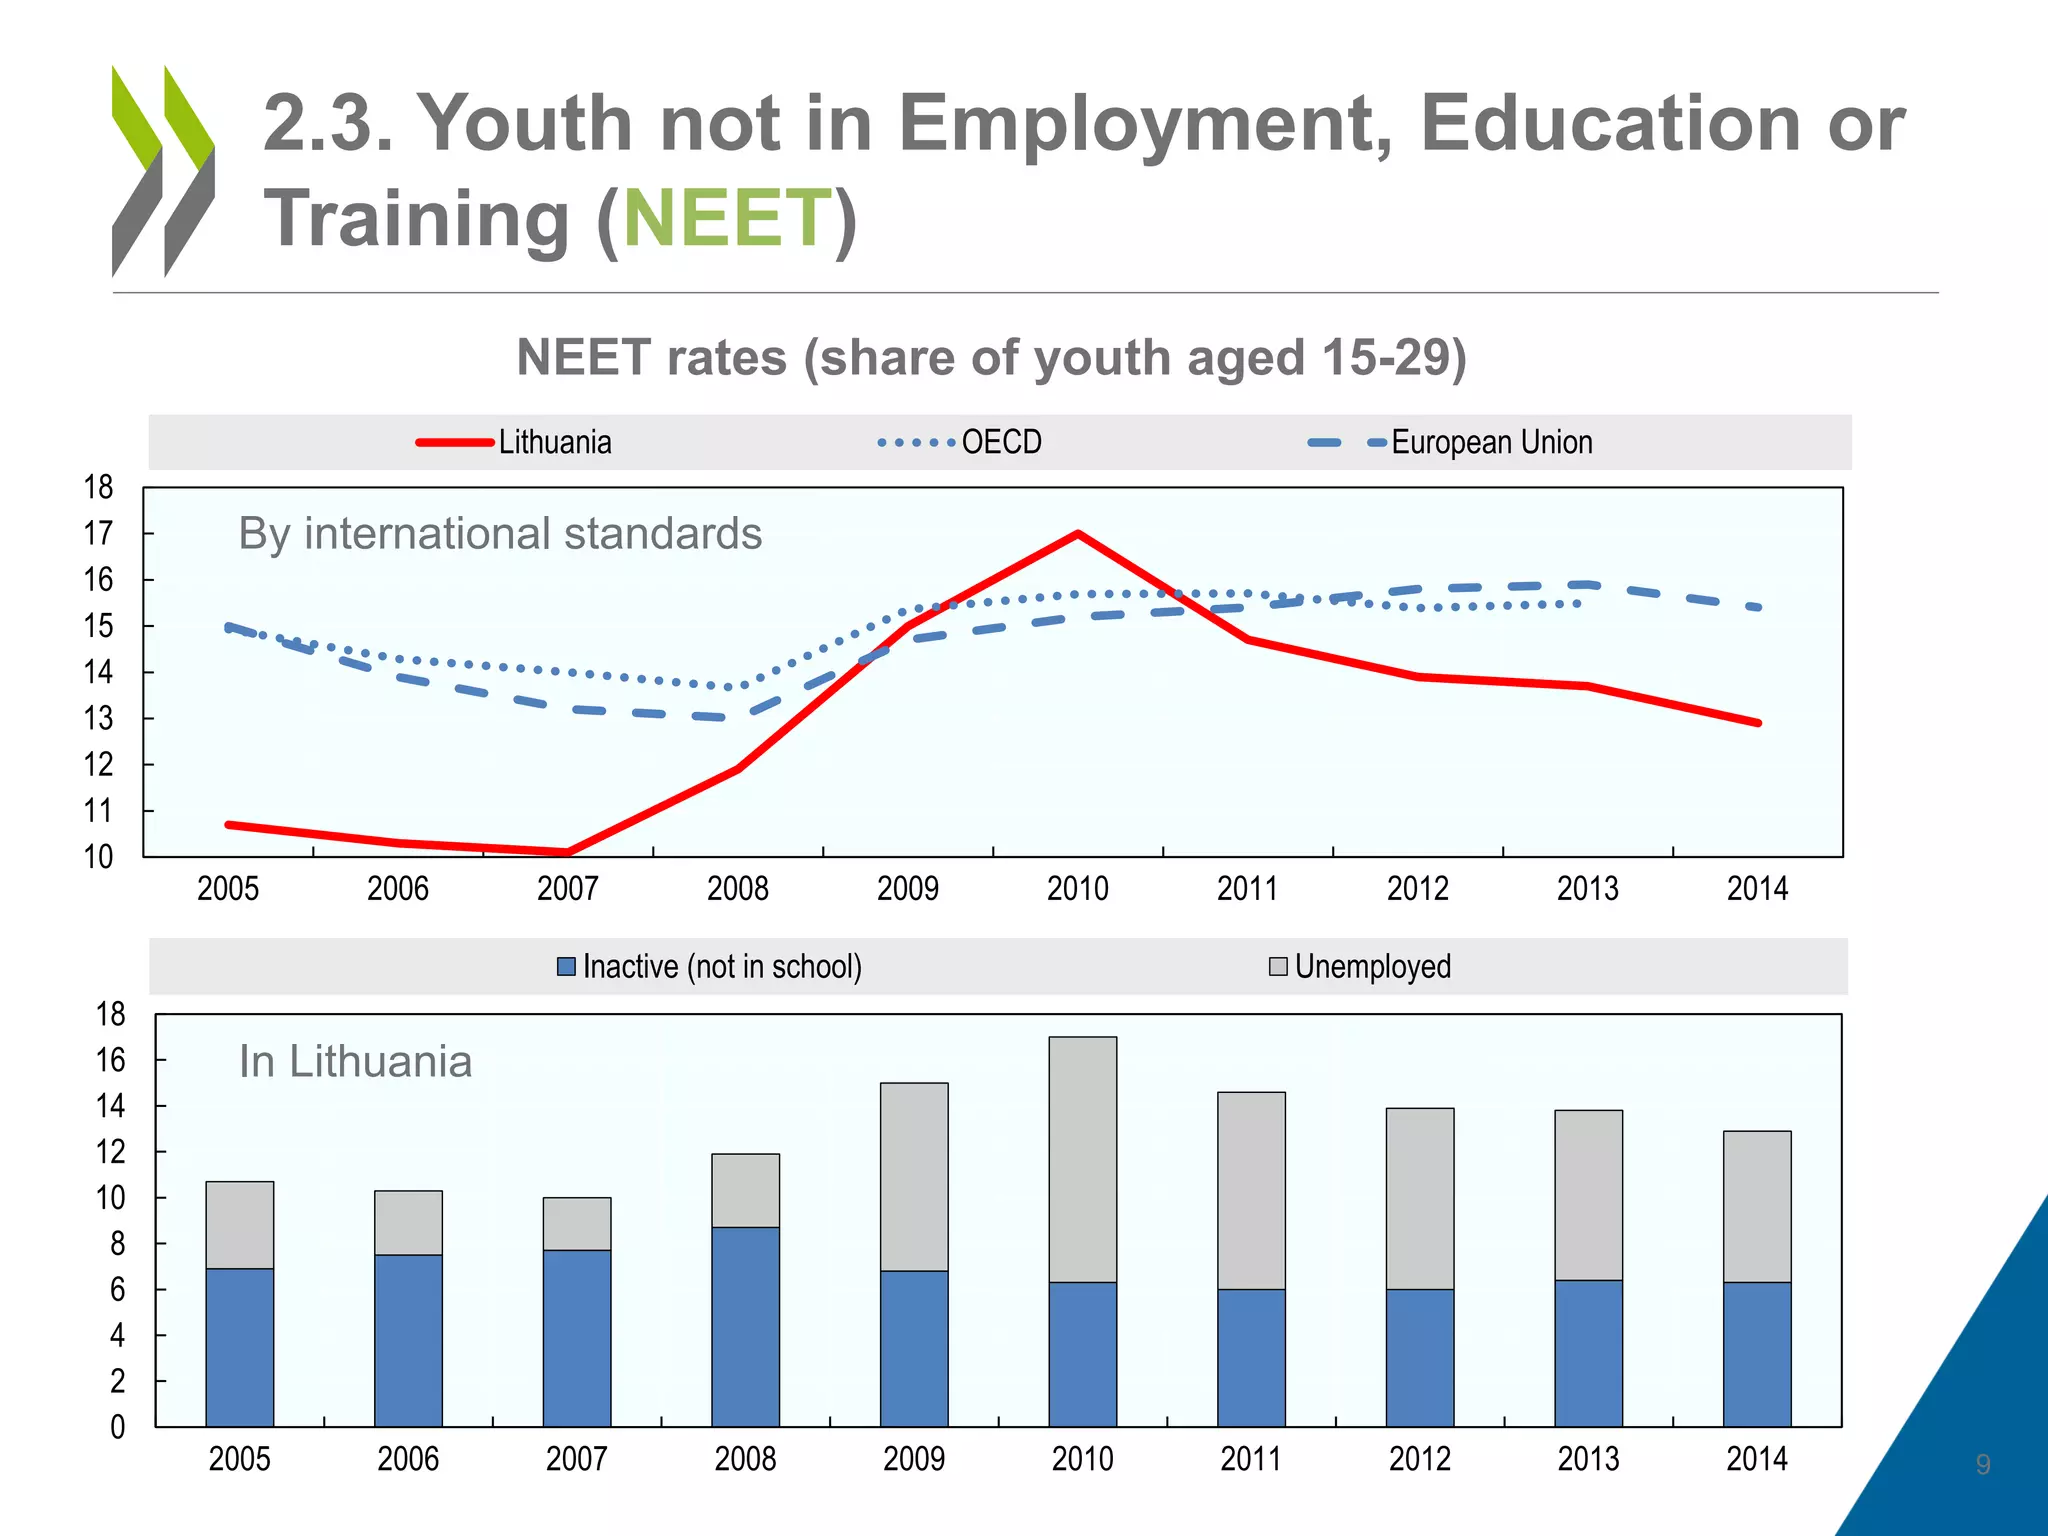
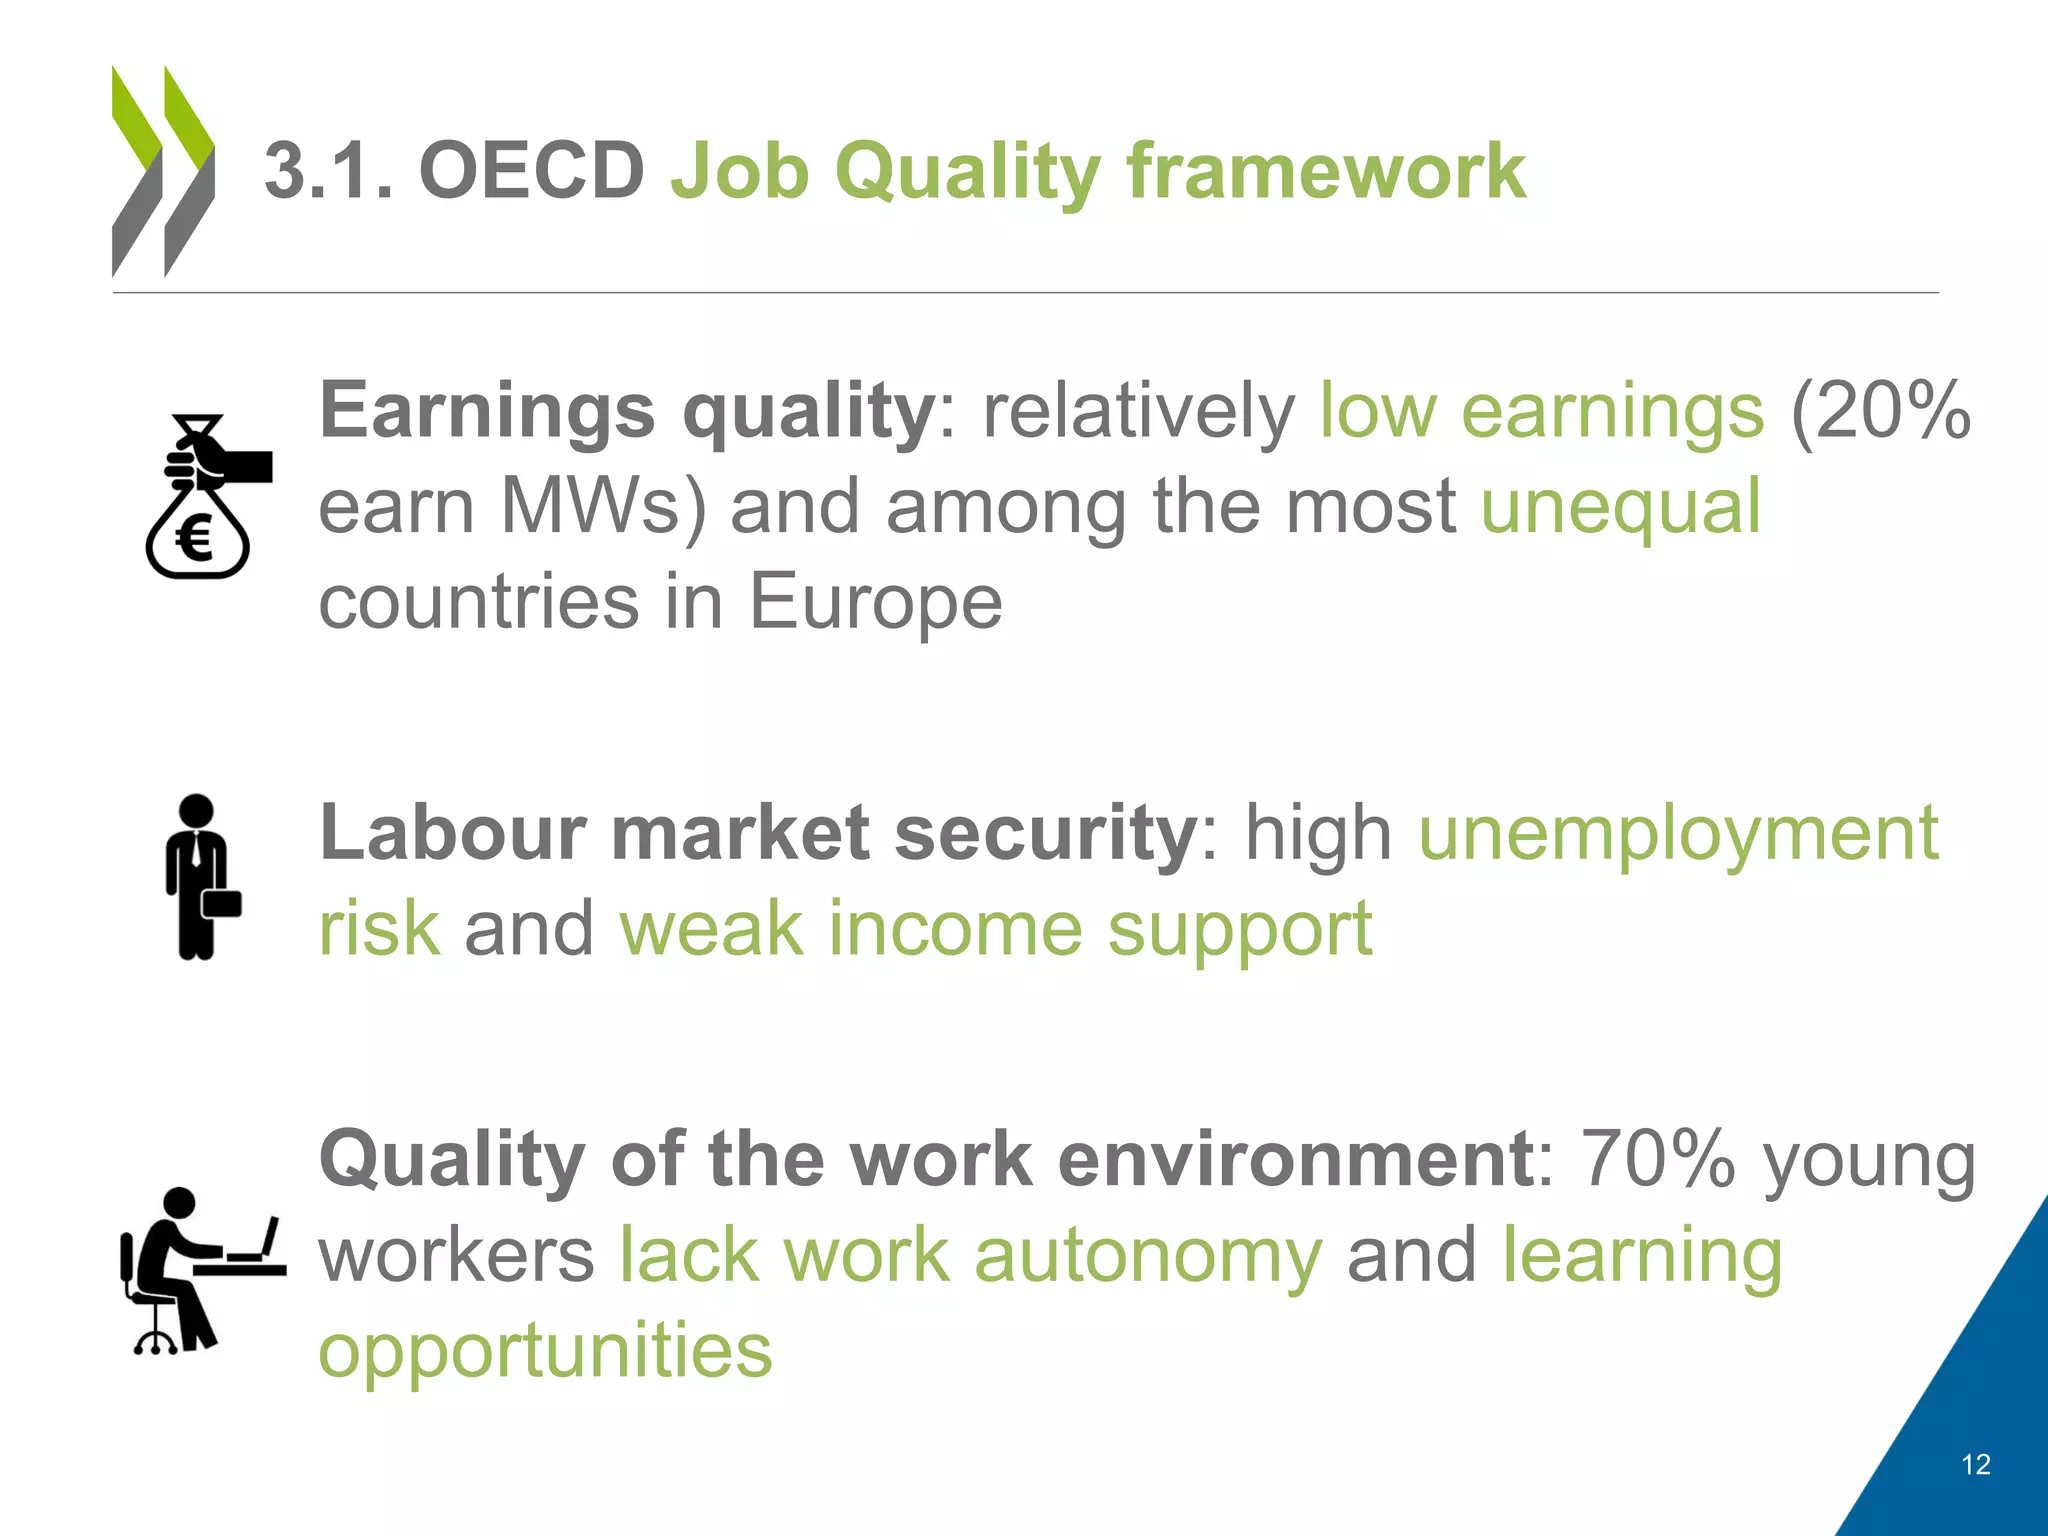
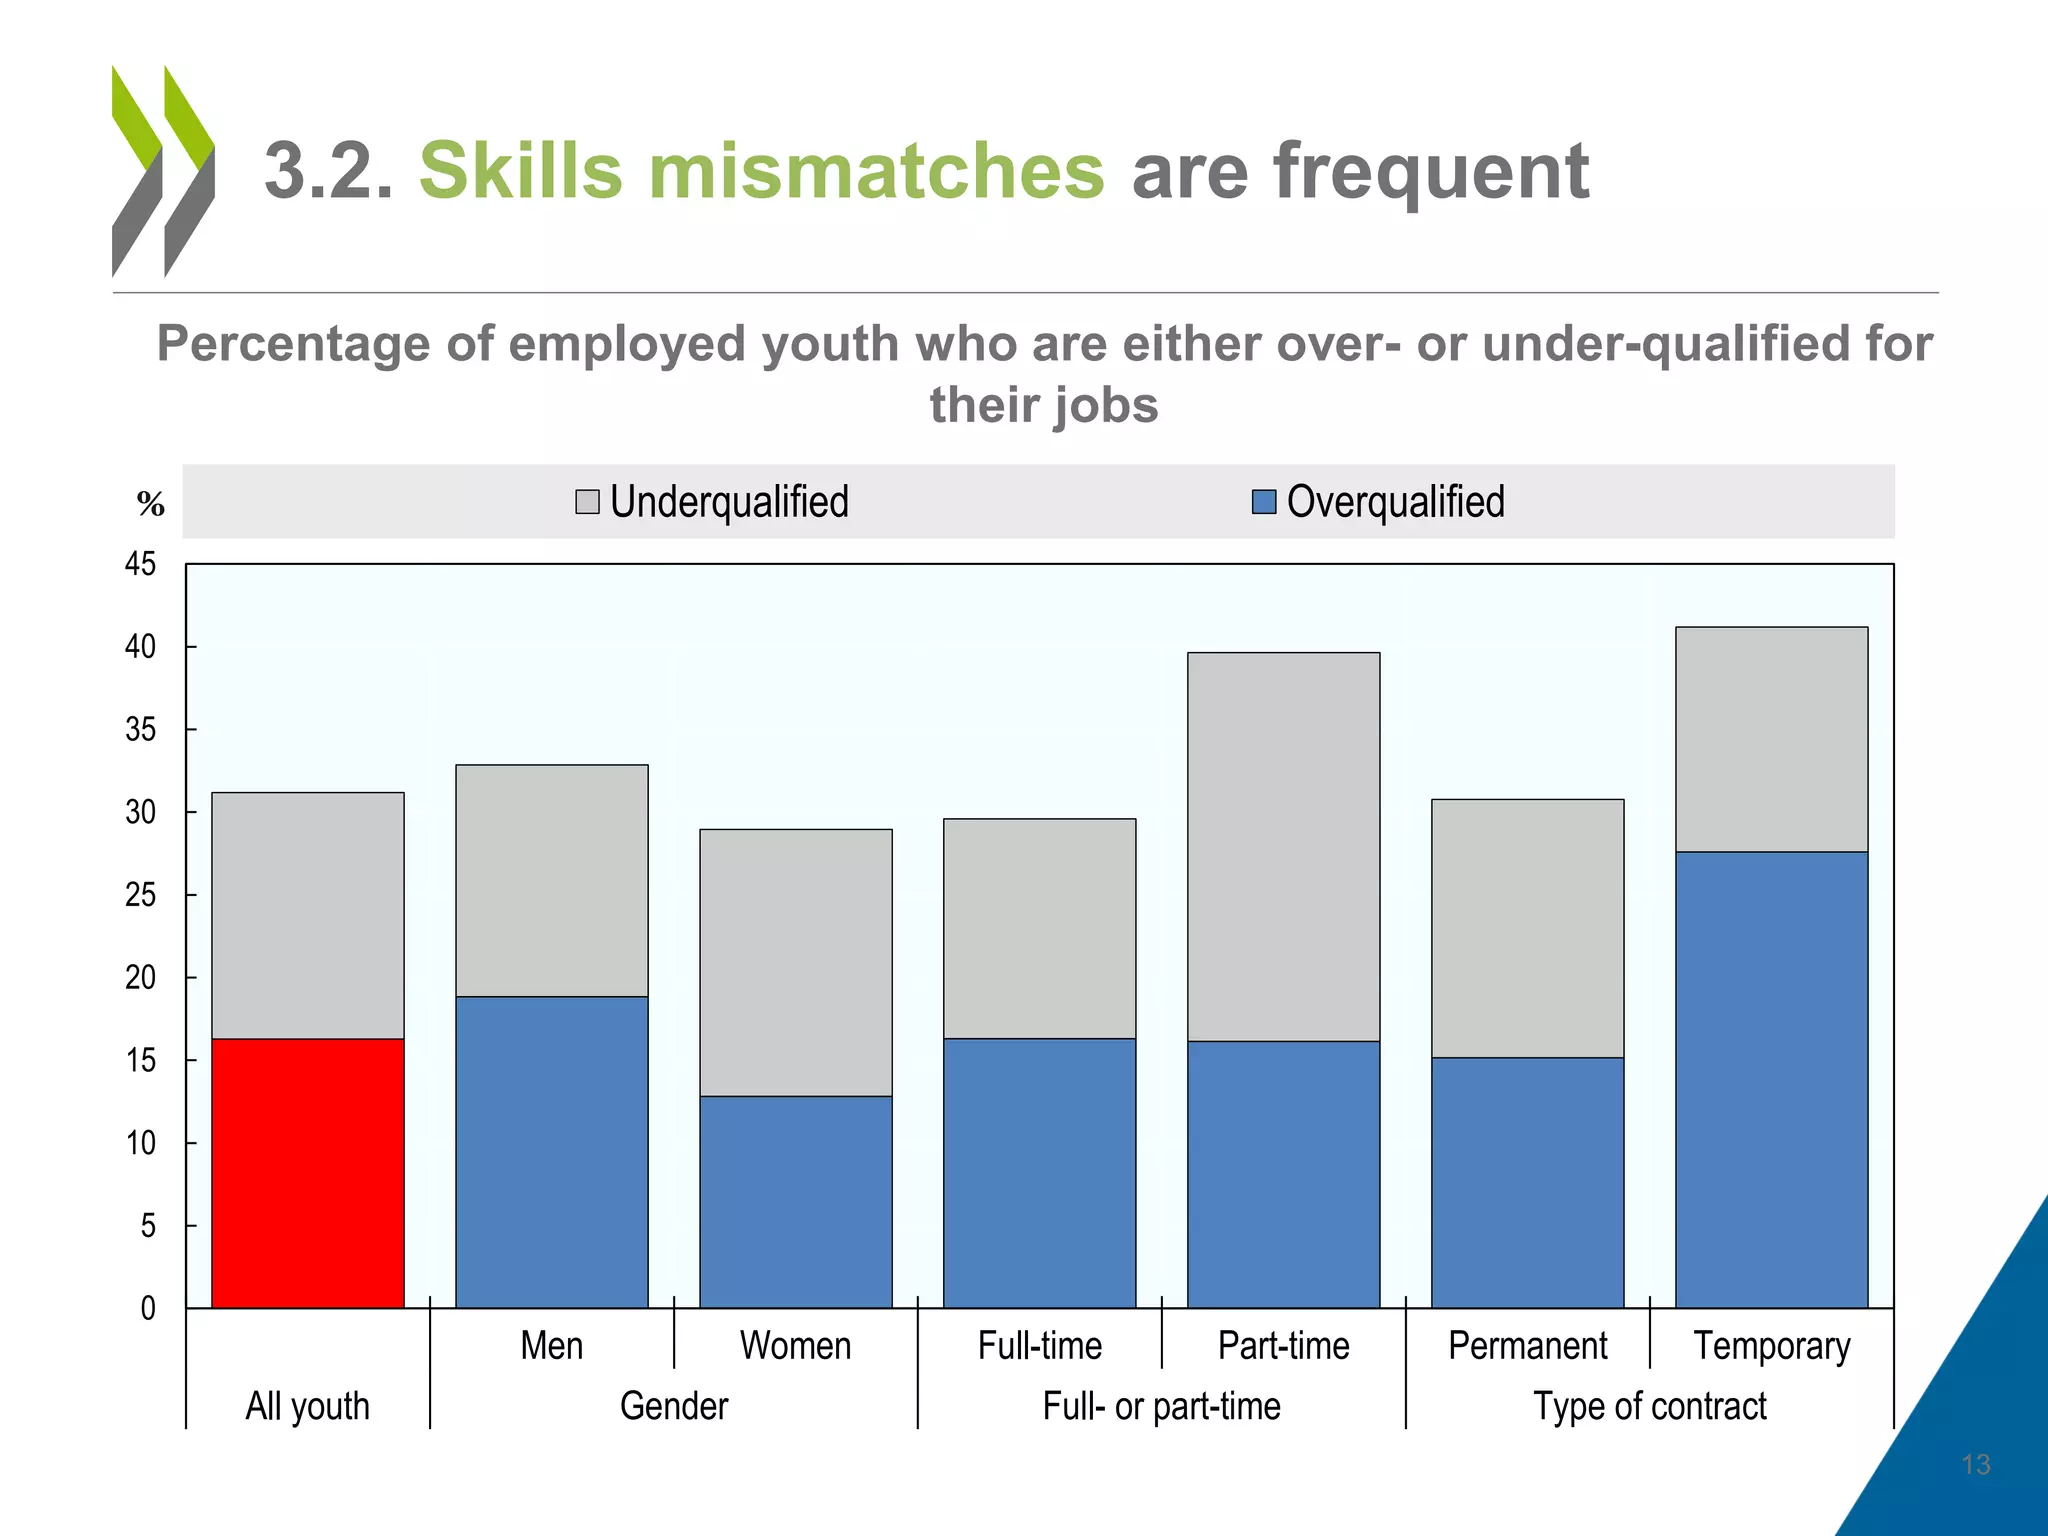
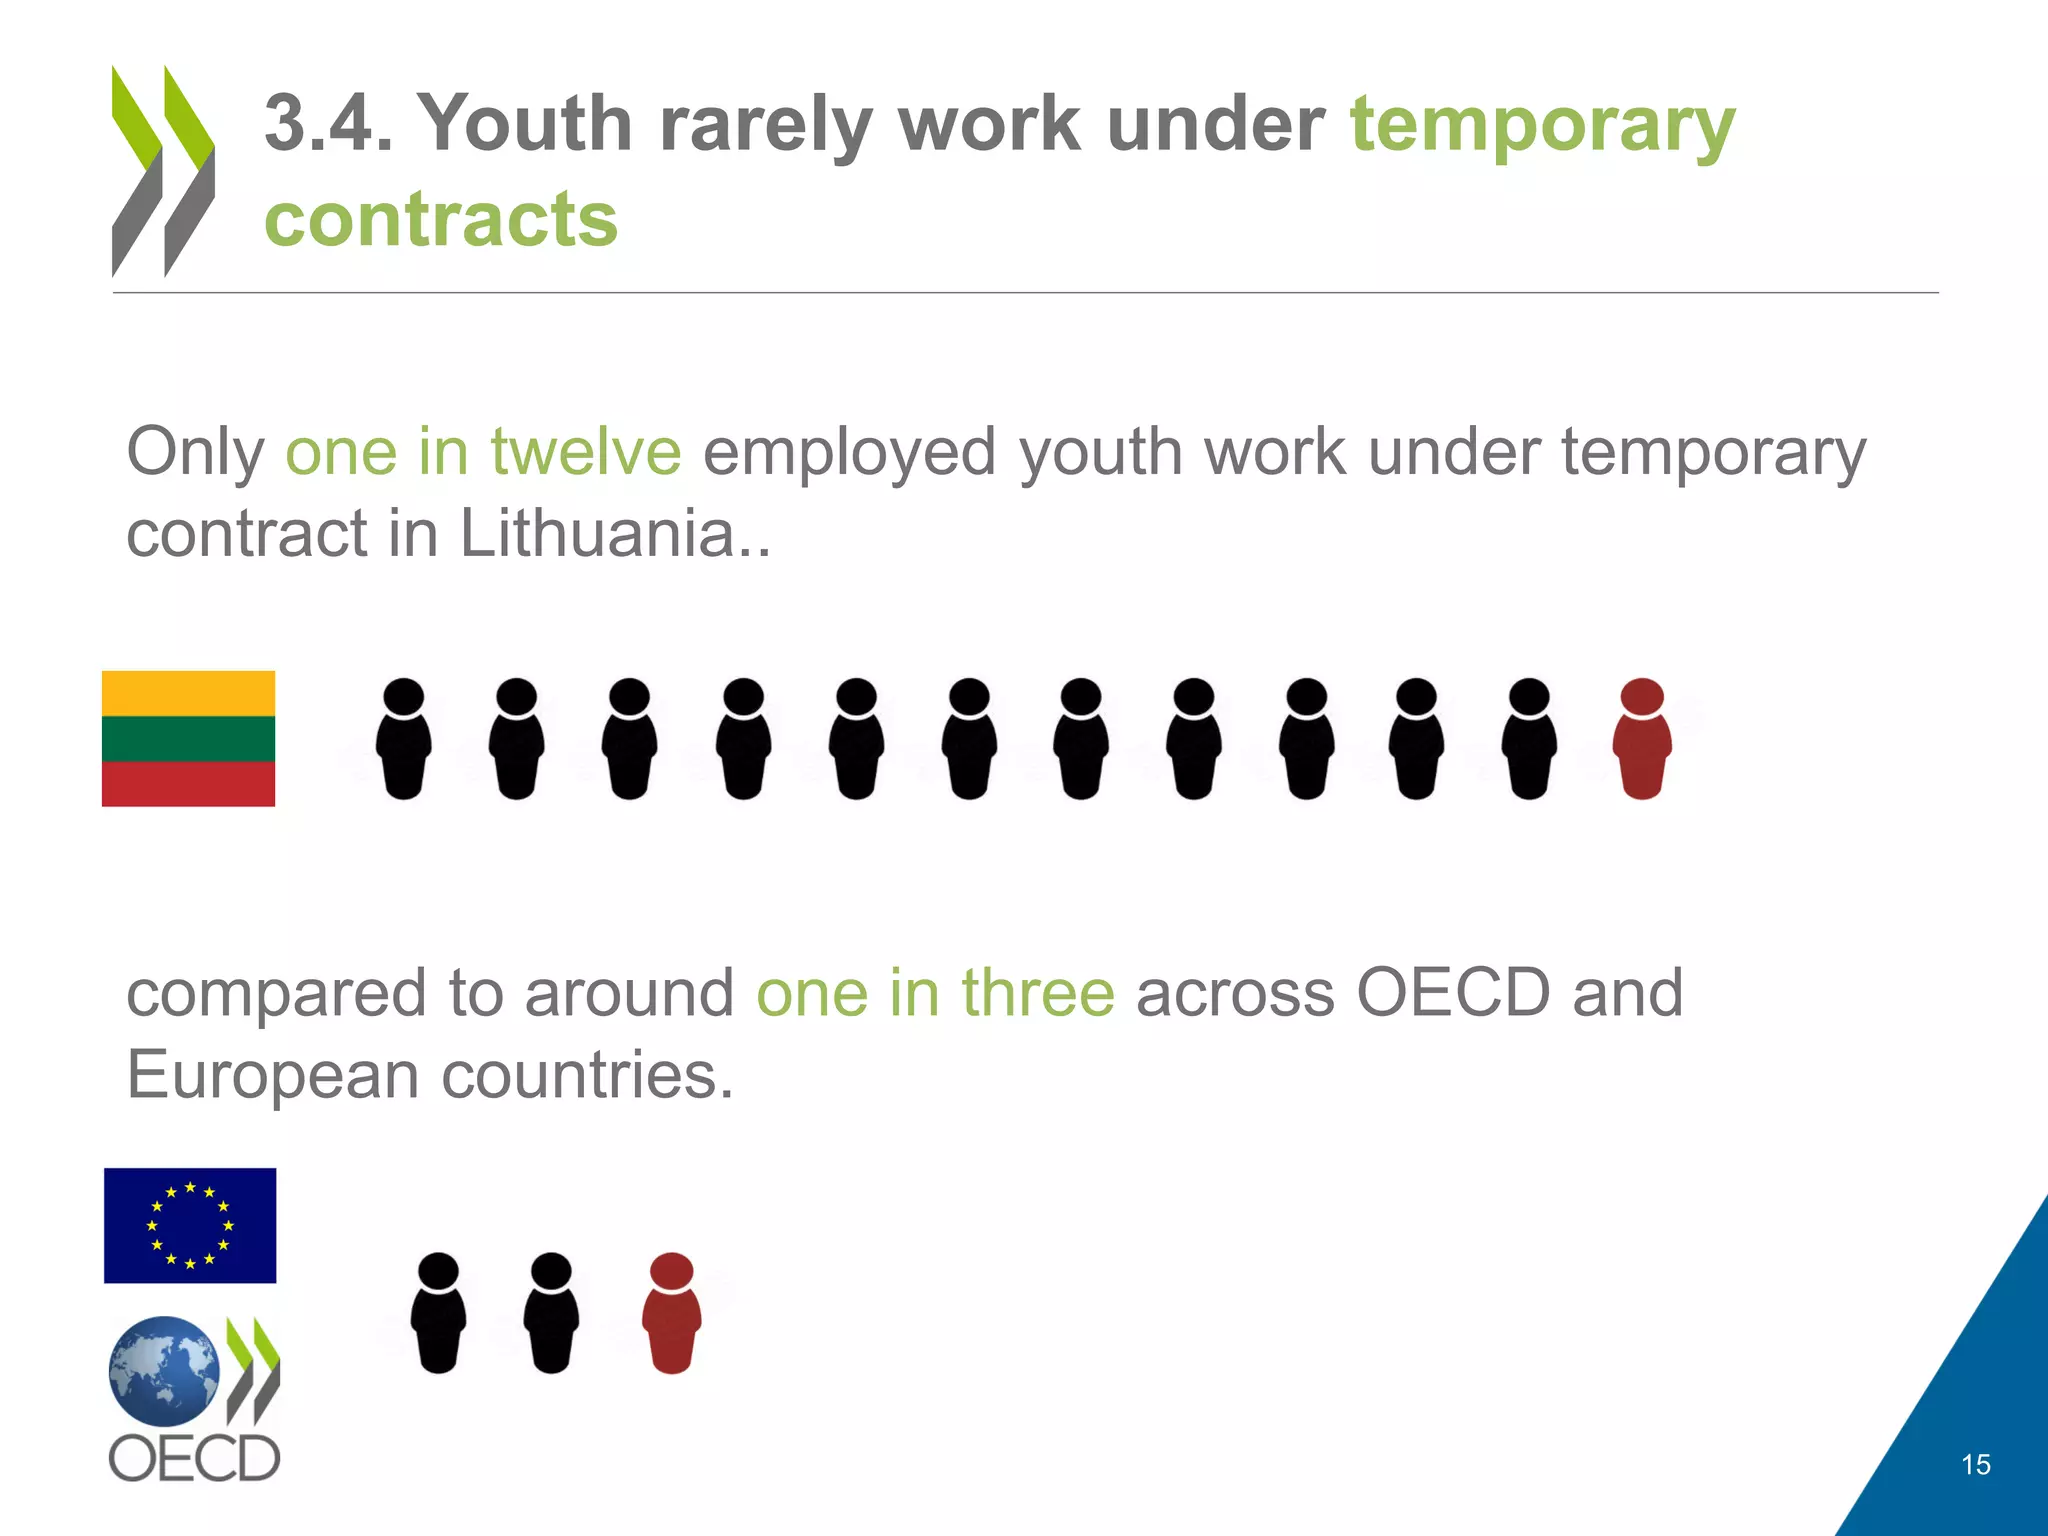
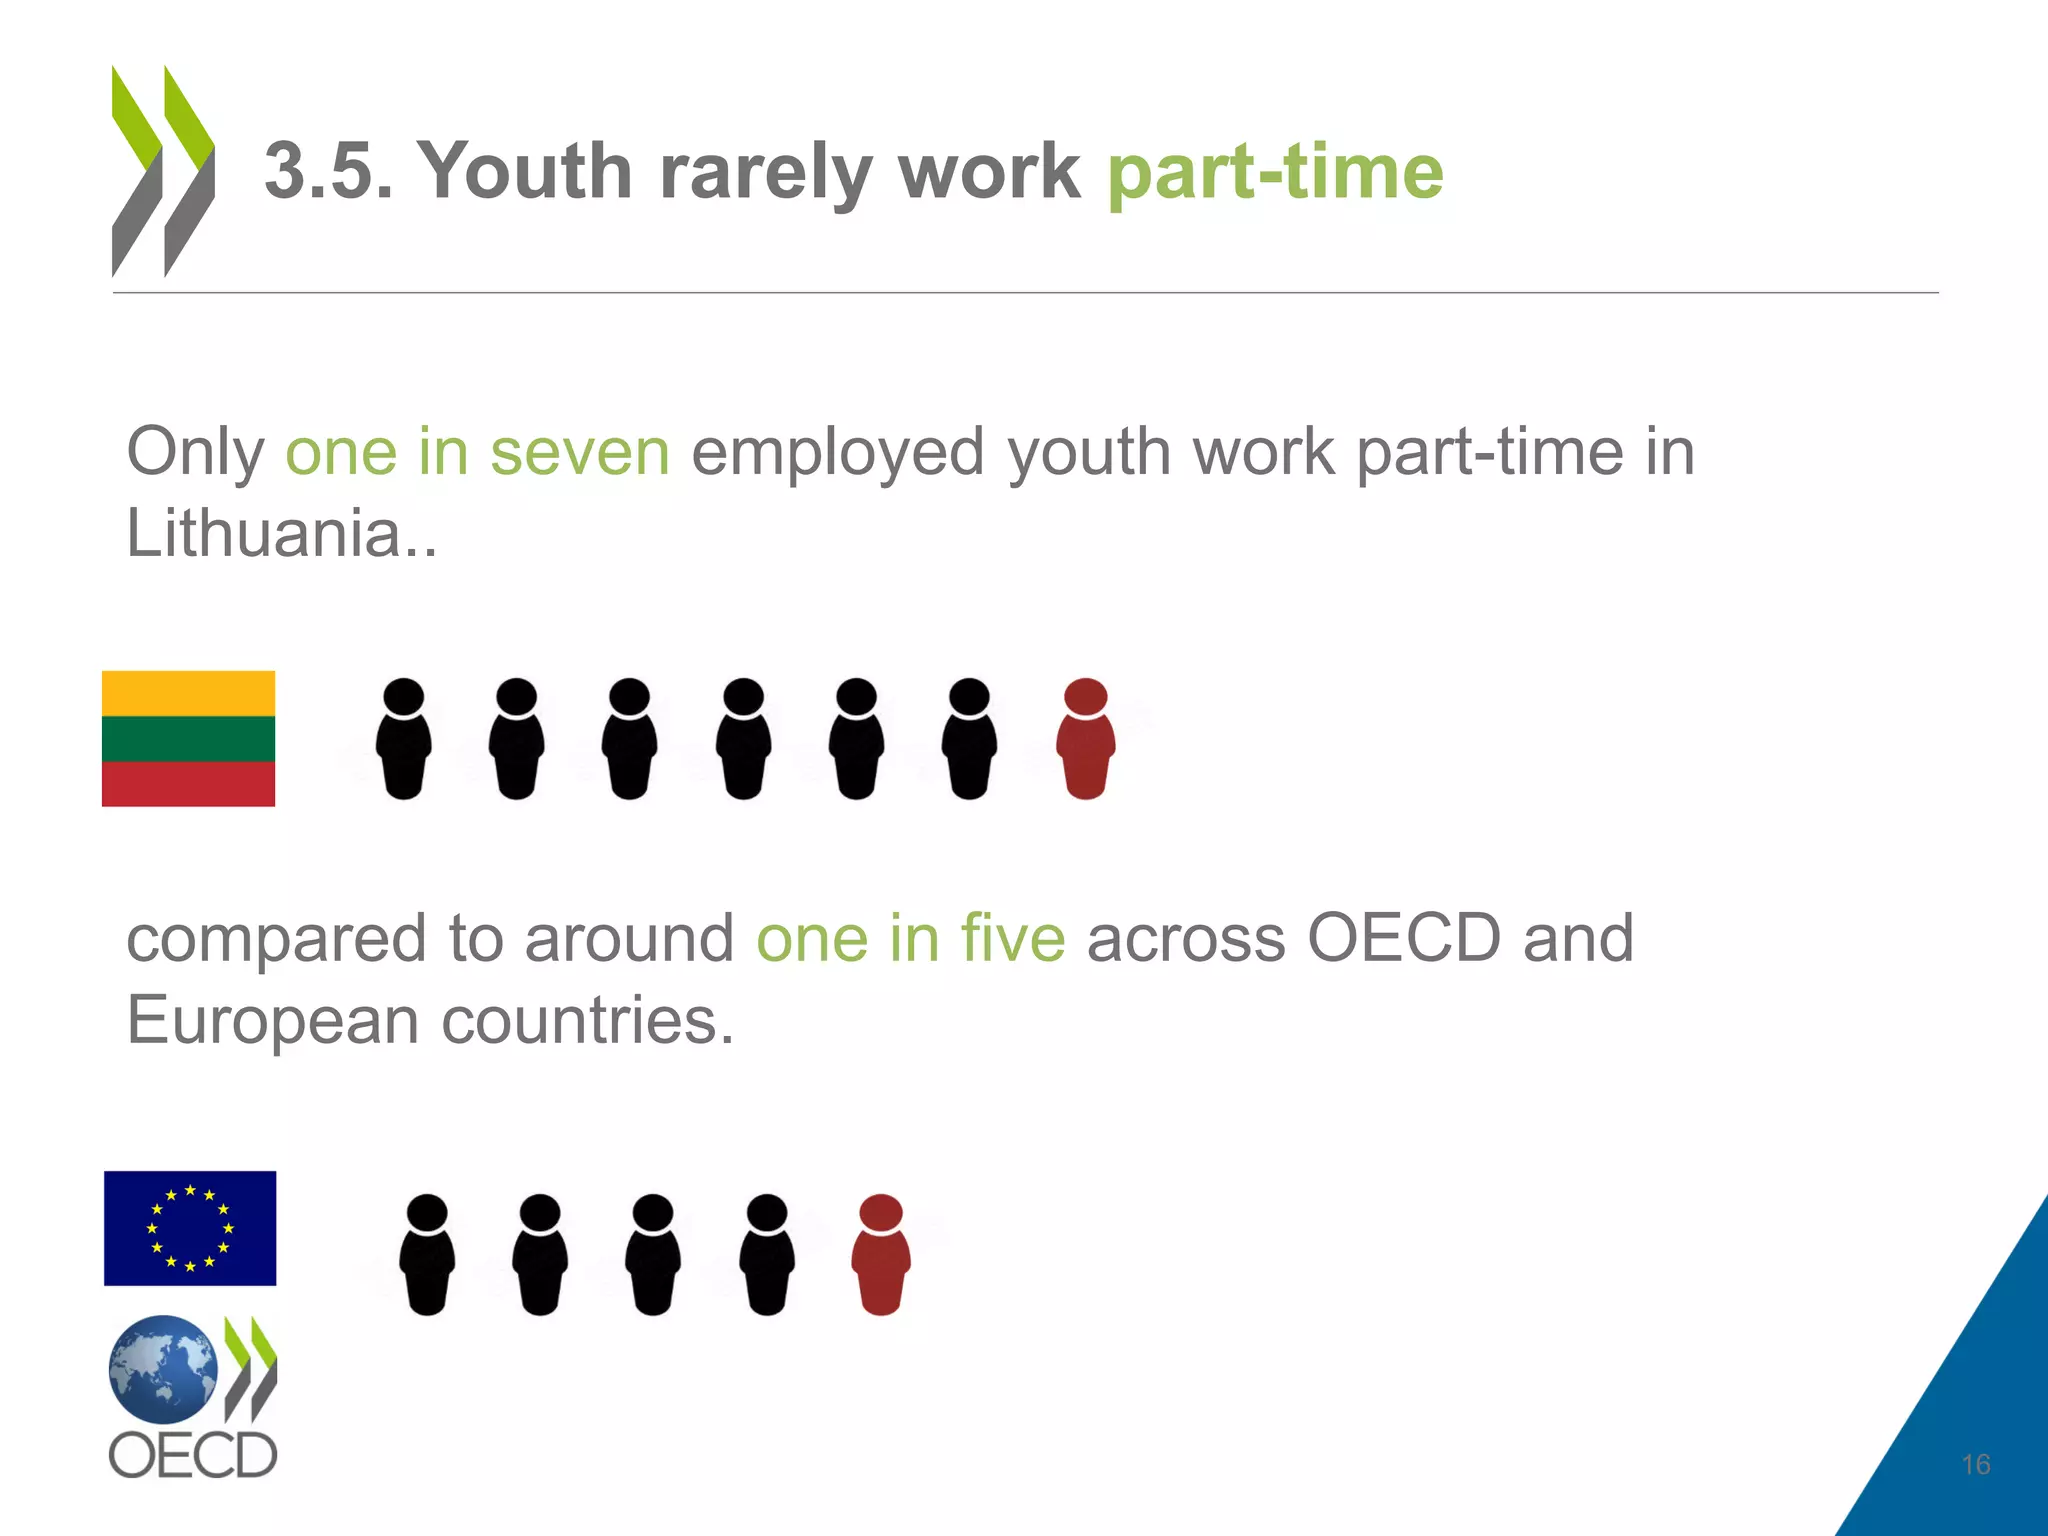
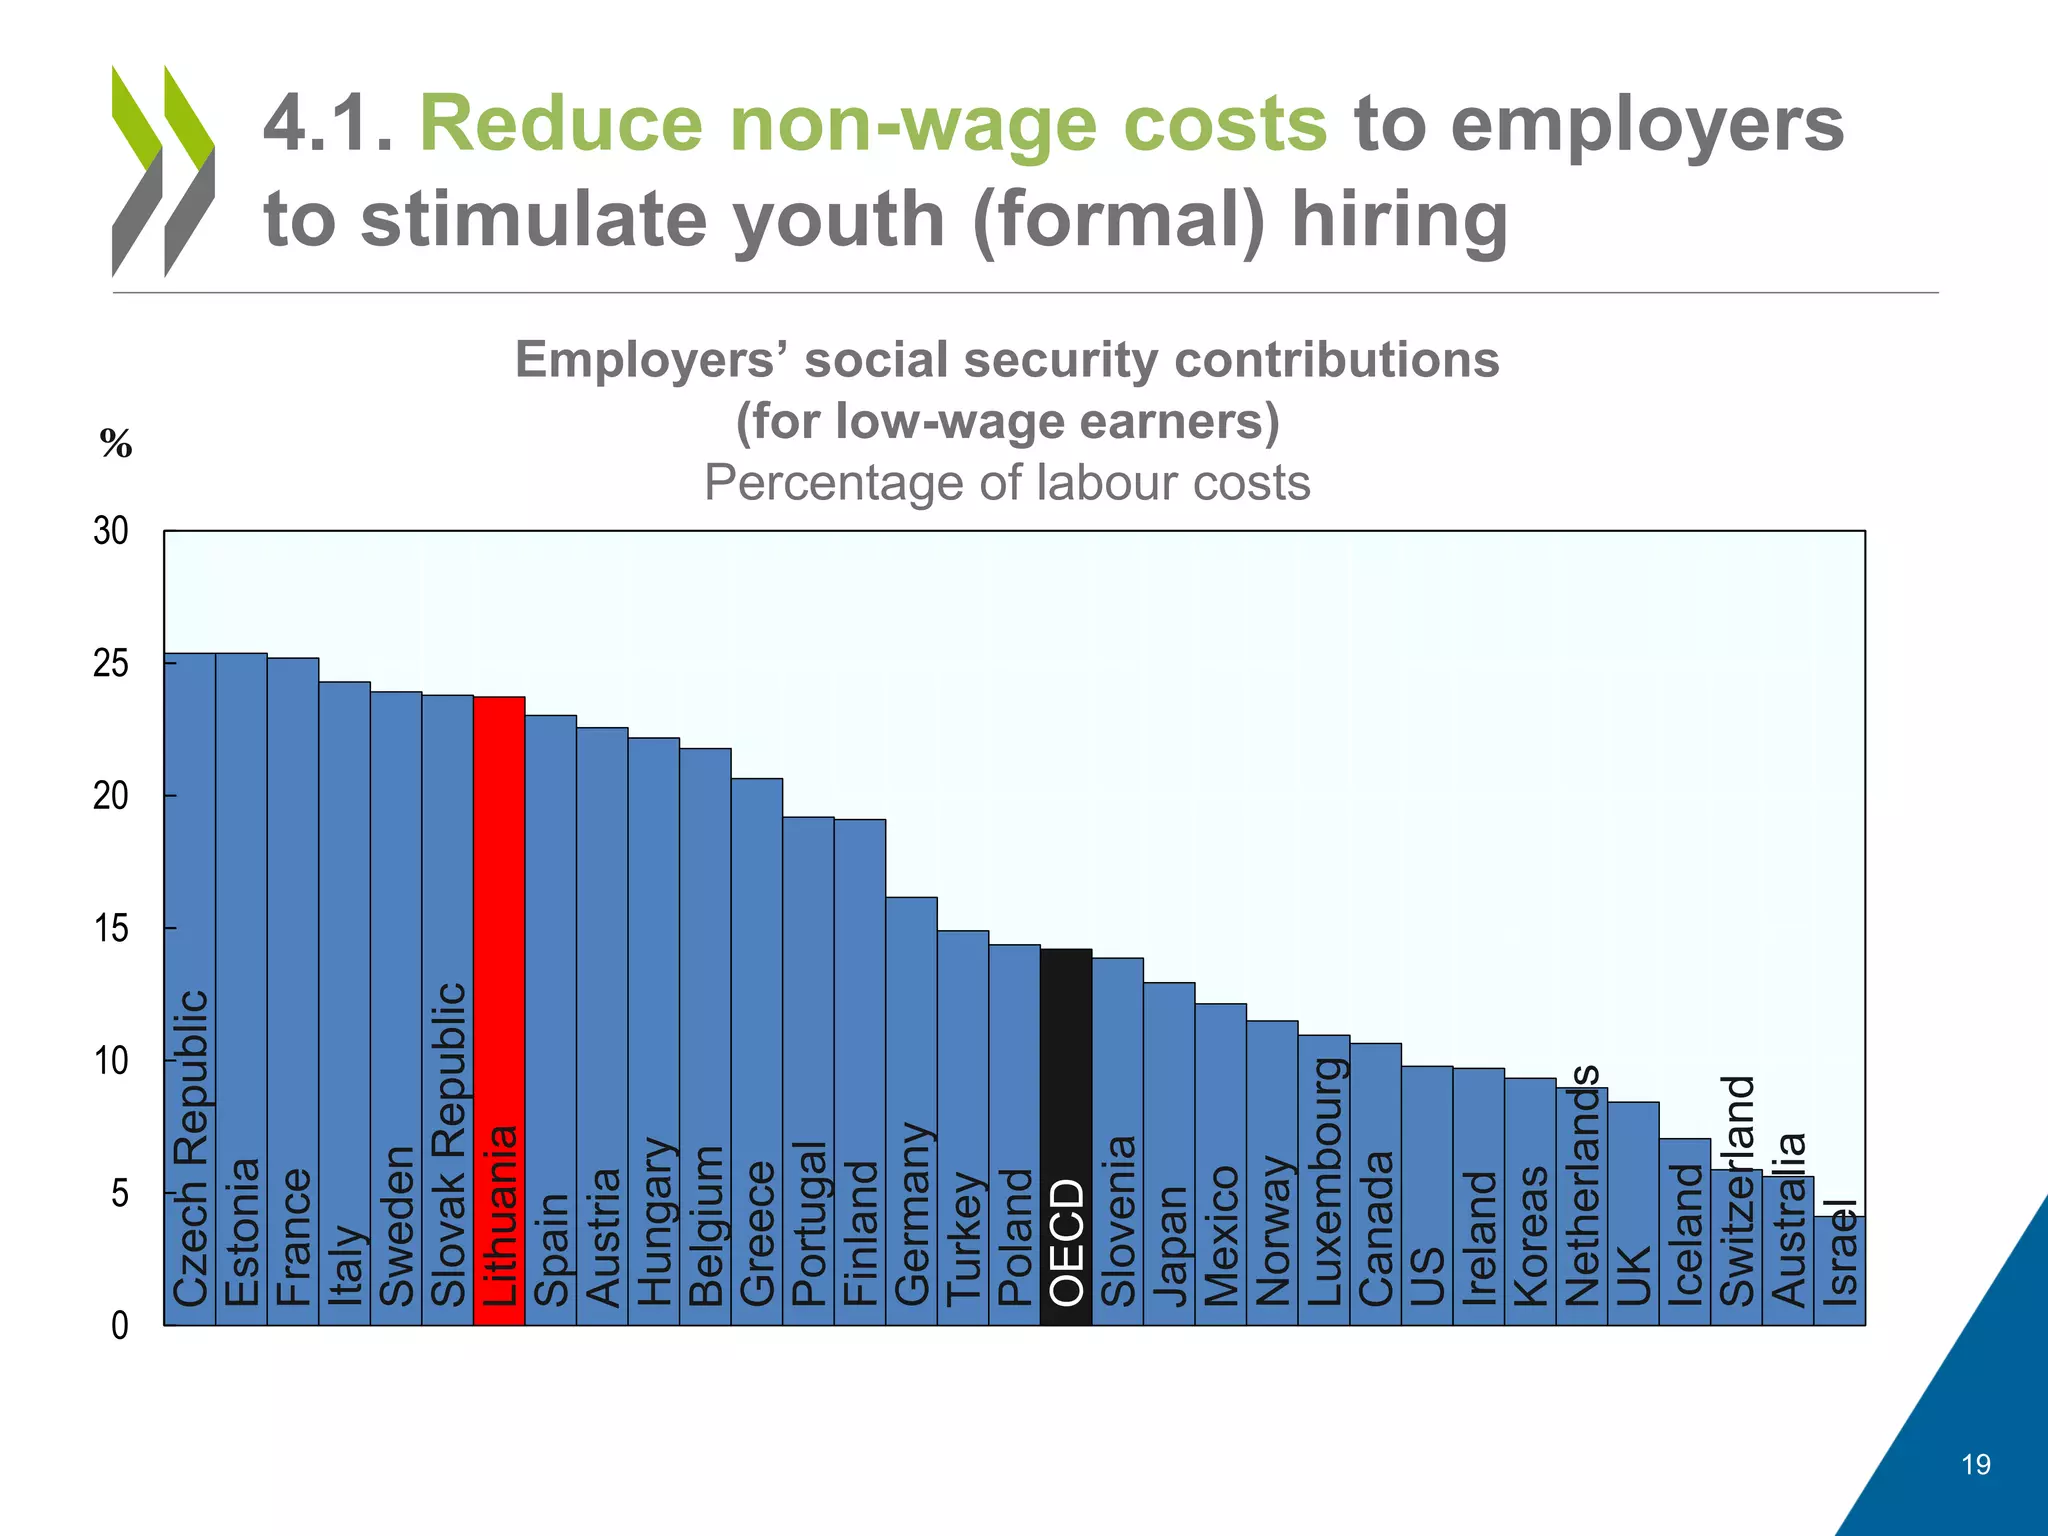
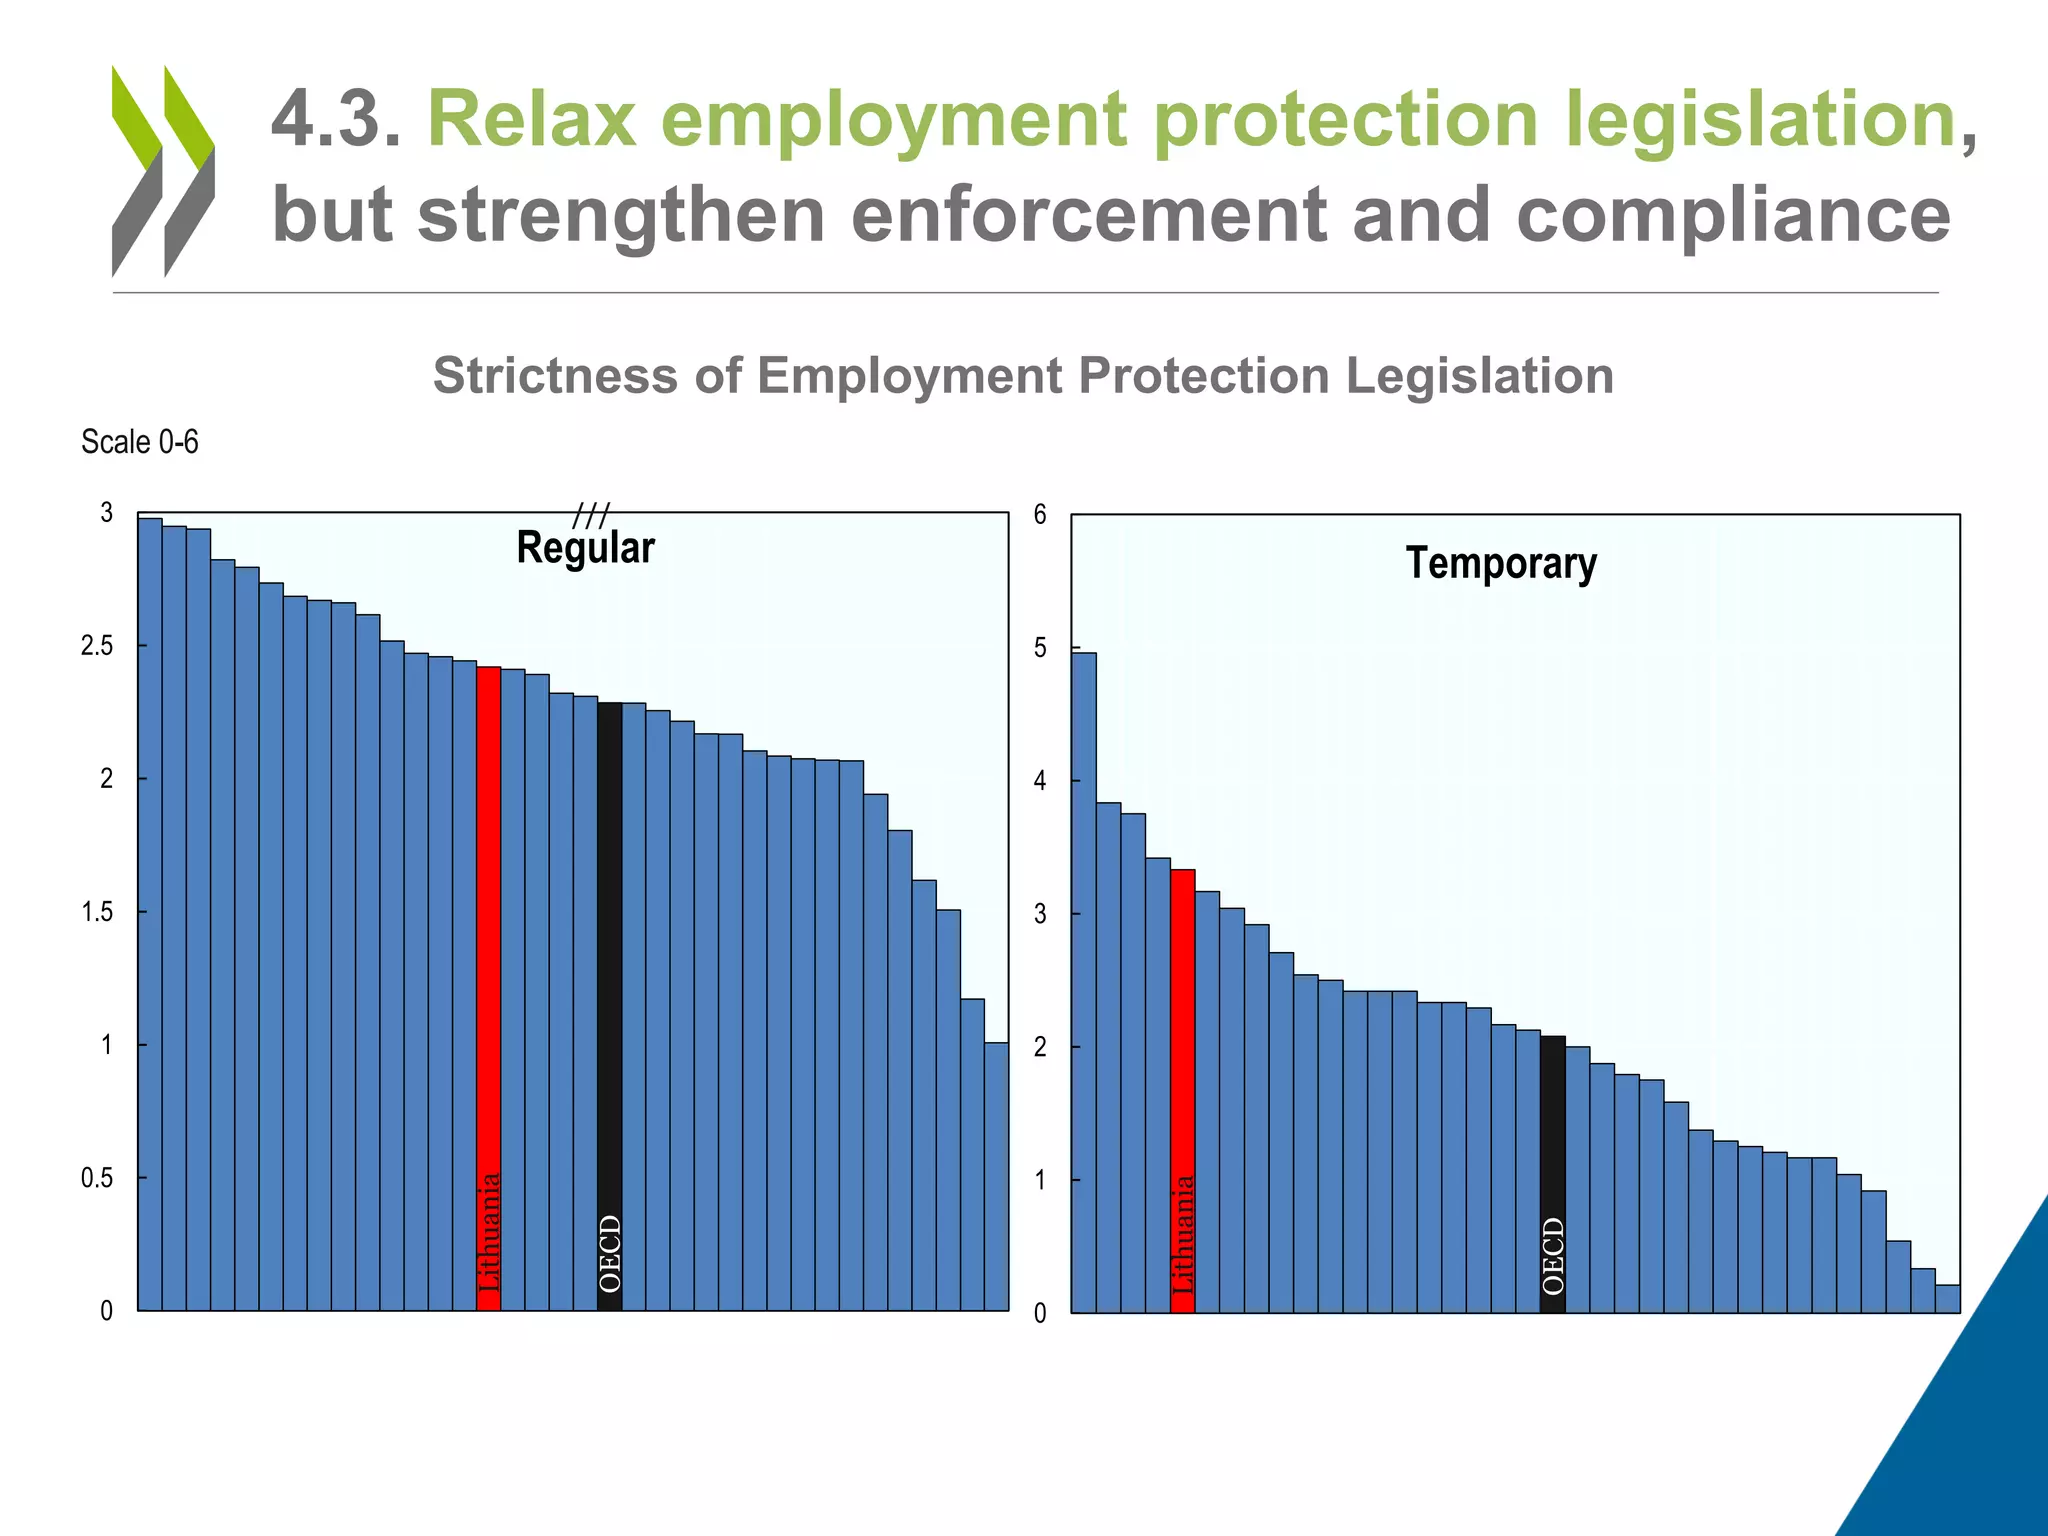
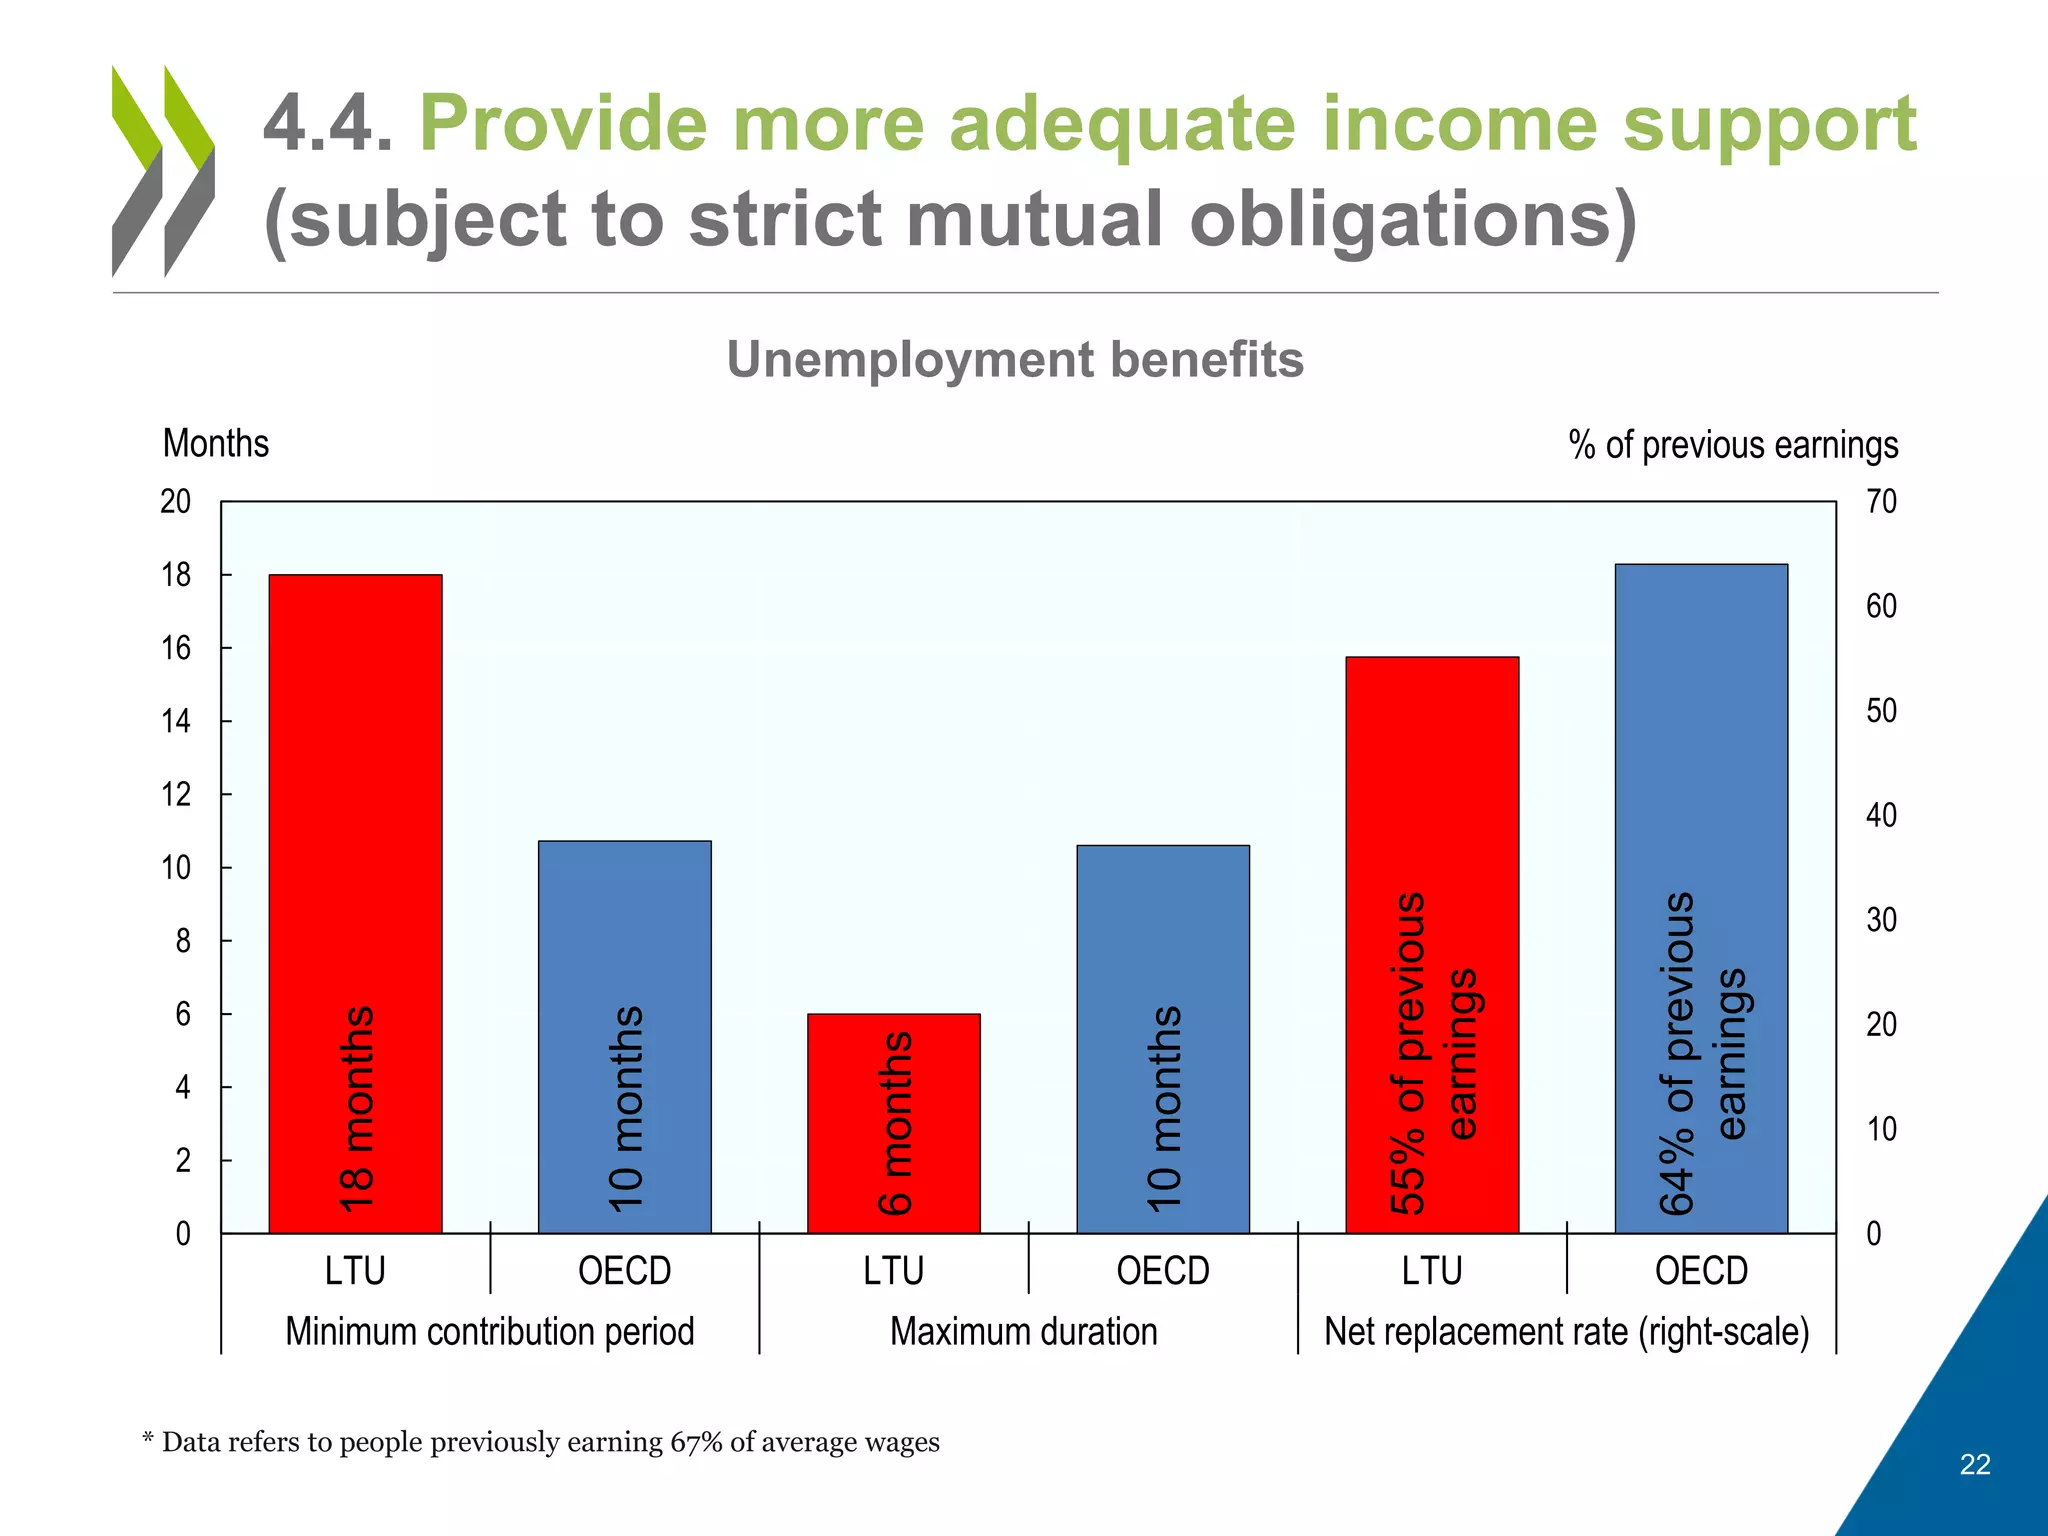
Mark Pearson (Deputy Director) and Alessia Forti (Policy Analyst)
Directorate for Employment, Labour and Social Affairs
Investing in Youth
Lithuania
Vilnius, 24th February 2016
Published so far
Brazil (2014) Tunisia (2015) Latvia (2015) Lithuania (2016)
Forthcoming
Australia Norway Sweden Japan
Kazakhstan Peru
The Lithuanian review is #4 of an ongoing
series of ‘Investing in Youth’ reviews
2
1. The demographic challenge
2. Job quantity
3. Job quality
4. Policy options and key recommendations
3
Outline of the presentation
1. THE DEMOGRAPHIC
CHALLENGE
4
5
1.1. The youth population is shrinking
The size of the youth population in Lithuania
17
18
19
20
21
22
23
0
100
200
300
400
500
600
700
800
900
1000
1990 1995 2000 2005 2010 2015
Percentageofyouthinworkingagepopulation
Thousands
15-19 20-24 25-29 Youth/Working age population (%)
…Declining fertility rates and ageing population
…Increasing migration outflows of youth
2. JOB QUANTITY
6
7
2.1. Youth were hit hard by the crisis
0
10
20
30
40
50
%
Unemployment
Lithuania EU OECD
50
55
60
65
70
75
80
%
Inactivity
10
20
30
40
50
2007 2008 2009 2010 2011 2012 2013 2014 2015
Employment
8
2.2. Some youth fare worse than others
Young women are more
often inactive and less
often employed than
young men
Highly-qualified youth
fare considerably better
than low-qualified youth
Some regions are
lagging behind
0
10
20
30
40
50
60
70
80
Primary Secondary Tertiary
Youth employment
by level of education
Alytaus
Kauno
Klaipedos
Marijampoles
Panevezio
Šiauliu
Taurages
Telšiu
Utenos
Vilniaus
0
5
10
15
20
25
30
35
40
45
Youth unemployment
by region
0
10
20
30
40
50
60
70
80
90
100
Men Women
Employment Inactivity
Youth employment and inactivity
by gender
Gender
Education
Regions
9
2.3. Youth not in Employment, Education or
Training (NEET)
10
11
12
13
14
15
16
17
18
2005 2006 2007 2008 2009 2010 2011 2012 2013 2014
Lithuania OECD European Union
0
2
4
6
8
10
12
14
16
18
2005 2006 2007 2008 2009 2010 2011 2012 2013 2014
Inactive (not in school) Unemployed
NEET rates (share of youth aged 15-29)
By international standards
In Lithuania
10
2.4. Youth not in Employment, Education or
Training (NEET) (cont.)
0
5
10
15
20
Men Women
Share of unemployed Share of inactive (not in school)
0
5
10
15
20
Primary Secondary Tertiary
0
5
10
15
20
25
Alytaus
Kauno
Klaipedos
Marijampoles
Panevezio
Šiauliu
Taurages
Telšiu
Utenos
Vilniaus
Region
Education
Regions
Gender
Young women are
more often NEET
Youth with
secondary
education are
more likely to be
NEET
Some regions
are lagging
behind
3. JOB QUALITY
11
Earnings quality: relatively low earnings (20%
earn MWs) and among the most unequal
countries in Europe
Labour market security: high unemployment
risk and weak income support
Quality of the work environment: 70% young
workers lack work autonomy and learning
opportunities
12
3.1. OECD Job Quality framework
13
3.2. Skills mismatches are frequent
0
5
10
15
20
25
30
35
40
45
Men Women Full-time Part-time Permanent Temporary
All youth Gender Full- or part-time Type of contract
% Underqualified Overqualified
Percentage of employed youth who are either over- or under-qualified for
their jobs
14
3.3. Informality and envelope wages are
frequent among youthHungary
Lithuania
Latvia
Estonia
CzechRepublic
Greece
Netherlands
UnitedKingdom
Slovenia
Luxembourg
OECD
Spain
Finland
Portugal
SlovakRepublic
Poland
Austria
France
Germany
0%
2%
4%
6%
8%
10%
12%
14%
16%
18%
20%
Percentage of employed youth who receives envelope wages
… Foregone tax revenues for the state budget
… Weaker income protection for youth in case of job loss
… More uncertainty for employers
Only one in twelve employed youth work under temporary
contract in Lithuania..
compared to around one in three across OECD and
European countries.
15
3.4. Youth rarely work under temporary
contracts
Only one in seven employed youth work part-time in
Lithuania..
compared to around one in five across OECD and
European countries.
16
3.5. Youth rarely work part-time
4. POLICY OPTIONS AND
KEY RECOMMENDATIONS
17
4. Policy Options and Key Recommendations
Reduce non-wages costs to employers to stimulate youth
(formal) hiring
Introduce a differentiated minimum wage structure to
reflect lower productivity of young workers
Relax employment protection legislation, but strengthen
enforcement and compliance
Provide more adequate income support (subject to strict
mutual obligations)
Expand ALMPs which are cost-effective
19
4.1. Reduce non-wage costs to employers
to stimulate youth (formal) hiringCzechRepublic
Estonia
France
Italy
Sweden
SlovakRepublic
Lithuania
Spain
Austria
Hungary
Belgium
Greece
Portugal
Finland
Germany
Turkey
Poland
OECD
Slovenia
Japan
Mexico
Norway
Luxembourg
Canada
US
Ireland
Koreas
Netherlands
UK
Iceland
Switzerland
Australia
Israel
0
5
10
15
20
25
30
%
Employers’ social security contributions
(for low-wage earners)
Percentage of labour costs
20
4.2. Introduce a differentiated minimum wage structure
to reflect lower productivity of young workers
0
10
20
30
40
50
60
70
80
90
100
Turkey
Chile
France
Slovenia
NewZealand
Israel
Portugal
Australia
Hungary
Lithuania
Belgium
Poland
Latvia
Ireland
Germany(estimate)
Netherlands
UK
SlovakRepublic
Greece
Canada
Luxembourg
Spain
Korea
Japan
Estonia
UnitedStates
Mexico
CzechRepublic
%
MW/Median MW/Average
Minimum wages as percentage of median and average wages
21
4.3. Relax employment protection legislation,
but strengthen enforcement and compliance
Lithuania
OECD
0
1
2
3
4
5
6
Temporary
Lithuania
OECD
0
0.5
1
1.5
2
2.5
3
Scale 0-6
///
Regular
Strictness of Employment Protection Legislation
22
4.4. Provide more adequate income support
(subject to strict mutual obligations)
* Data refers to people previously earning 67% of average wages
18months
10months
6months
10months
55%ofprevious
earnings
64%ofprevious
earnings
0
10
20
30
40
50
60
70
0
2
4
6
8
10
12
14
16
18
20
LTU OECD LTU OECD LTU OECD
Minimum contribution period Maximum duration Net replacement rate (right-scale)
% of previous earningsMonths
Unemployment benefits
23
4.5. Expand ALMPs which are cost
effective
Four out of five Lithuanian unemployed youth register with PES
OECD
Lithuania
0
5
10
15
20
25
%
OECD
Lithuania
0
0.2
0.4
0.6
0.8
1
1.2
1.4
1.6
1.8
%
Youth participation to ALMPs
Percentage of youth labour force
Spending on ALMPs
Percentage of GDP
But participation to and spending on ALMPs remains low
24
Contacts: alessandro.goglio@oecd.org, alessia.forti@oecd.org, anton.nivorozhkin@oecd.org
Access the Lithuanian review online: Investing in Youth – Lithuania
More recent work on the youth policies: www.oecd.org/employment/action-plan-youth.htm
OECD Directorate for Employment, Labour and Social Affairs: www.oecd.org/els
In It Together: Why less Inequality benefits All: www.oecd.org/social/inequality-and-poverty.htm
Society at a Glance 2014: www.oecd.org/social/societyataglance.htm
Pensions at a Glance 2015: www.oecd.org/pensions/pensionsataglance.htm
Thank you
Follow us on Twitter:
@OECD_Social

Investing in youth Lithuania

  • 1.
    Mark Pearson (DeputyDirector) and Alessia Forti (Policy Analyst) Directorate for Employment, Labour and Social Affairs Investing in Youth Lithuania Vilnius, 24th February 2016
  • 2.
    Published so far Brazil(2014) Tunisia (2015) Latvia (2015) Lithuania (2016) Forthcoming Australia Norway Sweden Japan Kazakhstan Peru The Lithuanian review is #4 of an ongoing series of ‘Investing in Youth’ reviews 2
  • 3.
    1. The demographicchallenge 2. Job quantity 3. Job quality 4. Policy options and key recommendations 3 Outline of the presentation
  • 4.
  • 5.
    5 1.1. The youthpopulation is shrinking The size of the youth population in Lithuania 17 18 19 20 21 22 23 0 100 200 300 400 500 600 700 800 900 1000 1990 1995 2000 2005 2010 2015 Percentageofyouthinworkingagepopulation Thousands 15-19 20-24 25-29 Youth/Working age population (%) …Declining fertility rates and ageing population …Increasing migration outflows of youth
  • 6.
  • 7.
    7 2.1. Youth werehit hard by the crisis 0 10 20 30 40 50 % Unemployment Lithuania EU OECD 50 55 60 65 70 75 80 % Inactivity 10 20 30 40 50 2007 2008 2009 2010 2011 2012 2013 2014 2015 Employment
  • 8.
    8 2.2. Some youthfare worse than others Young women are more often inactive and less often employed than young men Highly-qualified youth fare considerably better than low-qualified youth Some regions are lagging behind 0 10 20 30 40 50 60 70 80 Primary Secondary Tertiary Youth employment by level of education Alytaus Kauno Klaipedos Marijampoles Panevezio Šiauliu Taurages Telšiu Utenos Vilniaus 0 5 10 15 20 25 30 35 40 45 Youth unemployment by region 0 10 20 30 40 50 60 70 80 90 100 Men Women Employment Inactivity Youth employment and inactivity by gender Gender Education Regions
  • 9.
    9 2.3. Youth notin Employment, Education or Training (NEET) 10 11 12 13 14 15 16 17 18 2005 2006 2007 2008 2009 2010 2011 2012 2013 2014 Lithuania OECD European Union 0 2 4 6 8 10 12 14 16 18 2005 2006 2007 2008 2009 2010 2011 2012 2013 2014 Inactive (not in school) Unemployed NEET rates (share of youth aged 15-29) By international standards In Lithuania
  • 10.
    10 2.4. Youth notin Employment, Education or Training (NEET) (cont.) 0 5 10 15 20 Men Women Share of unemployed Share of inactive (not in school) 0 5 10 15 20 Primary Secondary Tertiary 0 5 10 15 20 25 Alytaus Kauno Klaipedos Marijampoles Panevezio Šiauliu Taurages Telšiu Utenos Vilniaus Region Education Regions Gender Young women are more often NEET Youth with secondary education are more likely to be NEET Some regions are lagging behind
  • 11.
  • 12.
    Earnings quality: relativelylow earnings (20% earn MWs) and among the most unequal countries in Europe Labour market security: high unemployment risk and weak income support Quality of the work environment: 70% young workers lack work autonomy and learning opportunities 12 3.1. OECD Job Quality framework
  • 13.
    13 3.2. Skills mismatchesare frequent 0 5 10 15 20 25 30 35 40 45 Men Women Full-time Part-time Permanent Temporary All youth Gender Full- or part-time Type of contract % Underqualified Overqualified Percentage of employed youth who are either over- or under-qualified for their jobs
  • 14.
    14 3.3. Informality andenvelope wages are frequent among youthHungary Lithuania Latvia Estonia CzechRepublic Greece Netherlands UnitedKingdom Slovenia Luxembourg OECD Spain Finland Portugal SlovakRepublic Poland Austria France Germany 0% 2% 4% 6% 8% 10% 12% 14% 16% 18% 20% Percentage of employed youth who receives envelope wages … Foregone tax revenues for the state budget … Weaker income protection for youth in case of job loss … More uncertainty for employers
  • 15.
    Only one intwelve employed youth work under temporary contract in Lithuania.. compared to around one in three across OECD and European countries. 15 3.4. Youth rarely work under temporary contracts
  • 16.
    Only one inseven employed youth work part-time in Lithuania.. compared to around one in five across OECD and European countries. 16 3.5. Youth rarely work part-time
  • 17.
    4. POLICY OPTIONSAND KEY RECOMMENDATIONS 17
  • 18.
    4. Policy Optionsand Key Recommendations Reduce non-wages costs to employers to stimulate youth (formal) hiring Introduce a differentiated minimum wage structure to reflect lower productivity of young workers Relax employment protection legislation, but strengthen enforcement and compliance Provide more adequate income support (subject to strict mutual obligations) Expand ALMPs which are cost-effective
  • 19.
    19 4.1. Reduce non-wagecosts to employers to stimulate youth (formal) hiringCzechRepublic Estonia France Italy Sweden SlovakRepublic Lithuania Spain Austria Hungary Belgium Greece Portugal Finland Germany Turkey Poland OECD Slovenia Japan Mexico Norway Luxembourg Canada US Ireland Koreas Netherlands UK Iceland Switzerland Australia Israel 0 5 10 15 20 25 30 % Employers’ social security contributions (for low-wage earners) Percentage of labour costs
  • 20.
    20 4.2. Introduce adifferentiated minimum wage structure to reflect lower productivity of young workers 0 10 20 30 40 50 60 70 80 90 100 Turkey Chile France Slovenia NewZealand Israel Portugal Australia Hungary Lithuania Belgium Poland Latvia Ireland Germany(estimate) Netherlands UK SlovakRepublic Greece Canada Luxembourg Spain Korea Japan Estonia UnitedStates Mexico CzechRepublic % MW/Median MW/Average Minimum wages as percentage of median and average wages
  • 21.
    21 4.3. Relax employmentprotection legislation, but strengthen enforcement and compliance Lithuania OECD 0 1 2 3 4 5 6 Temporary Lithuania OECD 0 0.5 1 1.5 2 2.5 3 Scale 0-6 /// Regular Strictness of Employment Protection Legislation
  • 22.
    22 4.4. Provide moreadequate income support (subject to strict mutual obligations) * Data refers to people previously earning 67% of average wages 18months 10months 6months 10months 55%ofprevious earnings 64%ofprevious earnings 0 10 20 30 40 50 60 70 0 2 4 6 8 10 12 14 16 18 20 LTU OECD LTU OECD LTU OECD Minimum contribution period Maximum duration Net replacement rate (right-scale) % of previous earningsMonths Unemployment benefits
  • 23.
    23 4.5. Expand ALMPswhich are cost effective Four out of five Lithuanian unemployed youth register with PES OECD Lithuania 0 5 10 15 20 25 % OECD Lithuania 0 0.2 0.4 0.6 0.8 1 1.2 1.4 1.6 1.8 % Youth participation to ALMPs Percentage of youth labour force Spending on ALMPs Percentage of GDP But participation to and spending on ALMPs remains low
  • 24.
    24 Contacts: alessandro.goglio@oecd.org, alessia.forti@oecd.org,anton.nivorozhkin@oecd.org Access the Lithuanian review online: Investing in Youth – Lithuania More recent work on the youth policies: www.oecd.org/employment/action-plan-youth.htm OECD Directorate for Employment, Labour and Social Affairs: www.oecd.org/els In It Together: Why less Inequality benefits All: www.oecd.org/social/inequality-and-poverty.htm Society at a Glance 2014: www.oecd.org/social/societyataglance.htm Pensions at a Glance 2015: www.oecd.org/pensions/pensionsataglance.htm Thank you Follow us on Twitter: @OECD_Social