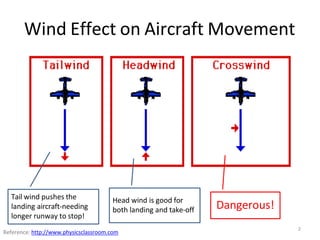
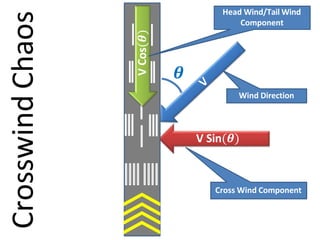
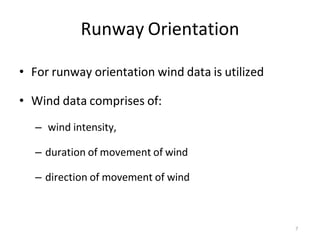
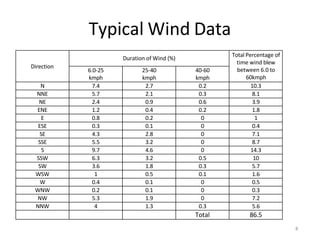
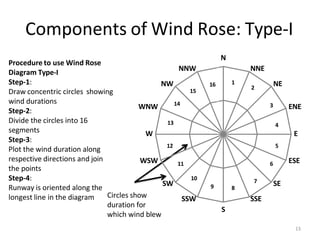
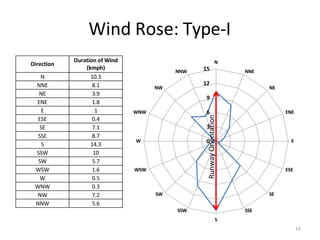
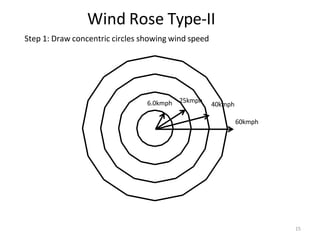
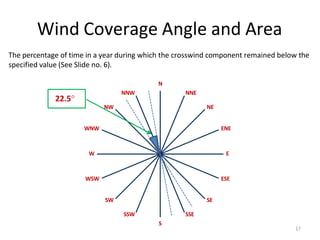
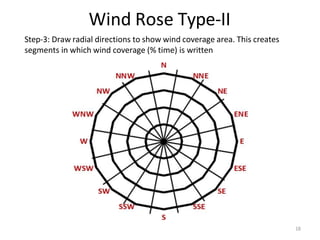
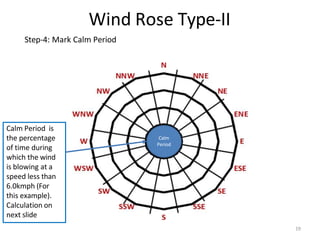
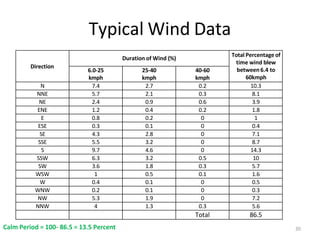
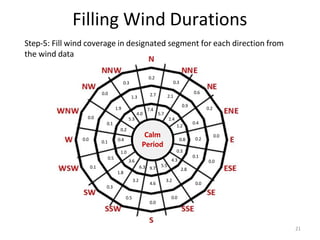
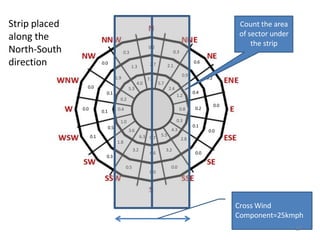
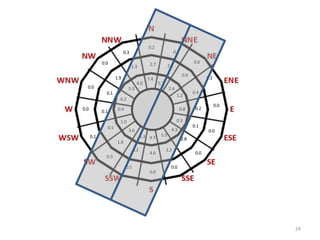
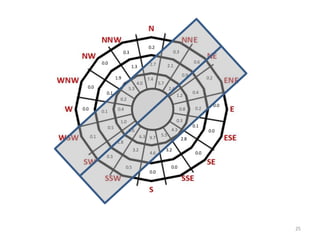
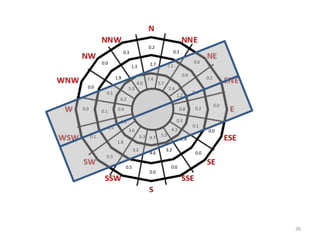
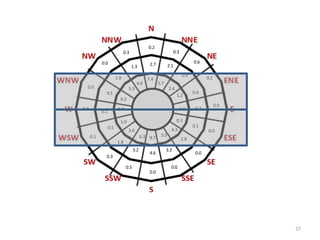
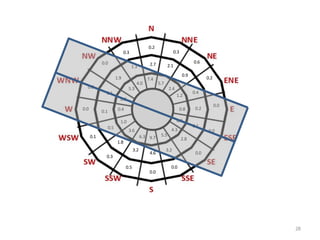
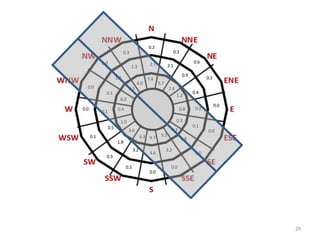
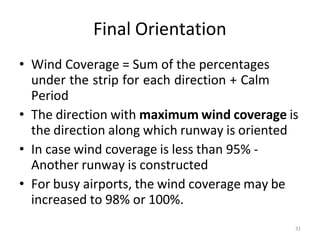
This document discusses how wind data is used to determine the optimal orientation of runways at airports. It describes how wind data including direction, speed, and duration is collected over many years and displayed on a wind rose diagram. The wind rose diagram shows the percentage of time winds blow from different directions at various speeds. To determine the best runway orientation, a strip representing the allowable crosswind component is placed along different directions on the wind rose. The direction that captures the highest percentage of winds within the strip, plus calm winds, is selected as the orientation for the runway. Having runways aligned properly reduces crosswinds and allows for safer takeoffs and landings.