This document discusses transportation electrification in Vermont. It provides an overview of electric vehicle (EV) market status and economics, outlines opportunities and case studies to accelerate EV adoption, and examines policies and programs to promote electrification. Key points include:
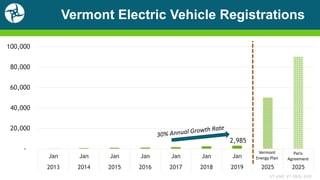
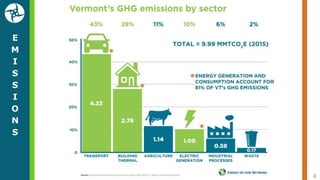
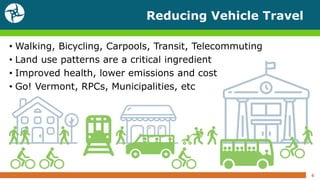
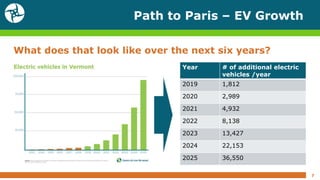
- Transportation is a major source of emissions in Vermont, and increased EV adoption is part of the state's plan to meet climate goals.
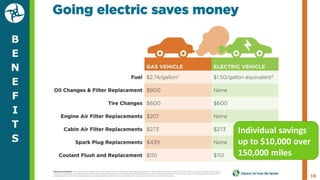
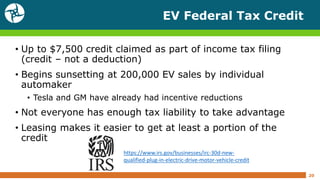
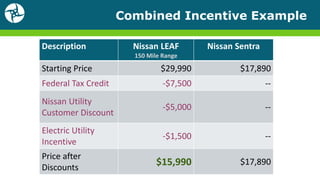
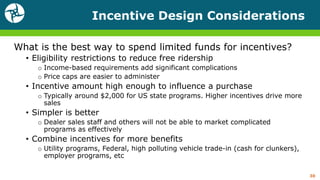
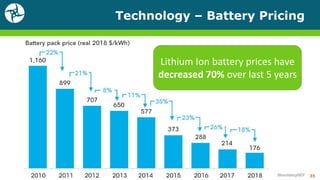
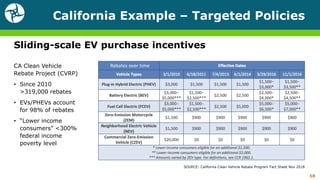
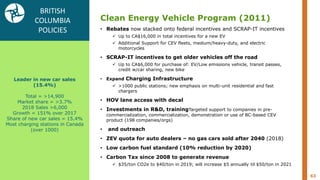
- Incentive programs aim to reduce the cost of EVs and charging infrastructure to encourage purchases. Combined incentives can lower EV costs by over $10,000.
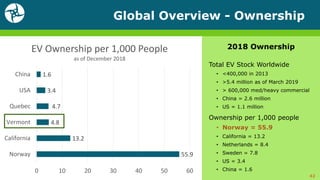
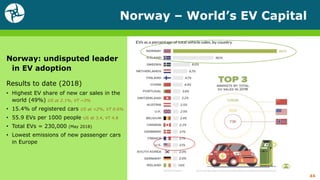
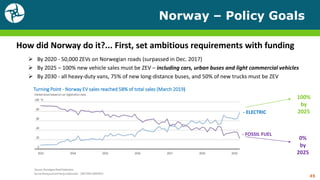
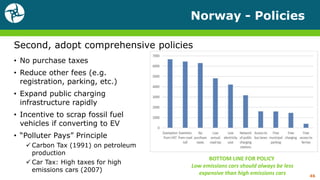
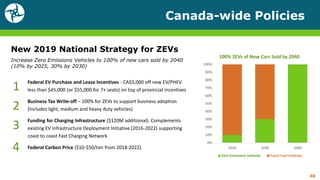
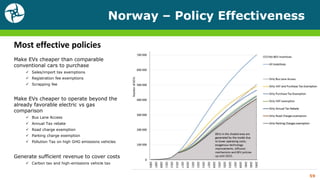
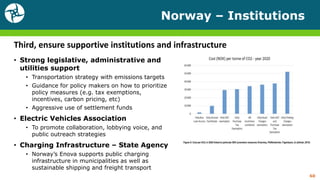
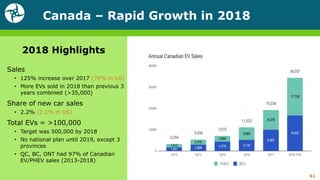
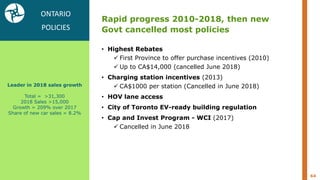
- Case studies from Norway show that setting ambitious EV requirements and adopting comprehensive policies like fees on gas vehicles can lead to over 50% of new car sales being electric.

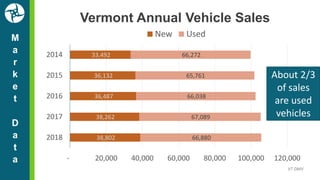
![Vermont Annual New Vehicle Sales
VT VADA
[CELLRANGE] [CELLRANGE] [CELLRANGE] [CELLRANGE]
-
5,000
10,000
15,000
20,000
25,000
30,000
35,000
40,000
45,000
2015 2016 2017 2018
Passenger Cars SUVs / Light Trucks](https://image.slidesharecdn.com/eanvt-energyfutureinitiativeevpresentationupdated08292019-190829184216/85/Transportation-Electrification-in-Vermont-12-320.jpg)