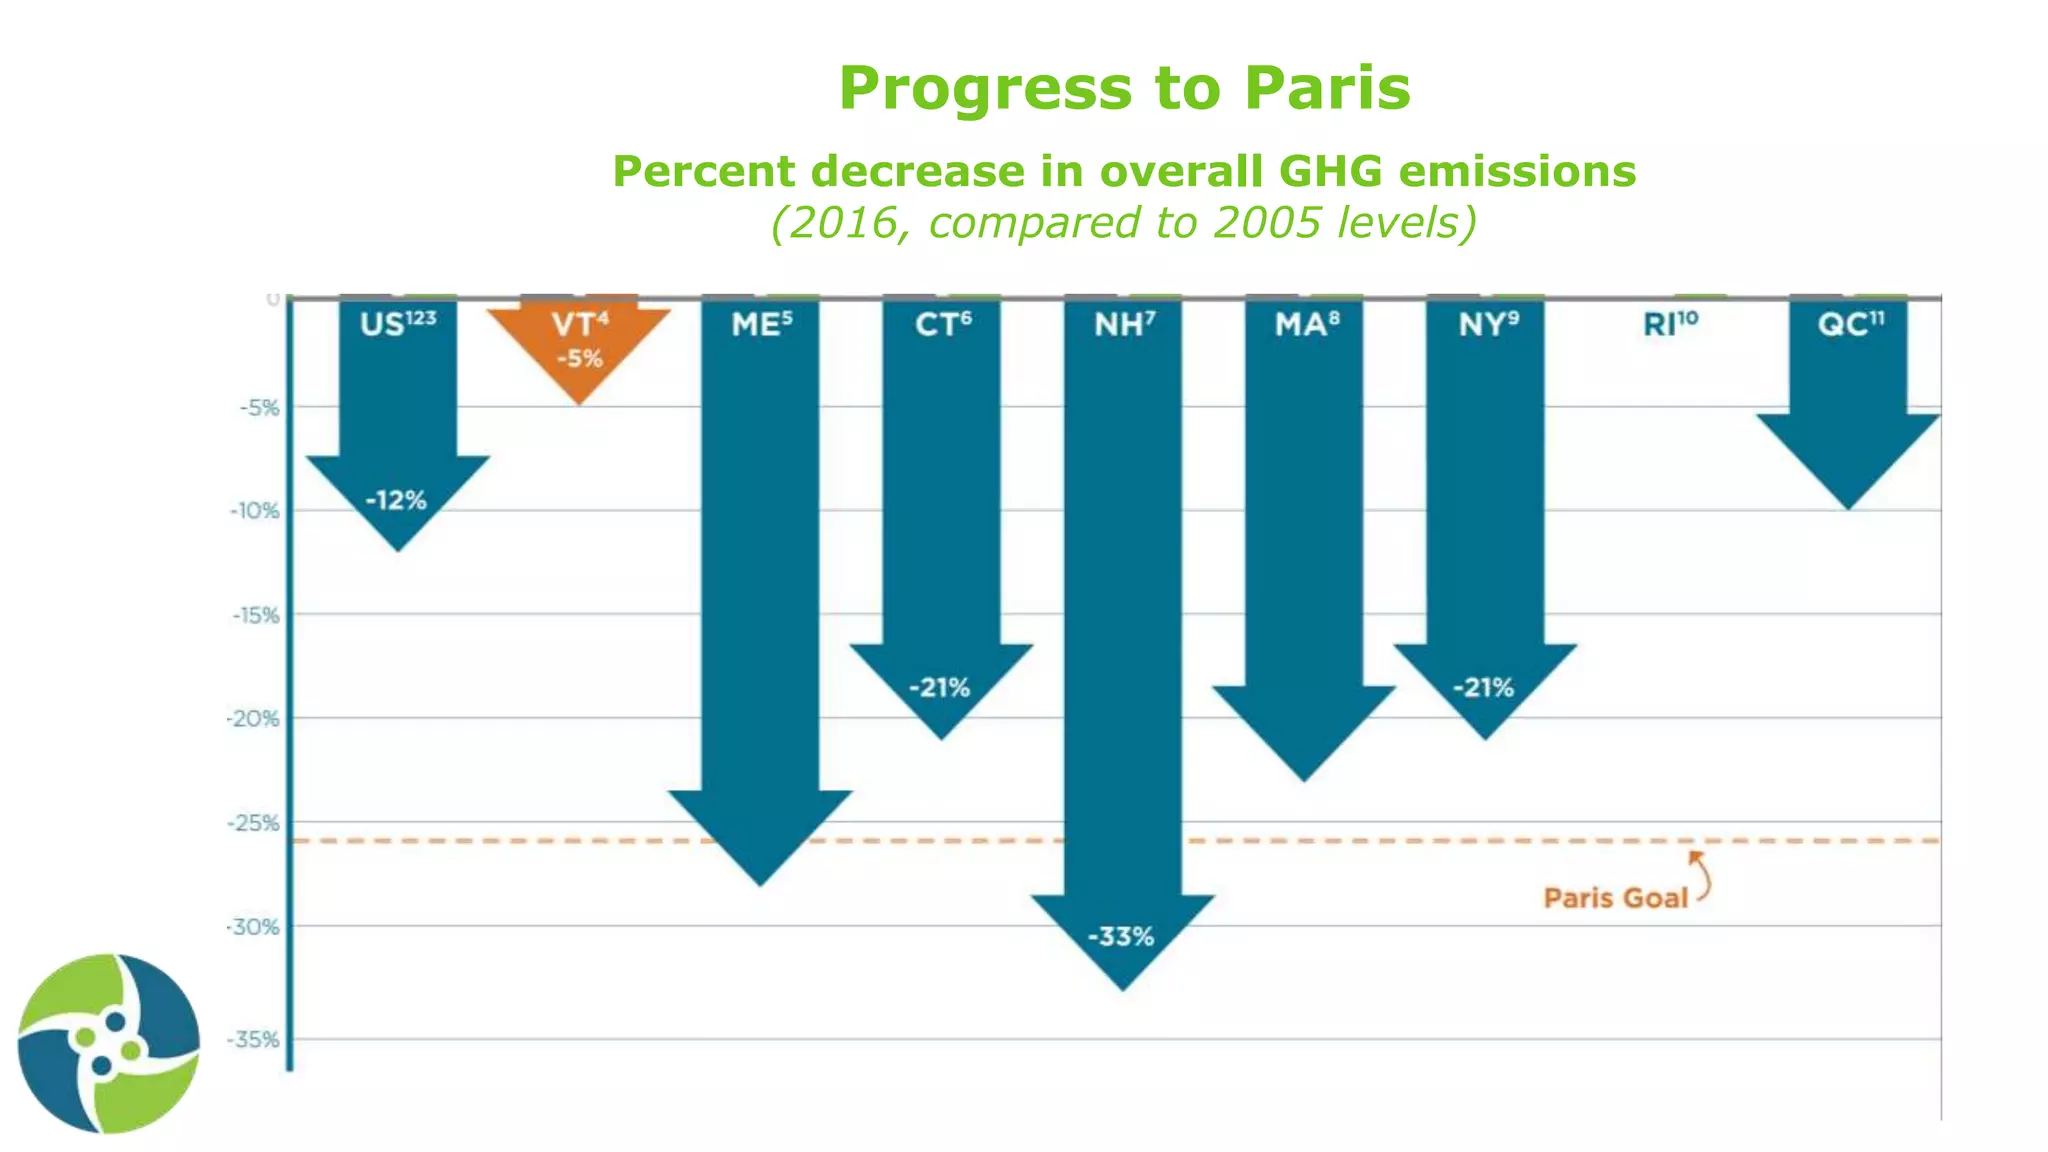
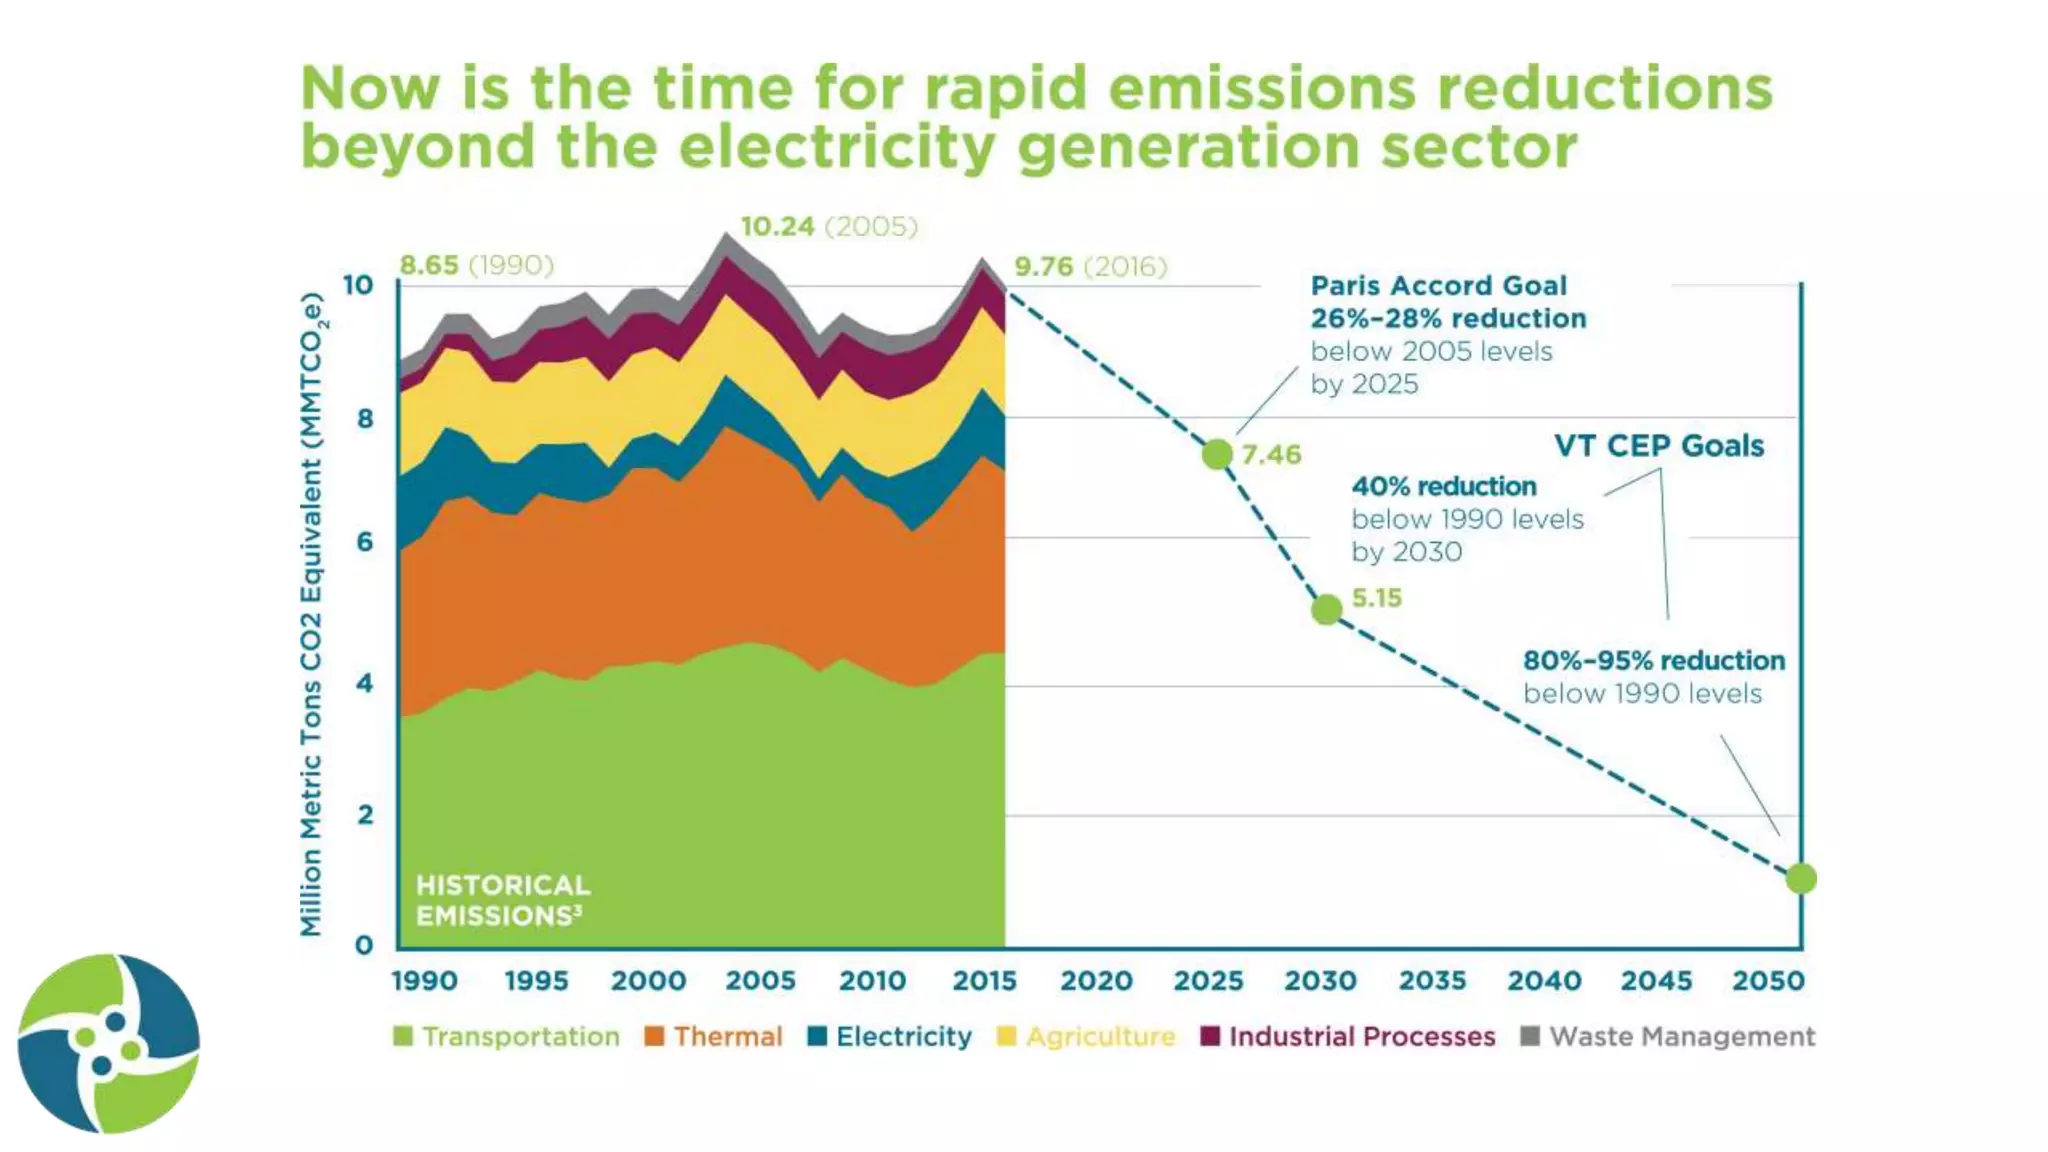
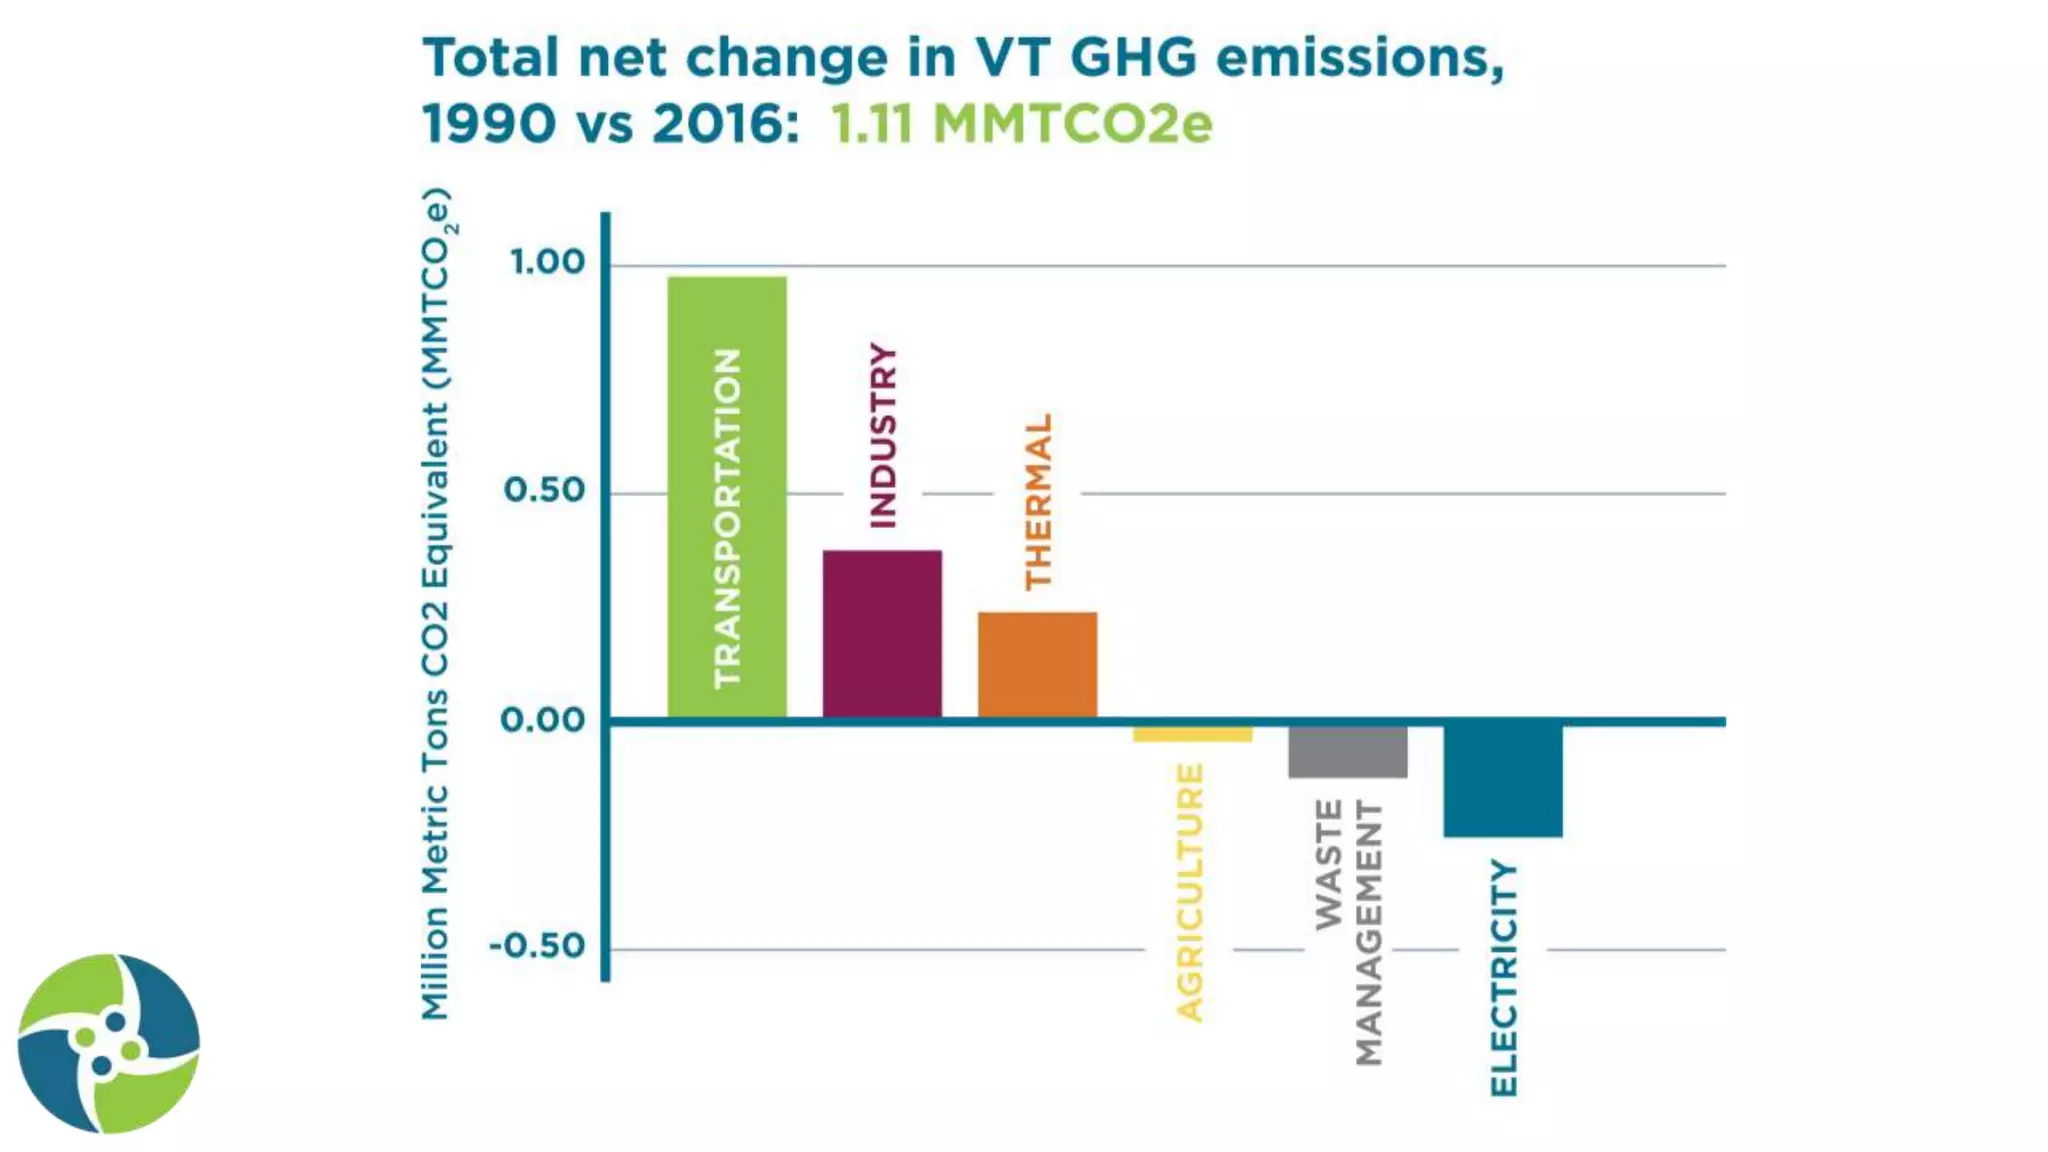
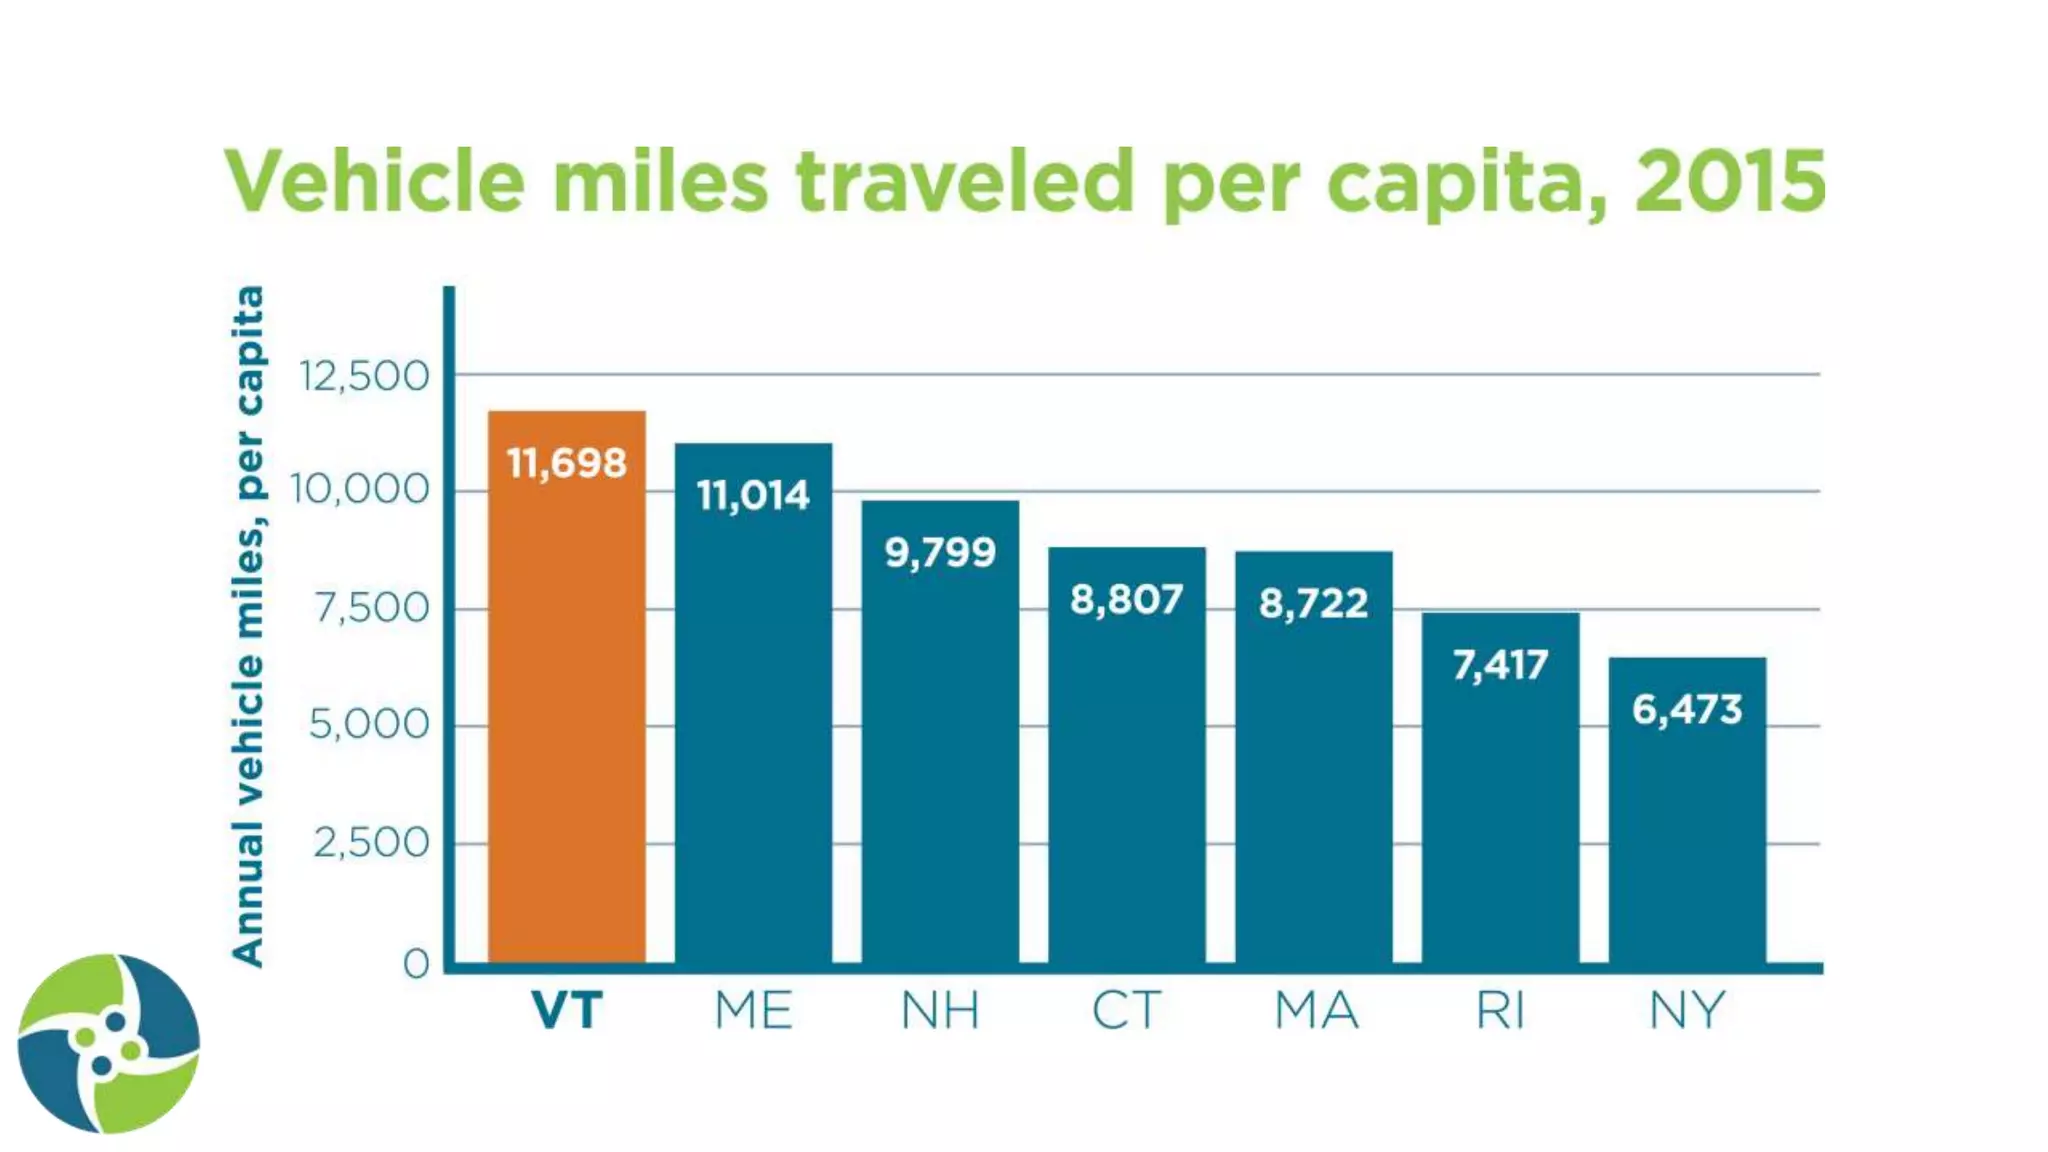
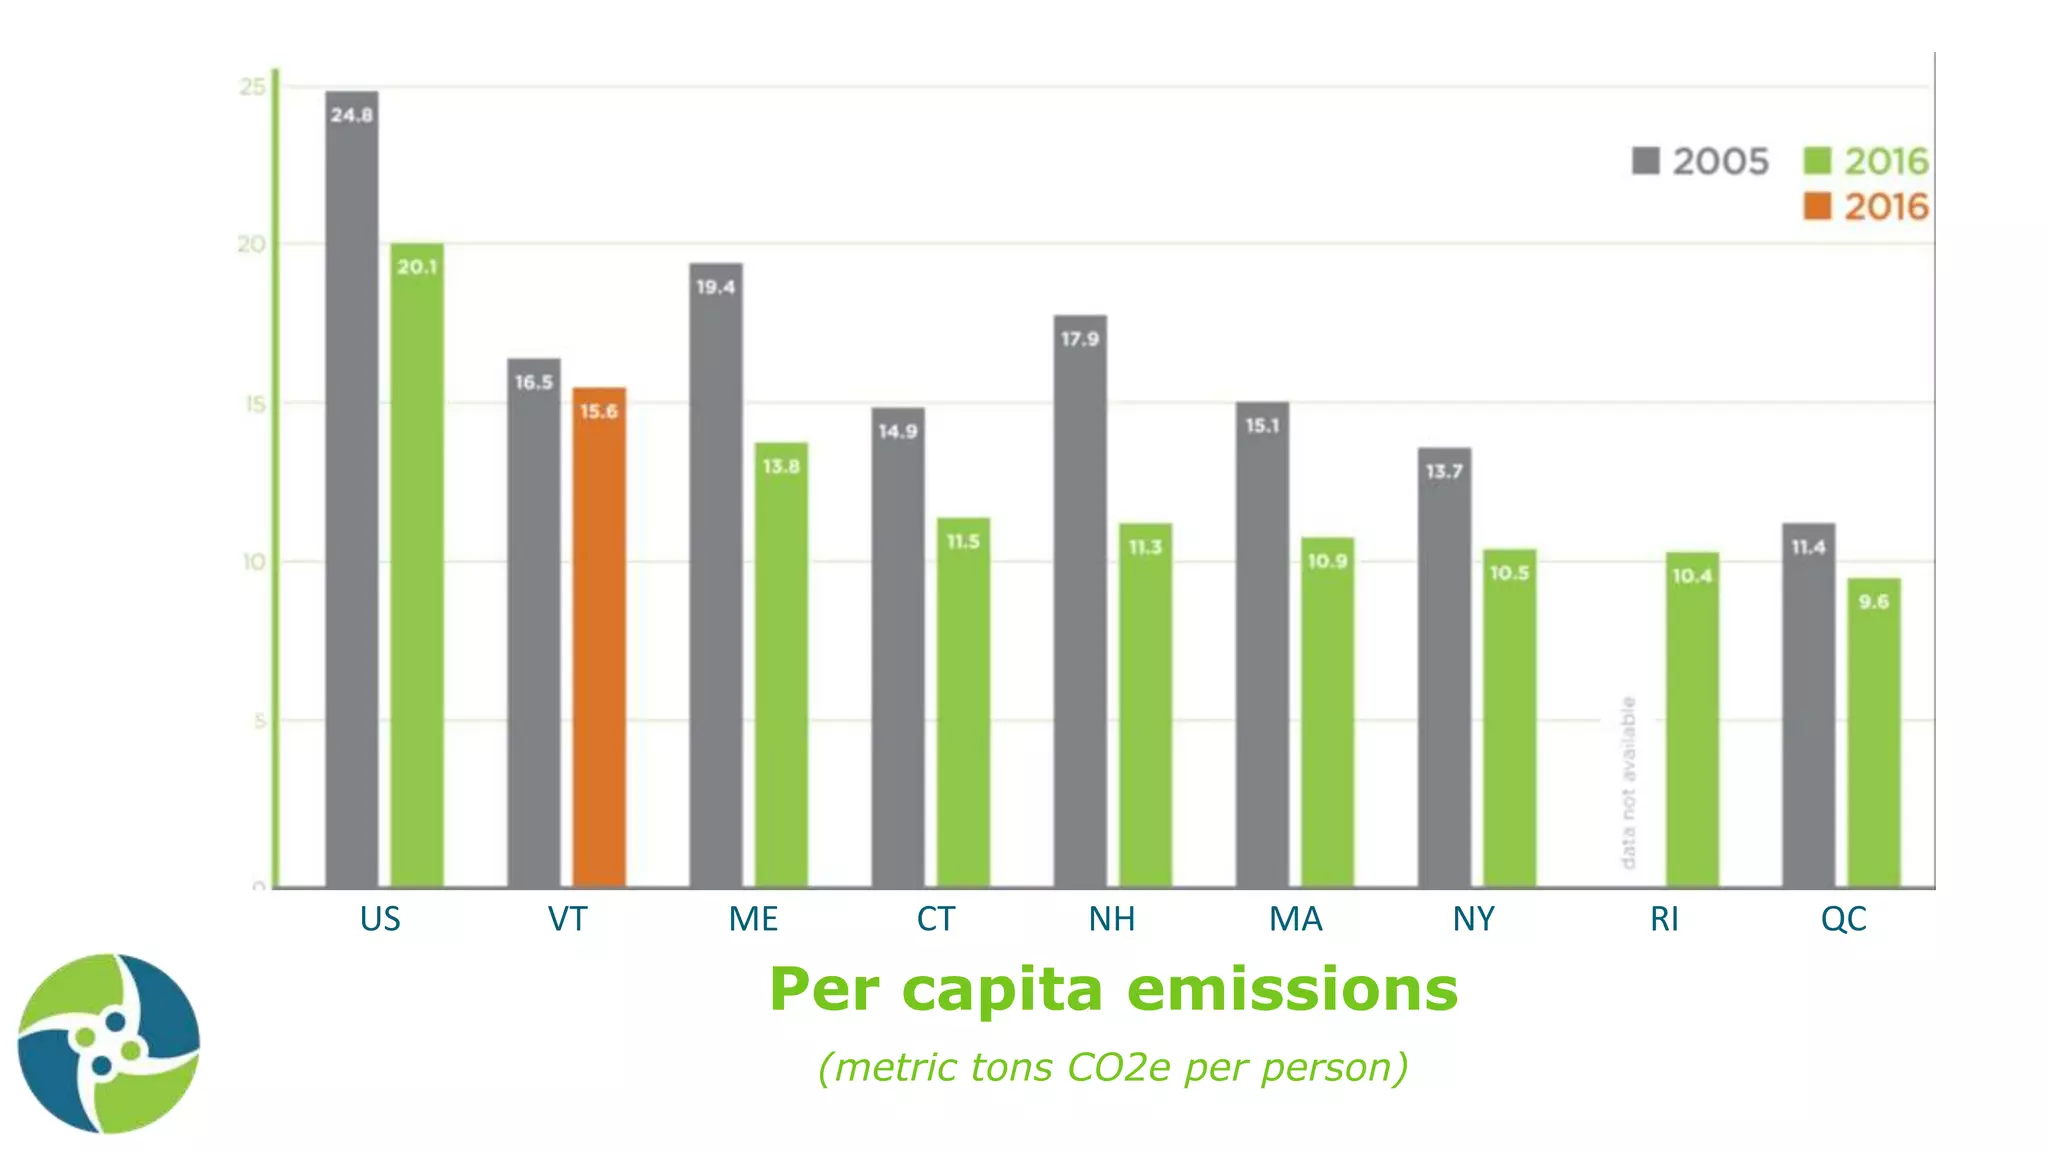
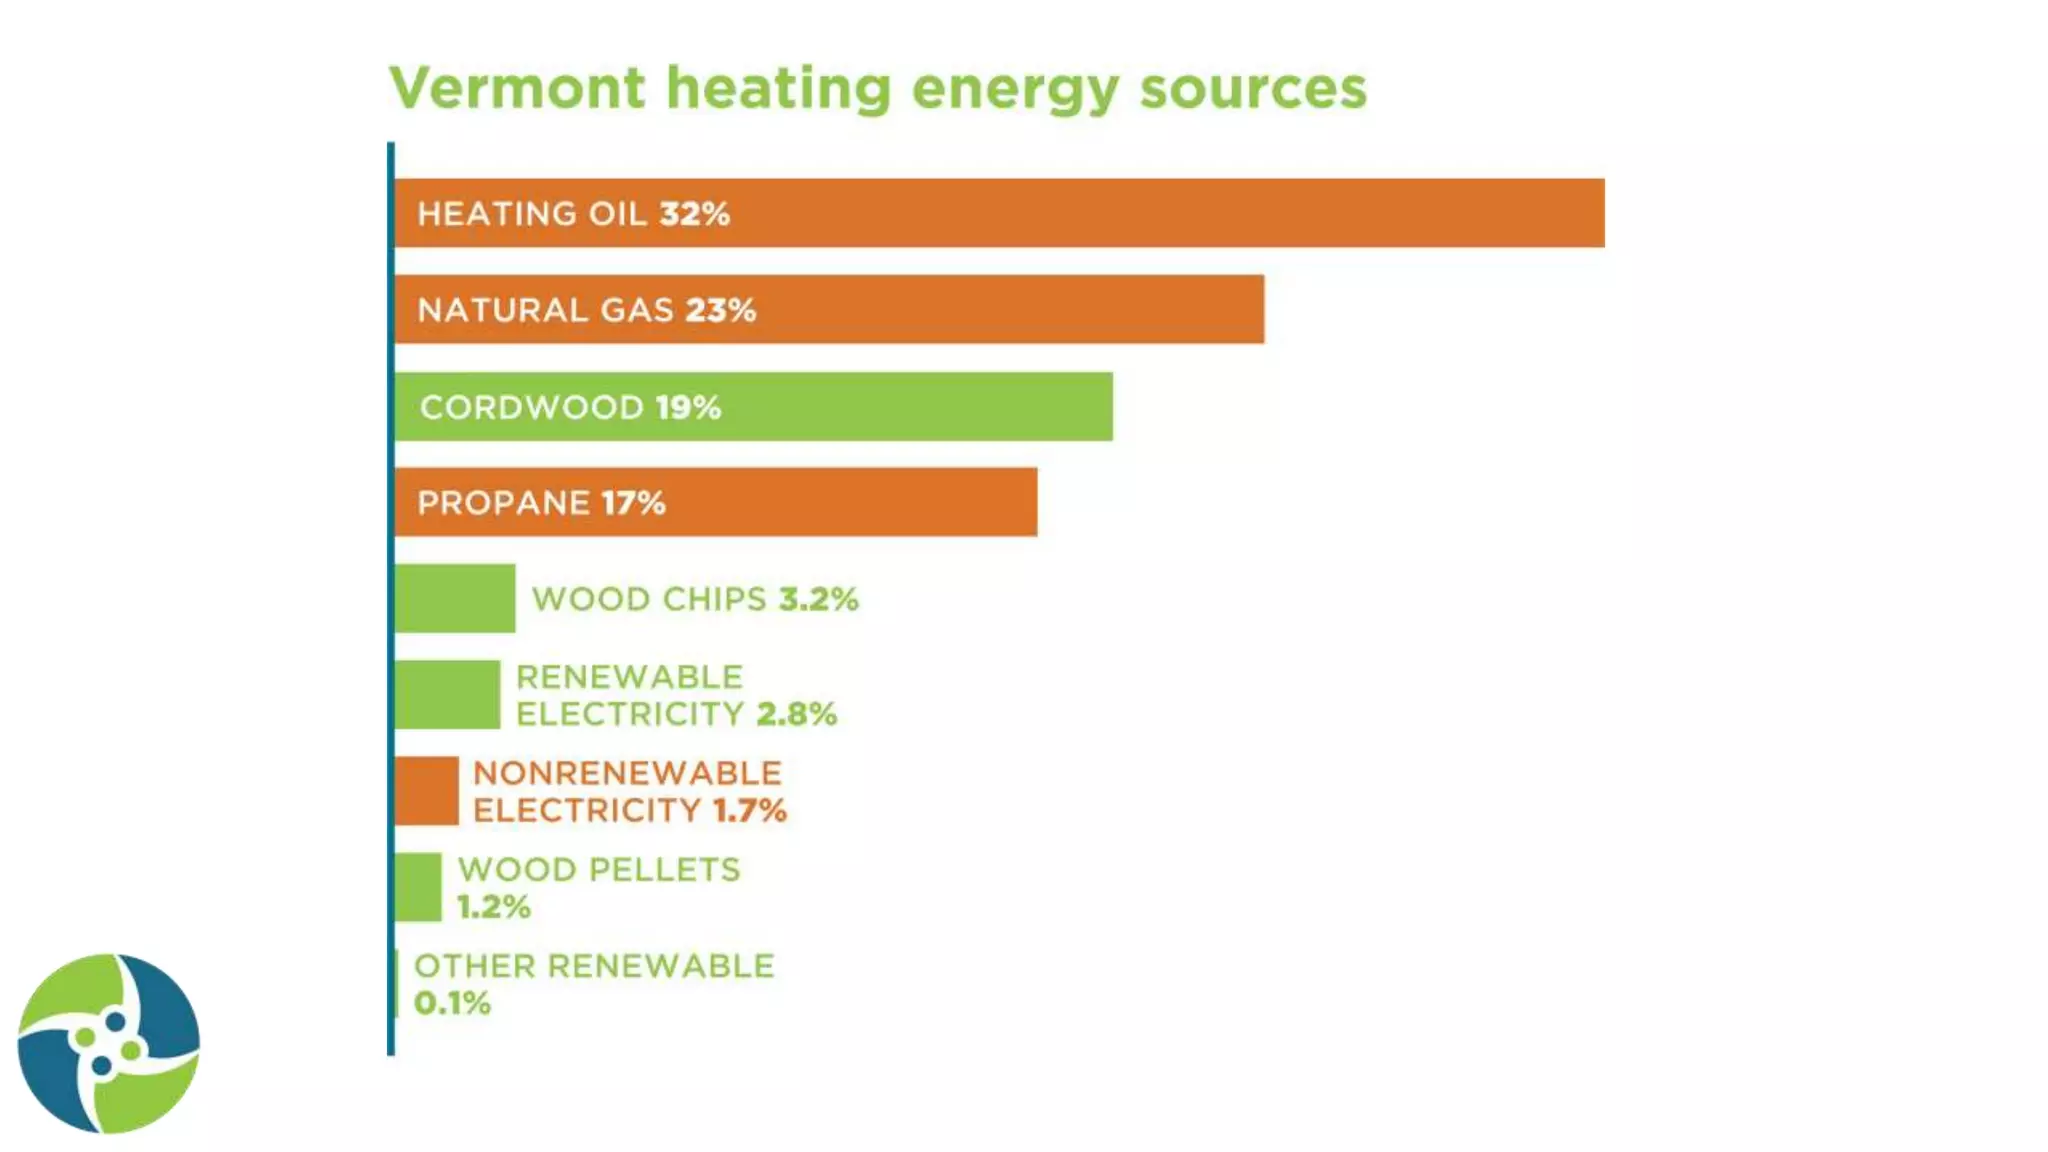
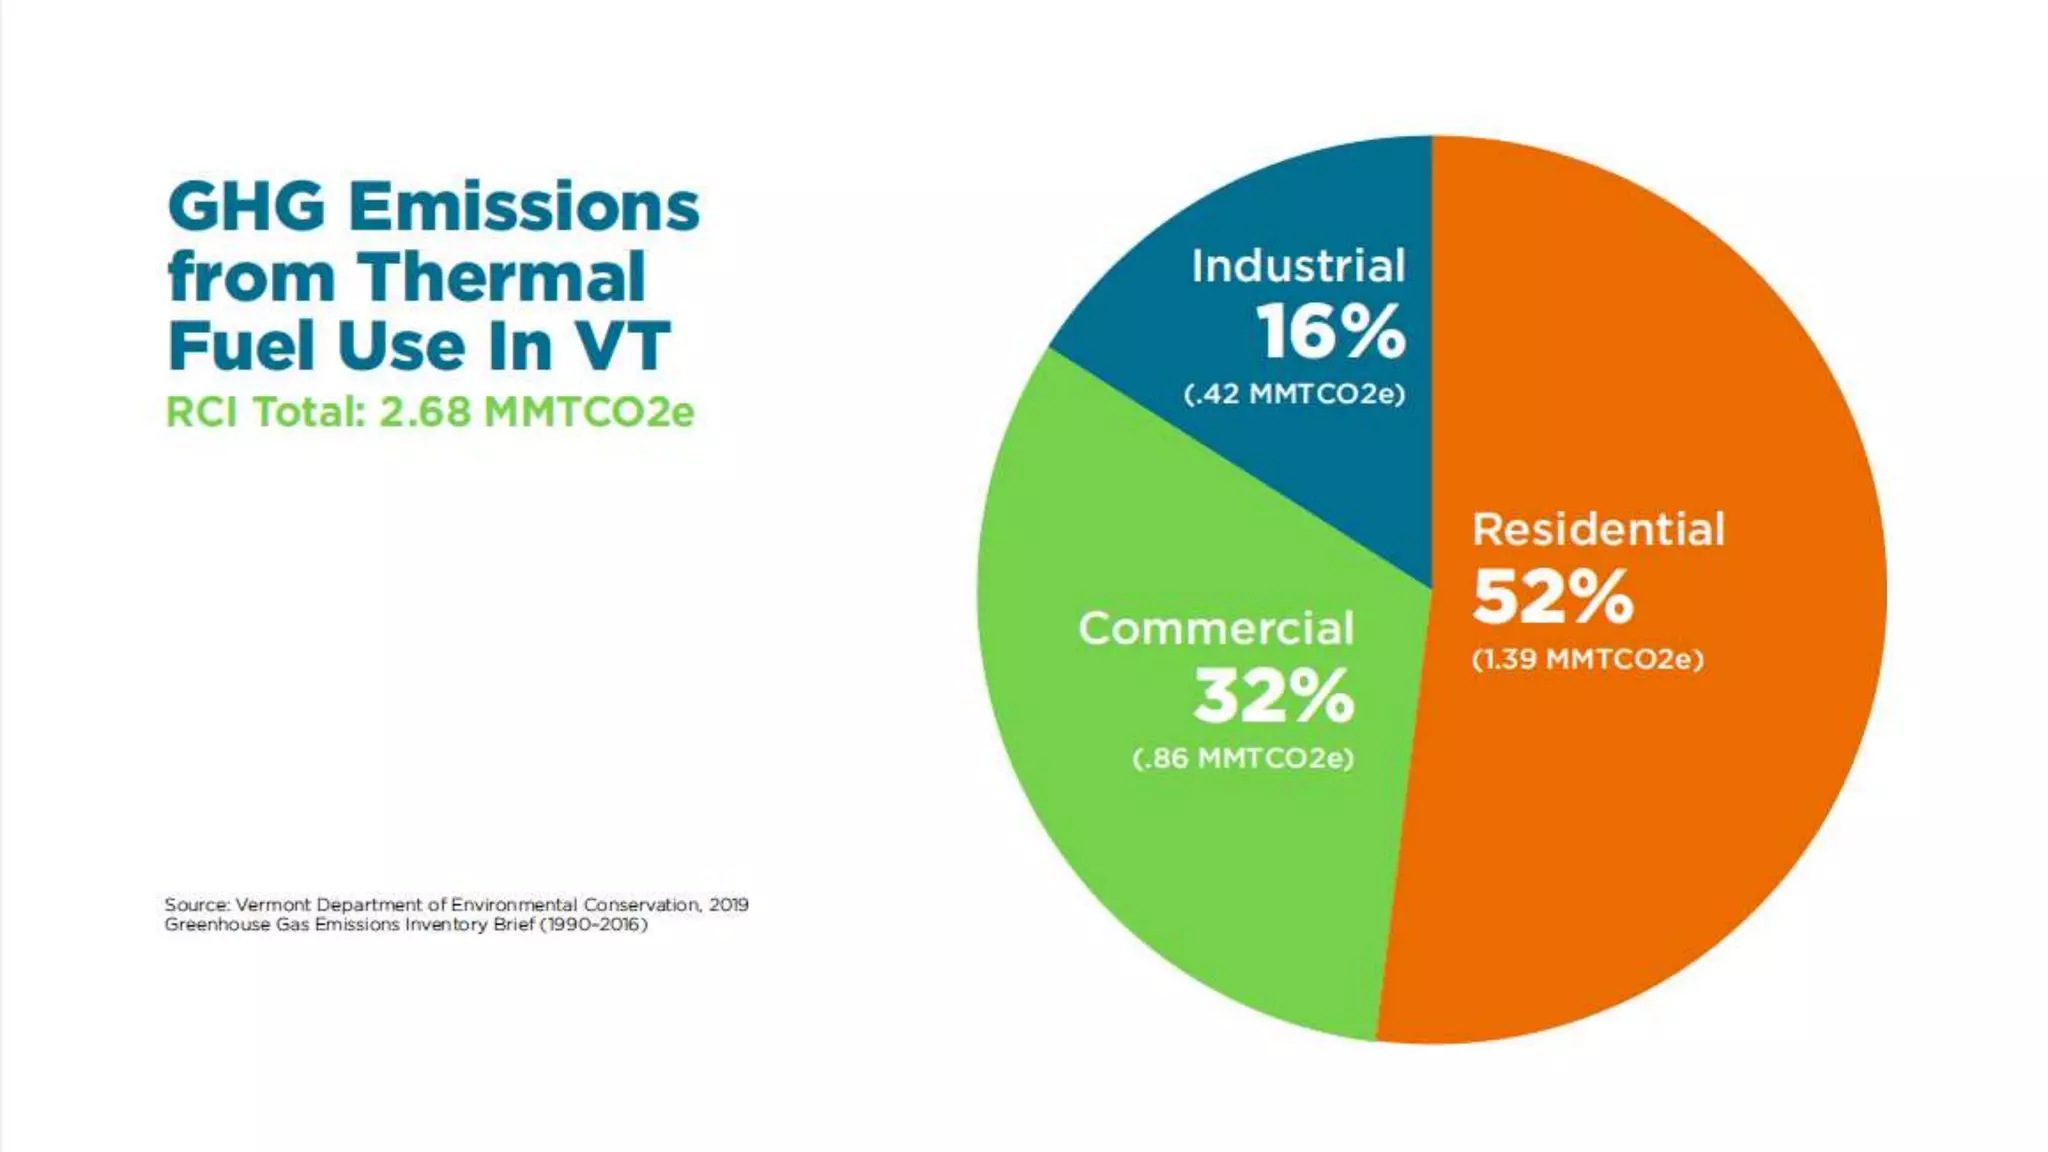
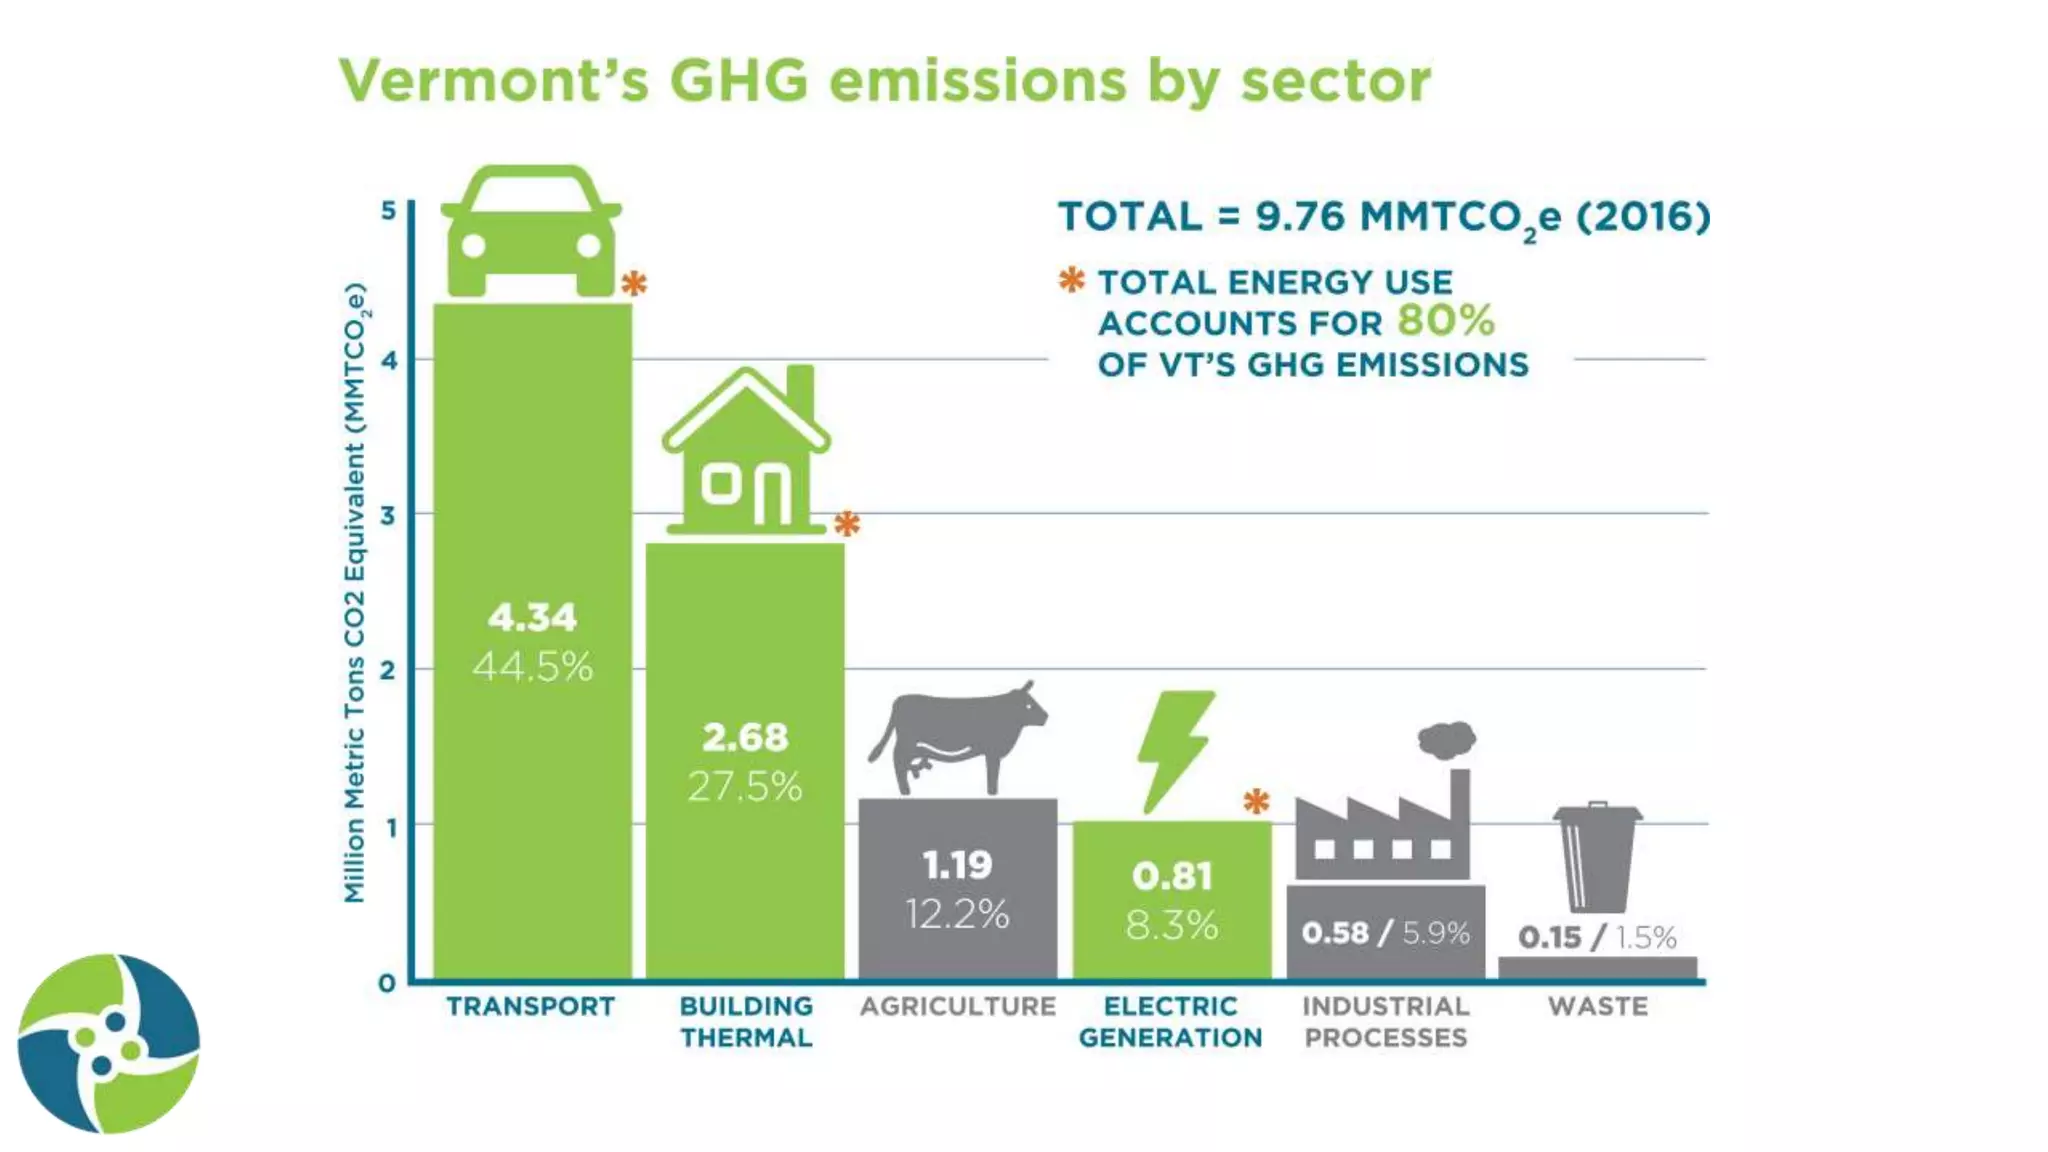
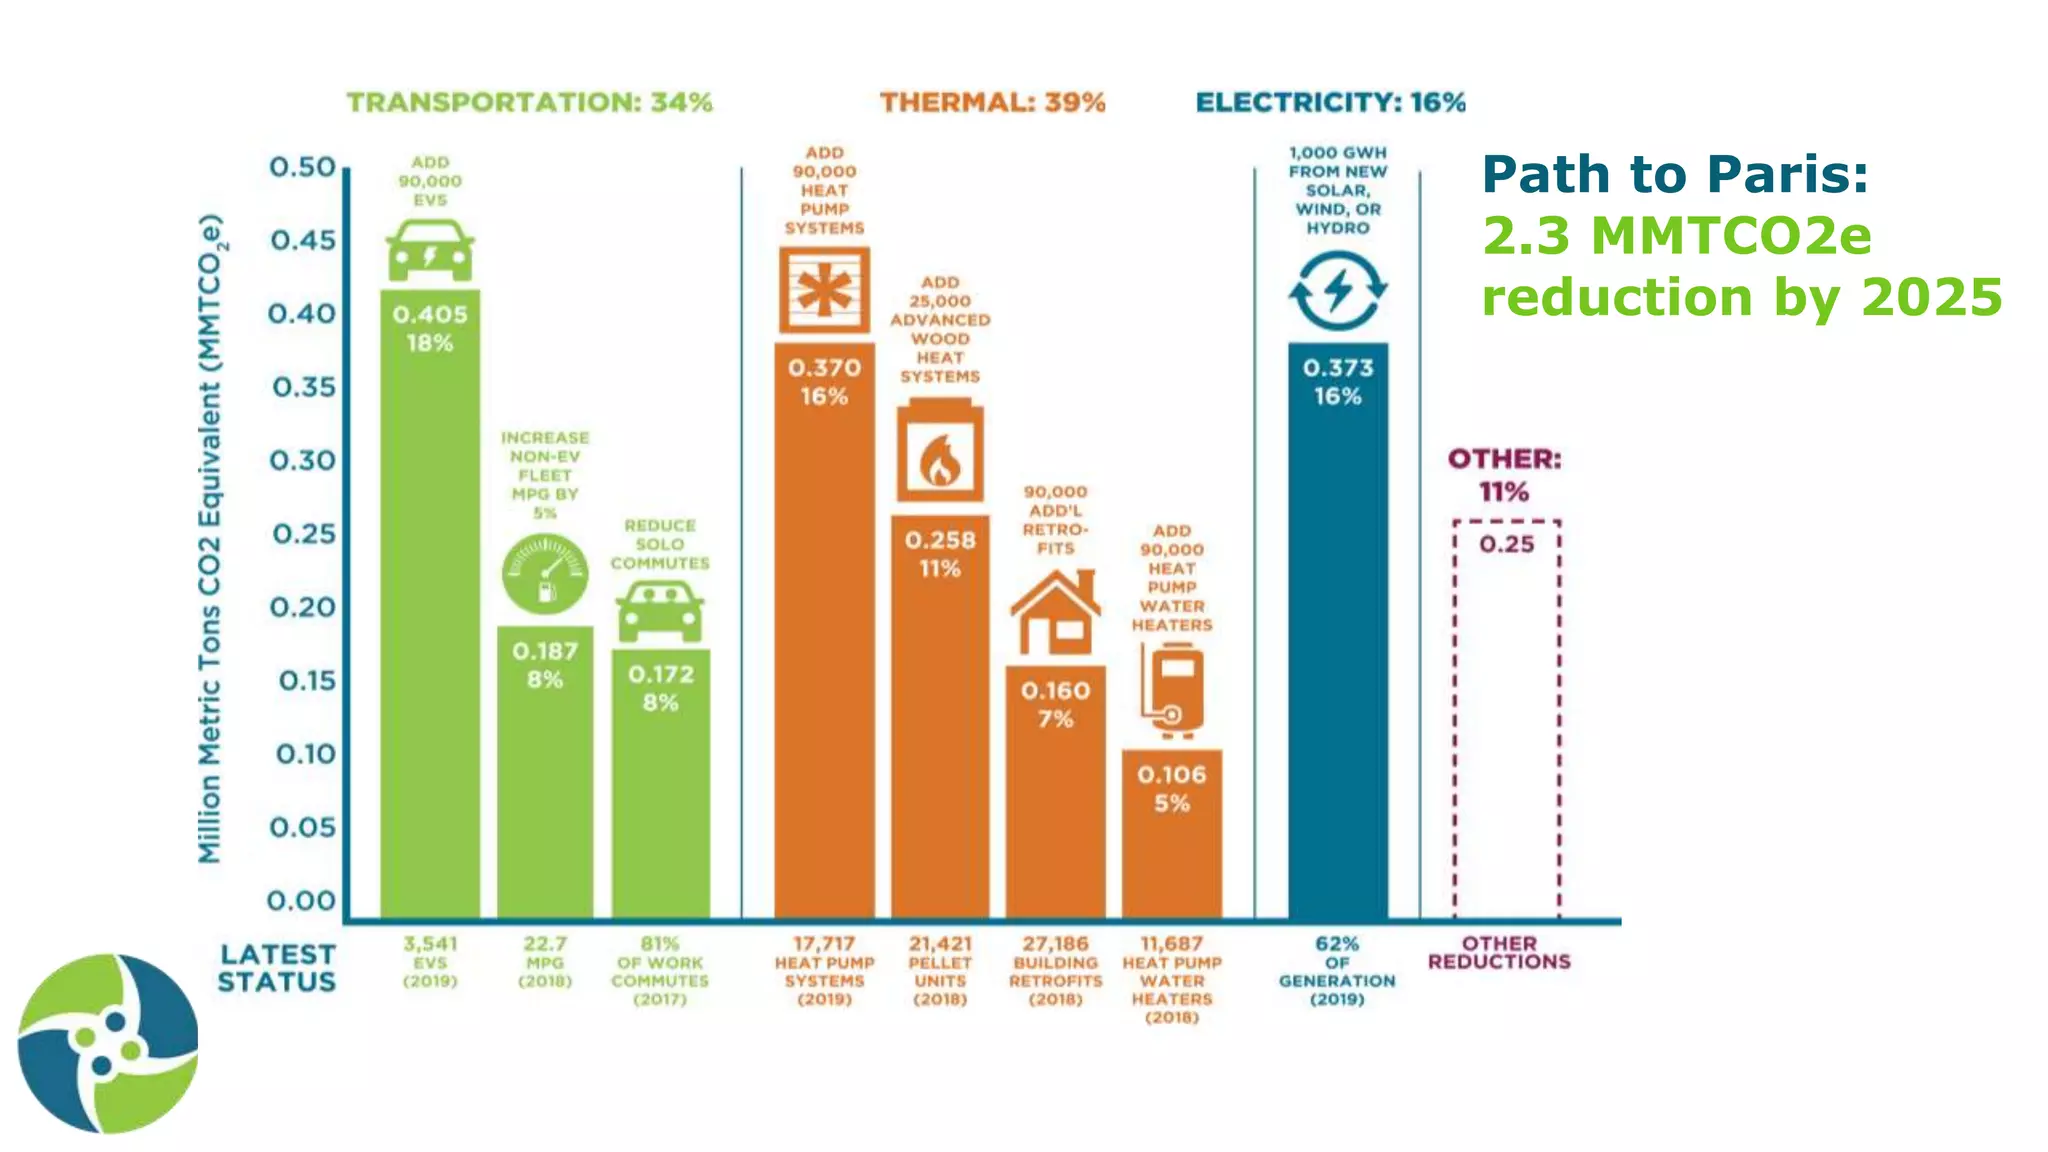
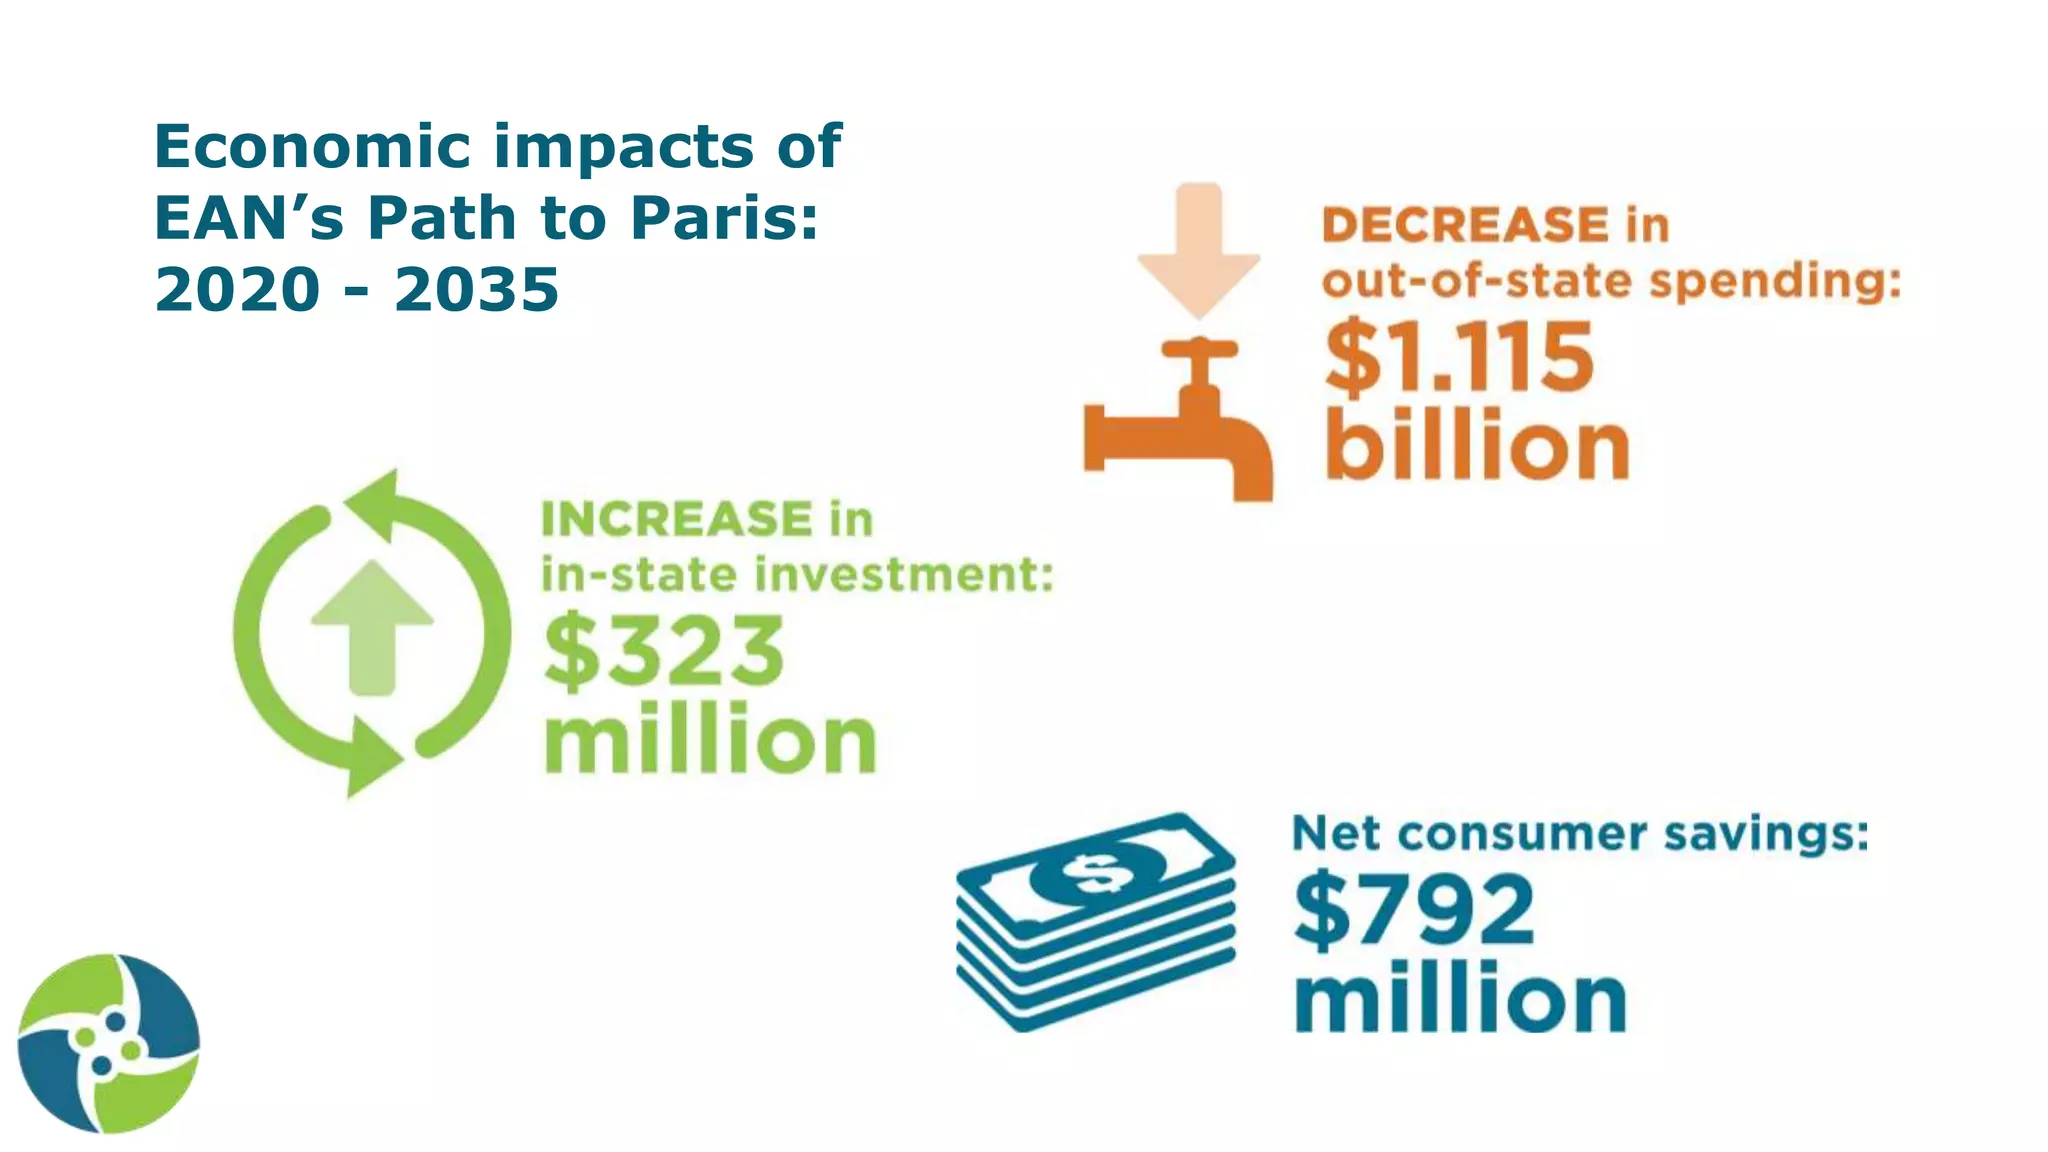
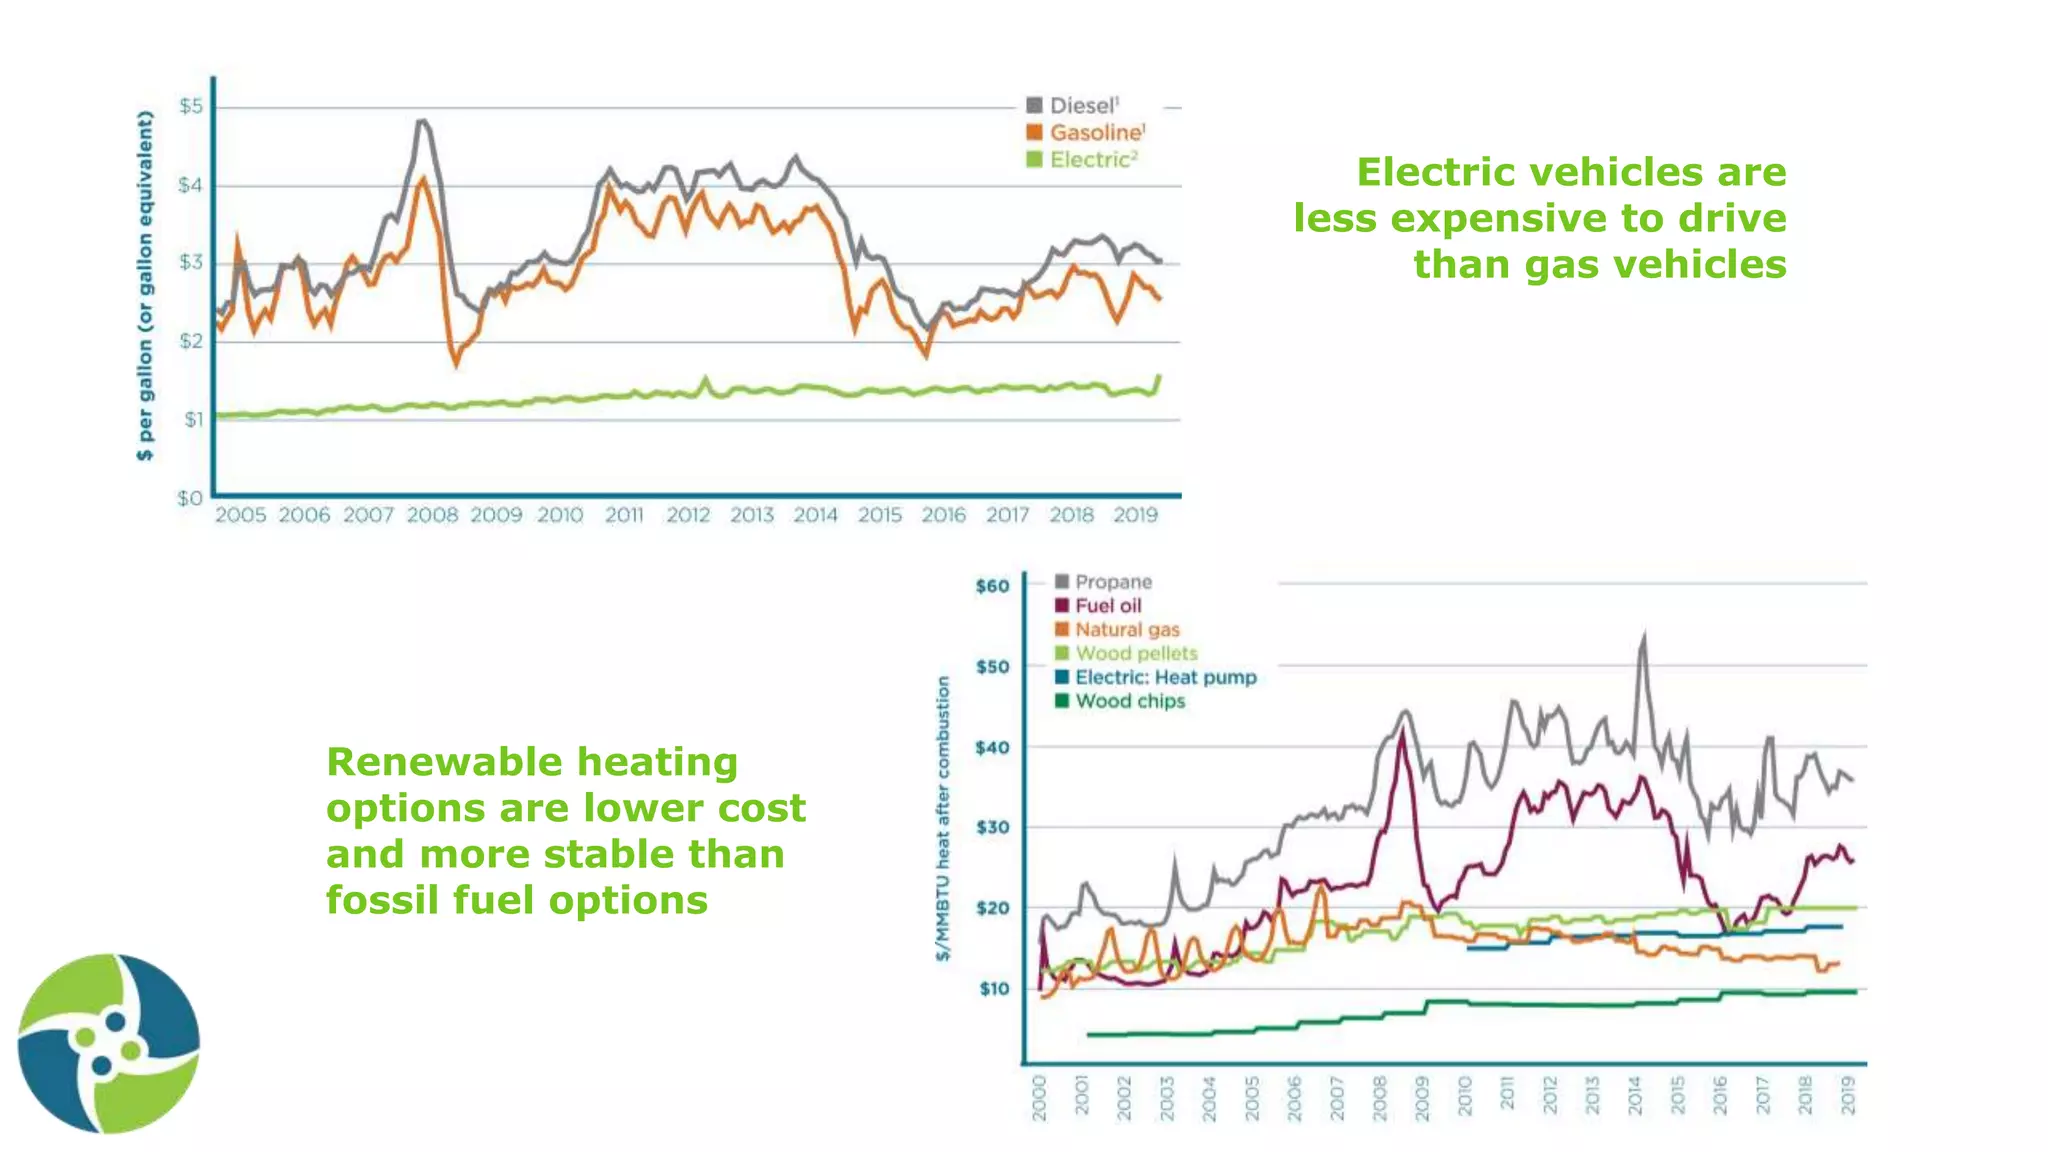
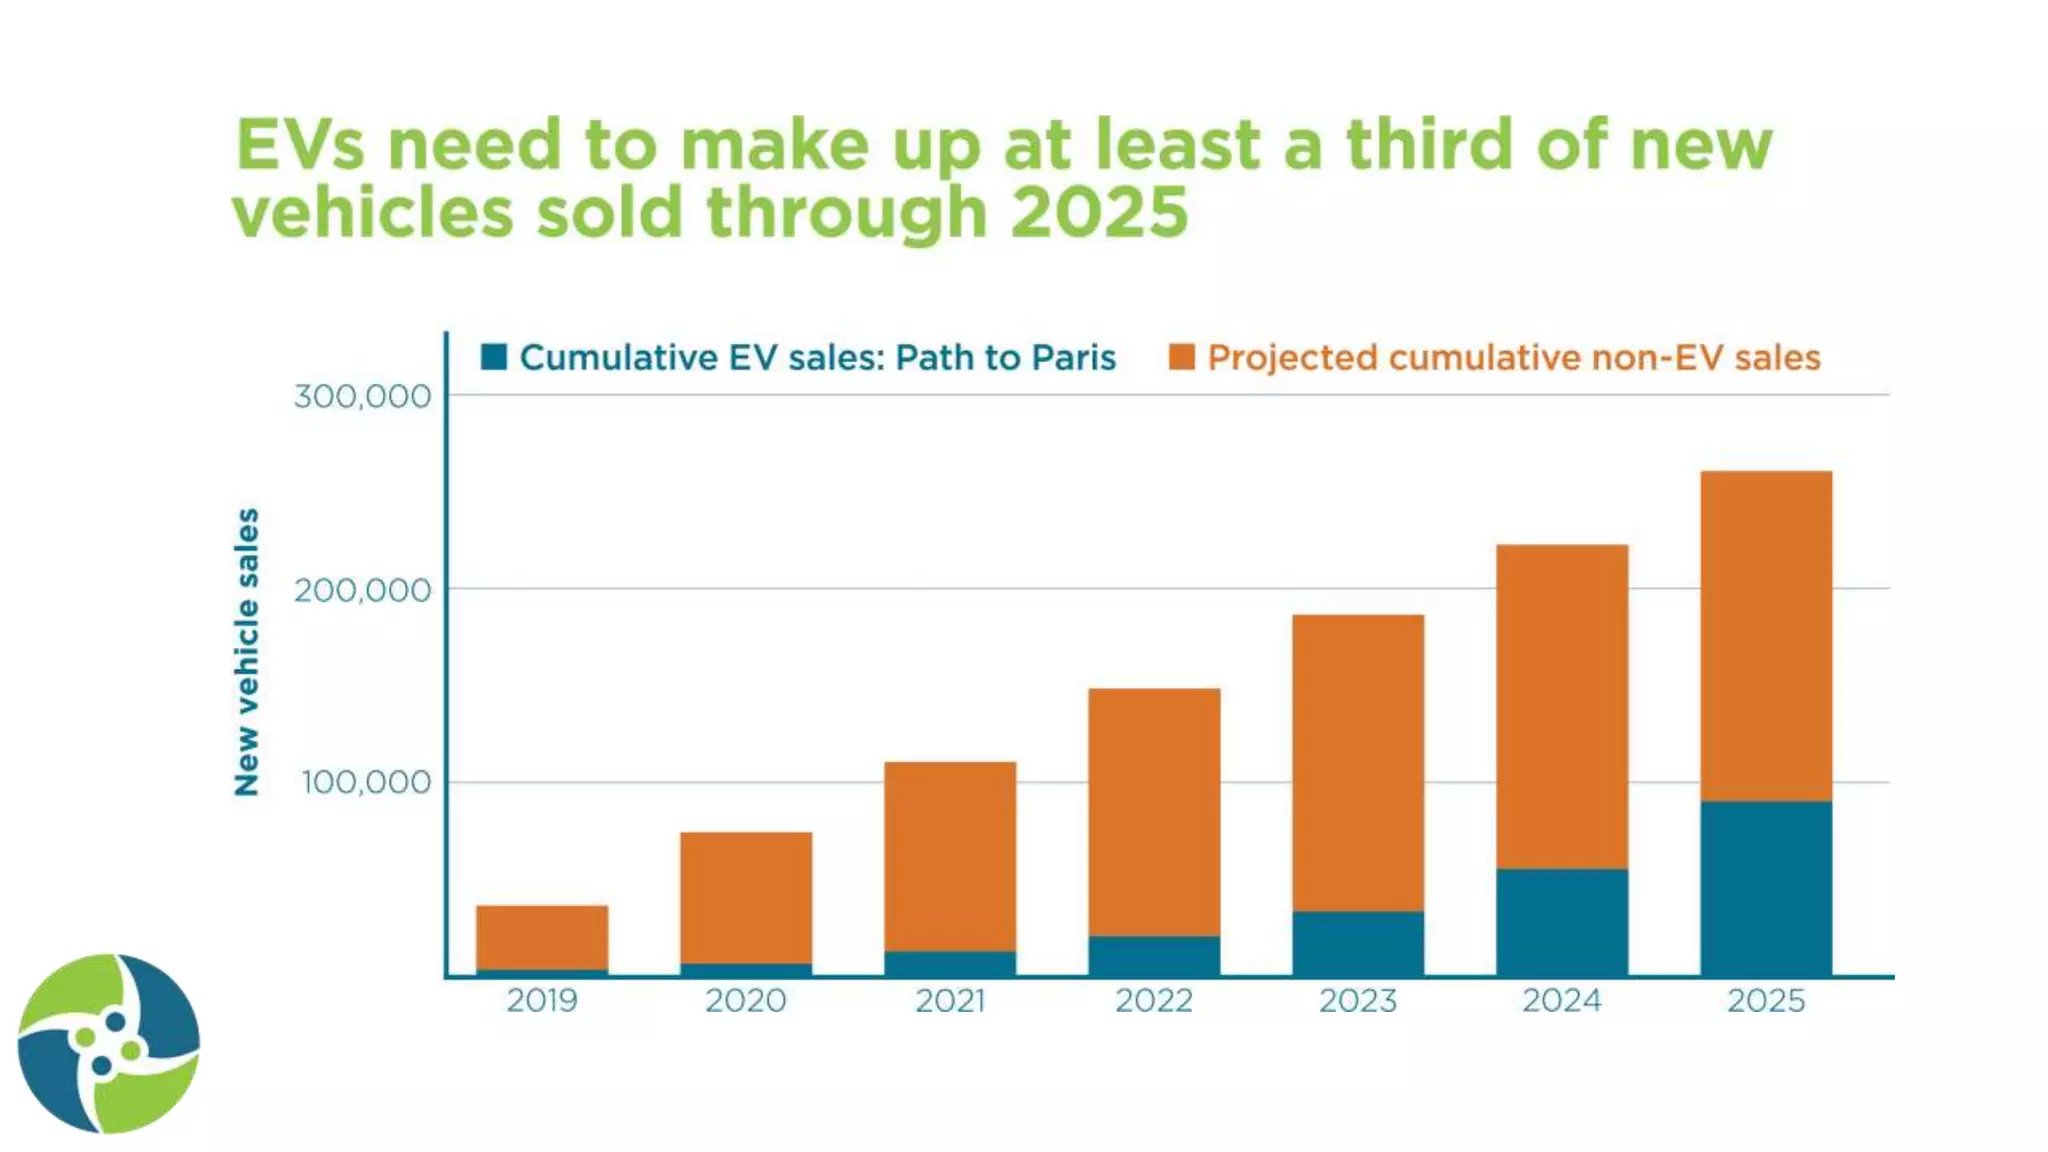
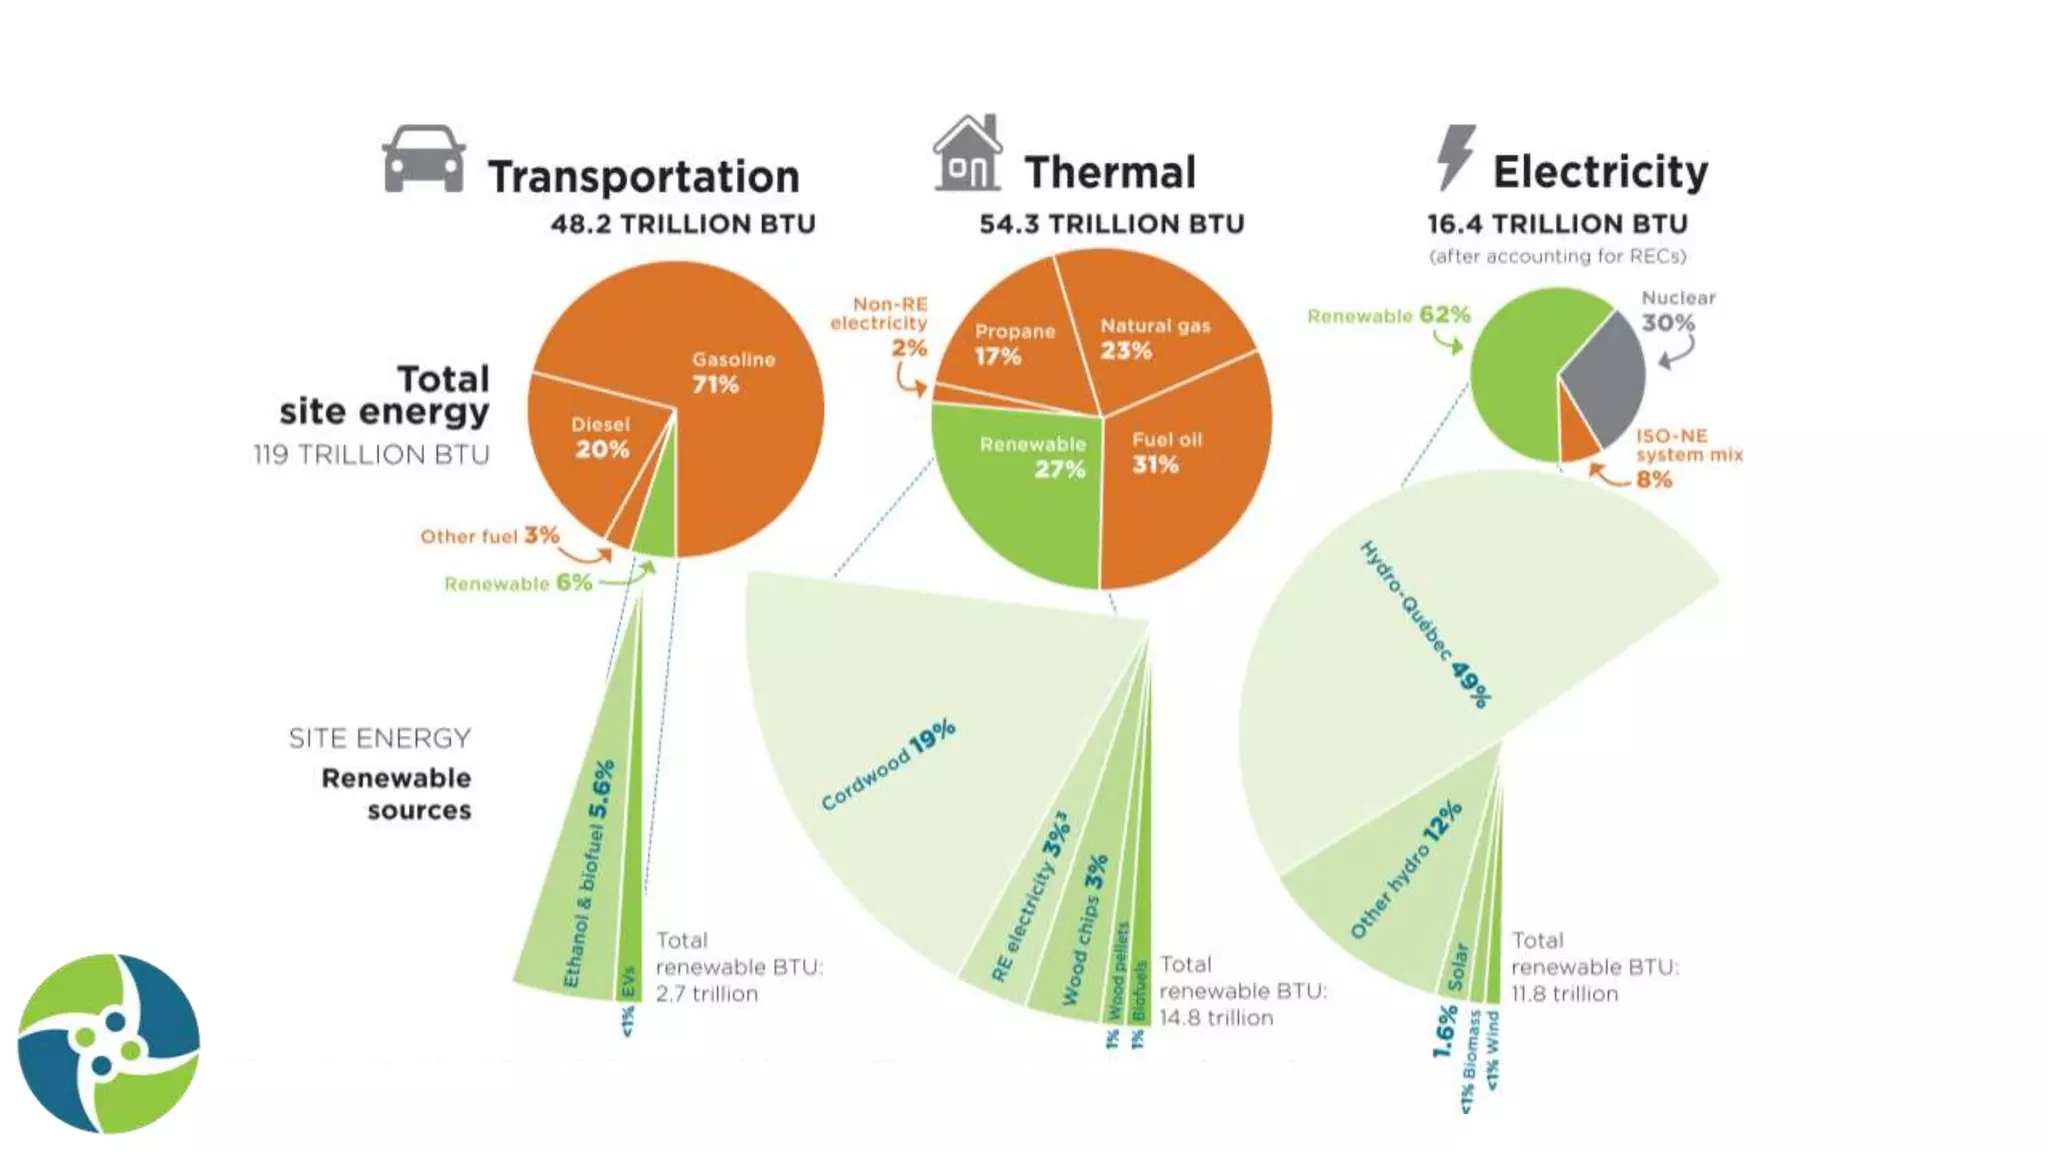
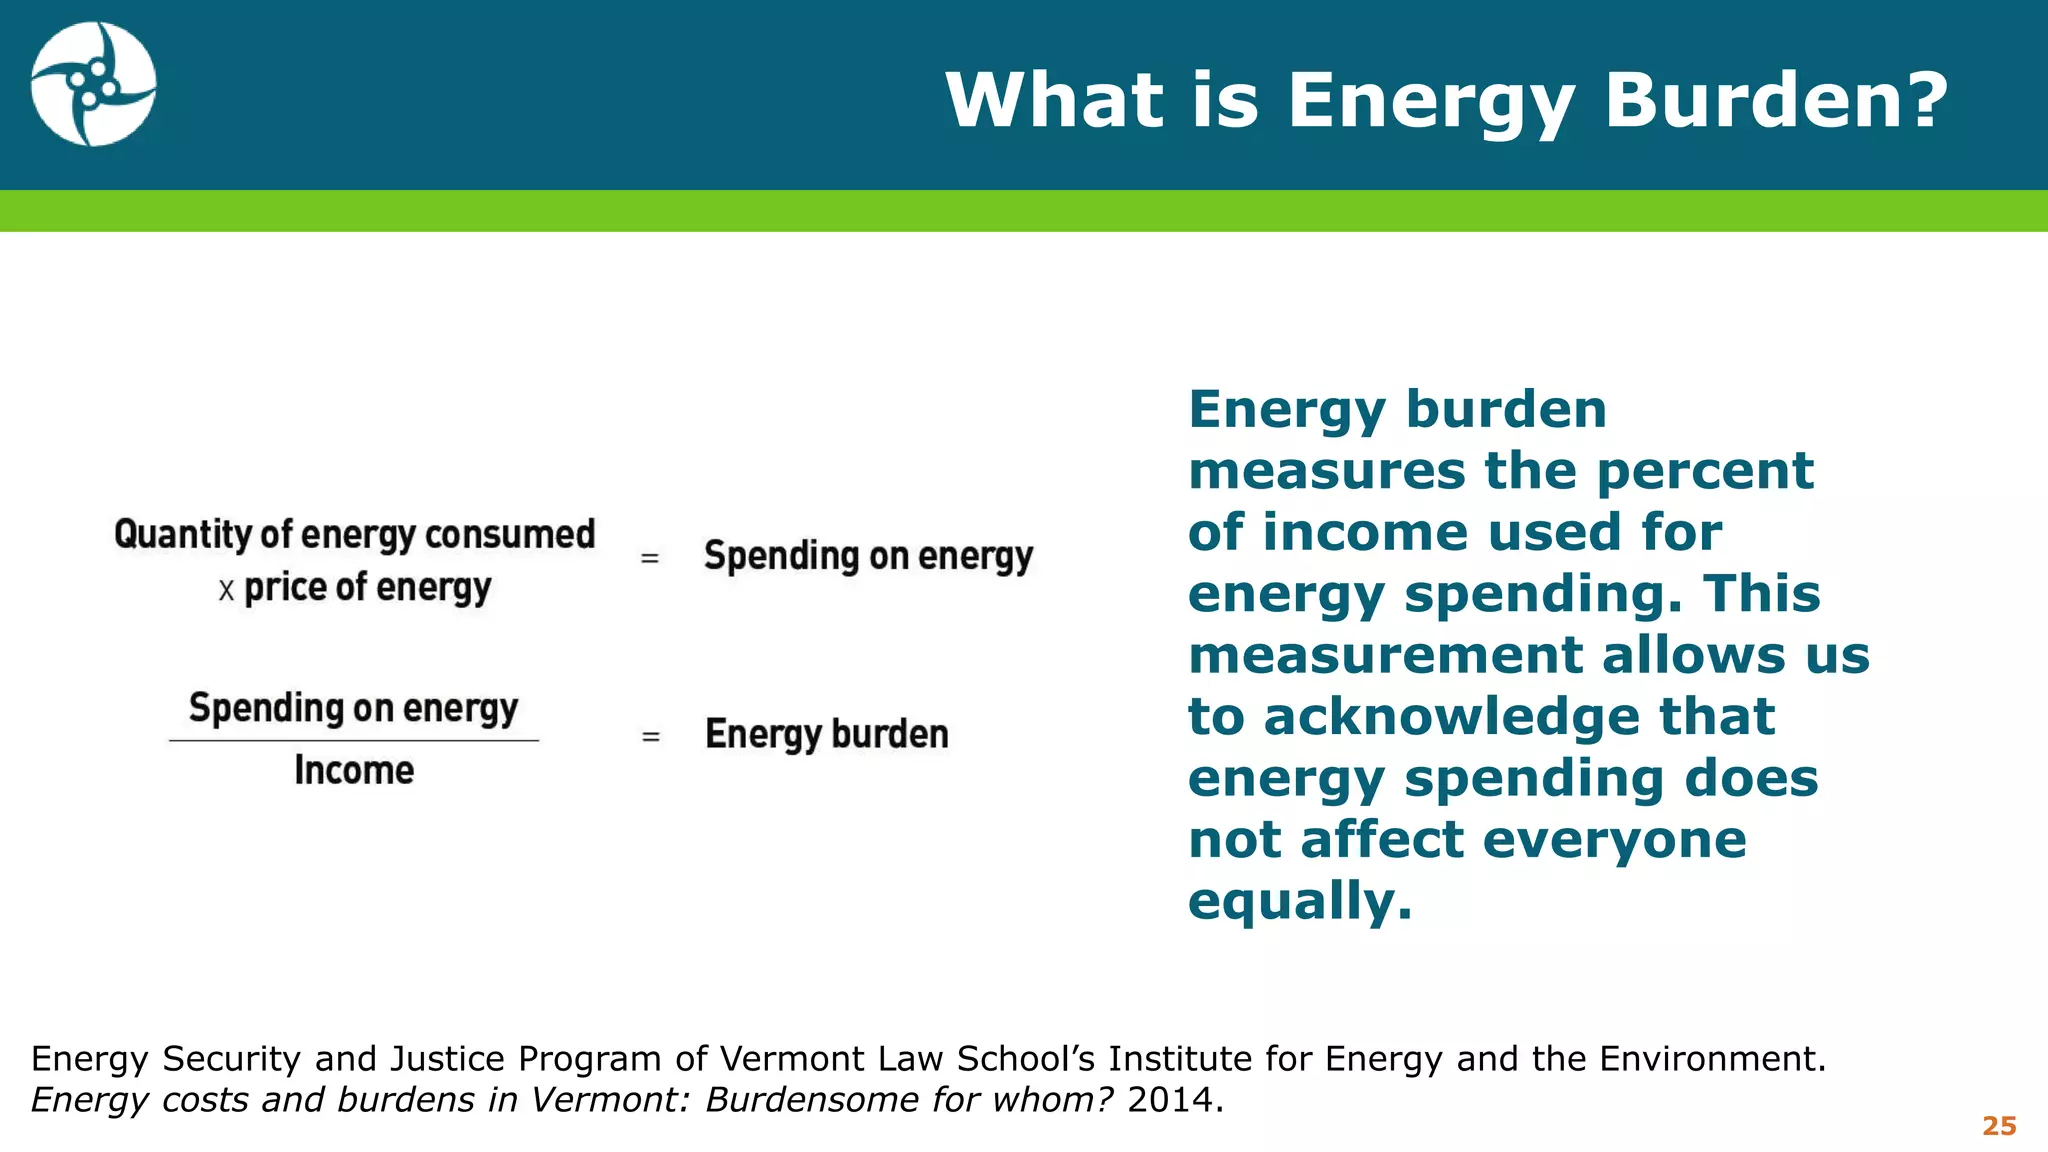
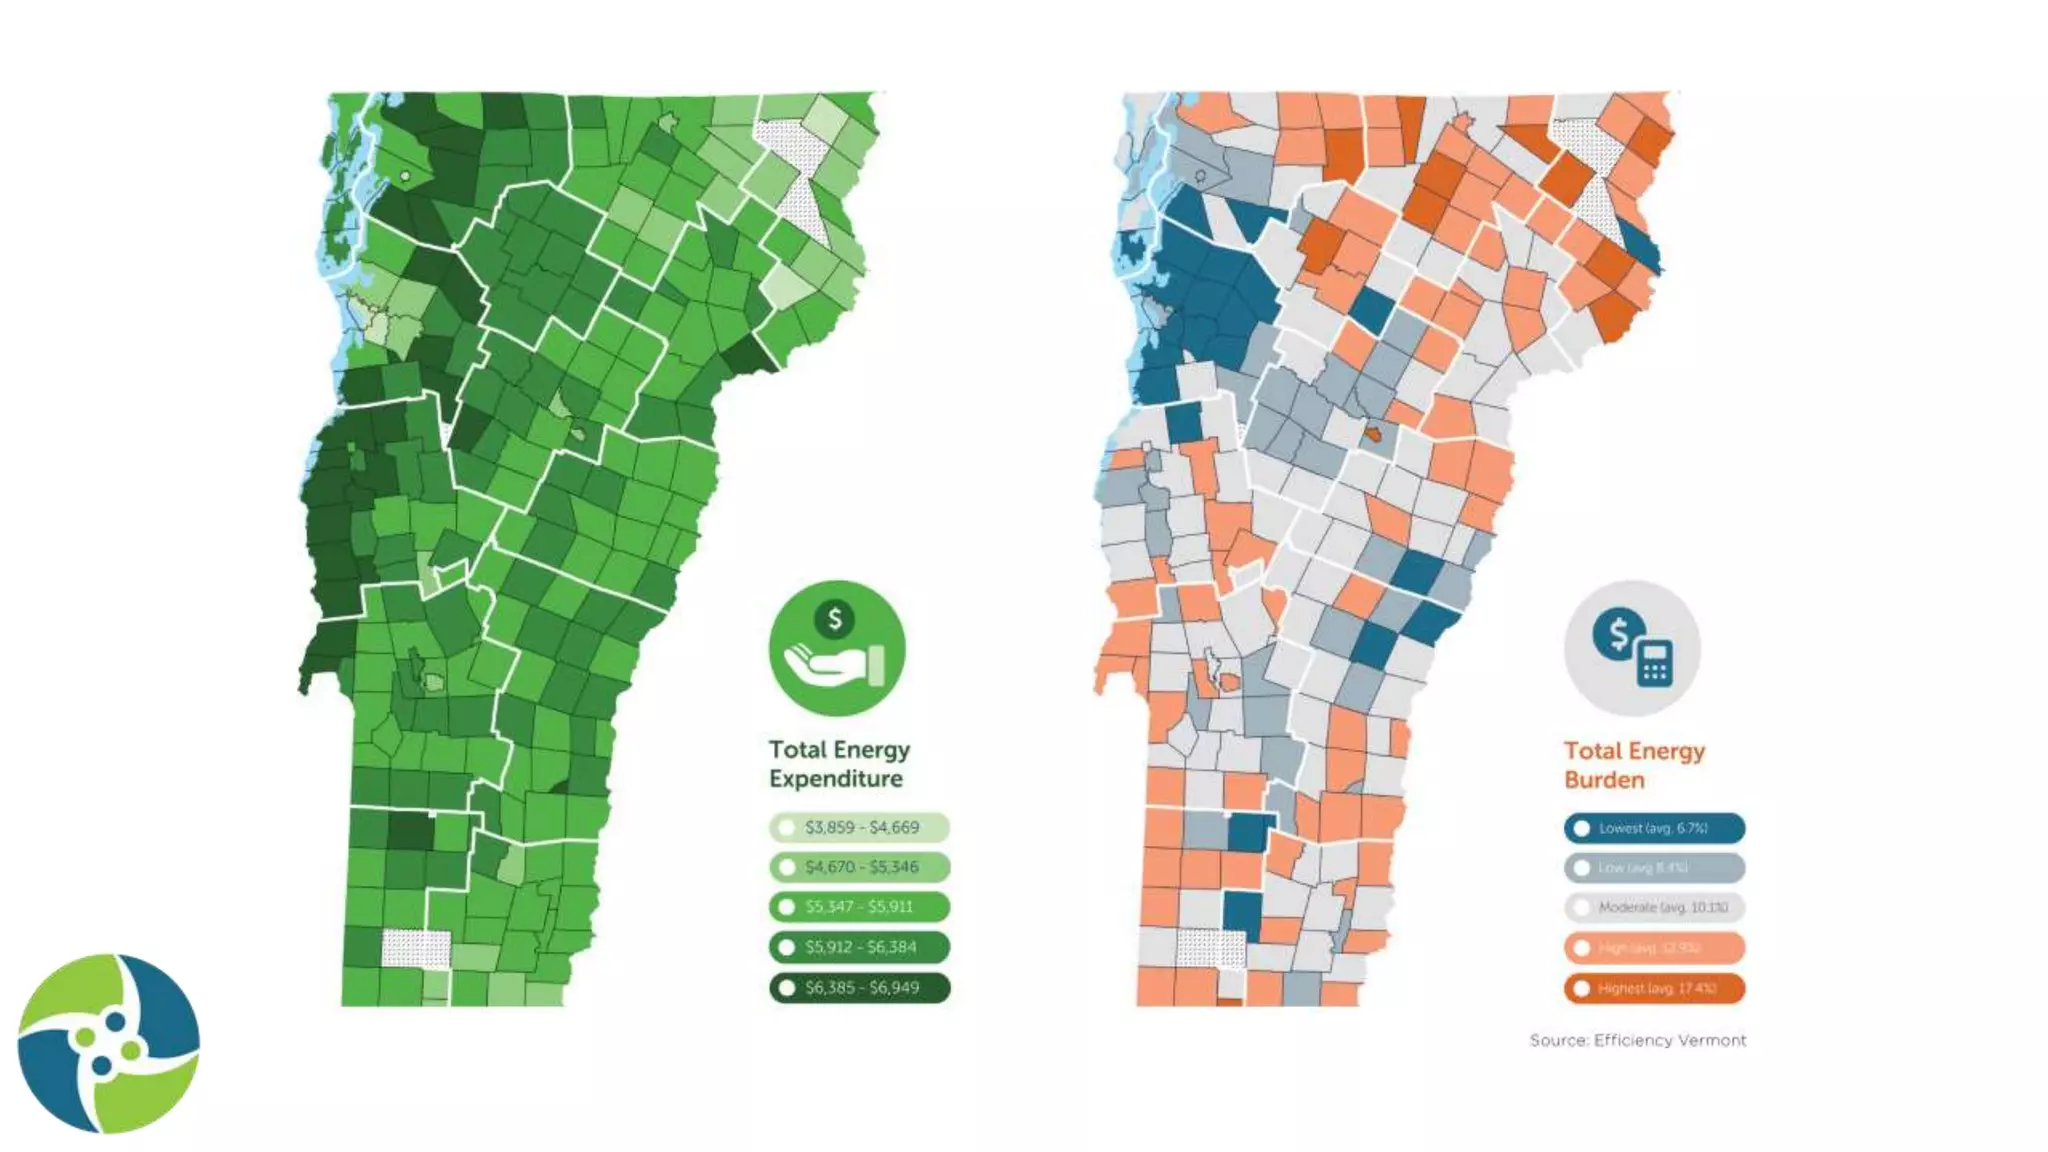
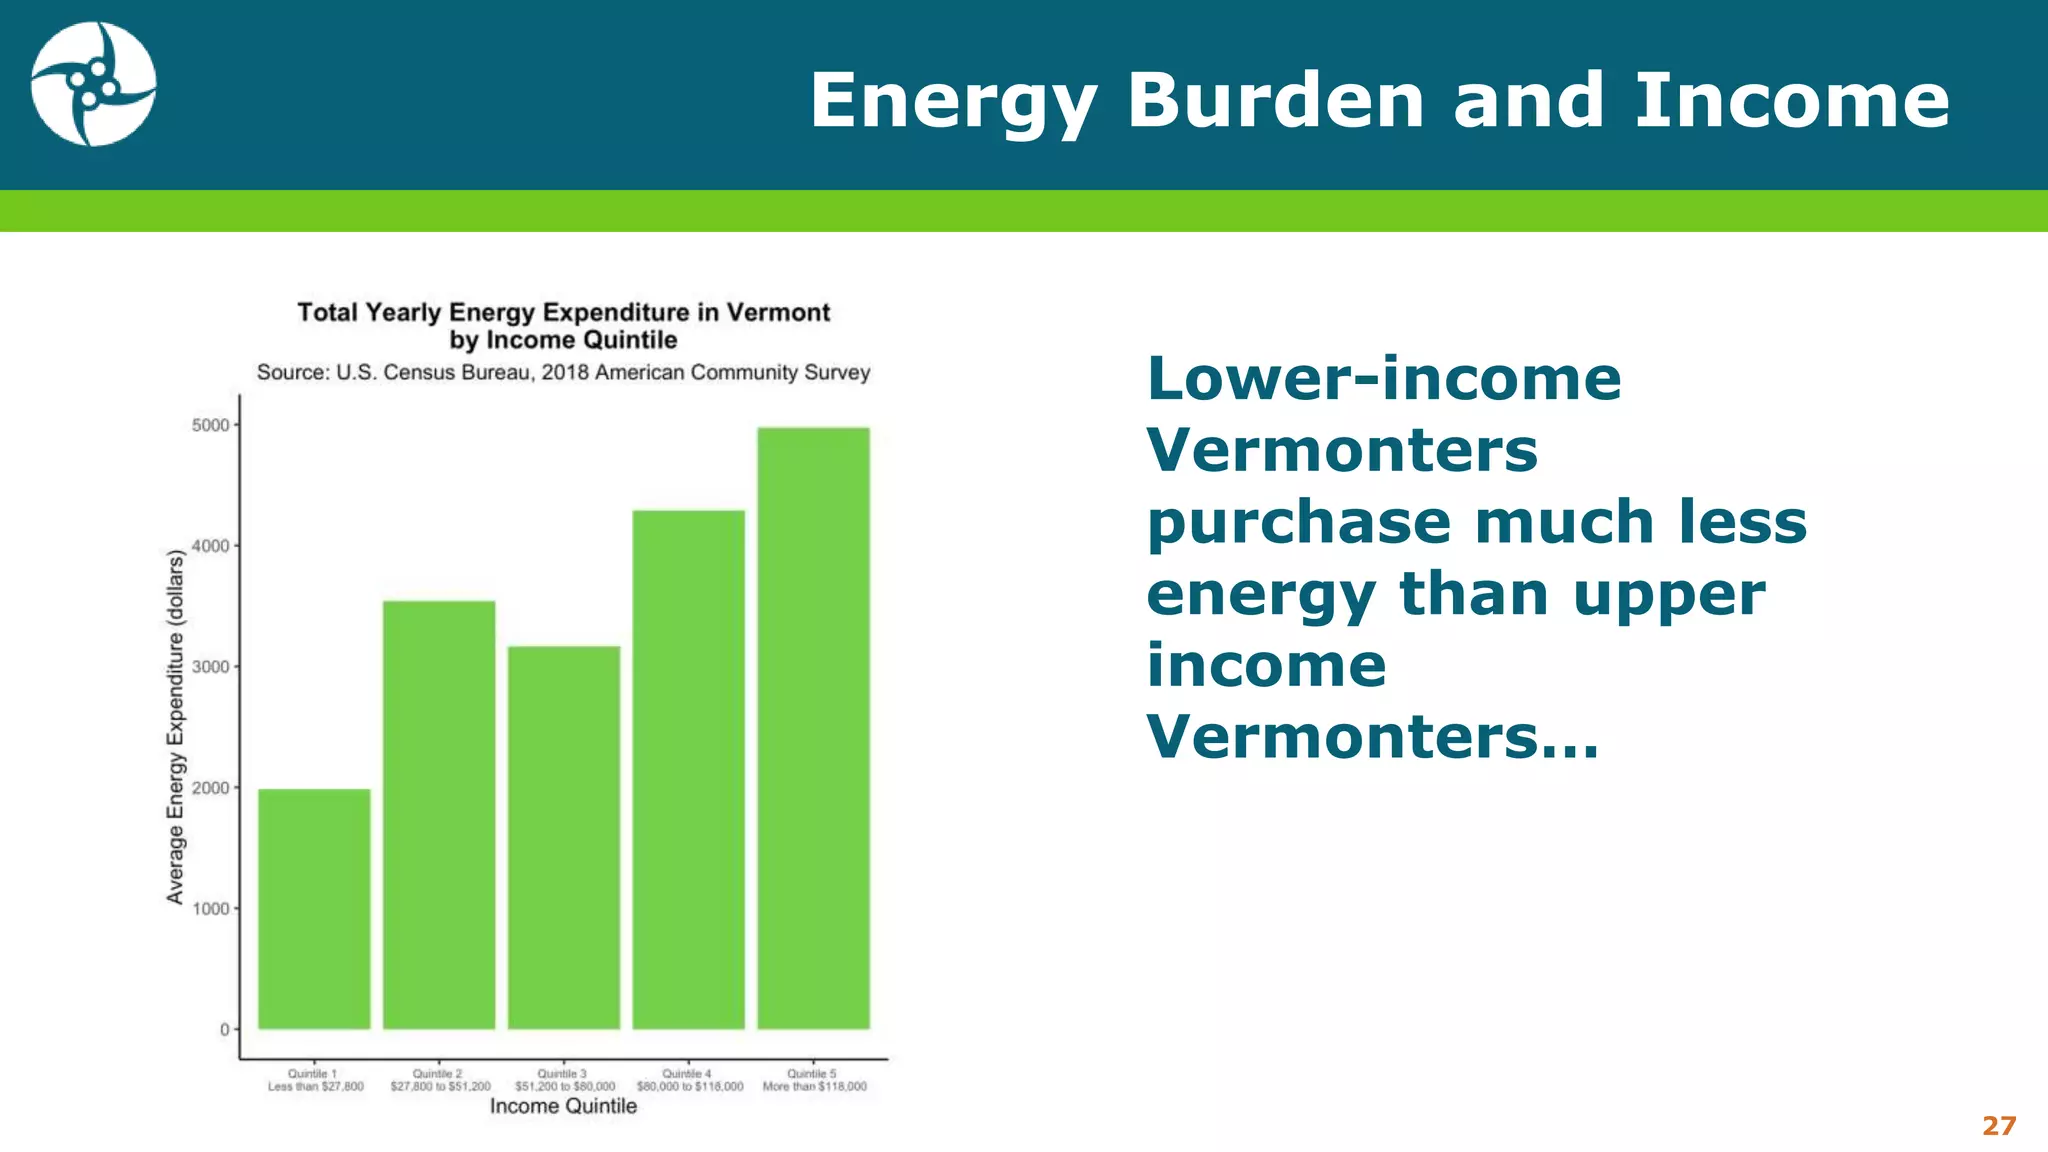
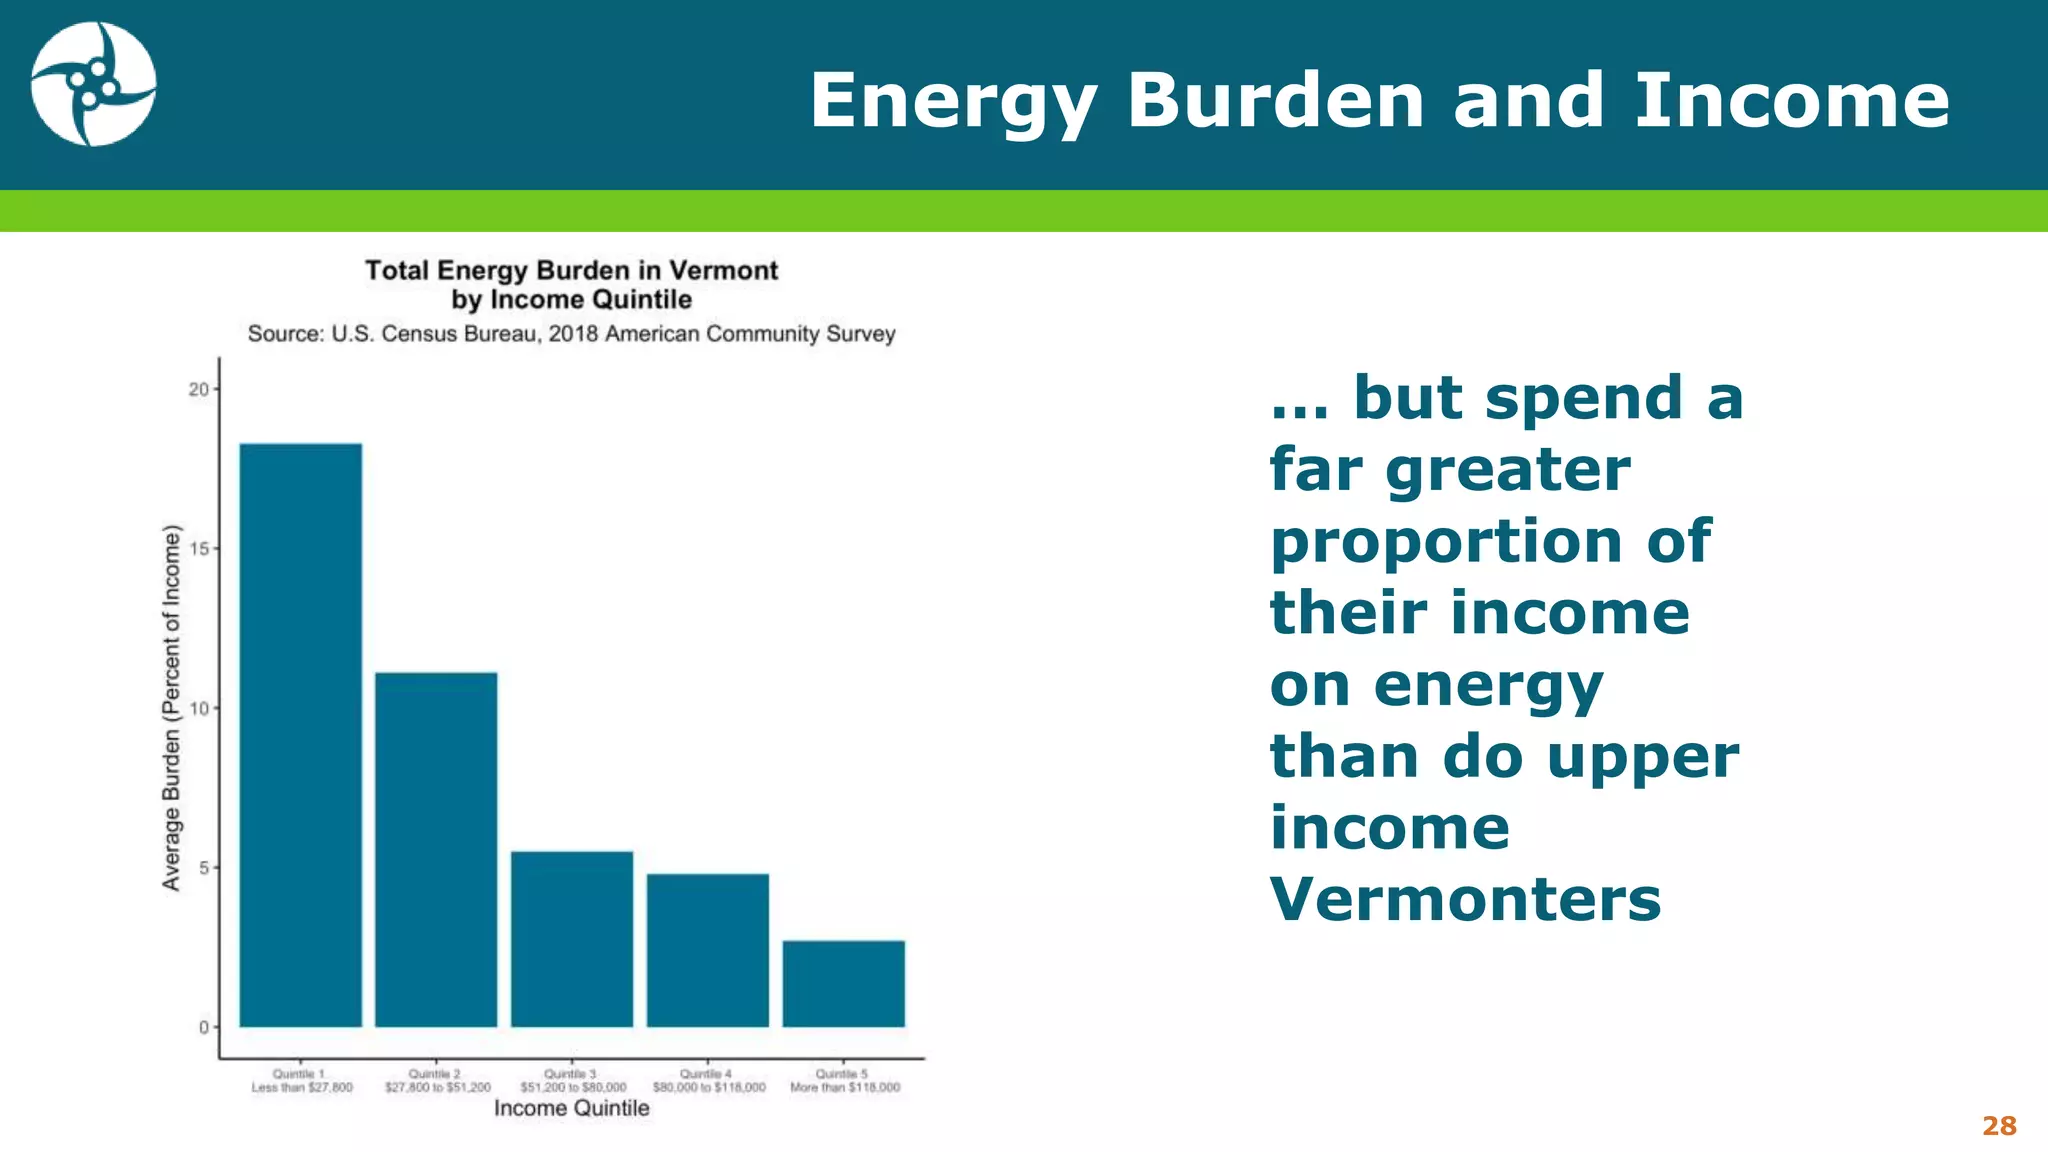
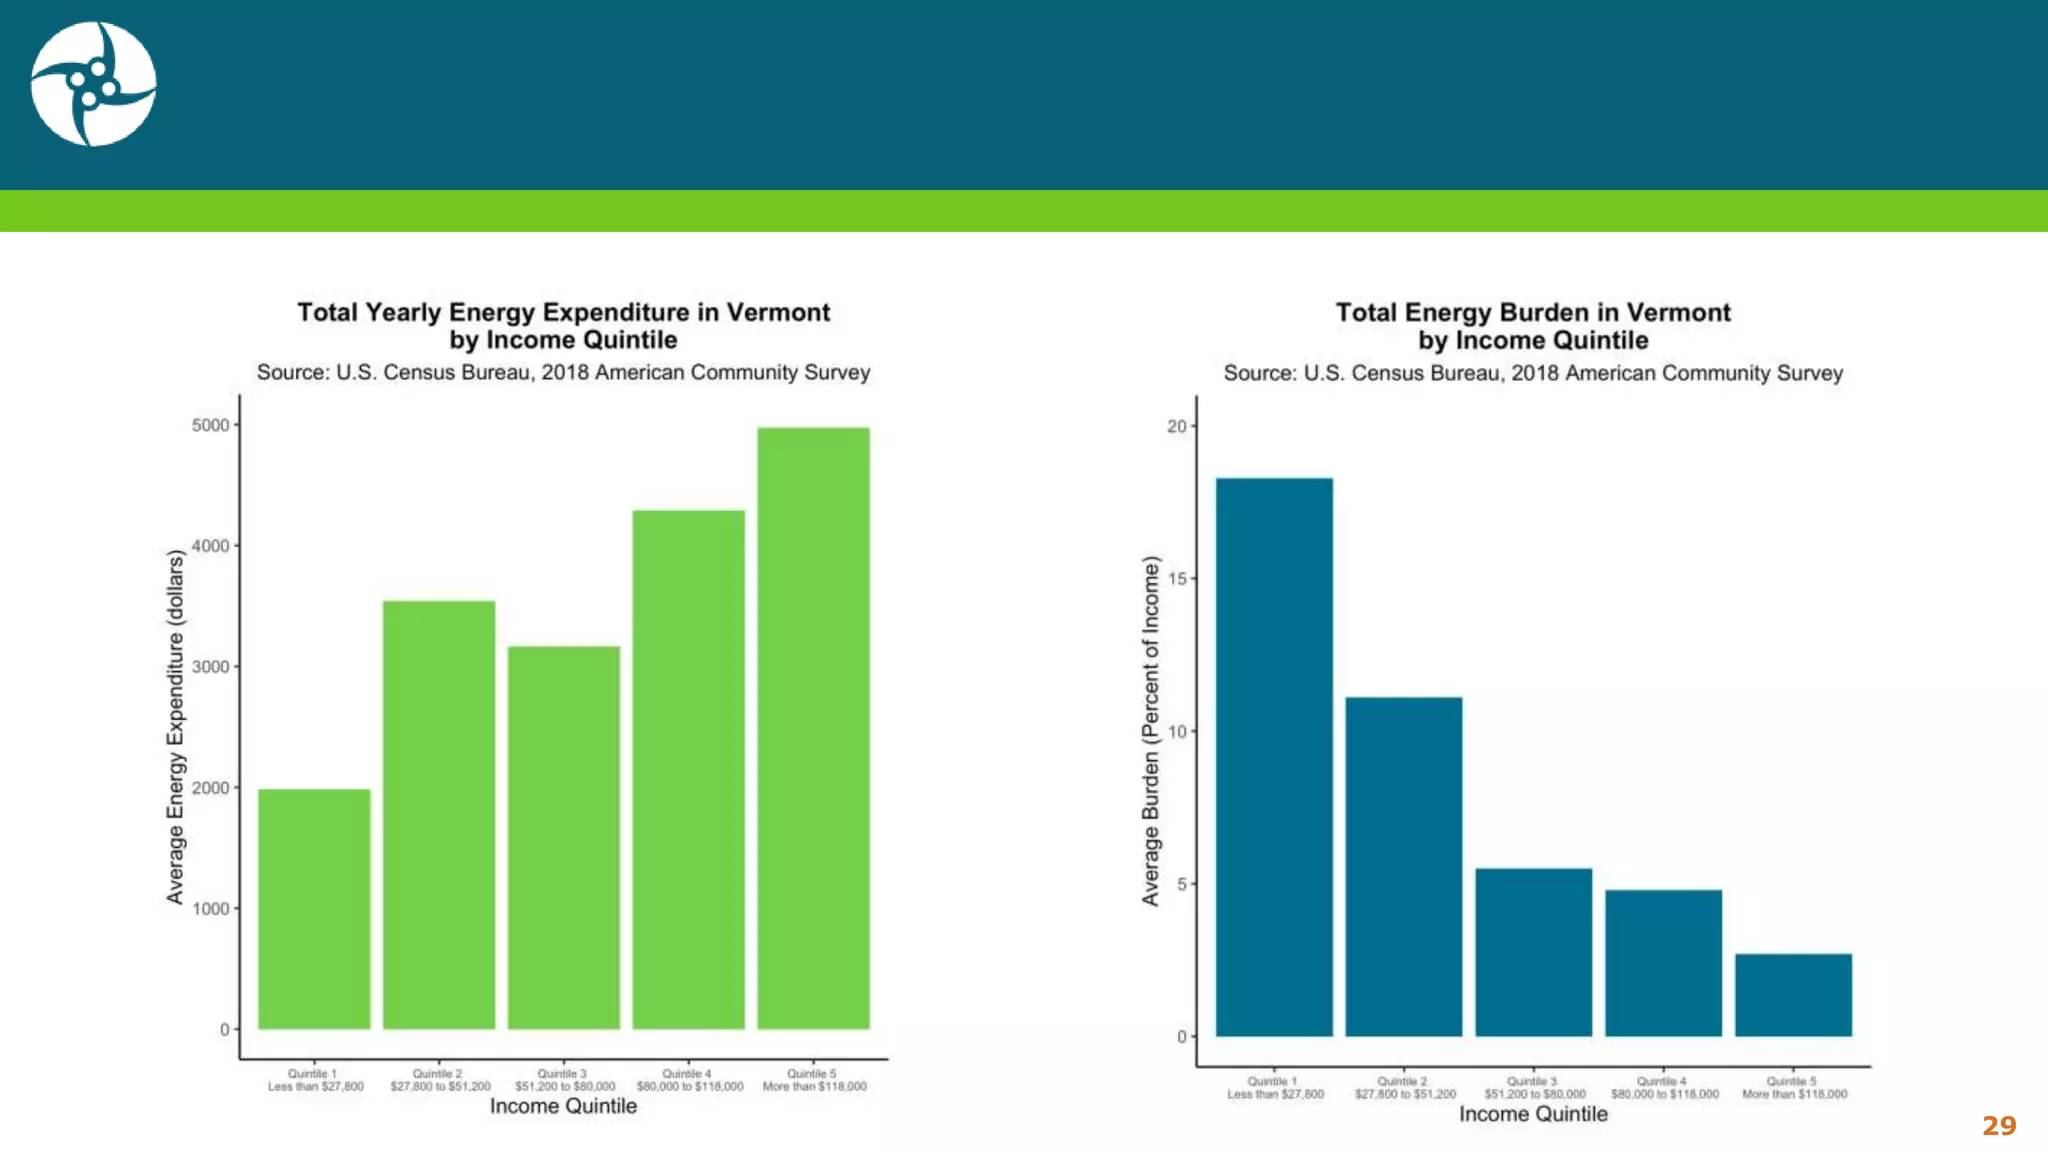
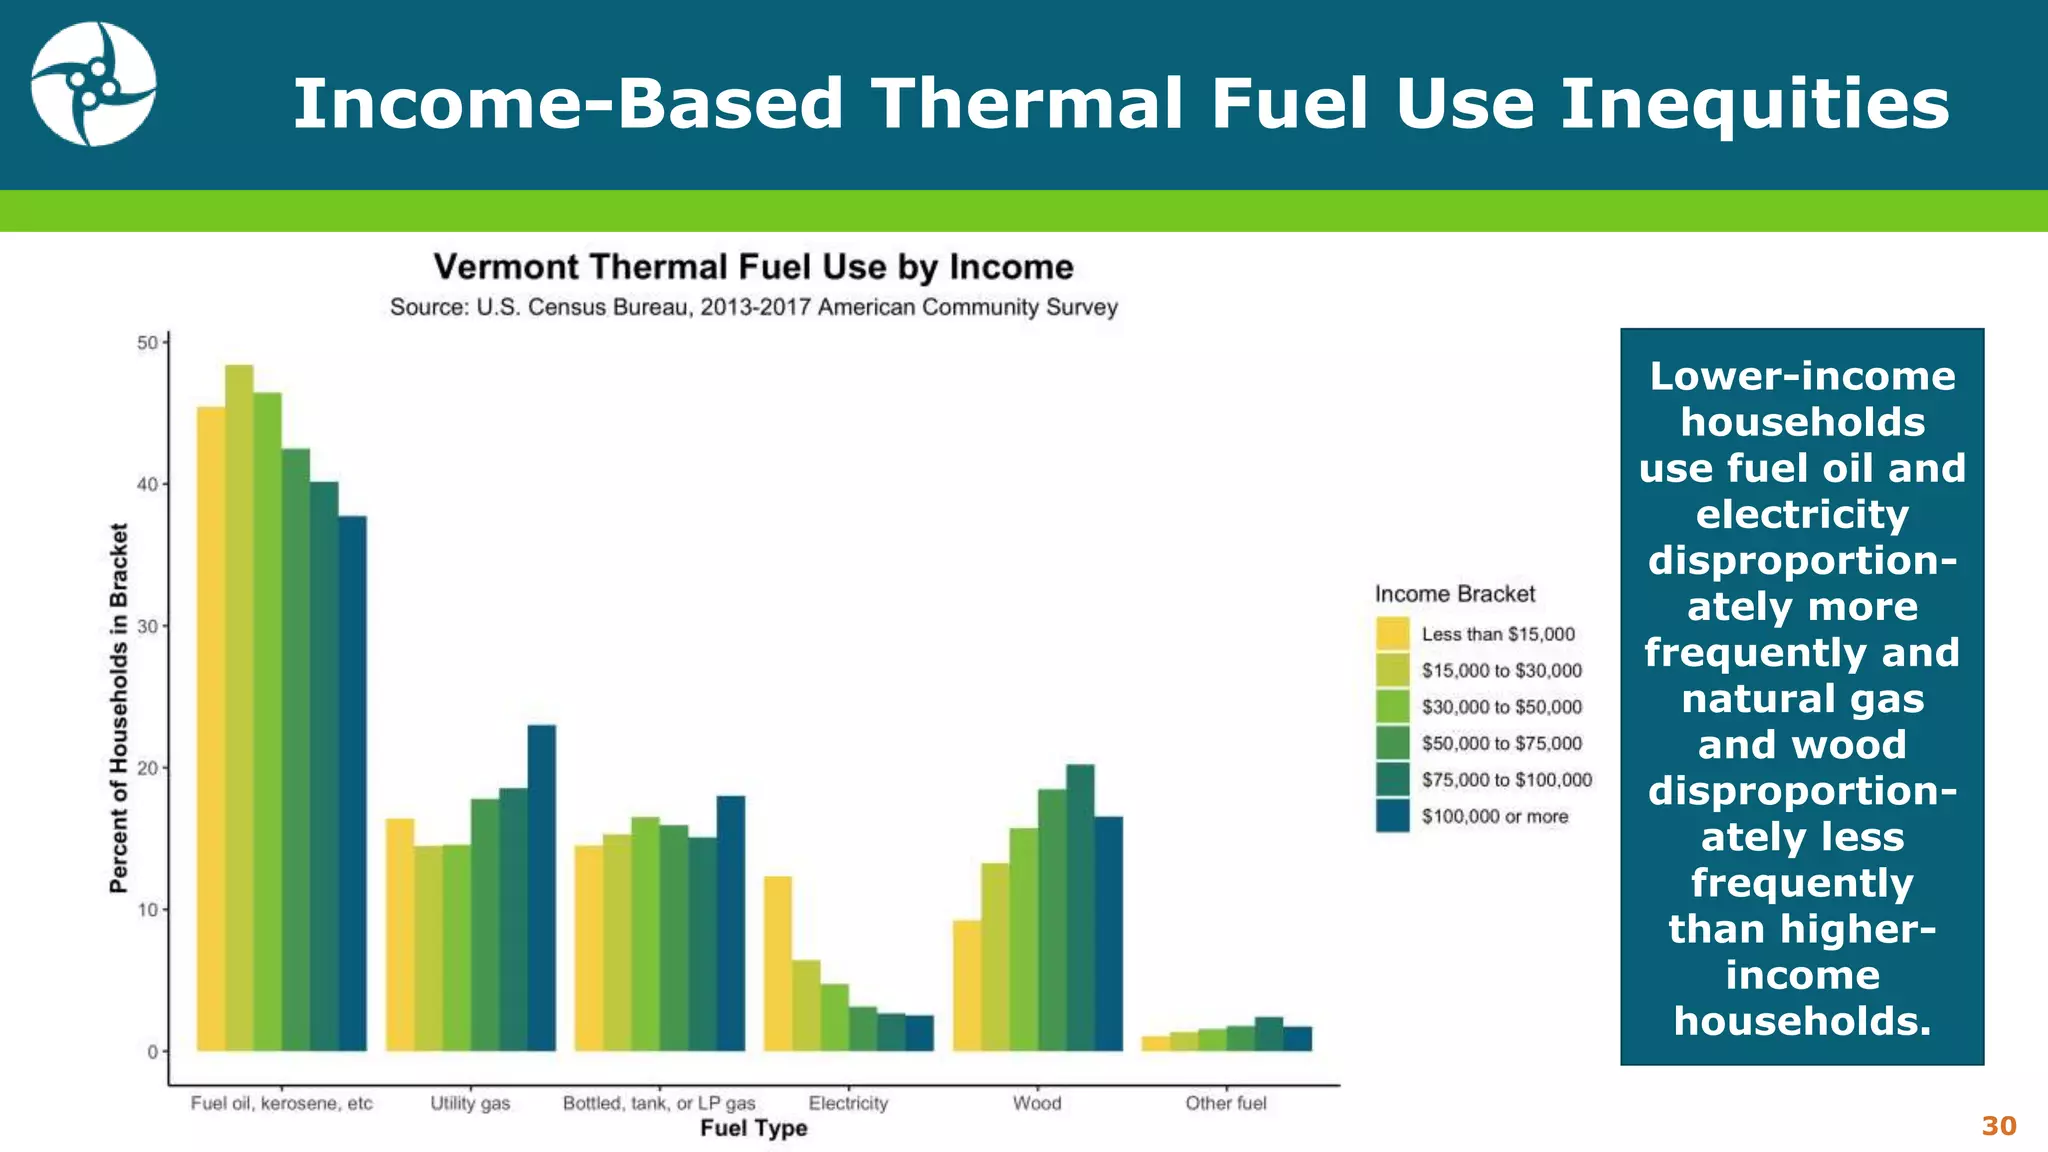
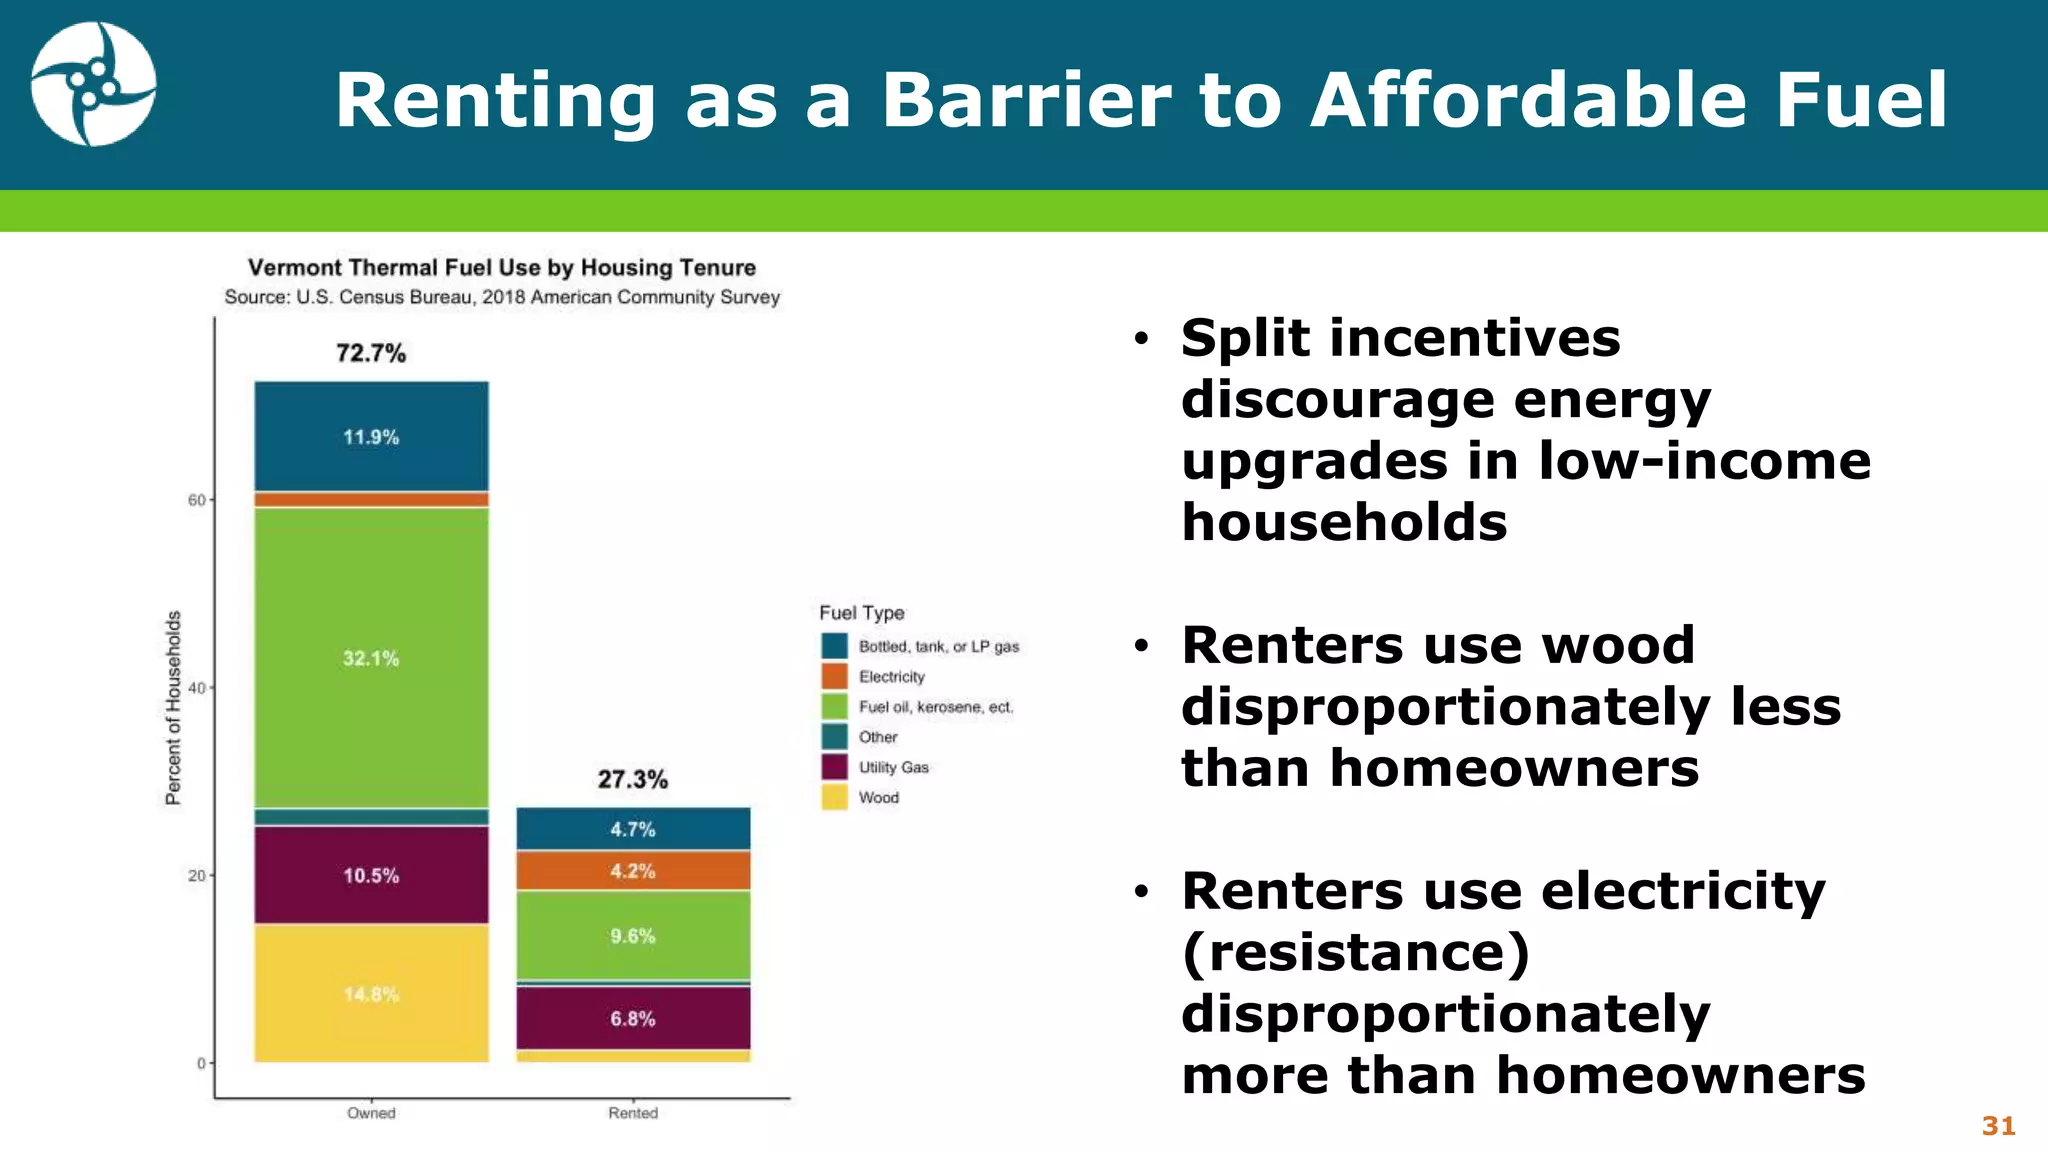
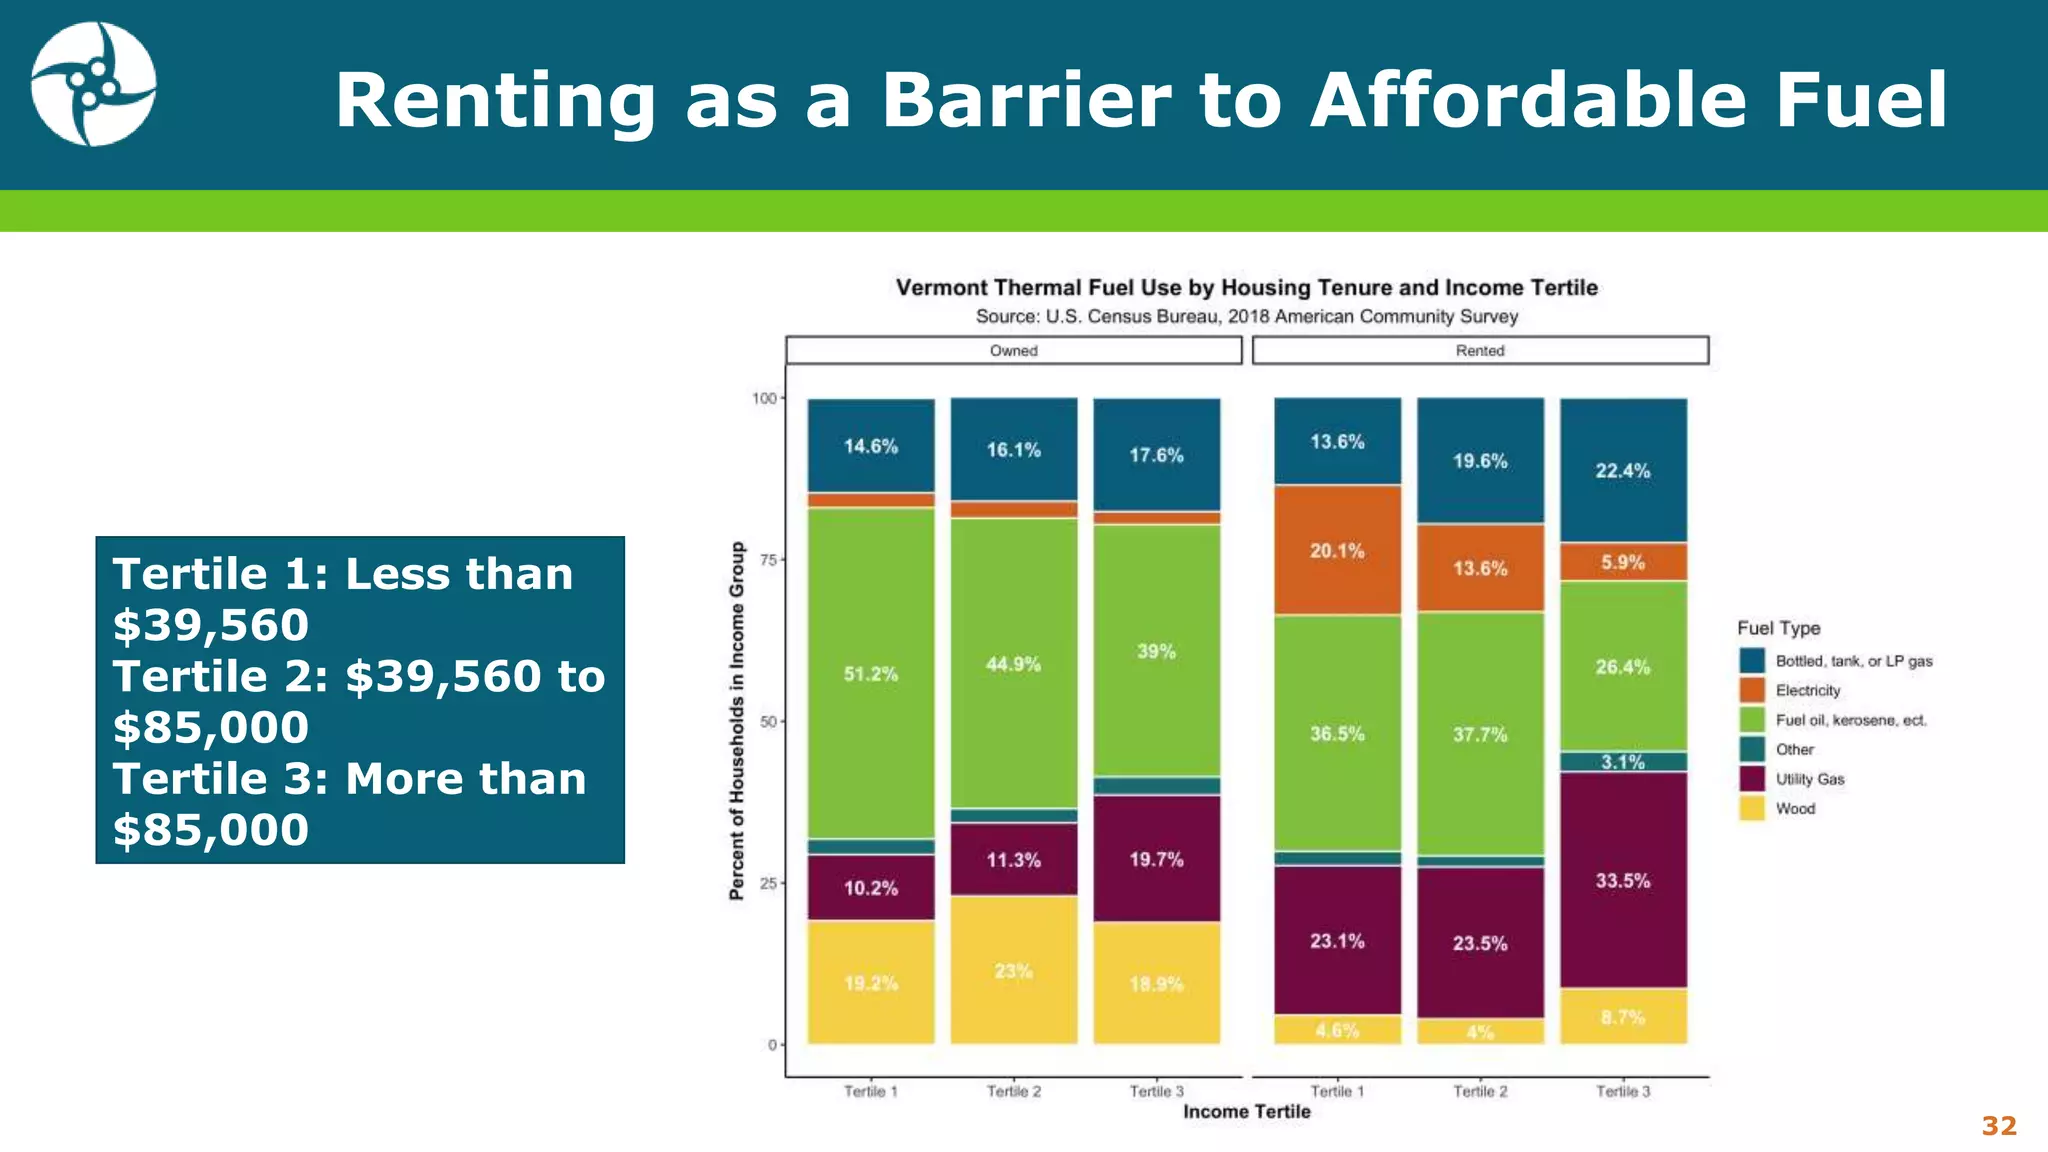
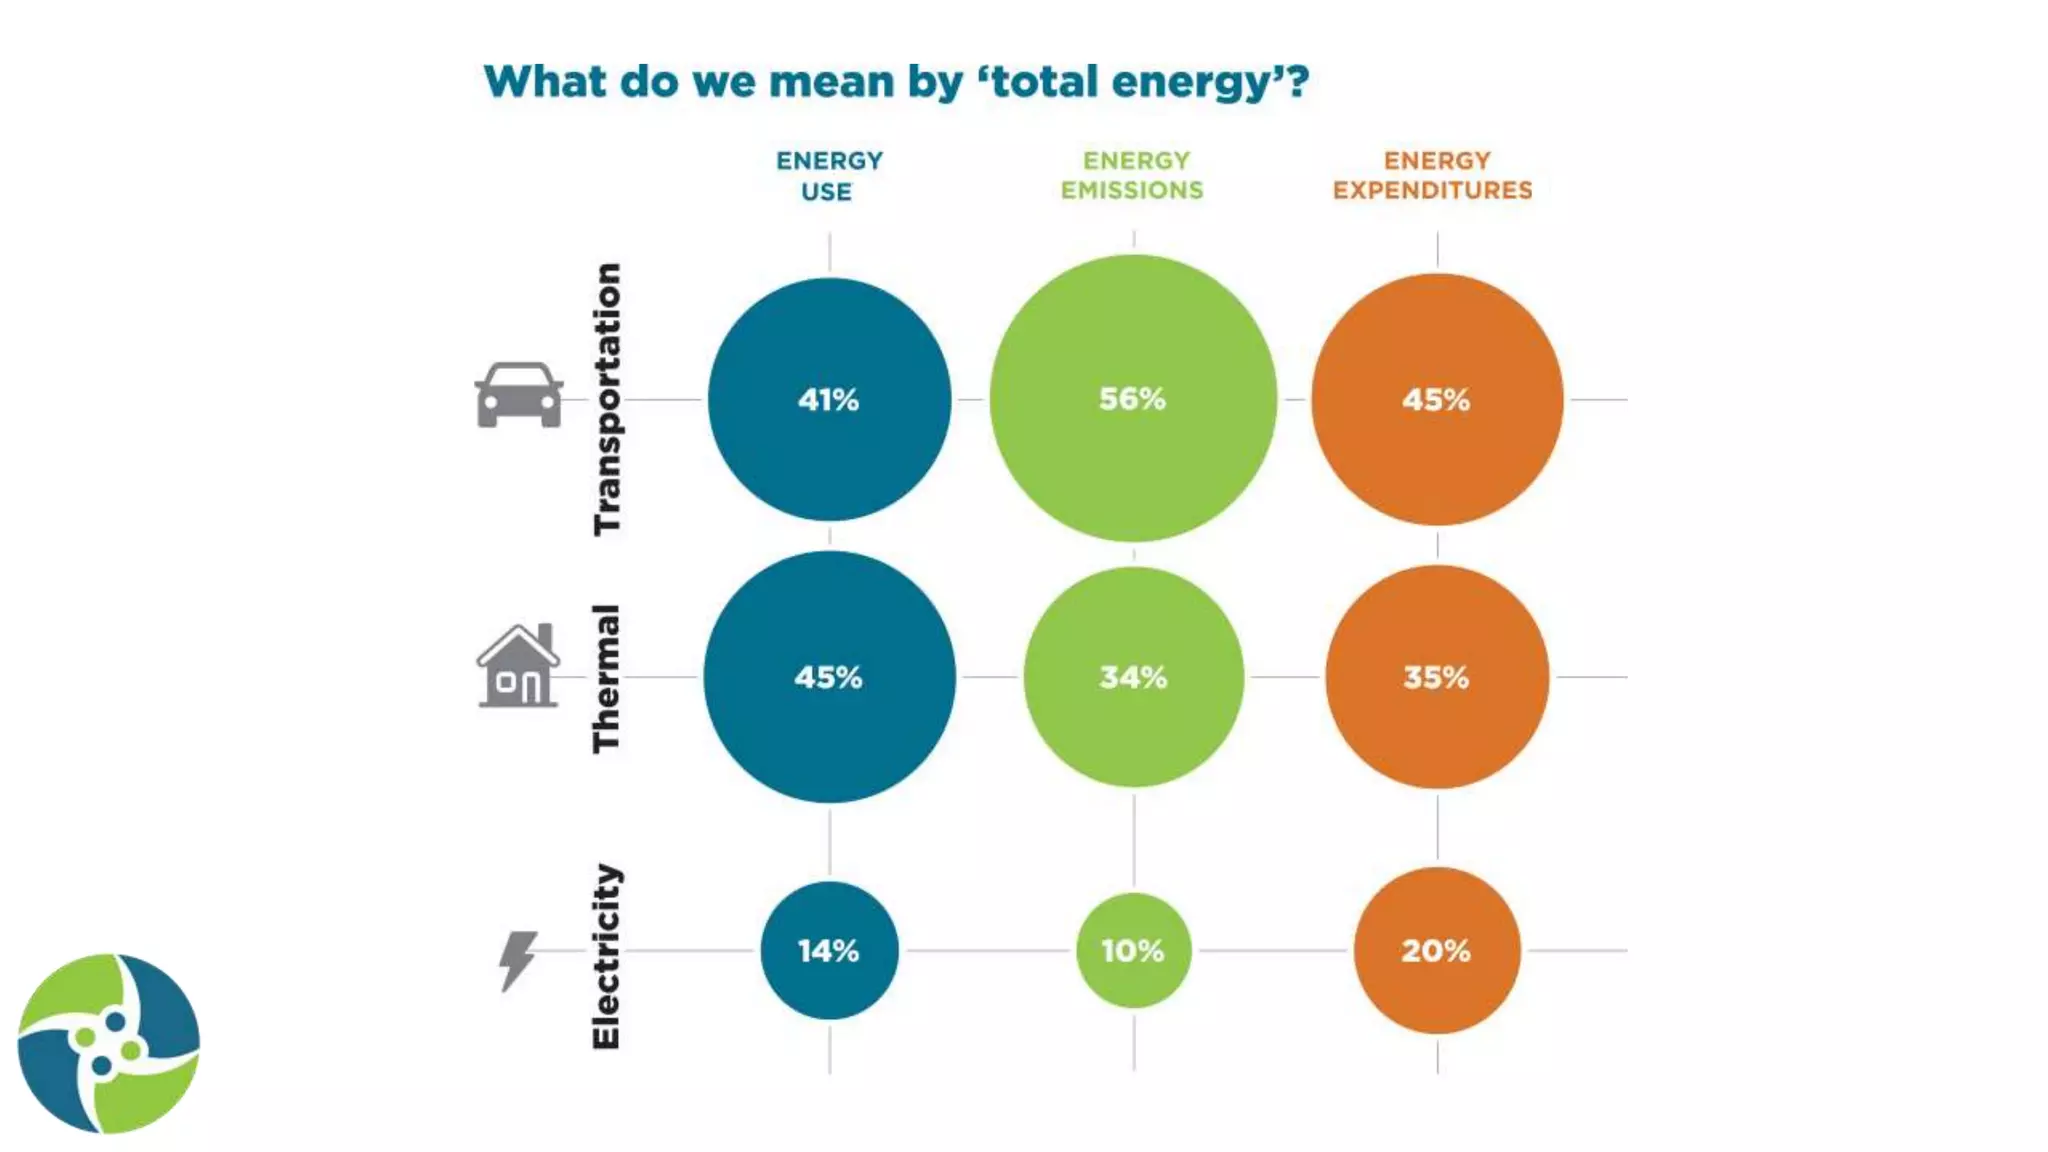
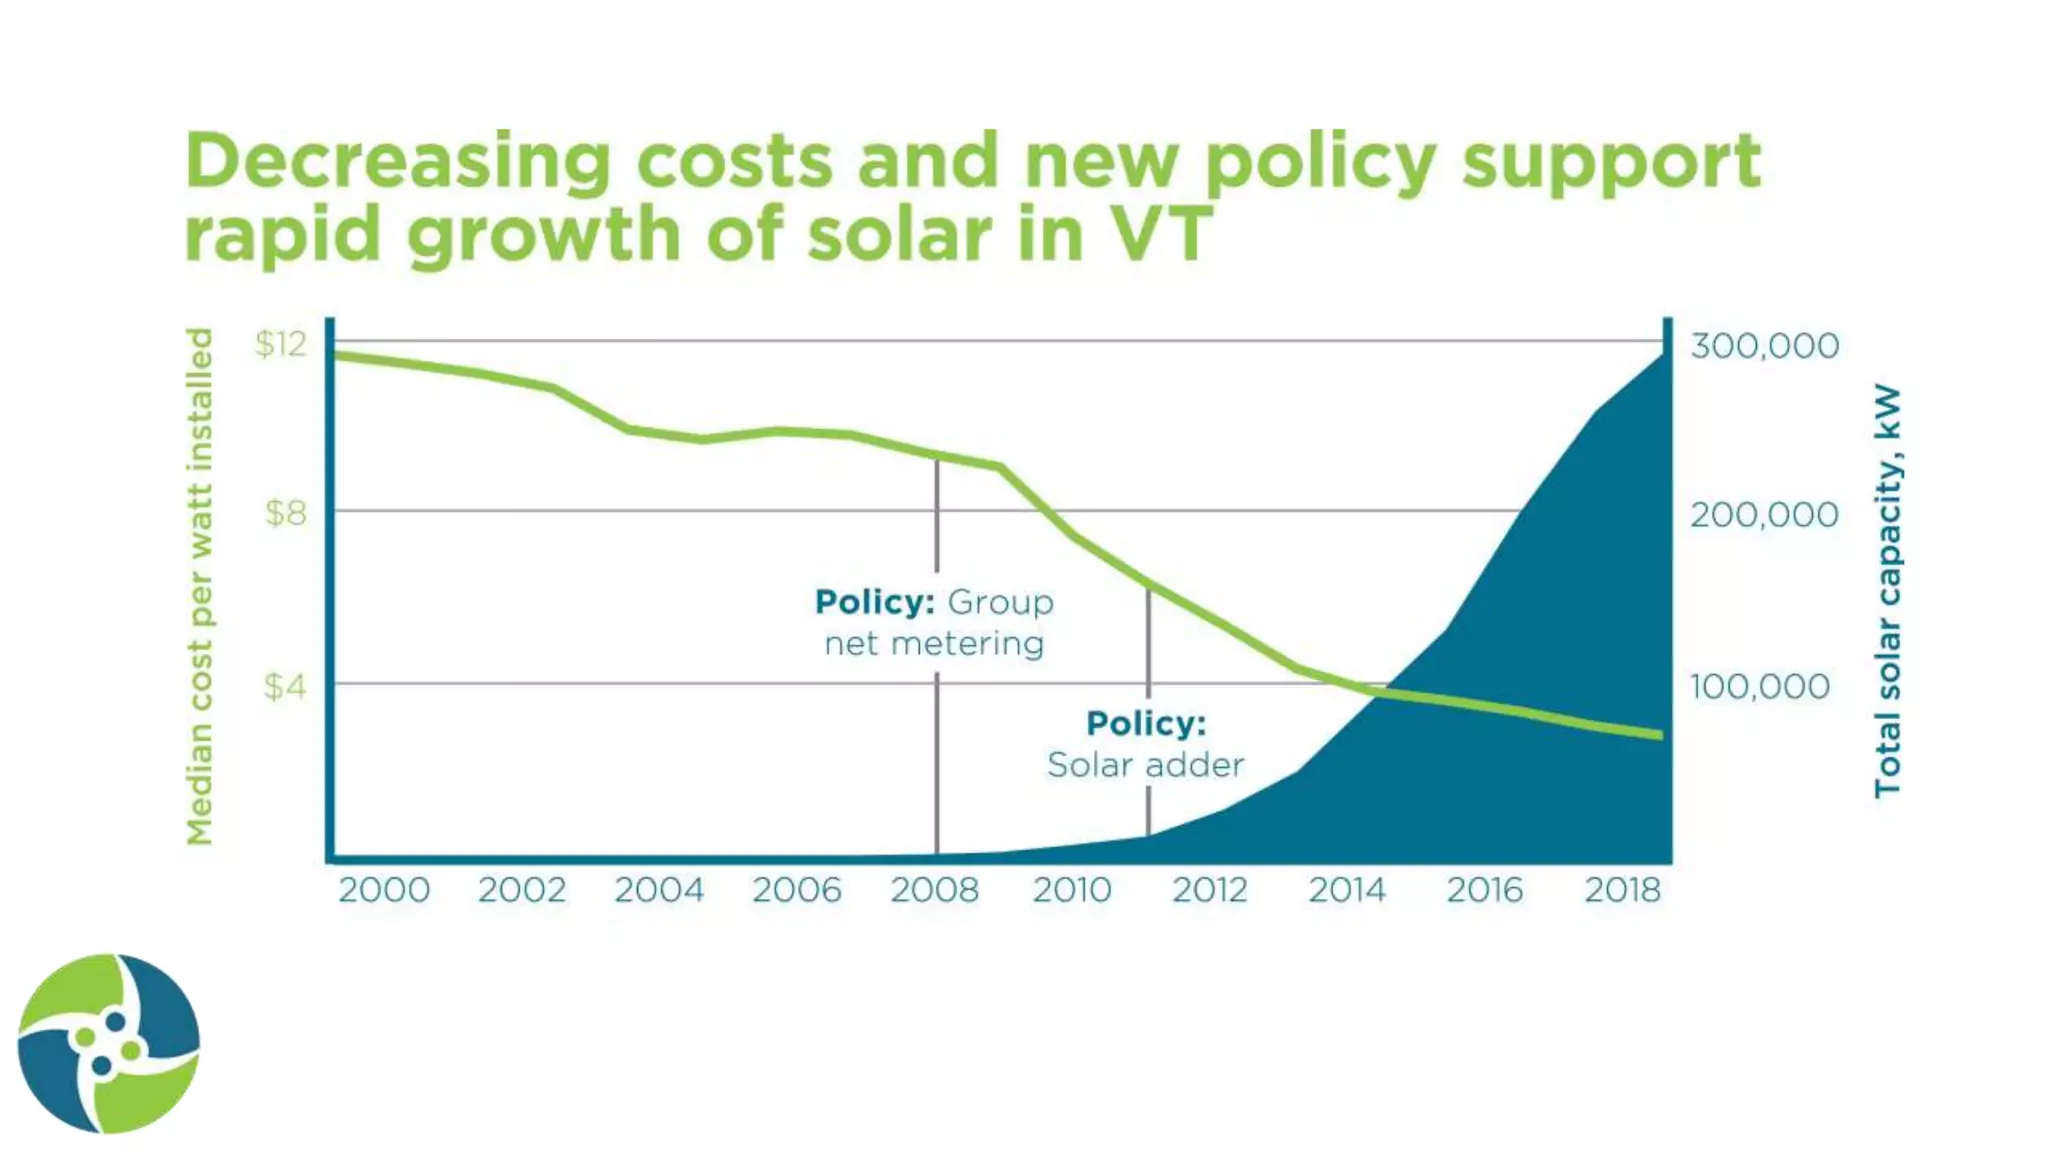
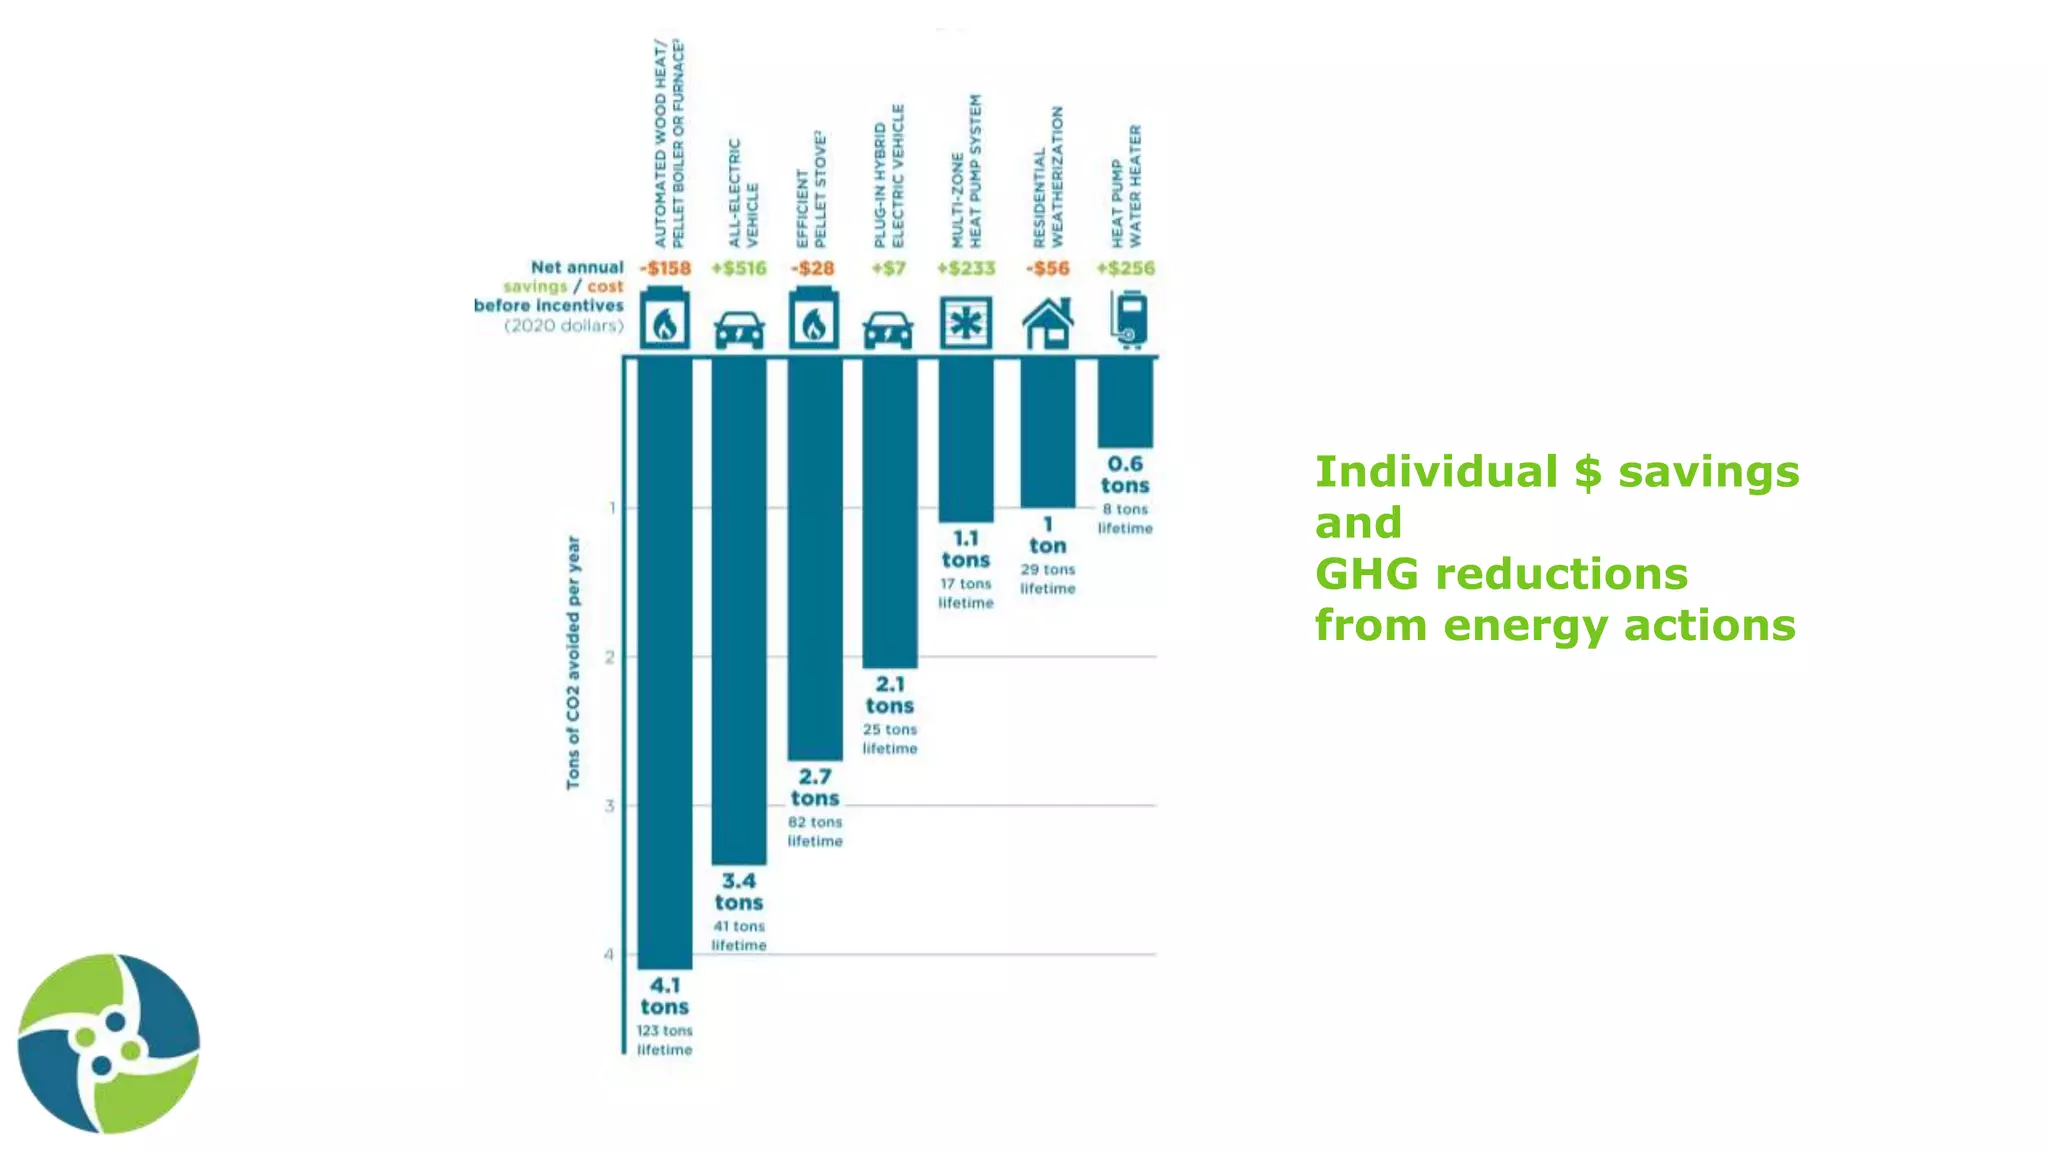
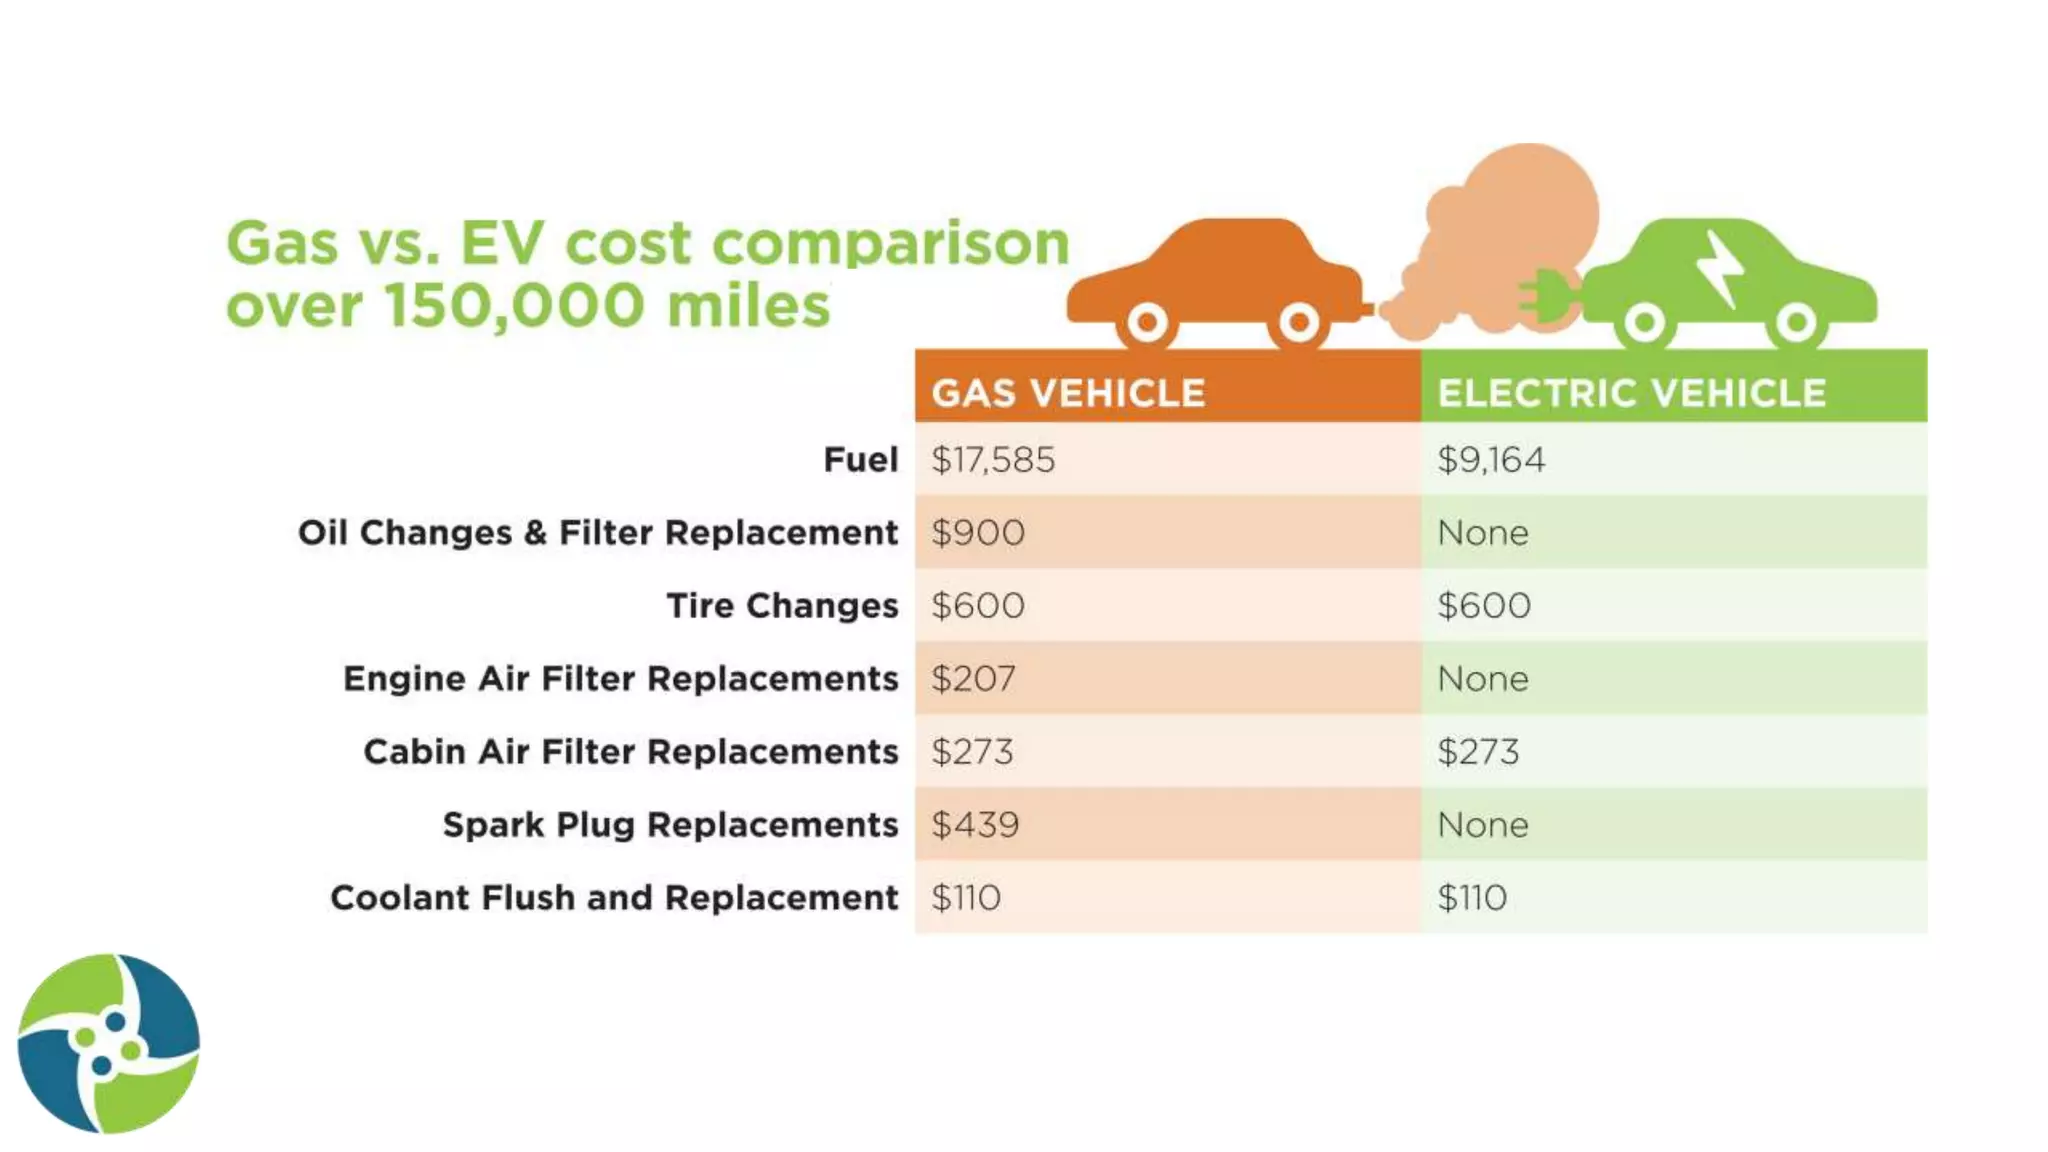
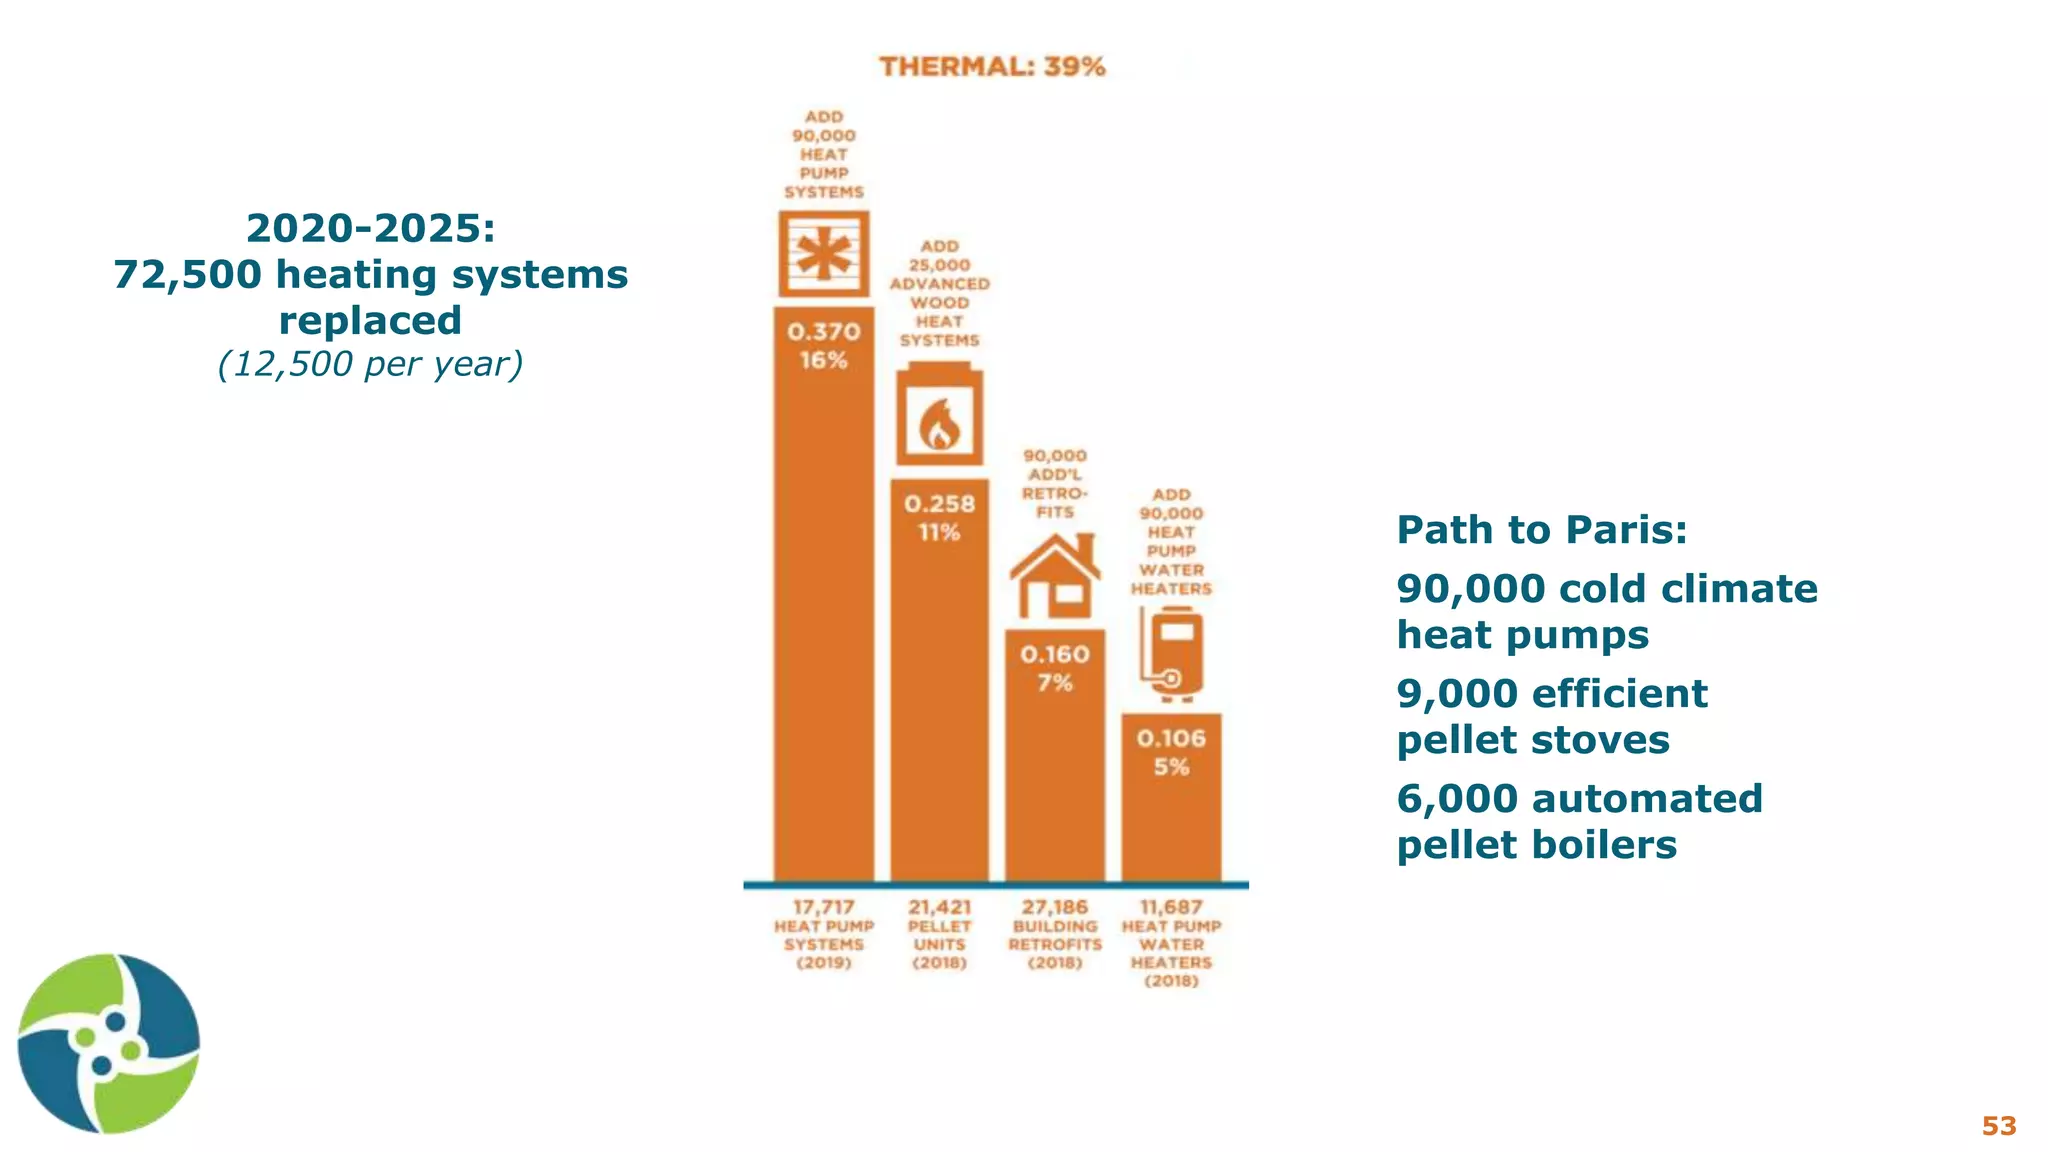
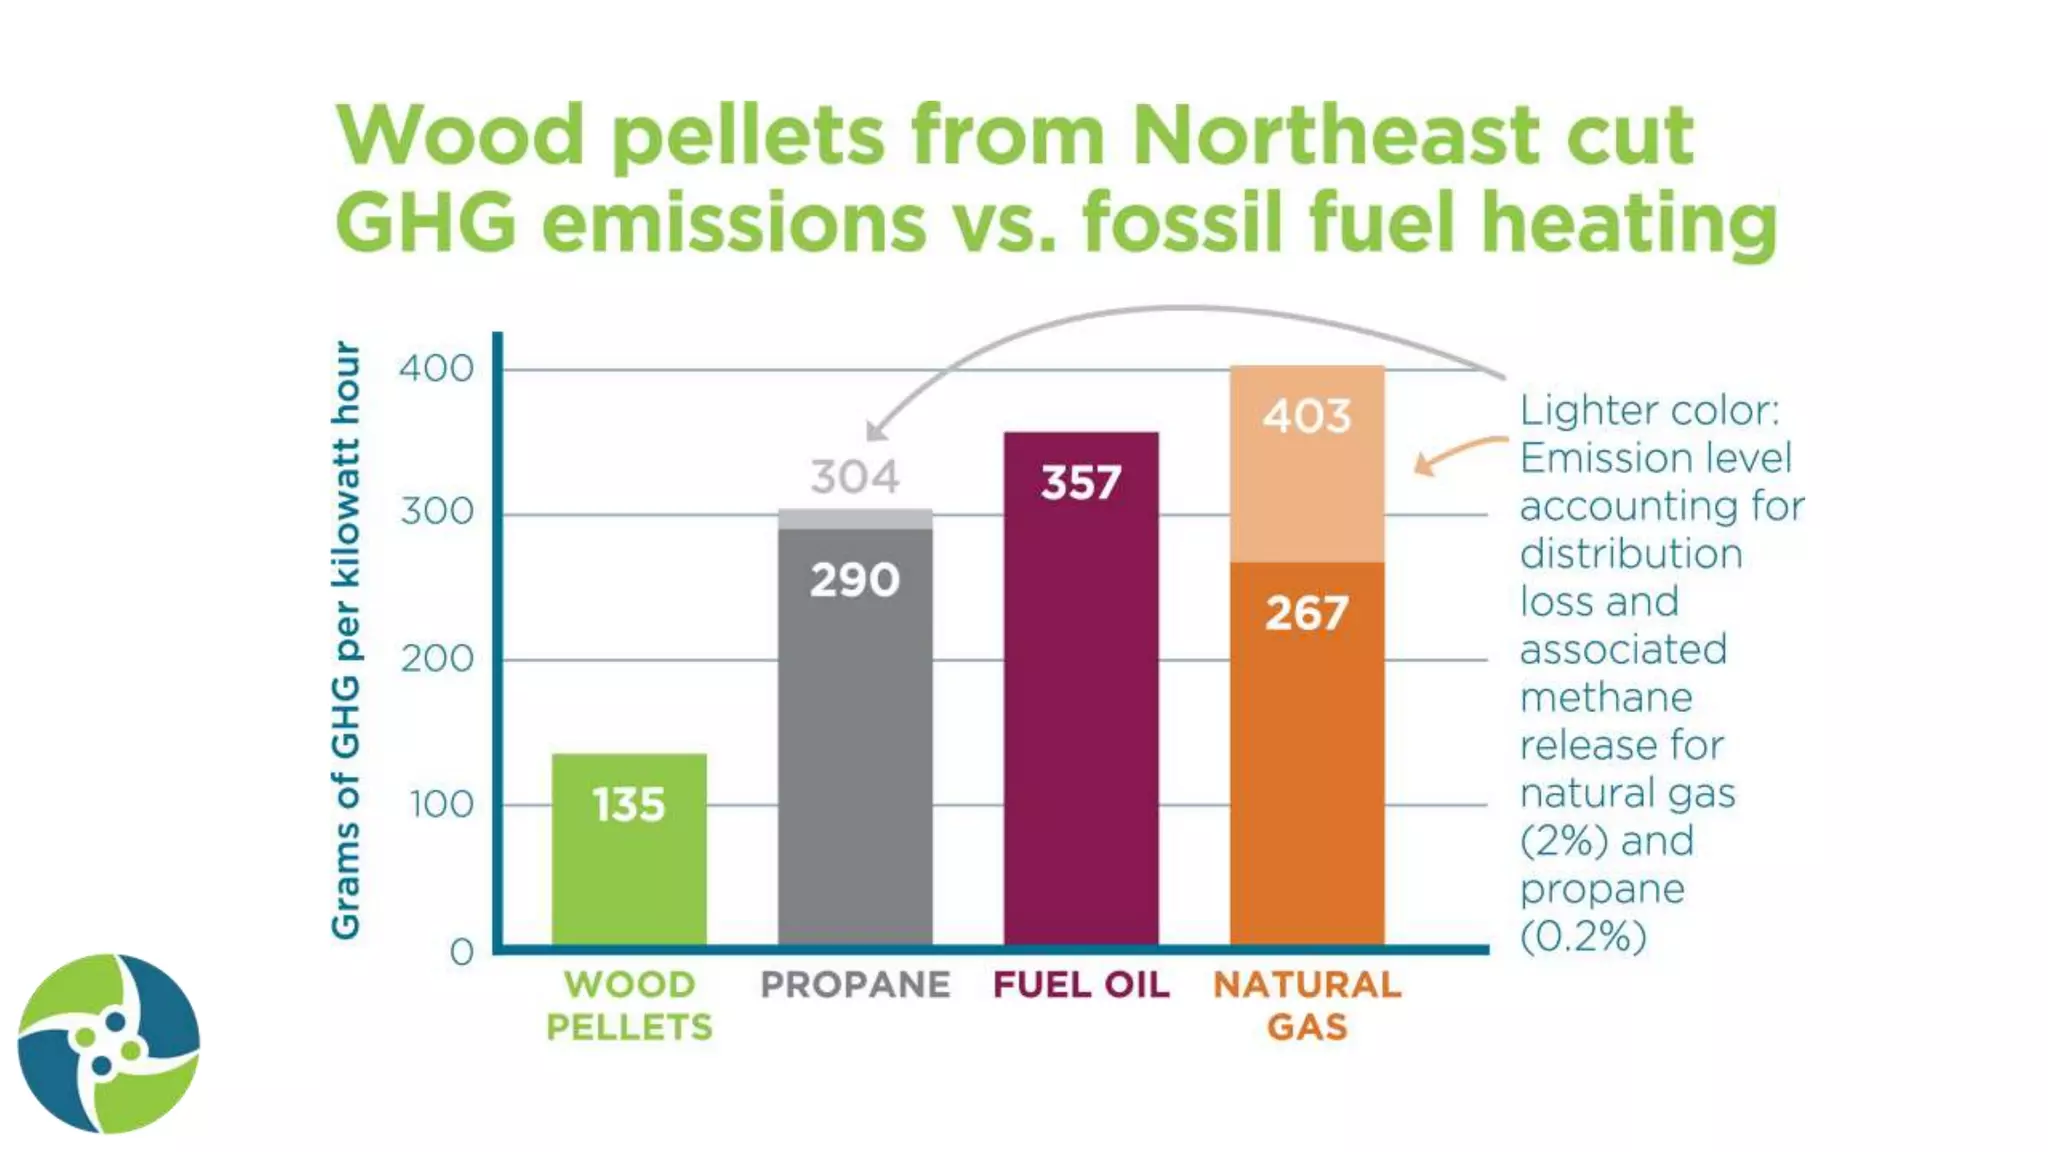
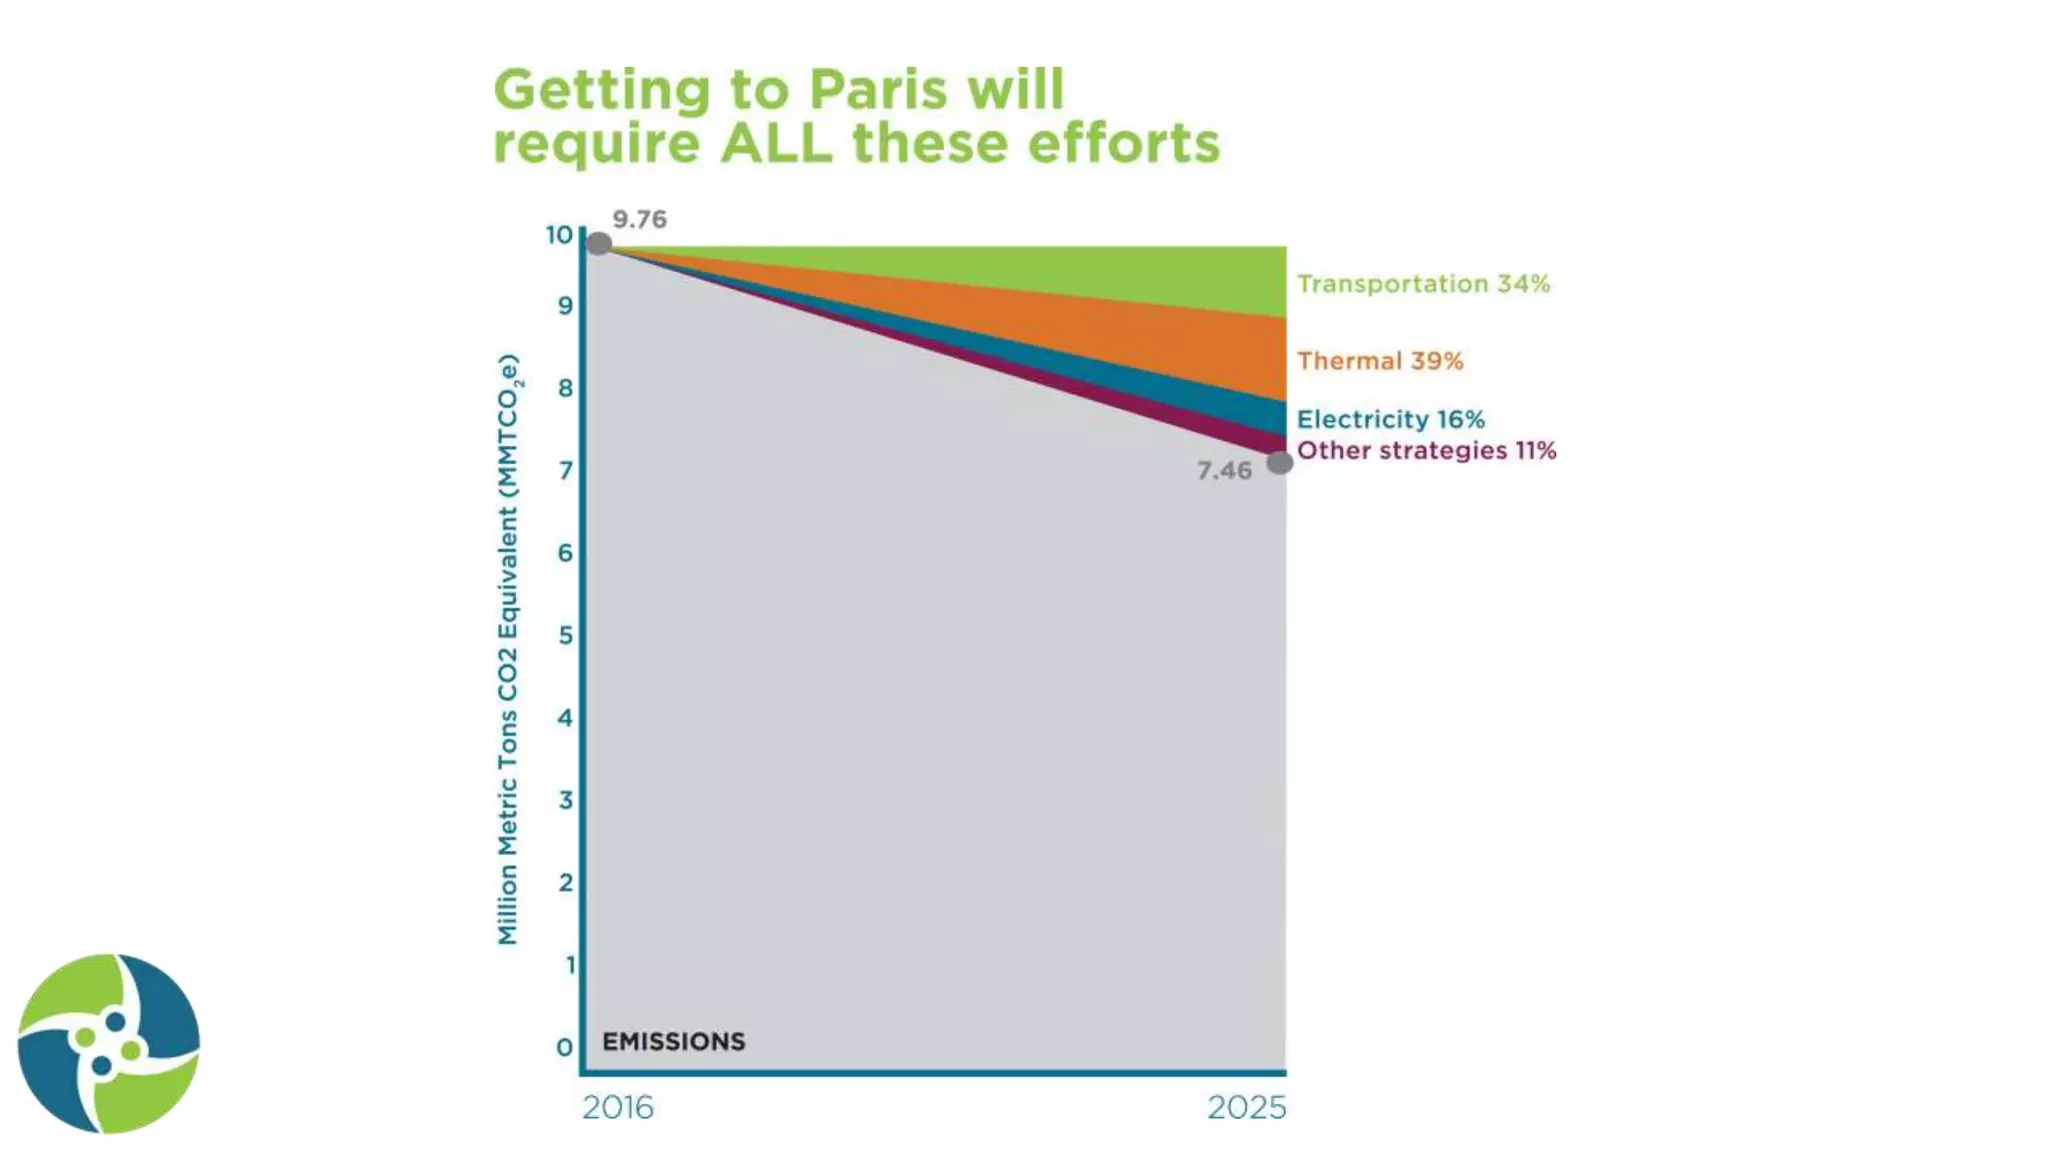
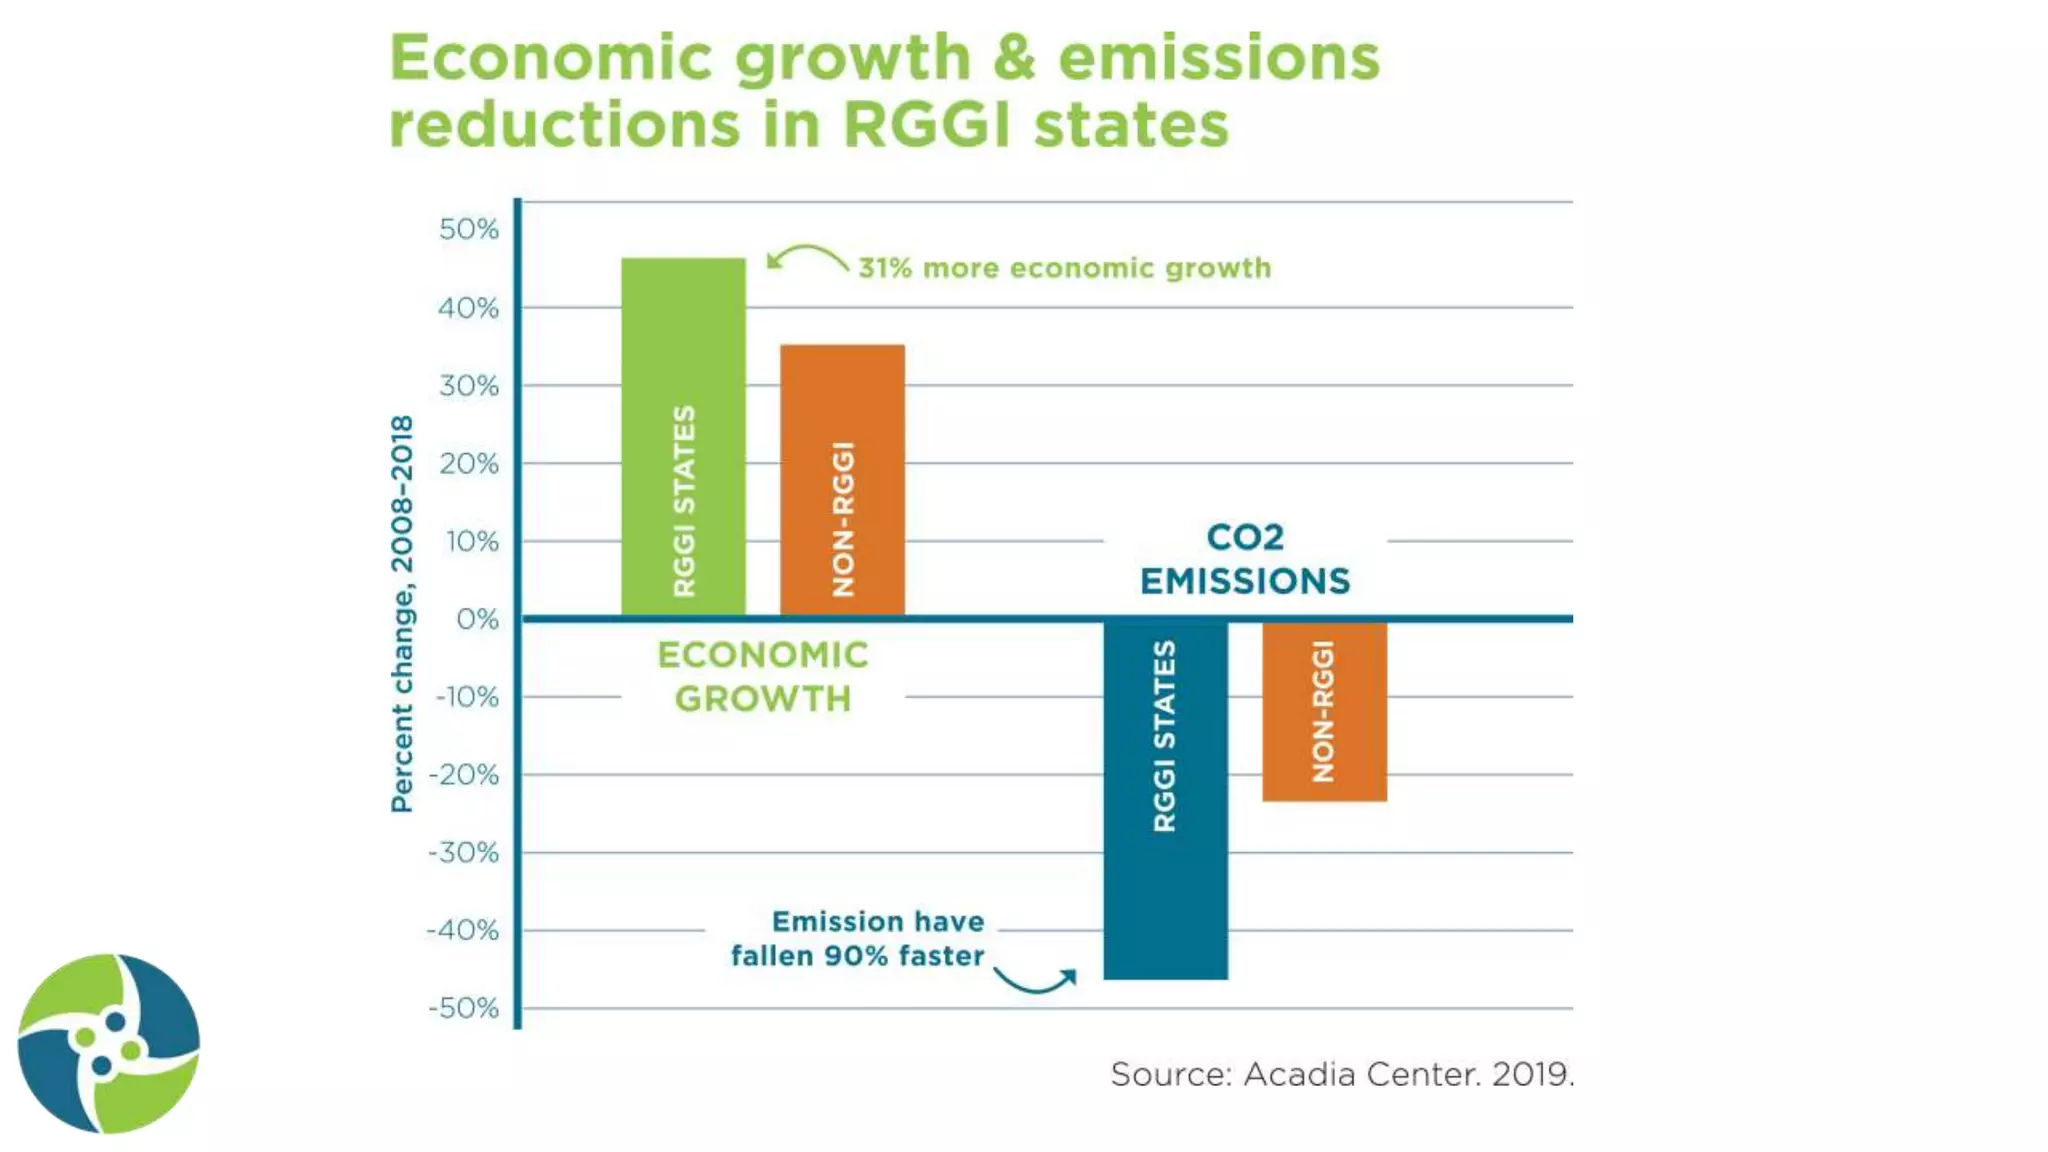
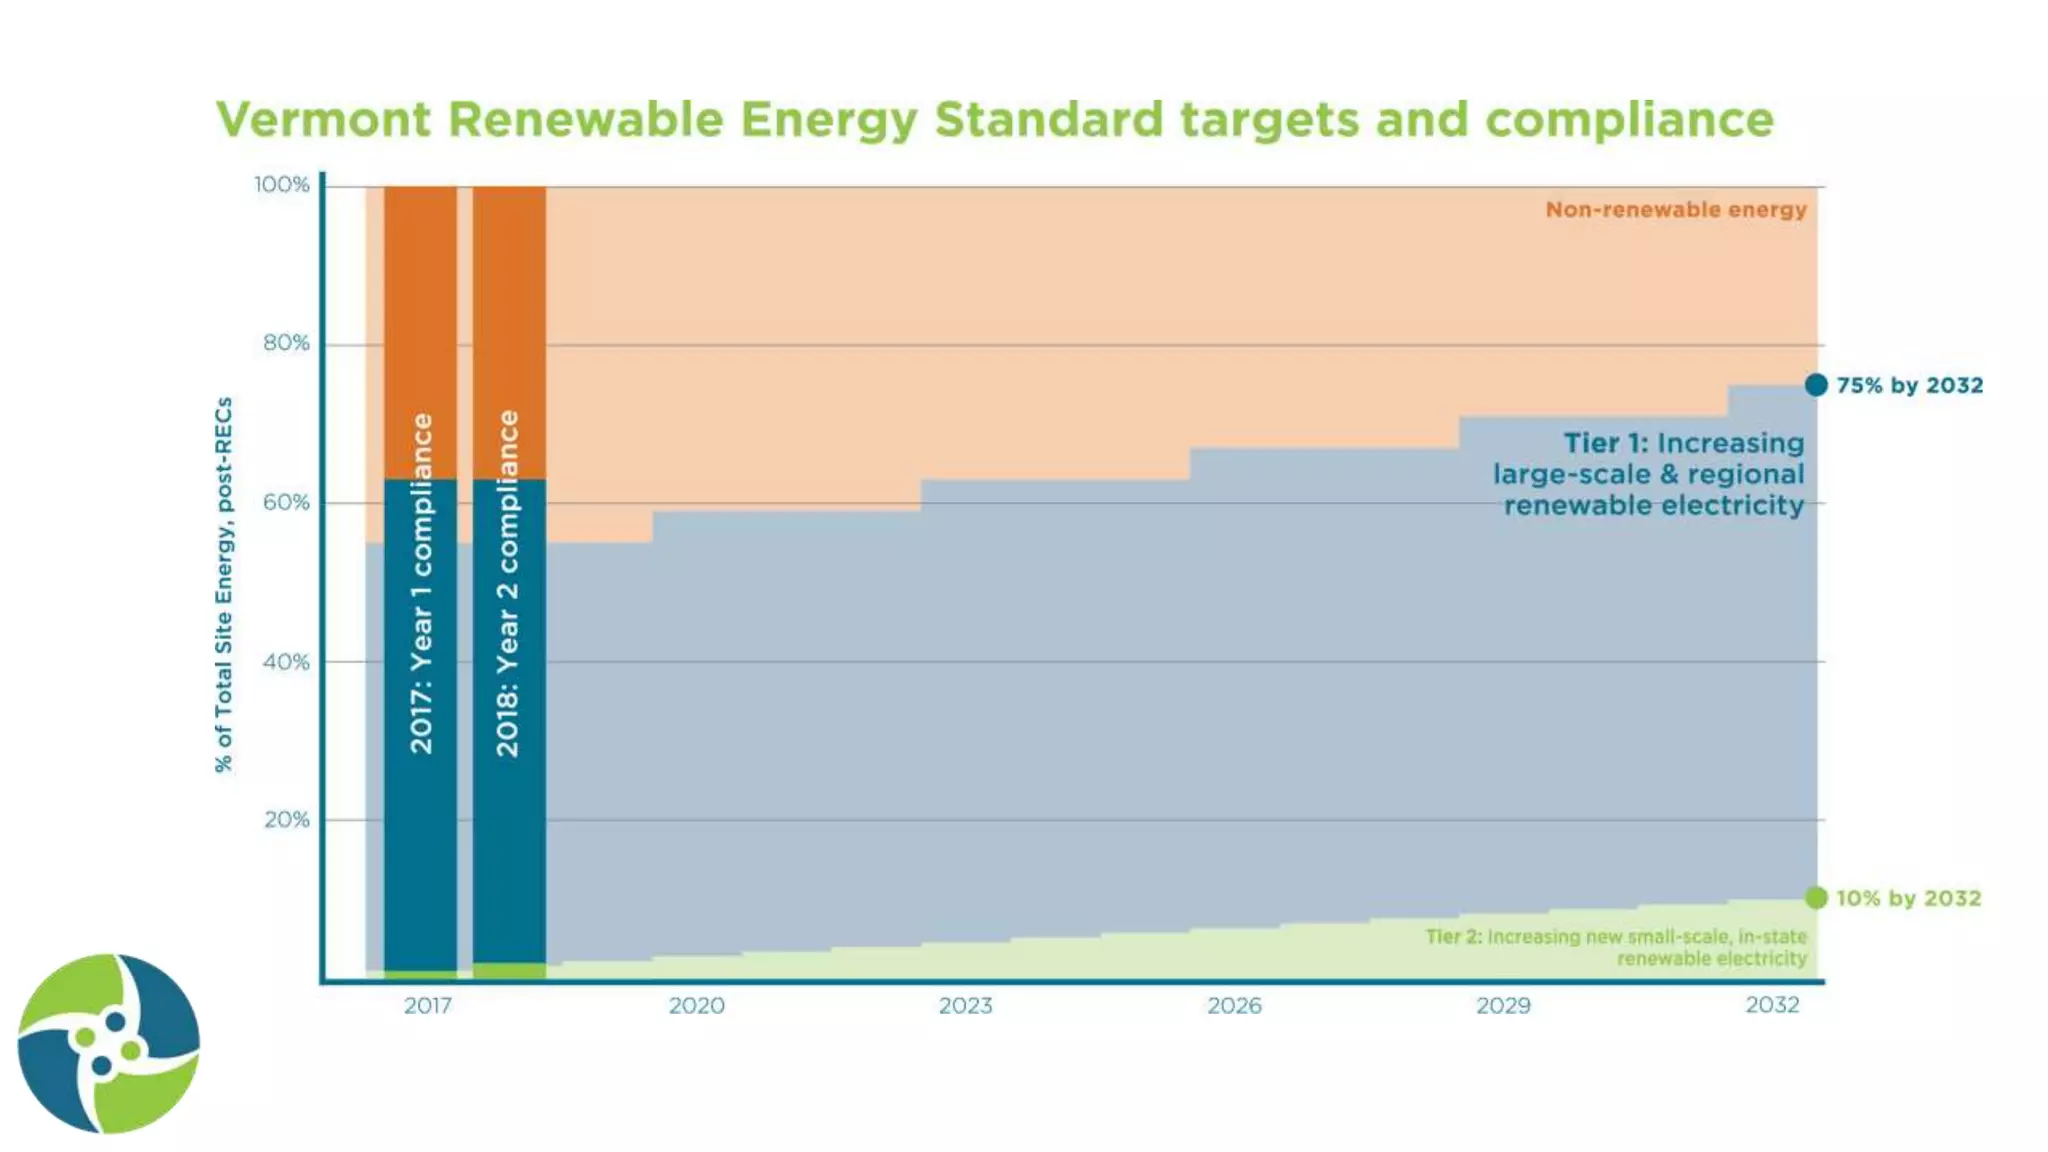
Progress to Paris
Percent decrease in overall GHG emissions
(2016, compared to 2005 levels)
As cars get more efficient, we’re buying bigger cars
US VT ME CT NH MA NY RI QC
Per capita emissions
(metric tons CO2e per person)
12
Path to Paris:
2.3 MMTCO2e
reduction by 2025
Economic impacts of
EAN’s Path to Paris:
2020 - 2035
Electric vehicles are
less expensive to drive
than gas vehicles
Renewable heating
options are lower cost
and more stable than
fossil fuel options
FOSSIL FUELS
Recirculates in the VT economy
Leaves the VT economy
Path to Paris:
2.3 MMTCO2e
reduction by 2025
Path to Paris:
2.3 MMTCO2e
reduction by 2025
Energy Equity: A Working Definition
Energy equity is based on the principle that all
people should have access to reliable, safe, and
affordable sources of energy; protection from a
disproportionate share of negative impacts or
externalities associated with building and
operating our energy supply and distribution
systems; and equitable distribution of and
access to benefits from these systems.
24
What is Energy Burden?
25
Energy Security and Justice Program of Vermont Law School’s Institute for Energy and the Environment.
Energy costs and burdens in Vermont: Burdensome for whom? 2014.
Energy burden
measures the percent
of income used for
energy spending. This
measurement allows us
to acknowledge that
energy spending does
not affect everyone
equally.
Energy Burden and Income
27
Lower-income
Vermonters
purchase much less
energy than upper
income
Vermonters…
Energy Burden and Income
28
… but spend a
far greater
proportion of
their income
on energy
than do upper
income
Vermonters
29
Income-Based Thermal Fuel Use Inequities
30
Lower-income
households
use fuel oil and
electricity
disproportion-
ately more
frequently and
natural gas
and wood
disproportion-
ately less
frequently
than higher-
income
households.
Renting as a Barrier to Affordable Fuel
31
• Split incentives
discourage energy
upgrades in low-income
households
• Renters use wood
disproportionately less
than homeowners
• Renters use electricity
(resistance)
disproportionately
more than homeowners
Renting as a Barrier to Affordable Fuel
32
Tertile 1: Less than
$39,560
Tertile 2: $39,560 to
$85,000
Tertile 3: More than
$85,000
Adding It All Up
33
Low-income households purchase the
least amount of energy but have the
highest energy burden and struggle the
most with that energy burden.
Low-income households don’t have the
same access to heating options, placing
already burdened households at the mercy
of some of the highest cost and least
efficient ways to heat their homes.
Download a copy: eanvt.org
Request printed copies:
cwesley@eanvt.org
Questions:
jduval@eanvt.org
35
Emissions increases and
decreases across the region:
1990 vs 2016
Energy Action Network Members
Over 100 Network Members
Energy Action Network Public Partners
Over 100 Public Partners
Individual $ savings
and
GHG reductions
from energy actions
vtenergydashboard.org
47
Average annual Vermont emissions, per capita:
15.6 tons CO2e
53
Path to Paris:
90,000 cold climate
heat pumps
9,000 efficient
pellet stoves
6,000 automated
pellet boilers
2020-2025:
72,500 heating systems
replaced
(12,500 per year)
Jared Duval Presentation for EAN 2020 Summit

Jared Duval Presentation for EAN 2020 Summit

  • 4.
    Progress to Paris Percentdecrease in overall GHG emissions (2016, compared to 2005 levels)
  • 8.
    As cars getmore efficient, we’re buying bigger cars
  • 9.
    US VT MECT NH MA NY RI QC Per capita emissions (metric tons CO2e per person)
  • 12.
  • 14.
    Path to Paris: 2.3MMTCO2e reduction by 2025
  • 15.
    Economic impacts of EAN’sPath to Paris: 2020 - 2035
  • 16.
    Electric vehicles are lessexpensive to drive than gas vehicles Renewable heating options are lower cost and more stable than fossil fuel options
  • 17.
    FOSSIL FUELS Recirculates inthe VT economy Leaves the VT economy
  • 20.
    Path to Paris: 2.3MMTCO2e reduction by 2025
  • 23.
    Path to Paris: 2.3MMTCO2e reduction by 2025
  • 24.
    Energy Equity: AWorking Definition Energy equity is based on the principle that all people should have access to reliable, safe, and affordable sources of energy; protection from a disproportionate share of negative impacts or externalities associated with building and operating our energy supply and distribution systems; and equitable distribution of and access to benefits from these systems. 24
  • 25.
    What is EnergyBurden? 25 Energy Security and Justice Program of Vermont Law School’s Institute for Energy and the Environment. Energy costs and burdens in Vermont: Burdensome for whom? 2014. Energy burden measures the percent of income used for energy spending. This measurement allows us to acknowledge that energy spending does not affect everyone equally.
  • 27.
    Energy Burden andIncome 27 Lower-income Vermonters purchase much less energy than upper income Vermonters…
  • 28.
    Energy Burden andIncome 28 … but spend a far greater proportion of their income on energy than do upper income Vermonters
  • 29.
  • 30.
    Income-Based Thermal FuelUse Inequities 30 Lower-income households use fuel oil and electricity disproportion- ately more frequently and natural gas and wood disproportion- ately less frequently than higher- income households.
  • 31.
    Renting as aBarrier to Affordable Fuel 31 • Split incentives discourage energy upgrades in low-income households • Renters use wood disproportionately less than homeowners • Renters use electricity (resistance) disproportionately more than homeowners
  • 32.
    Renting as aBarrier to Affordable Fuel 32 Tertile 1: Less than $39,560 Tertile 2: $39,560 to $85,000 Tertile 3: More than $85,000
  • 33.
    Adding It AllUp 33 Low-income households purchase the least amount of energy but have the highest energy burden and struggle the most with that energy burden. Low-income households don’t have the same access to heating options, placing already burdened households at the mercy of some of the highest cost and least efficient ways to heat their homes.
  • 34.
    Download a copy:eanvt.org Request printed copies: cwesley@eanvt.org Questions: jduval@eanvt.org
  • 35.
  • 37.
    Emissions increases and decreasesacross the region: 1990 vs 2016
  • 39.
    Energy Action NetworkMembers Over 100 Network Members
  • 40.
    Energy Action NetworkPublic Partners Over 100 Public Partners
  • 46.
    Individual $ savings and GHGreductions from energy actions
  • 47.
  • 50.
    Average annual Vermontemissions, per capita: 15.6 tons CO2e
  • 53.
    53 Path to Paris: 90,000cold climate heat pumps 9,000 efficient pellet stoves 6,000 automated pellet boilers 2020-2025: 72,500 heating systems replaced (12,500 per year)

Editor's Notes

  • #2 Hello everybody. My name is Jared Duval, Executive Director of the Energy Action Network.
  • #4 This report also includes a comparison of greenhouse gas emissions from every state in New England plus New York and our neighbor to the north, Quebec. What we found is that: Vermont is the only state in the region that has failed to reduce its emissions below 1990 levels. GRAPHIC: Historic VT GHG emissions (pg. 3)
  • #5 Vermont has made the least progress toward the Paris Climate Agreement commitment of any state in the region. GRAPHIC: comparing per capita emissions and Progress to Paris across the region, 2005 – 2016, bottom half (pg. 10)
  • #6 This report also includes a comparison of greenhouse gas emissions from every state in New England plus New York and our neighbor to the north, Quebec. What we found is that: Vermont is the only state in the region that has failed to reduce its emissions below 1990 levels. GRAPHIC: Historic VT GHG emissions (pg. 3)
  • #7 Why is Vermont falling behind our neighbors on our emissions reduction commitments and why do we have the highest emissions, per capita, in the region? One big reason is the increase in our transportation emissions since 1990. GRAPHIC: Moving in the wrong direction (pg. 9)
  • #8 There are more vehicle miles traveled in Vermont than any state in the region, and miles driven have been rising since 2014. GRAPHIC: Vehicle Miles Traveled per capita, 2015 (pg. 16)
  • #9 Additionally, we are not getting the full benefit of increased fuel economy standards because Vermonters who buy or lease new vehicles are opting for bigger and bigger vehicles. In 2012, 55% of new vehicles purchased in Vermont were SUV’s or pickup trucks. In 2018, that number was 80%. (GRAPHIC: As cars get more efficient, we’re buying bigger cars) (pg. 16). Add title As cars get more efficient…
  • #10 Vermont has the highest emissions, per capita, of any state in the region at over 15 tons of greenhouse gases per person. GRAPHIC: comparing per capita emissions and Progress to Paris across the region, 2005 – 2016, top half (pg. 10)
  • #11 And as of 2018 emissions from electricity were only 2% of Vermont’s total greenhouse gas emissions, while emissions from transportation and thermal energy use made up more than 70% of our emissions. GRAPHIC: Vermont’s GHG emissions by sector (pg. 7)
  • #14 And as of 2018 emissions from electricity were only 2% of Vermont’s total greenhouse gas emissions, while emissions from transportation and thermal energy use made up more than 70% of our emissions. GRAPHIC: Vermont’s GHG emissions by sector (pg. 7)
  • #15 First and most importantly: the transition off fossil fuels is an economic development and affordability strategy for Vermont. This topic is particularly important to me because, before I led EAN, I served as Economic Development Director at the Agency of Commerce and Community Development. The economic conversation about energy has for too long been backwards. Often the question will be asked, “how much will it cost us” to move from fossil fuel to efficient, renewable energy use. Our analysis shows that there are three key questions that we should be asking instead: #1: how much is our fossil fuel dependence currently costing Vermonters and the Vermont economy?; #2, how much do Vermonters stand to save on energy costs as a result of this transition?; and #3 how will the Vermont economy be affected by a transition off fossil fuels? To answer these questions, we asked the Vermont Agency of Commerce and Community Development to conduct an economic impact analysis of EAN’s “Path to Paris” model. The Path to Paris model takes proven and available technologies and best practices as outlined in Vermont’s Comprehensive Energy Plan and models the scale and pace of efficient and renewable energy adoption, primarily in for how we get around and heat our homes and buildings, that will be necessary to meet Vermont’s commitment to the Paris Climate Agreement. GRAPHIC: Path to Paris (pg. 4)
  • #16 What ACCD found is that if we meet our Paris commitment in this way, it will keep more money in state and in your pocket. Specifically, we can reduce the net amount of dollars draining out of the Vermont economy by over $1.1 billion, increase net investment in in-state businesses by over $300 million, and save Vermont consumers about $800 million between 2020 and 2035. GRAPHIC: drain, arrow, stack of bills (pg. 5) This analysis, by ACCD’s own admission, is very conservative. For instance, it projects Electric Vehicle prices to stay at their current levels for the next five years, when we know that battery and EV prices are declining every year. It also does not include the value of state incentives in the consumer savings calculations, which can result in significant savings for Vermonters who do weatherization projects or install renewable heating systems like advanced wood heating or cold climate heat pumps. Finally, it does not account for further price decreases for clean technologies due to increasing economies of scale or further technological improvements, which we see every year.   Let me state those numbers again: reducing the flow of dollars out of state by over 1.1 billion dollars, increasing investment in Vermont-based businesses by over $300 million, and achieving net consumer savings for Vermonters of about $800 million. The reasons for this very good economic news lies in two key differences between fossil fuels vs. more efficient, renewable energy alternatives.
  • #17 Reason #2: Fossil fuels are more expensive and have more volatile prices than electricity and renewable fuels. The lowest cost way to get around or to heat your home or building with the most stable and predictable prices is with electricity or wood heat. GRAPHIC: Gas and diesel vs. Electric prices (pg. 19); heating fuel price comparison (pg. 21); Gas vs. EV cost comparison (pg. 19)
  • #18 #1: Vermont averages about $2 billion a year in fossil fuel spending, three quarters of which, or $1.5 billion, drains right out of our state economy. All of the efficient and renewable alternatives keep much more of our energy dollars local: 60 cents of every dollar invested in weatherization, 62 cents of every dollar spent on electricity, and 80 cents of every dollar spent on wood stay local, support jobs for our neighbors, and strengthen the Vermont economy. GRAPHIC: Big state, with 75% drain (pg. 5) and electricity and wood spending state outlines (pg. 21)
  • #21 First and most importantly: the transition off fossil fuels is an economic development and affordability strategy for Vermont. This topic is particularly important to me because, before I led EAN, I served as Economic Development Director at the Agency of Commerce and Community Development. The economic conversation about energy has for too long been backwards. Often the question will be asked, “how much will it cost us” to move from fossil fuel to efficient, renewable energy use. Our analysis shows that there are three key questions that we should be asking instead: #1: how much is our fossil fuel dependence currently costing Vermonters and the Vermont economy?; #2, how much do Vermonters stand to save on energy costs as a result of this transition?; and #3 how will the Vermont economy be affected by a transition off fossil fuels? To answer these questions, we asked the Vermont Agency of Commerce and Community Development to conduct an economic impact analysis of EAN’s “Path to Paris” model. The Path to Paris model takes proven and available technologies and best practices as outlined in Vermont’s Comprehensive Energy Plan and models the scale and pace of efficient and renewable energy adoption, primarily in for how we get around and heat our homes and buildings, that will be necessary to meet Vermont’s commitment to the Paris Climate Agreement. GRAPHIC: Path to Paris (pg. 4)
  • #23 However, we can only get so much more emissions reduction benefit from how we produce electricity. Our electricity is now over 90% carbon free statewide, and 100% carbon free in certain utility territories, like Burlington Electric Department and Washington Electric Coop. We have largely already picked the low hanging fruit of decarbonizing our electricity generation sources. To achieve the scale and pace of emissions reduction that our commitments demand—and the economic development and consumer savings benefits ACCD projects—we need to build on that foundation of progress, take advantage of that low-carbon electricity, and rapidly electrify how we heat our homes and our vehicles. GRAPHIC: Total site energy sector by sector pie chart breakdowns (pg. 13)
  • #24 First and most importantly: the transition off fossil fuels is an economic development and affordability strategy for Vermont. This topic is particularly important to me because, before I led EAN, I served as Economic Development Director at the Agency of Commerce and Community Development. The economic conversation about energy has for too long been backwards. Often the question will be asked, “how much will it cost us” to move from fossil fuel to efficient, renewable energy use. Our analysis shows that there are three key questions that we should be asking instead: #1: how much is our fossil fuel dependence currently costing Vermonters and the Vermont economy?; #2, how much do Vermonters stand to save on energy costs as a result of this transition?; and #3 how will the Vermont economy be affected by a transition off fossil fuels? To answer these questions, we asked the Vermont Agency of Commerce and Community Development to conduct an economic impact analysis of EAN’s “Path to Paris” model. The Path to Paris model takes proven and available technologies and best practices as outlined in Vermont’s Comprehensive Energy Plan and models the scale and pace of efficient and renewable energy adoption, primarily in for how we get around and heat our homes and buildings, that will be necessary to meet Vermont’s commitment to the Paris Climate Agreement. GRAPHIC: Path to Paris (pg. 4)
  • #27 Energy equity is based on the principle that all people should have access to reliable, safe, and affordable sources of energy; protection from a disproportionate share of negative impacts or externalities associated with building and operating our energy supply and distribution systems; and equitable distribution of and access to benefits from these systems.
  • #35 In addition to the new analysis and findings I have summarized, the report also includes the official tracking information that our network members, public partners, and the media have come to expect from EAN reports. You will find all of this in both the printed reports, which are available for you here today, and on EAN’s website: eanvt.org. It is now my pleasure to introduce…
  • #37 Stated differently, we have a big lift, a big opportunity in front of us. We need to use both of our hands to achieve it. Focusing our policy and regulatory strategy primarily on requiring emissions reductions from electricity generation is like trying to make that lift using only our pinky. GRAPHIC: % of GHG Emissions capped by policy (pg. 11). As a result of the Renewable Energy Standard, Vermont now has the lowest emitting electricity sector in the entire country, both overall and per capita. This is a strong foundation for rapid progress. What having the cleanest electricity in the US means is that whenever we electrify how we heat our homes, with heat pump water heaters or cold climate heat pumps, or how we get around with electric vehicles, we get a greater emissions reduction benefit from doing so than anywhere else in the United States.
  • #38 And yes, while we have achieved real and important emissions reductions from our electricity sector, they have been dwarfed by increased fossil fuel use for how we get around and heat our homes and buildings. GRAPHIC: Where emissions increase and decreases have come from across the region, 1990 v 2016) (Pg. 14).
  • #39 This year we have included policy case studies from across the world of places that have been the most successful at reducing emissions. Norway stands out for driving down emissions from their transportation sector. They have done so by:   Passing a law requiring that all passenger vehicles sold after 2025 be zero emissions Putting a fee on the purchase of new fossil fueled vehicles between now and 2025, to account for the social and environmental cost of pollution. Using that revenue to provide incentives for EV purchases. Together, these policies have already led to the majority of new vehicle purchases in Norway being electric as of 2018. GRAPHIC: EVs now the majority of new vehicles sold in Norway (pg. 18) The approach of banning things that are hazardous to human health and the environment, as Norway has done with their phase out of fossil fueled vehicles by 2025, is not new. The United States has taken a similar approach to substances like lead and asbestos. The difference is that fossil fueled vehicles, heating systems, and other pieces of equipment are not just detrimental to human health, they are destabilizing the entire climate on which we depend.
  • #40 First let me say a word about EAN. Our Network is a diverse collection of organizations, businesses, utilities, colleges and universities, and many more organizations across Vermont. The mission of the Network is to achieve Vermont’s Comprehensive Energy Plan goals – including a 90% renewable by 2050 total energy commitment – and to significantly reduce greenhouse gas emissions in ways that create a more just, thriving, and sustainable future for Vermonters.   To serve and support our diverse Network, a small non-profit organization exists to serve a couple of key roles: One, we serve as a neutral convener of our diverse Network. To respect the many opinions across our Network, EAN the non-profit does not lobby for particular bills. Two, we work with public partners from the local to the state to the federal level to collect data and track progress toward Vermont’s energy and climate commitments, conduct analysis about the challenges and opportunities of meeting them, and to share independent, objective, and trusted information and analysis, primarily through our Annual Progress Report but also through the Vermont Energy Dashboard, our monthly newsletter, and various white papers that we publish throughout the year. Through these different means we aim to both ground and advance Vermont’s energy and climate conversation with data and evidence. ]
  • #42 The progress we have made in our electricity sector is impressive and represents our foundation for further progress. Thanks to the Renewable Energy Standard, passed in 2015, Vermont has cut its emissions from electricity over 80% between 2015 and 2018. This will get us about one quarter of the way toward our Paris Climate Agreement commitment. GRAPHIC: GHG Emissions from the electricity sector, consumption based (pg. 25)
  • #44 We also provided more detail on Vermont’s mix of renewables—showing in state and out of state generation, pre and post REC—to illustrate the different ways we these energy sources can be measured and accounted for.
  • #46 While solar, wind, and hydro electricity generation technology have been around for decades, the solutions for how we get around and heat our homes and buildings efficiently without fossil fuels are newer. A big part of this transition will be making sure Vermonters are aware of cleaner, healthier, and more economical ways to get around and heat their homes and buildings. A decade ago there were fewer than 100 electric vehicles in Vermont and no cold climate heat pumps. As of last year, there are over 3,500 EVs registered in Vermont, over 17,000 heat pump systems, and over 11,000 heat pump water heaters. Those numbers are growing every year and could be showing the beginnings of market transformation, similar to when cell phones replaced landlines and to the growth of solar PV, if we put policies in place to support their adoption and send the right market signals. GRAPHIC: Path to Paris (note: latest status row) (pg. 4) AND/OR GRAPHIC: Decreasing costs and new policy support rapid growth of solar (pg. 7)
  • #50 In summary, we have the technology to end fossil fuel use and to do so in a way that brings economic benefit to all Vermonters. But this transformation will not happen without a total energy policy and regulatory framework that requires emissions reduction from the transportation and thermal sectors – where over 70% of Vermont’s climate pollution comes from. And this transition will not be equitable without state incentives and assistance to ensure that the savings and health benefits of getting off fossil fuels don’t just accrue to upper income Vermonters. As the Upper Austrians, the Norwegians, Quebec, California, and every other country and state we have studied has learned: pairing emissions reduction with economic growth requires both sticks and carrots, or regulations and incentives, and it requires doing so across all energy sectors, not just electricity. Regulation is not as effective without incentives. And incentives are not as effective without regulation – let alone the question of where revenues for incentives come from without fees on fossil fuels or fossil fuel equipment. GRAPHIC: % of GHG Emissions capped by policy (pg. 11)
  • #51 While EAN’s Path to Paris may sound like a big lift, looked at another way it’s not asking very much: all we have to do to meet our Paris Climate Agreement commitment is get our per capita emissions down to those of New Hampshire over the next 5 years. That means each Vermonter, on average, reducing our climate pollution by 4 tons per year. GRAPHIC: Average annual VT emissions, per capita: 15.6 tons CO2e (pg. 6) If you are a Vermonter concerned about the climate, doing your part, and not being exposed to the high and volatile prices of fossil fuels, here’s a commitment you can make to help do that: never buy a new fossil fueled vehicle again; never install a new fossil fueled heating system again; never purchase anything that uses fossil fuel again. Most of us just don’t need to given the proliferation of electric alternatives, for everything from vehicles to efficient heating to lawn care. Vermont simply cannot afford new vehicles, new heating systems, and other fossil fueled equipment that will lock in continued fossil fuel use for decades, and Vermonters can’t afford high and volatile prices of those fuels, or of being stuck owning stranded assets. It’s really quite simple: fossil fuels are the problem and each of us do what we can to stop creating new demand for them, especially because electric and renewable alternatives are proven and ready. Most Vermonters I know don’t like using gasoline or diesel or fuel oil or propane. They simply do so because that’s what the vehicles they use to get around run on, or because that’s what their heating system requires. To reduce fossil fuel use, the real solution isn’t penalizing people who have to use fossil fuel, it’s helping make sure that we transition out the equipment – the vehicles and heating systems – that leads to fossil fuel use at the point of purchase, once those vehicles, heating systems, and pieces of equipment are ready to be replaced.
  • #52 Slide for Rebecca
  • #53 Let’s walk through it in more detail: Vermonters are projected to purchase or lease between 210,000 to 240,000 new vehicles between now and 2025 (or 35,000 to 40,000 vehicles per year). If 90,000 of that total are electric vehicles instead of gas vehicles, Vermonters will save significant amounts of money on fuel and maintenance, approximately $10,000 over 150,000 miles, as estimated by AAA. GRAPHIC: Gas vs. EV Cost comparison (pg. 19)
  • #54 About 72,500 heating systems are projected to be replaced in Vermont between now and 2025 (or about 12,500 per year). If we install 6,000 automated pellet boilers, 9,000 efficient pellet stoves, and 90,000 cold climate heat pump systems over that period, we can significantly reduce fossil fuel consumption and therefore Vermonters’ exposure to high and volatile fossil fuel prices. Home or building owners should speak with a heating professional from the Efficiency Excellence Network to understand which options are best for their specific situation. GRAPHIC: State outlines with different dollar outflows for heating (pg. 21)
  • #55 The state of Upper Austria has achieved similar success in their heating sector. With twice our population and half our forest cover, they are meeting 47% of their total heating demand from renewable sources, primarily from automated wood heating systems that utilize sustainably harvested wood that help keep forest as forest, for its economic, cultural, and carbon sequestration value. GRAPHIC: Wood pellets from Northeast cut GHG emissions vs. fossil fuel heating (pg. 22) Remove this slide?