Download as PPS, PPTX

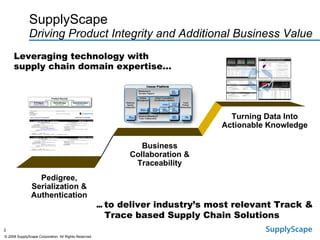
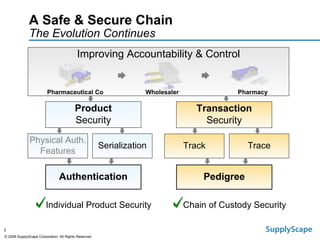
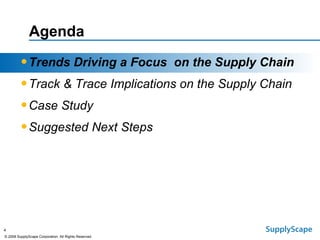
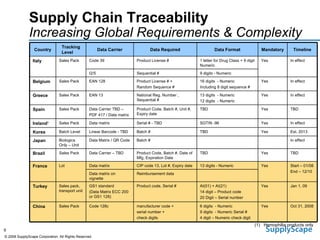
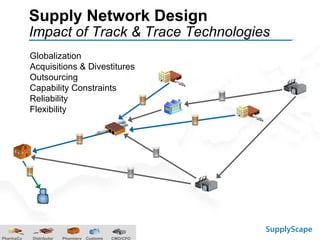
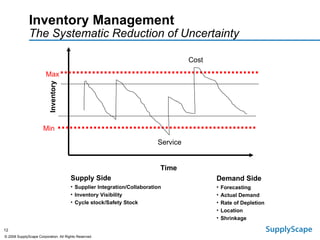
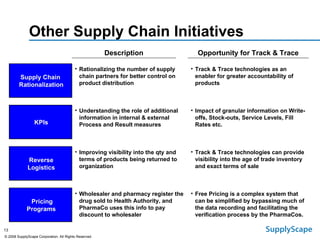
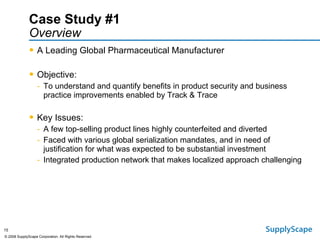
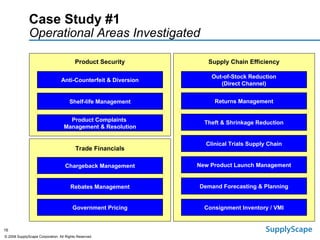
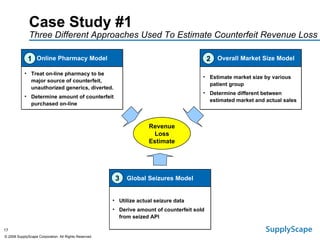
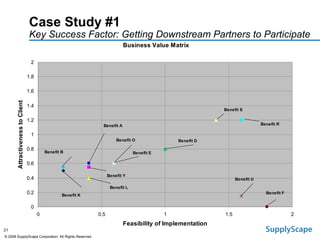
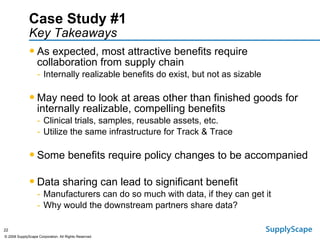
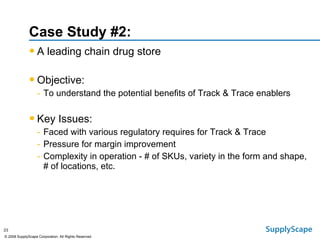
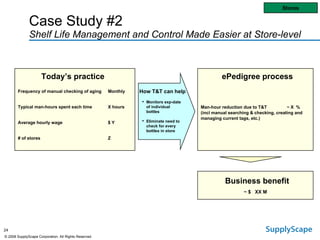


This document discusses how track and trace technologies can transform pharmaceutical business performance by enabling supply chain as a strategic asset. It provides an overview of trends driving increased focus on supply chains, describes implications of track and trace on supply chain operations and security. The document also presents two case studies, one on a global pharmaceutical manufacturer and one on a leading drug store chain, analyzing potential benefits of track and trace technologies across various operational areas like inventory management, out-of-stock reduction, returns management, and more. It concludes by suggesting pharmaceutical companies need to address compliance responsibilities globally and prioritize an implementation plan to leverage investments in track and trace.


![CASE_PRESENTATION_ON_subdural_hematoma(SDH)[1 FINAL PPT]-1.pptx](https://cdn.slidesharecdn.com/ss_thumbnails/casepresentationonsubduralhematomasdh1finalppt-1-260129172522-d405d375-thumbnail.jpg?width=640&height=640&fit=bounds)


