Download to read offline
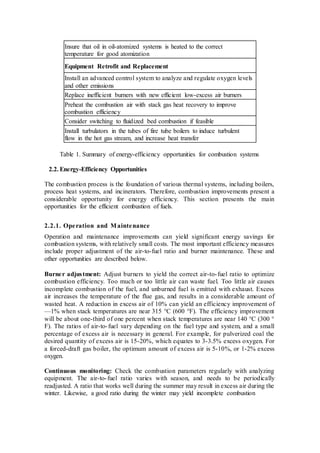
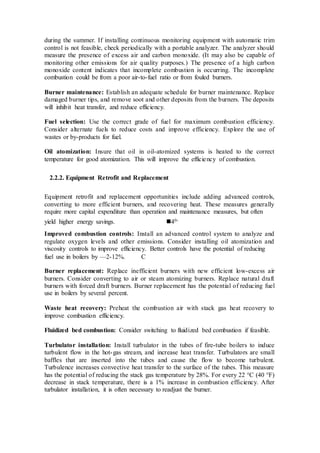
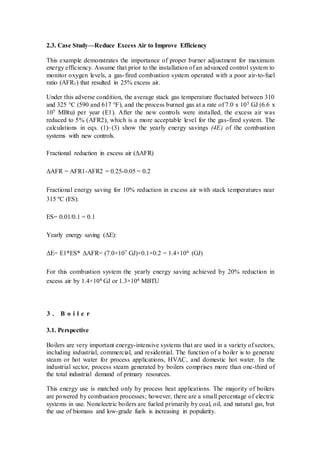
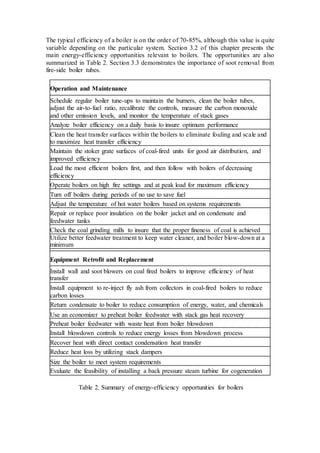


This document summarizes opportunities for improving the efficient use of fossil fuels in industrial processes. It discusses four main system types: combustion, boilers, steam, and process heat. Combustion is the foundation for the other three. The document outlines various operation and maintenance measures as well as equipment retrofit and replacement options to improve efficiency for each system type. It provides statistics on fossil fuel use in industry and examples of potential energy savings through efficiency improvements.


