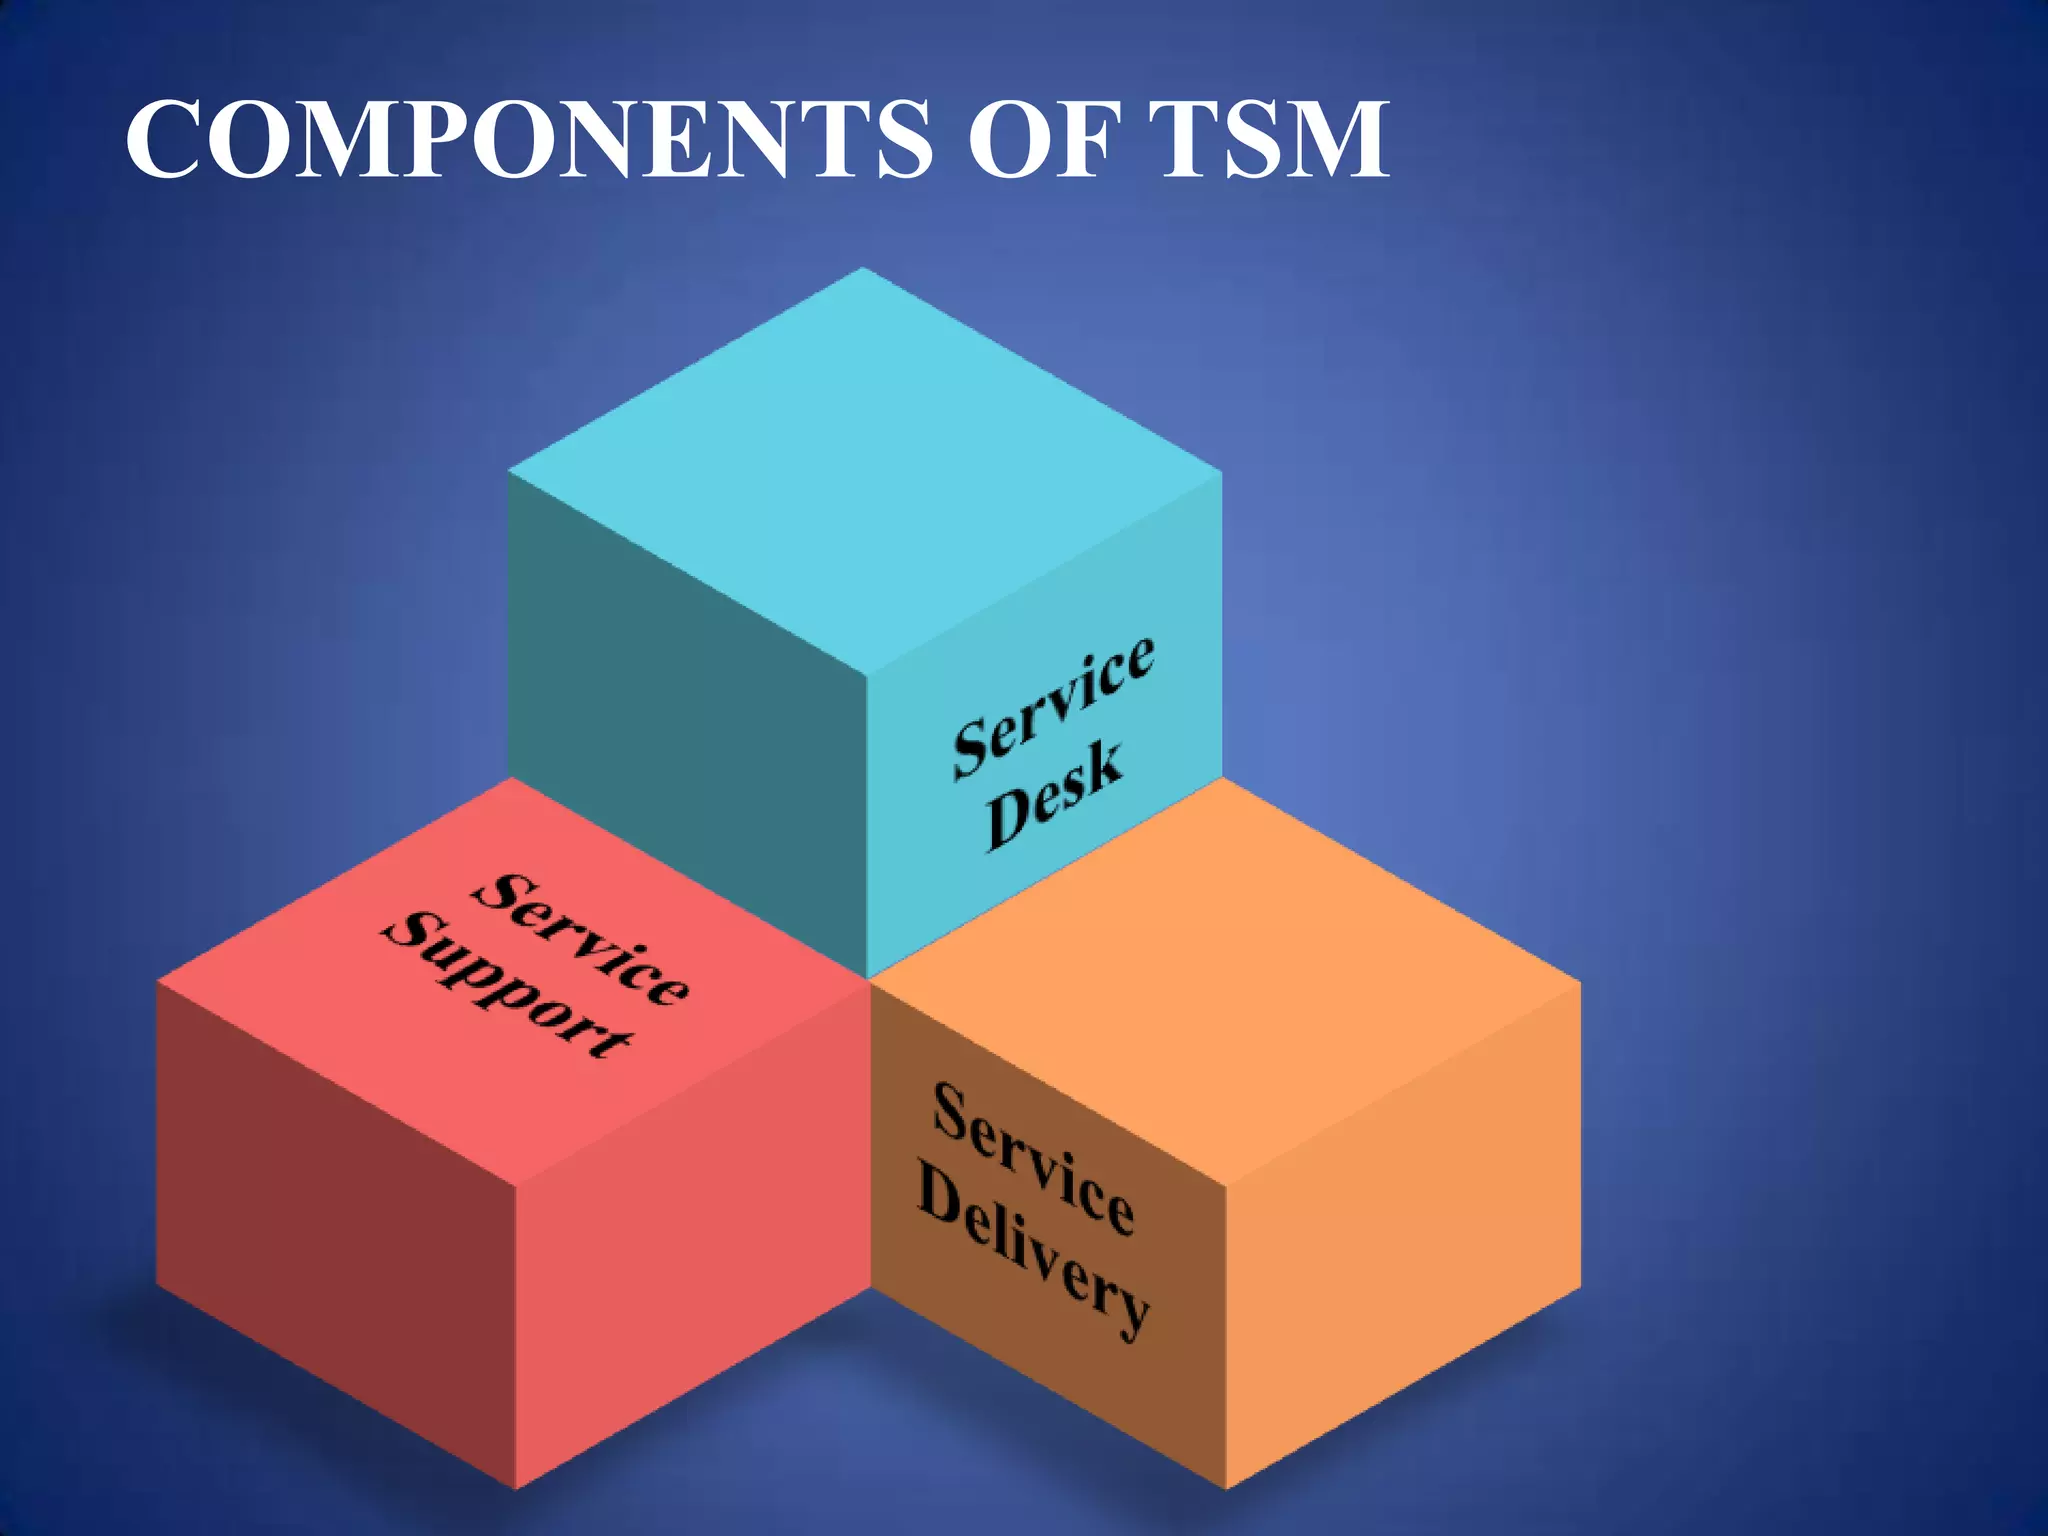
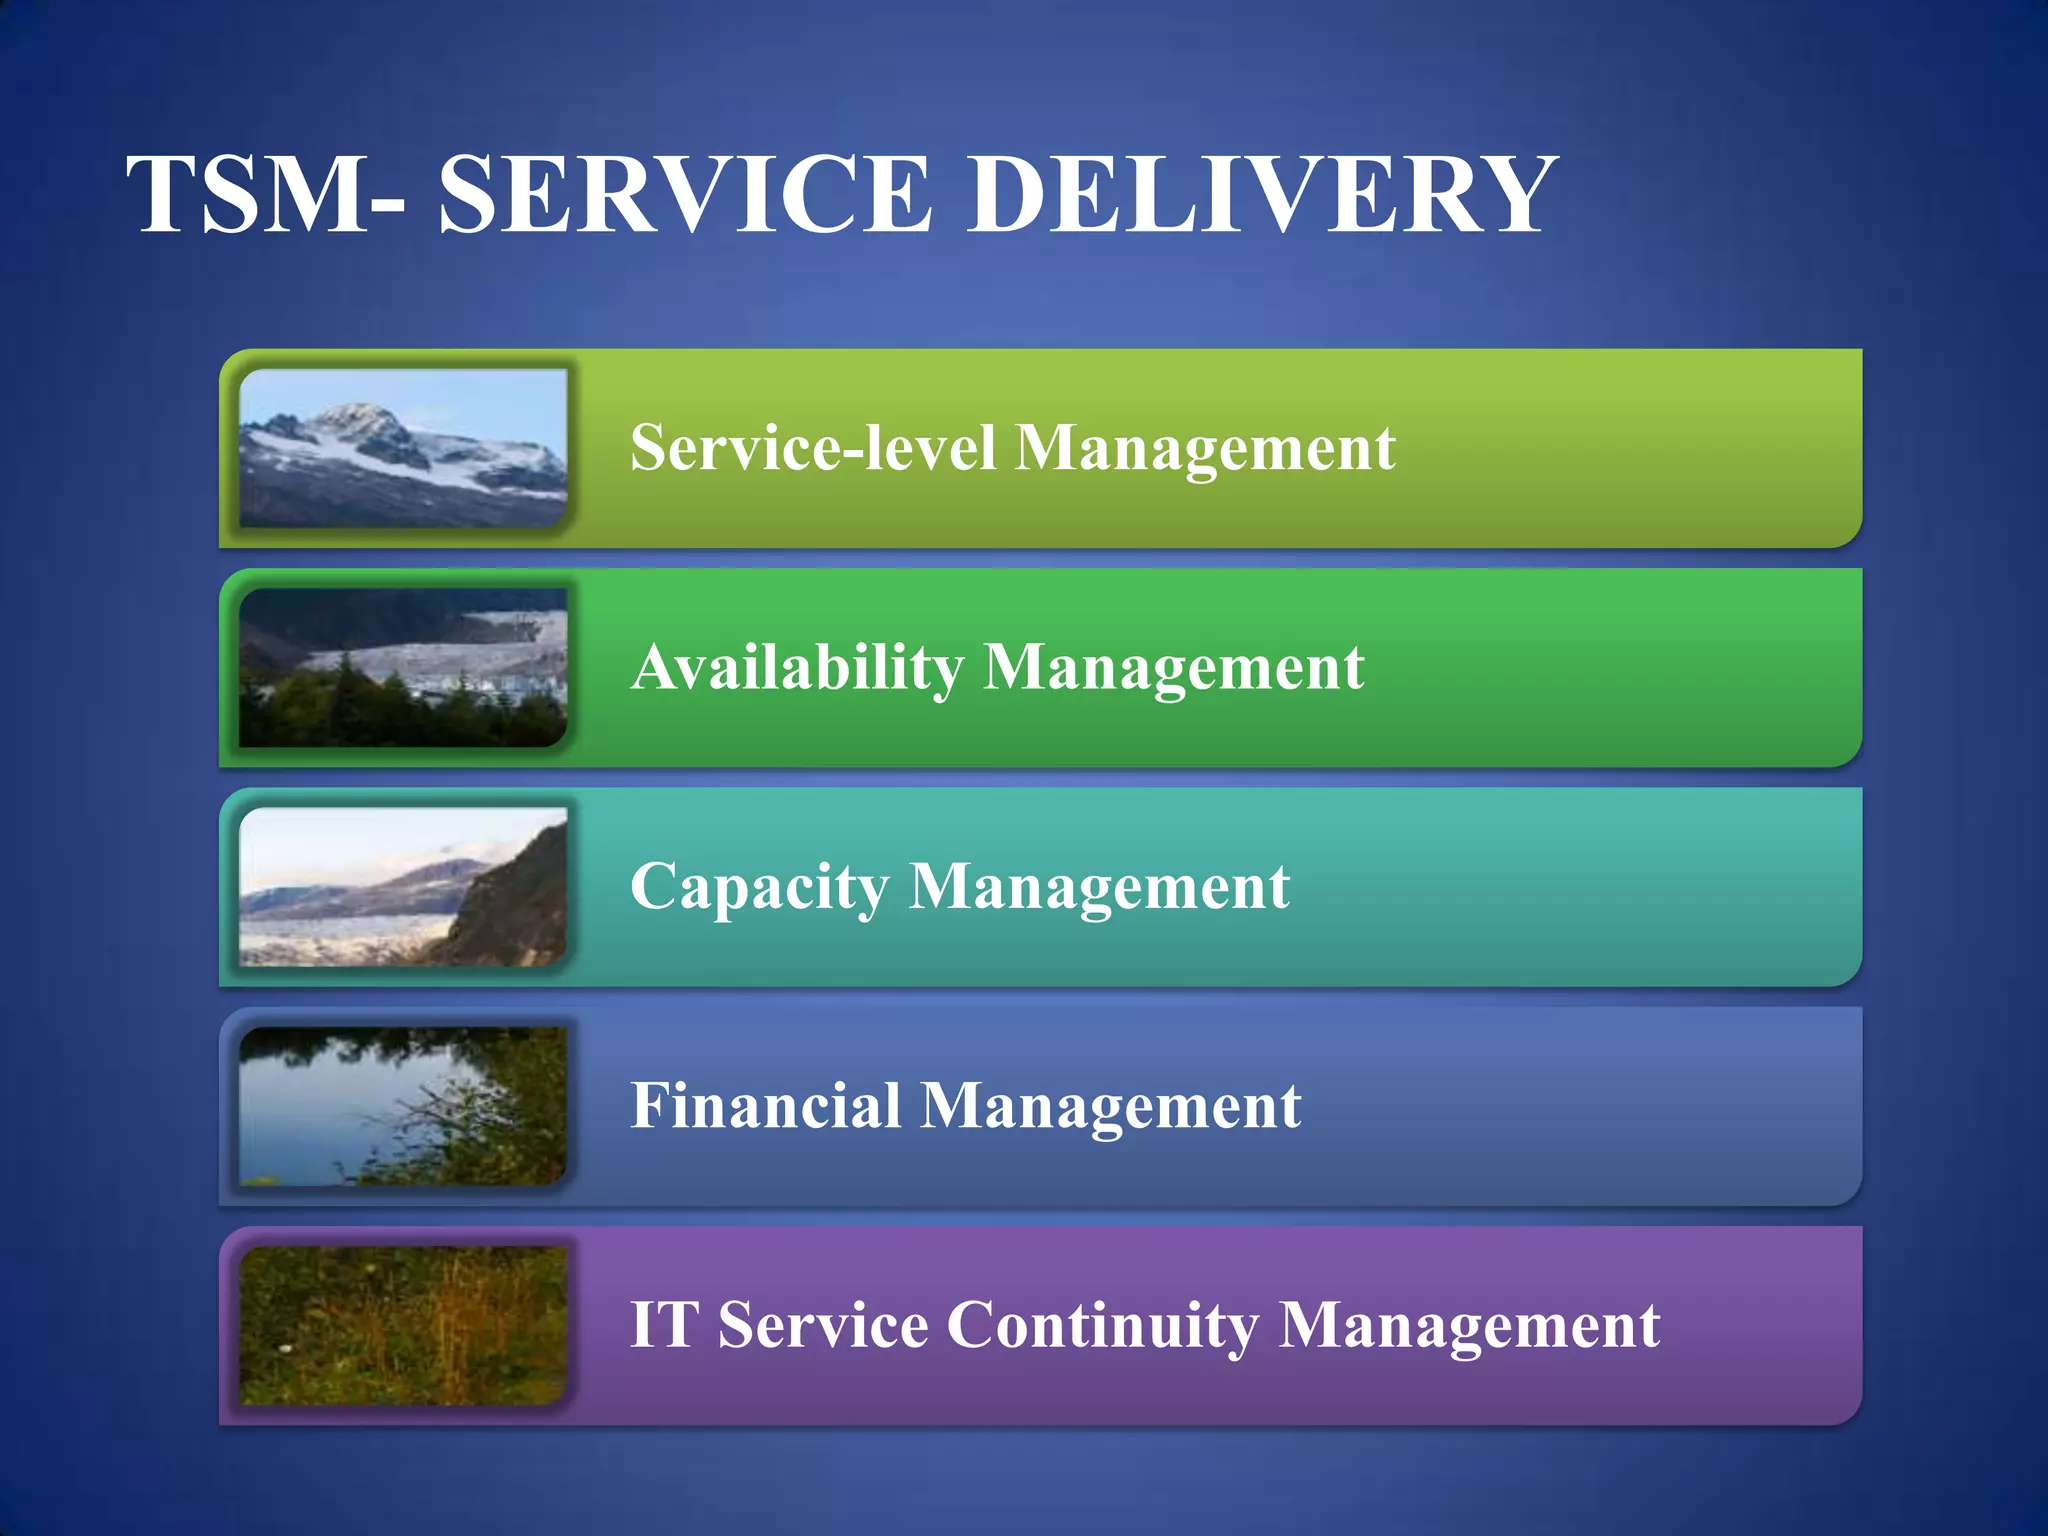
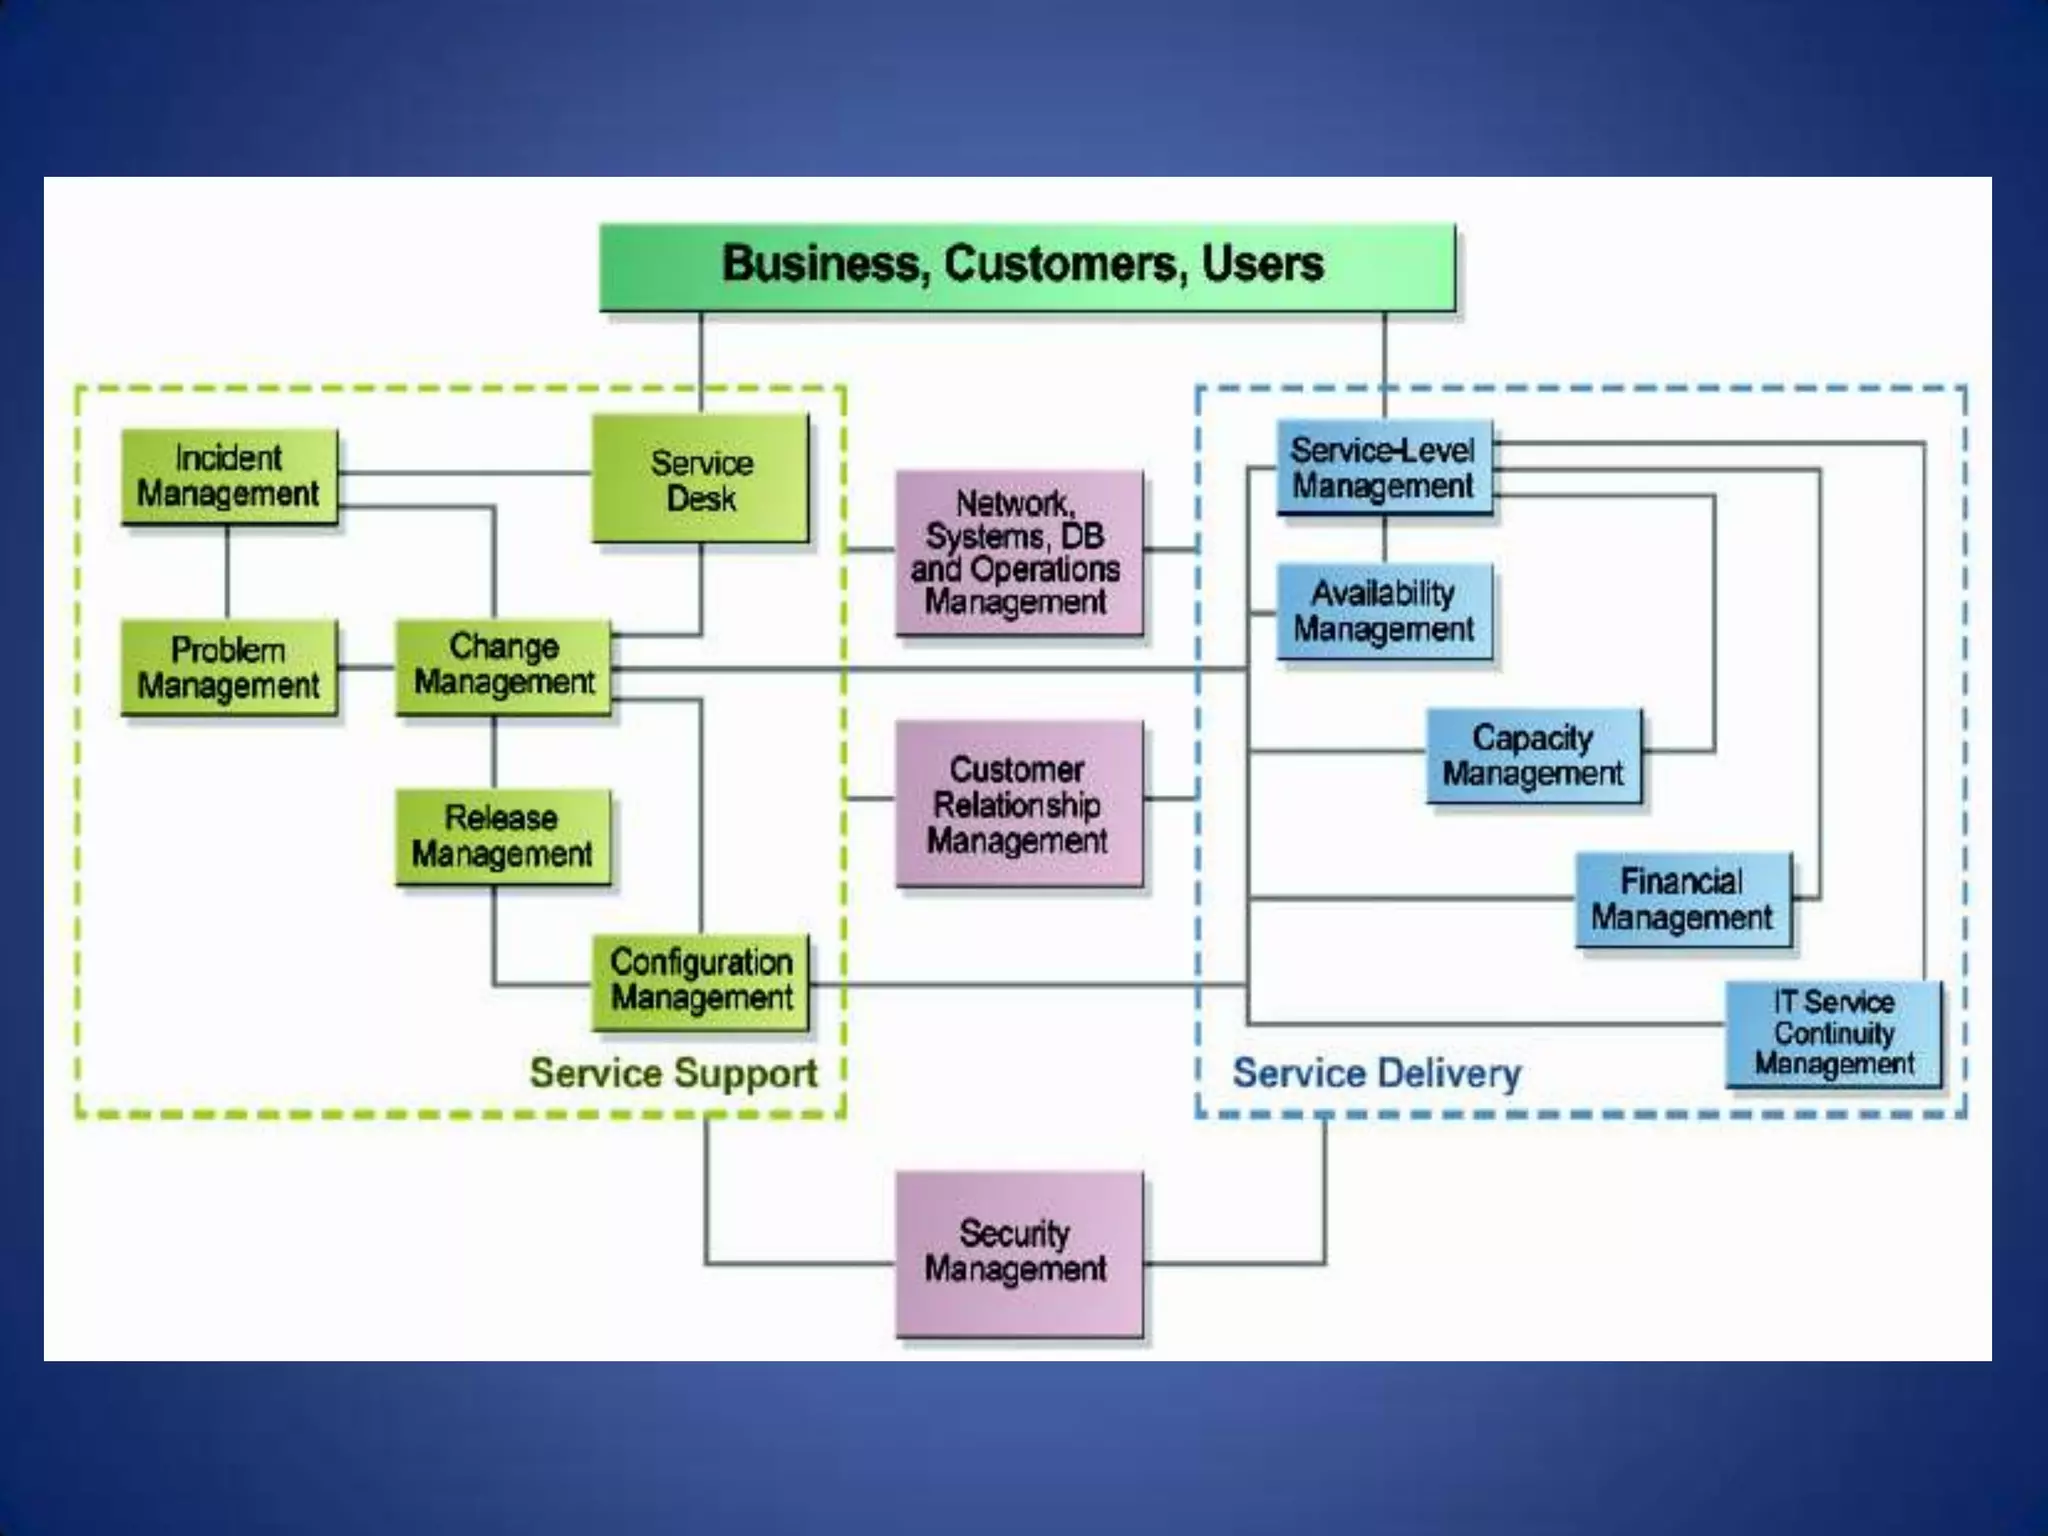
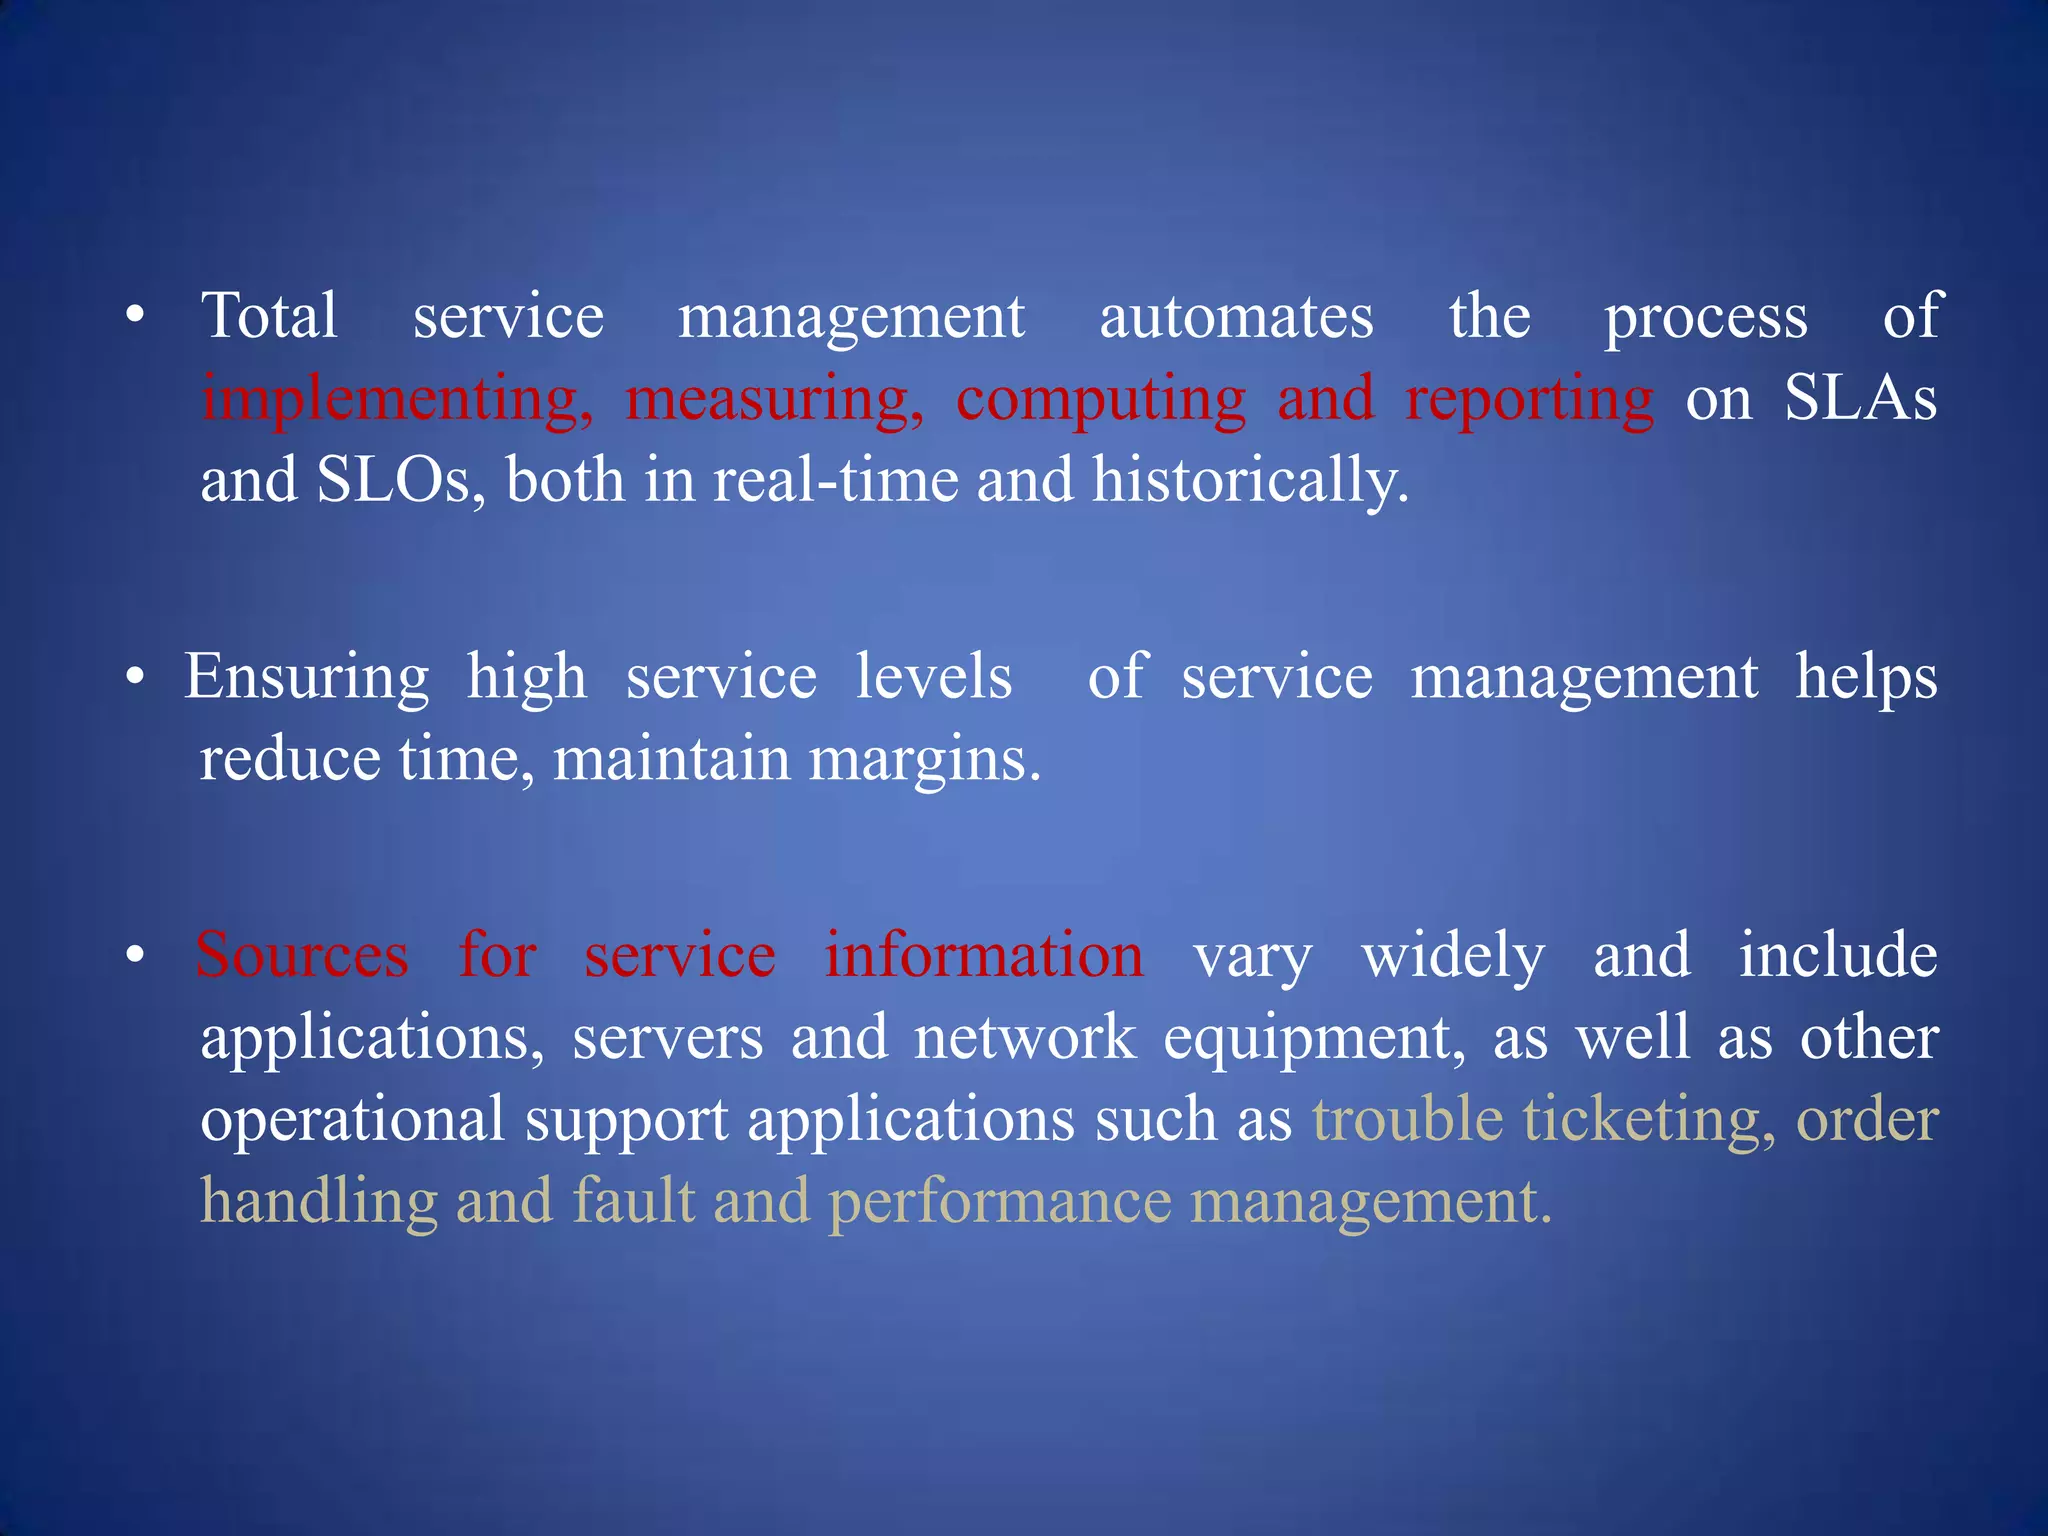
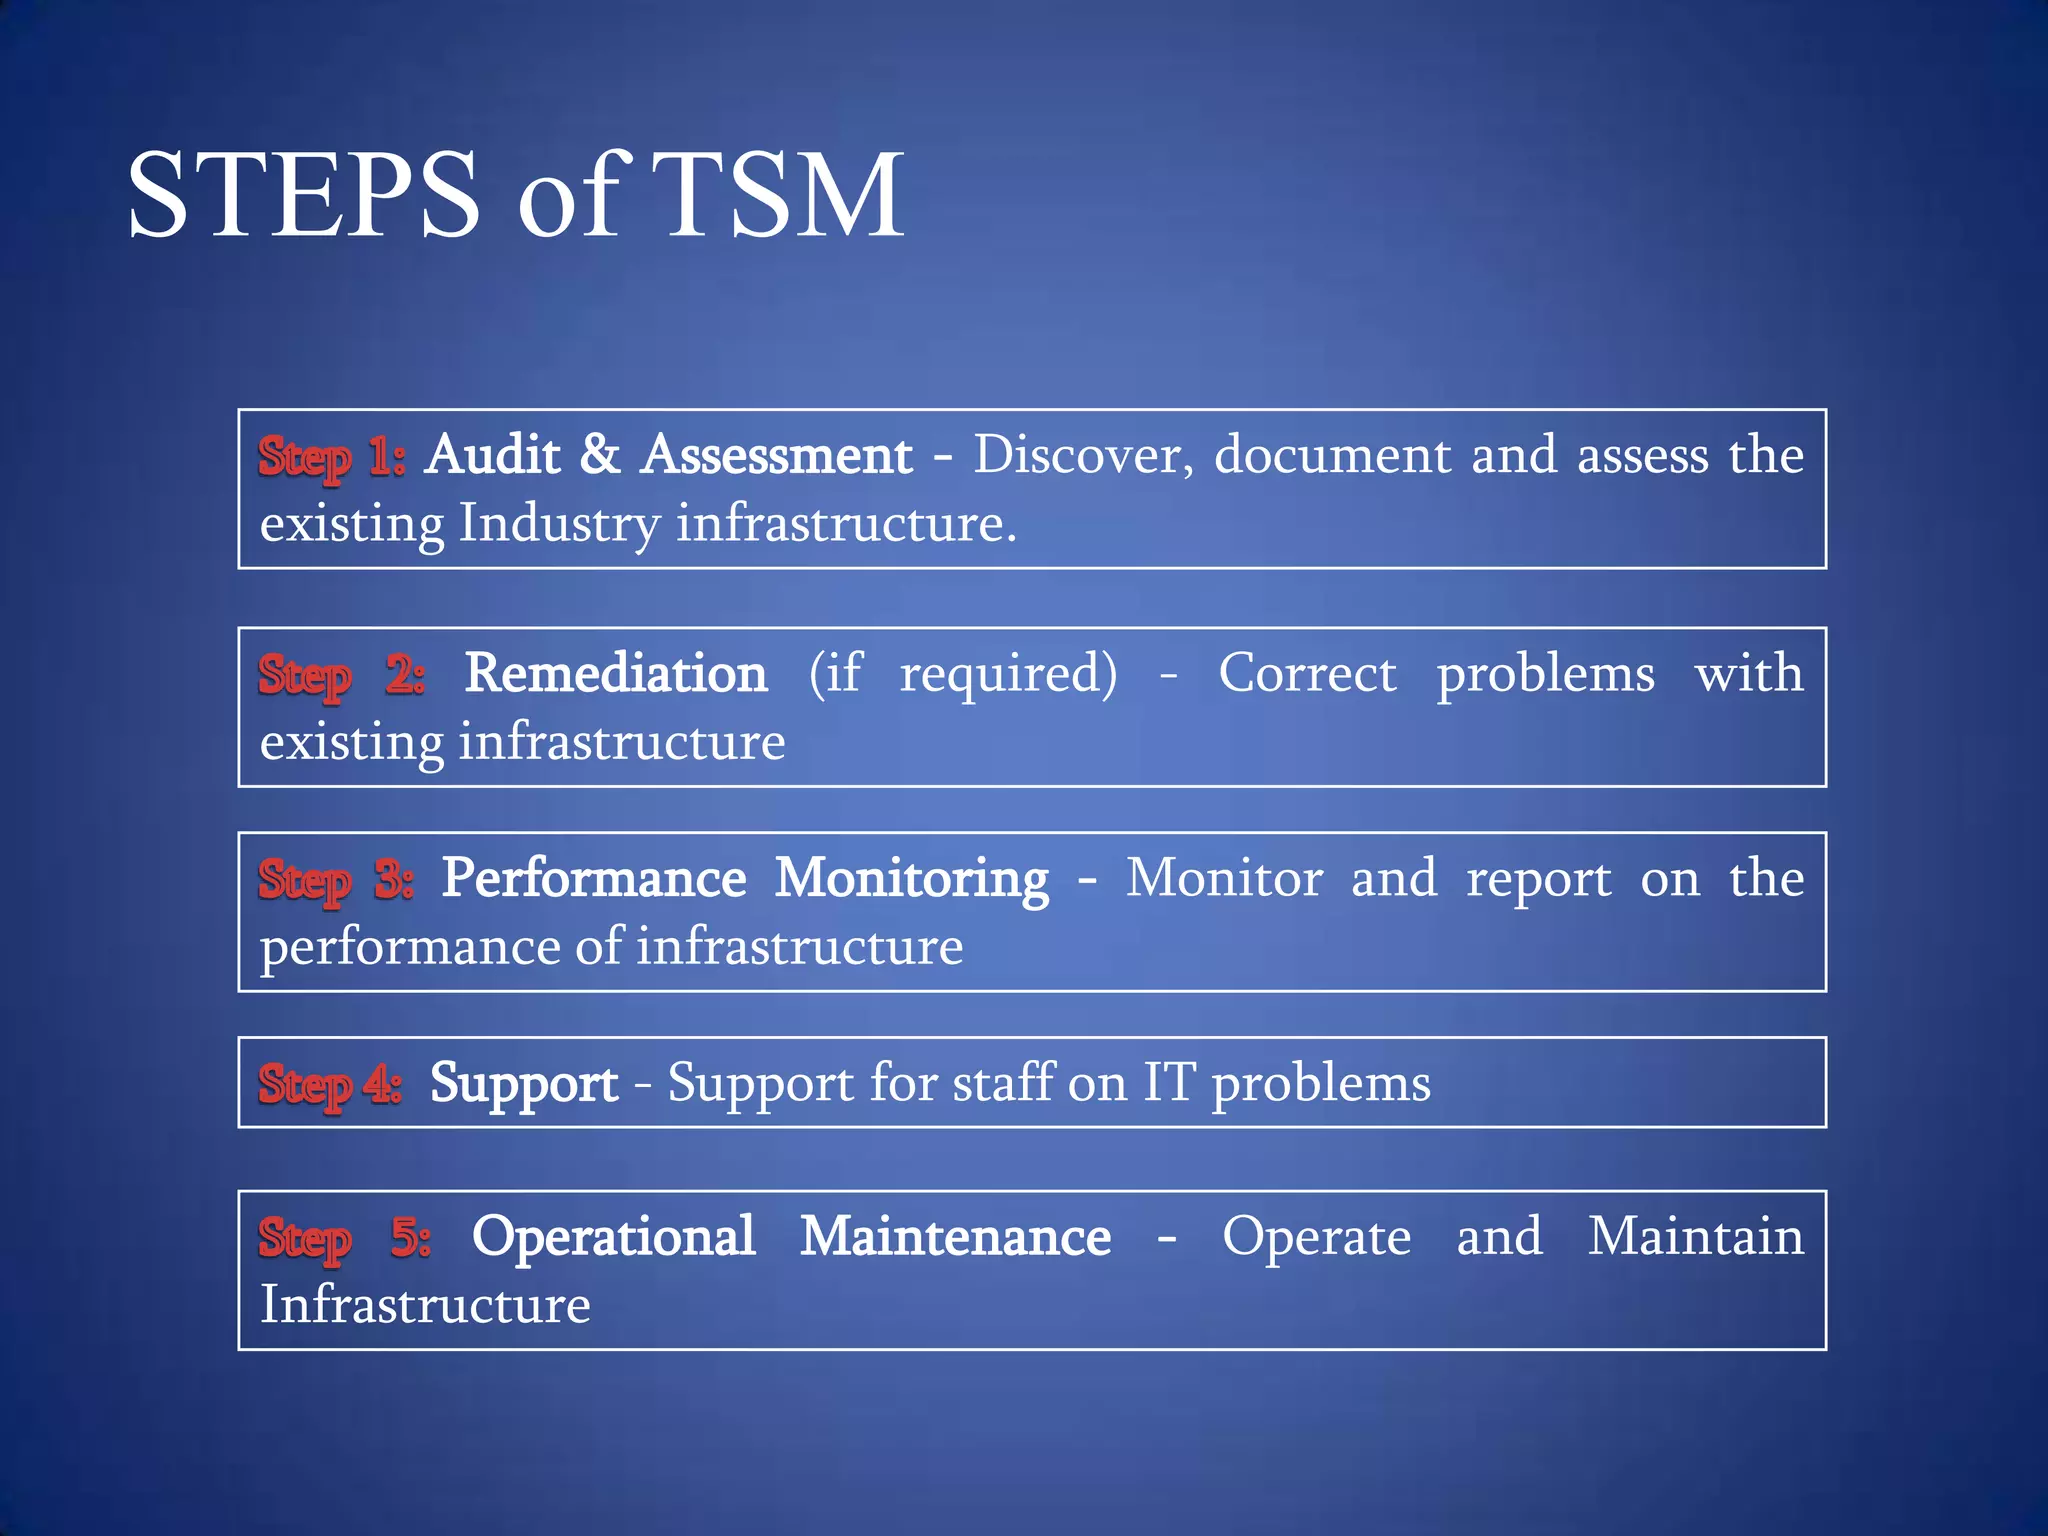
Total Service Management (TSM) aims to aggregate and consolidate all relevant service-level data in real-time to process and distribute information to users and systems. It measures service levels across the organization using processes, structures, and applications. TSM seeks to improve quality, flexibility, and customer service through efficiency. It covers the full lifecycle including components like incident management, change management, release management, and capacity management. TSM automation helps ensure high service levels to reduce costs and maintain margins.
This is our first post in the series explaining the concepts surrounding MRP system.
MRP is a term that can be understood in many ways. We’ll try to shed some light on the history and relevance of the term and the characteristics of the MRP systems.
(Funnily, the answer to “What is MRP?” depends on the age of the respondent. Read on, and you’ll understand why.)
http://manufacturing-software-blog.mrpeasy.com/blog/2017/09/25/mrp/
Sales & Operations Planning is popularly known as S&OP and is a process which has evolved from SCM. It looks at balancing demand with supply and can be applied in most of the industries. The phase- wise process is depicted in the presentation
Material requirements planning and manufacturing resource planning differenceMRPeasy
The MRP is a planning system that allows you to manage the production resources of an organization. Here is an overview of Material Requirements Planning (MRP I) and Manufacturing Resource Planning (MRP II) differences.
#mrp #mrpsoftware #mrpeasy #erpsystem #materialrequirements #manufacturingresourceplanning #manufacturing #manufacturingsoftware #erp
Supply Chain Management spans all movement and storage of raw materials, work-in-process inventory, and finished goods from point of origin to point of consumption (supply chain).
Material requirement planning - Production and Operation ManagementSuryakumar Thangarasu
A production planning, scheduling and inventory control system, manages manufacturing process.
Ensures availability of materials for production and delivery to customers.
Maintains lowest possible material in the store.
Plans manufacturing activities and delivery schedule.
PECB Webinar: How to design IT Services for achieving business objectives?PECB
We will cover:
This webinar will cover the fundamentals of the design processes and the five aspects of the design. It includes the methods, practices and tools for achieving excellence in service design, based on ITIL and ISO 20000 standard.
Presenter:
This webinar will be presented by Silvana Tomić Rotim (PMP, CMC, 27001, 200000, 9001, etc.)
I hope this introductory presentation to ITIL v3 Foundation exam will be very useful to the readers. The time one needs to spend on study depends upon one's experience with ITIL related practices in real world. Nonetheless, it is very simple study, but the exam questions may be trickier than expectation. So, focus on learning ITIL concepts rather than adding ITIL certificate to your resume.
References for the slides used from:
http://taruu.com/Documents/ITIL%20v3%20Foundation%20Study%20Guide%20v4.2.2.5.pdf
The Art of Service – ITIL v3 Foundation Complete Certification Kit (book and online course)
Skillport - IT Infrastructure Library (ITIL) v3 Foundation Syllabus v4.2 exam
Improving IT services by implementing best practices. Strategic approval with clear RACI. Details plan covering entire process to improve the efficiency of IT team.
Sap tech ed13_asug_delivering_continuous_sap_solution_availabilityRobert Max
SAP TechEd Presentation (ITM230) Delivering Continuous SAP Solution Availability - How Novelis Corp has maintained 99.96% Solution Availability in the 12 months since our go-live on SAP
June 3, 2024 Anti-Semitism Letter Sent to MIT President Kornbluth and MIT Cor...Levi Shapiro
Letter from the Congress of the United States regarding Anti-Semitism sent June 3rd to MIT President Sally Kornbluth, MIT Corp Chair, Mark Gorenberg
Dear Dr. Kornbluth and Mr. Gorenberg,
The US House of Representatives is deeply concerned by ongoing and pervasive acts of antisemitic
harassment and intimidation at the Massachusetts Institute of Technology (MIT). Failing to act decisively to ensure a safe learning environment for all students would be a grave dereliction of your responsibilities as President of MIT and Chair of the MIT Corporation.
This Congress will not stand idly by and allow an environment hostile to Jewish students to persist. The House believes that your institution is in violation of Title VI of the Civil Rights Act, and the inability or
unwillingness to rectify this violation through action requires accountability.
Postsecondary education is a unique opportunity for students to learn and have their ideas and beliefs challenged. However, universities receiving hundreds of millions of federal funds annually have denied
students that opportunity and have been hijacked to become venues for the promotion of terrorism, antisemitic harassment and intimidation, unlawful encampments, and in some cases, assaults and riots.
The House of Representatives will not countenance the use of federal funds to indoctrinate students into hateful, antisemitic, anti-American supporters of terrorism. Investigations into campus antisemitism by the Committee on Education and the Workforce and the Committee on Ways and Means have been expanded into a Congress-wide probe across all relevant jurisdictions to address this national crisis. The undersigned Committees will conduct oversight into the use of federal funds at MIT and its learning environment under authorities granted to each Committee.
• The Committee on Education and the Workforce has been investigating your institution since December 7, 2023. The Committee has broad jurisdiction over postsecondary education, including its compliance with Title VI of the Civil Rights Act, campus safety concerns over disruptions to the learning environment, and the awarding of federal student aid under the Higher Education Act.
• The Committee on Oversight and Accountability is investigating the sources of funding and other support flowing to groups espousing pro-Hamas propaganda and engaged in antisemitic harassment and intimidation of students. The Committee on Oversight and Accountability is the principal oversight committee of the US House of Representatives and has broad authority to investigate “any matter” at “any time” under House Rule X.
• The Committee on Ways and Means has been investigating several universities since November 15, 2023, when the Committee held a hearing entitled From Ivory Towers to Dark Corners: Investigating the Nexus Between Antisemitism, Tax-Exempt Universities, and Terror Financing. The Committee followed the hearing with letters to those institutions on January 10, 202
Macroeconomics- Movie Location
This will be used as part of your Personal Professional Portfolio once graded.
Objective:
Prepare a presentation or a paper using research, basic comparative analysis, data organization and application of economic information. You will make an informed assessment of an economic climate outside of the United States to accomplish an entertainment industry objective.
Synthetic Fiber Construction in lab .pptxPavel ( NSTU)
Synthetic fiber production is a fascinating and complex field that blends chemistry, engineering, and environmental science. By understanding these aspects, students can gain a comprehensive view of synthetic fiber production, its impact on society and the environment, and the potential for future innovations. Synthetic fibers play a crucial role in modern society, impacting various aspects of daily life, industry, and the environment. ynthetic fibers are integral to modern life, offering a range of benefits from cost-effectiveness and versatility to innovative applications and performance characteristics. While they pose environmental challenges, ongoing research and development aim to create more sustainable and eco-friendly alternatives. Understanding the importance of synthetic fibers helps in appreciating their role in the economy, industry, and daily life, while also emphasizing the need for sustainable practices and innovation.
Read| The latest issue of The Challenger is here! We are thrilled to announce that our school paper has qualified for the NATIONAL SCHOOLS PRESS CONFERENCE (NSPC) 2024. Thank you for your unwavering support and trust. Dive into the stories that made us stand out!
Normal Labour/ Stages of Labour/ Mechanism of LabourWasim Ak
Normal labor is also termed spontaneous labor, defined as the natural physiological process through which the fetus, placenta, and membranes are expelled from the uterus through the birth canal at term (37 to 42 weeks
Introduction to AI for Nonprofits with Tapp NetworkTechSoup
Dive into the world of AI! Experts Jon Hill and Tareq Monaur will guide you through AI's role in enhancing nonprofit websites and basic marketing strategies, making it easy to understand and apply.
Francesca Gottschalk - How can education support child empowerment.pptxEduSkills OECD
Francesca Gottschalk from the OECD’s Centre for Educational Research and Innovation presents at the Ask an Expert Webinar: How can education support child empowerment?
Safalta Digital marketing institute in Noida, provide complete applications that encompass a huge range of virtual advertising and marketing additives, which includes search engine optimization, virtual communication advertising, pay-per-click on marketing, content material advertising, internet analytics, and greater. These university courses are designed for students who possess a comprehensive understanding of virtual marketing strategies and attributes.Safalta Digital Marketing Institute in Noida is a first choice for young individuals or students who are looking to start their careers in the field of digital advertising. The institute gives specialized courses designed and certification.
for beginners, providing thorough training in areas such as SEO, digital communication marketing, and PPC training in Noida. After finishing the program, students receive the certifications recognised by top different universitie, setting a strong foundation for a successful career in digital marketing.
Biological screening of herbal drugs: Introduction and Need for
Phyto-Pharmacological Screening, New Strategies for evaluating
Natural Products, In vitro evaluation techniques for Antioxidants, Antimicrobial and Anticancer drugs. In vivo evaluation techniques
for Anti-inflammatory, Antiulcer, Anticancer, Wound healing, Antidiabetic, Hepatoprotective, Cardio protective, Diuretics and
Antifertility, Toxicity studies as per OECD guidelines
5. TOTAL SERVICE MANAGEMENT
• Definition : The aggregation and consolidation of all
relevant service-level data in real-time into a single
system, which can then process and distribute this
information to human operators and other systems is known
as Total service Management.
• Measuring service levels across the organisation is a business
process that requires processes, organisational structures and
specific applications.
6. OUTCOMES OF TSM
• Tidiness and cleanliness
• Shorter throughput times
• Space savings
• Reduced costs
• More transparency
• High material availability
• Short search and find times
• High value contribution, less waste
• Motivation and higher staff satisfaction
9. TSM- SERVICE SUPPORT
Incident Change Configuration Problem Release
Management Management Management Management Management
10. TSM- SERVICE DELIVERY
Service-level Management
Availability Management
Capacity Management
Financial Management
IT Service Continuity Management
11.
12.
13.
14. INCIDENT MANAGEMENT
• Incident Management is a process in its own right (owned and
managed by the Service Desk)
• Revised scope for incident definition (now includes service
requests)
• Clearer delineation between Incident Management and
Problem Management
• Clear description of the role of 2nd/3rd, nth
• line support (support groups)
16. INCIDENT MANAGEMENT
• Incident Management is a process in its own right (owned and
managed by the Service Desk)
• Revised scope for incident definition (now includes service
requests)
• Clearer delineation between Incident Management and
Problem Management
• Clear description of the role of 2nd/3rd, nth
• line support (support groups)
18. PROBLEM MANAGEMENT
• Revised description of Problem Control
– identification and recording
– Classification
– investigation and diagnosis
• Error Control
• Specific proactive PM activities:
– trend analysis
– targeting preventive action
19. PROBLEM MANAGEMENT
• No more confusion between Problem Management and
2nd/3rd line support
• Focus is on building Knowledge Management
– FAQs on the Intranet
• Guidelines for identification of Problems
• Problem Analysis methods (in Appendix)
– Kepner Tregoe
– Ishikawa Diagrams
22. CHANGE MANAGEMENT
• Relationship to program management (PMO)
• Communication within the organisation
– FSC: Forward Schedule of Change
– PSA: Projected Service Availability
• New emphasis on regressions and back-out strategy
• Risk assessment stressed as part of priority allocation
• Change Models for standard procedures
• PIR - Post Implementation Review
23. RELEASE MANAGEMENT
• Revised process name for Software Control & Distribution
– Software now hardware, software and documentation
– Control now part of Configuration Management
– Distribution now central part of Release Management
• Awareness of possible problems that have been en countered
24. RELEASE MANAGEMENT
• Three categories of releases:
1. minor (small enhancements & fixes)
2. major (new functionality)
3. emergency (incidents / urgent changes)
• Activities: Roll-out, planning & communication
• Tools & Technology
25. CONFIGURATION MANAGEMENT
• Activity Emphasis: Planning
• Central function: Change + Config. + Release
• Change and Configuration Management Plan (C&CM)
• New Process Role: Configuration Librarian
• Scope: hardware + software + documentation
• Terminology: CMDB, DSL and DHS
26. CONFIGURATION MANAGEMENT
• Change in terminology
������ Verification enhanced with Audits
������ Baseline now Configuration Baseline
• License Management
������ Relationship to Security Management
������ Relationship to DSL
• Asset Management
27. CAPACITY MANAGEMENT
• More emphasis on a business management perspective.
Reduced volume of technical how-to
• Sub-processes
������ Business Capacity Management
������ Service Capacity Management
������ Resource Capacity Management
• Significant clarity on the principles, activities, planning and
implementation, reporting metrics, relationships and capacity
plan contents
29. IT SERVICES CONTINUITY MANAGEMENT
• ITSCM is part of and supports the larger Business Continuity
Management (BCM)
• Scope of ITSCM
������ OUT: Business Recovery (part of BCM)
������ IN: all components (including non-IT) relevant to IT-Service
Continuity
• Business Impact Analysis identify minimal service levels for
critical business processes
• Management structure, roles and responsibilities
30. AVAILABILTY MANAGEMENT
• Significant improvement in clarity of process goal, mission
statement and scope without technical complications
• Planning and design for high availability and recovery
31. AVAILABILTY MANAGEMENT
• Thorough guidance on End-User Availability metrics and
reporting
������ Vital Business Functions (VBFs)
������ cost of UNavailability
• Comprehensive guidance for availability improvement –
analysis, methods and techniques
������ Component Failure Impact Analysis (CFIA)
������ Service Outage Analysis (SOA)
33. LEVELS OF SERVICE MANAGEMENT
• Total service level management provides the most efficient
way
– to monitor service agreements (SLAs) and
– to manage service objectives (SLOs), and enables more responsive
service provision.
• SLAs are contractual commitments between the providers and
customers.
• SLOs are generalised service levels across a set of customers.
34. • Total service management automates the process of
implementing, measuring, computing and reporting on SLAs
and SLOs, both in real-time and historically.
• Ensuring high service levels of service management helps
reduce time, maintain margins.
• Sources for service information vary widely and include
applications, servers and network equipment, as well as other
operational support applications such as trouble ticketing, order
handling and fault and performance management.
38. STEPS of TSM
Audit & Assessment - Discover, document and assess the
existing Industry infrastructure.
Remediation (if required) - Correct problems with
existing infrastructure
Performance Monitoring - Monitor and report on the
performance of infrastructure
Support - Support for staff on IT problems
Operational Maintenance - Operate and Maintain
Infrastructure
Animated pointer and light-up text(Advanced)To reproduce the background effects on this slide, do the following:On the Home tab, in theSlides group, click Layout, and then click Blank.Right-click the slide background area, and then click Format Background. In the Format Background dialog box, click Fill in the left pane, select Solid fill in the right pane, and select White, Background 1 (first row, first option from the left).To reproduce the rectangle on this slide, do the following:On the Home tab, in the Drawing group, click Shapes, and then under Rectangles click Rounded Rectangle (second option from the left). On the slide, drag to draw a rounded rectangle.Select the rectangle. Drag the yellow diamond adjustment handle to the left to decrease the amount of rounding on the corners. With the rounded rectangle still selected, under Drawing Tools, on the Format tab, in the Size group, do the following:In the Shape Height box, enter 3.5”.In the Shape Width box, enter 0.25”.Under Drawing Tools, on the Format tab, in the bottom right corner of the Shape Styles group, click the Format Shape dialog box launcher. In the Format Shape dialog box, click Fill in the left pane. In the Fill pane, select Solid fill, click the button next to Color, and then under Theme Colors click White, Background 1, Darker 15% (third row, first option from the left).Also in the Format Shape dialog box, click Line Color in the left pane. In the Line Color pane, select No line. Also in the Format Shape dialog box, click Shadow in the left pane. In the Shadow pane, click the button next to Presets, under Outer select Offset Bottom (first row, second option from the left), and then do the following:In the Transparency box, enter 0%.In the Sizebox, enter 100%.In the Blur box, enter 8.5 pt.In the Angle box, enter 90°.In the Distance box, enter 1 pt.Also in the Format Shape dialog box, click 3-D Format in the left pane. In the 3-D Format tab, do the following:Under Bevel, click the button next to Top, and then under Bevel click Circle (first row, first option from the left). Next to Top, in the Width box, enter 5 pt, and in the Height box, enter 5 pt.Under Surface, click the button next to Material, and then under Standard clickMatte (first row, first option from the left).Click the button next to Lighting, and then under Neutral click Soft (first row, third option from the left).On the slide, select the rounded rectangle. On the Home tab, in the Clipboard group, click the arrow to the right of Copy, and then click Duplicate.Select the duplicate rectangle. On the Home tab, in the Drawing group, do the following:Click the arrow next to Shape Fill, and then click No Fill.Click the arrow next to Shape Outline, and then click No Outline.Drag the second rectangle above the first rectangle until the lower edge overlays the top edge of the first rectangle. (Note:When the spinning animation effect is created later for these rectangles, the spin will center where the edges of the rectangles meet.)Press and hold CTRL, and then select both rectangles. On the Home tab, in the Drawing group, click Arrange, and do the following:Point to Align, and then click Align Selected Objects.Point to Align, and then click Align Center.Click Group. On the slide, drag the group until it is centered horizontally on the left edge of the slide (straddling the edge).On the Home tab, in the Drawing group, click Arrange, point to Align, and then do the following:Click Align to Slide.Click Align Middle.To reproduce the dashed arc on this slide, do the following:On the Home tab, in the Drawing group, click Shapes, and then under Basic Shapes click Arc (third row, 12th option from the left). On the slide, drag to draw an arc.Select the arc. Under Drawing Tools, on the Format tab, in the Size group, do the following:In the Shape Height box, enter 7.5”.In the Shape Width box, enter 7.5”.With the arc still selected, on the Home tab, in the Drawing group, click the arrow next to Shape Outline and then do the following:Under Theme Colors, click White, Background 1, Darker 15% (third row, first option from the left).Point to Dashes, and then click Dash (fourth option from the top).On the slide, drag the yellow diamond adjustment handle on the right side of the arc to the bottom of the arc to create a half circle.Drag the arc until the yellow diamond adjustment handles are on the left edge of the slide.With the arc still selected, on the Home tab, in the Drawing group, click the arrow under Arrange, point to Align, and then do the following:Click Align to Slide. Click Align Middle. To reproduce the half circle on this slide, do the following:On the slide, select the arc. On the Home tab, in the Clipboard group, click the arrow to the right of Copy, and then click Duplicate.Select the duplicate arc. Under Drawing Tools, on the Format tab, in the Size group, do the following:In the Shape Height box, enter 3.33”.In the Shape Width box, enter 3.33”.With the second arc still selected, under Drawing Tools, on the Format tab, in the Shape Styles group, click the arrow next to Shape Fill, and then under Theme Colors click White, Background 1, Darker 5% (second row, first option from the left).Under Drawing Tools, on the Format tab, in the Shape Styles group, click the arrow next to Shape Outline,and then click No Outline.Under Drawing Tools, on the Format tab, in the Shape Styles group, click Shape Effects, point to Shadow, and then click ShadowOptions. In the Format Shape dialog box, click Shadow in the left pane. In the Shadow pane, click the button next to Presets , under Inner click Inside Right (second row, third option from the left), and then do the following:In the Transparency box, enter 86%.In the Blur box, enter 24 pt.In the Angle box, enter 315°.In the Distance box, enter 4 pt.On the slide, drag the second arc until the yellow diamond adjustment handles are on the left edge of the slide. On the Home tab, in the Drawing group, click Arrange, and then do the following:Point to Align, and then click Align to Slide. Point to Align, and then click Align Middle. Click Send to Back.To reproduce the button shapes on this slide, do the following:On the Home tab, in the Drawing group, click Shapes, and then under Basic Shapes click Oval (first row, second option from the left). On the slide, drag to draw an oval.Select the oval. Under Drawing Tools, on the Format tab, in the Size group, do the following:In the Shape Height box, enter 0.34”.In the Shape Width box, enter 0.34”.Under Drawing Tools, on the Format tab, in the Shape Styles group, click More, and then click Light 1 Outline, Colored Fill – Olive Green, Accent 3 (third row, first option from the left).Under Drawing Tools, on the Format tab, in the bottom right corner of the Shape Styles group, click the Format Shape dialog box launcher. In the Format Shape dialog box, click Fill in the left pane. In the Fill pane, select Solid Fill. Click the button next to Color, and then under Theme Colors click Olive Green, Accent 3, Lighter 80°(second row, seventh option from the left).Also in the Format Shape dialog box, click Line Color in the left pane. In the Line Color pane, select No line. Also in the Format Shape dialog box, click Shadow in the left pane. In the Shadow pane, click the button next to Presets, under Outer click Offset Bottom (first row, second option from the left), and then do the following:In the Transparency box, enter 0%.In the Size box, enter 100%.In the Blur box, enter 8.5 pt.In the Angle box, enter 90°.In the Distance box, enter 1 pt.Also in the Format Shape dialog box, click 3-D Format in the left pane, and then do the following in the 3-D Format pane:Under Bevel, click the button next to Top, and then under Bevel click Art Deco (third row, fourth option from the left). Next to Top, in the Width box, enter 5 pt, and in the Height box, enter 5 pt.UnderContour, click the button next to Color, and then under Theme Colors click White, Background 1 (first row, first option from the left). In the Size box, enter 3.5 pt.Under Surface, click the button next to Material, and then under Standard click Matte (first row, first option from the left). Click the button next to Lighting, and then under Neutral click Soft (first row, third option from the left).On the slide, select the oval. Under Drawing Tools, on the Format tab, in the bottom right corner of the Size group, click the Size and Position dialog box launcher. In the Format Shape dialog box, click Position in the left pane, and in the Position pane, do the following to position the third and fourth ovals:In the Horizontal box, enter 2.98”.In the Vertical box, enter 1.5”.Select the oval. On the Home tab, in the Clipboard group, click the arrow under Paste, and then click Duplicate.Select the duplicate oval. Under Drawing Tools, on the Format tab, in the bottom right corner of the Size group, click the Size and Position dialog box launcher. In the Format Shape dialog box, click Position in the left pane, and in the Position pane, do the following to position the third and fourth ovals:In the Horizontal box, enter 3.52”.In the Vertical box, enter 2.98”. Repeat step 9 two more times, for a total of four ovals. Under Drawing Tools, on the Format tab, in the bottom right corner of the Size group, click the Size and Position dialog box launcher. In the Format Shape dialog box, click Position in the left pane, and in the Position pane, do the following to position the third and fourth ovals:Select the third oval on the slide, and then enter 3.52” in theHorizontal box and 4.27” in the Vertical box.Select the fourth oval on the slide, and then enter 2.99” in theHorizontal box and 5.66” in the Vertical box.To reproduce the text on this slide, do the following:On the Insert tab, in the Text group, click Text Box, and then on the slide, drag to draw the text box. Enter text in the text box and select the text. On the Home tab, in the Font group, do the following: In the Font list, select Corbel.In the Font Size list, select 22.Click the arrow next to Font Color, and then under Theme Colors click White, Background 1, Darker 50% (sixth row, first option from the left).On the Home tab, in the Paragraph group, click Align Text Left to align the text left in the text box.On the slide, drag the text box to the right of the first oval.Select the text box. On the Home tab, in the Clipboard group, click the arrow to the right of Copy, and then click Duplicate. Click in the text box and edit the text. Drag the second text box to the right of the second oval.Repeat steps 5-7 to create the third and fourth text boxes, dragging them to the right of the third and fourth ovals. To reproduce the animation effects on this slide, do the following:On the Home tab, in the Editing group, click Select, and then click Selection Pane. In the Selection and Visibility task pane, select the rectangle group. On the Animations tab, in the Advanced Animation group, click Add Animation, and then under Emphasis click Spin.Also on the Animations tab, in the Animation group, click the Effect Options dialog box launcher. In the Spin dialog box, do the following:On the Effects tab, in the Amount list, in the Custom box, enter 123°,and then press ENTER. Also in the Amount list, clickCounterclockwise.On the Timing tab, in the Duration box, select 1.00. On the Timing tab, in theStart list, selectWith Previous. On the slide, select the first oval. On the Animations tab, in the Advanced Animation group, click Add Animation, and then click More Emphasis Effects.In the Add Emphasis Effect dialog box, under Basic, click Fill Color. On the Animations tab, in the Animation group, click the Effect Options dialog box launcher. In Fill Color dialog box, the do the following:On the Effects tab, in the Fill Color list, click More Colors. In the Colors dialog box, on the Custom tab, enter values for Red:130, Green:153, Blue: 117. On the Timing tab, in the Duration box, , enter 0.50.On the Timing tab, in the Startlist, select After Previous. On the slide, select the first text box. On the Animations tab, in the Advanced Animation group, click Add Animation, and then under Entrance click Fade.Also on the Animations tab, in the Timing group, do the following:In theStart list, selectWith Previous.In the Duration box, enter 0.50. In the Selection and Visibility task pane, select the rectangle group. On the Animations tab, in the Advanced Animation group, click Add Animation, and then under Emphasis click Spin. Also on the Animations tab, in the Animation group, click the Effect Options dialog box launcher. In the Spin dialog box, do the following:On the Effects tab, in the Amount list, in the Custom box, enter 22°, and then press ENTER. Also in the Amount list, click Clockwise.On the Timing tab, in theStart list, selectOn Click. On the Timing tab, in the Duration box, enter 0.50.On the slide, select the second oval. On the Animations tab, in the Advanced Animation group, click AddAnimation, and then click More Emphasis Effects. In the Add Emphasis Effect dialog box, under Basic, click Fill Color. On the Animations tab, in the Animation group, click the Effect Options dialog box launcher. In the Fill Color dialog box, do the following:On the Effects tab, in the Fill Color list, click More Colors. In the Colors dialog box, on the Custom tab, enter values for Red:130, Green:153, Blue: 117. On the Timing tab, in the Startlist, select After Previous. On the Timing tab, in the Duration box, enter 0.50.On the slide, select the second text box. On the Animations tab, in the Advanced Animation group, click Add Animation, and then under Entrance click Fade.Also on the Animations tab, in the Timing group, do the following:In theStart list, selectWith Previous.In the Duration box, enter 0.50. On the slide, select the third oval. On the Animations tab, in the Advanced Animation group, click Add Animation, and then click More Emphasis Effects. In the Add Emphasis Effect dialog box, under Basic, click Fill Color. On the Animations tab, in the Animation group, click the Effect Options dialog box launcher. In the Fill Color dialog box, do the following:On the Effects tab, in the Fill Color list, click More Colors. In the Colors dialog box, on the Custom tab, enter values for Red:130, Green:153, Blue: 117. On the Timing tab, in the Startlist, select After Previous. On the Timing tab, in the Speedlist, select Very Fast.On the slide, select the third text box. On the Animations tab, in the Advanced Animation group, click Add Animation, and then under Entrance clickFade. Also on the Animations tab, in the Timing group, do the following:In theStart list, selectWith Previous.In the Duration box, enter 0.50.On the slide, select the fourth oval. On the Animations tab, in the Advanced Animation group, click Add Animation, and then click More Emphasis Effects. In the Add Emphasis Effect dialog box, under Basic, click Fill Color. On the Animations tab, in the Animation group, click the Effect Options dialog box launcher. In the Fill Color dialog box, do the following:On the Effects tab, in the Fill Color list, click More Colors. In the Colors dialog box, on the Custom tab, enter values for Red:130, Green:153, Blue: 117. On the Timing tab, in the Startlist, select After Previous. On the Timing tab, in the Duration box, enter 0.50.On the slide, select the fourth text box. On the Animations tab, in the Advanced Animation group, click Add Animation,and then under Entrance click Fade. On the Animations tab, in the Timing group, do the following:In theStart list, selectWith Previous.In the Duration box, enter 0:50.
Stacked blocks with text(Intermediate) To reproduce the shape effects on this slide, do the following:On the Home tab, in theSlides group, click Layout, and then click Blank.On the Home tab, in the Drawing group, click Shapes, and then under Rectangles click Rectangle (first option from the left). On the slide, drag to draw a rectangle. Under Drawing Tools, on the Format tab, in the Size group, click the Size and Position dialog box launcher. In the Format Shape dialog box, click Size in the left pane. In the Size pane, do the following:Under Size and rotate, in the Height box, enter 1.75”.In the Width box, enter 1.75”.Also in the Format Shape dialog box, click Position in the left pane. in the Positionpane, do the following:In the Horizontal box, enter 1.76”. In the From box, click Top Left Corner.In the Vertical box, enter 3.17”. In the From box, click Top Left Corner.Also in the Format Shapedialog box, click Fill in the left pane. In the Fill pane, select Solid fill, click the button next to Colors, and then clickMore Colors. In the Colors dialog box, on the Custom tab, enter values for Red: 223, Green: 96, Blue: 93.Also in the Format Shapedialog box, click Line Color in the left pane, and then select No line. Also in the Format Shapedialog box, click Shadow in the left pane, and then do the following in the Shadow pane:Click the button next to Presets, and then under Outer click Offset Diagonal Bottom Left (first row, third option from the left). In the Transparency box, enter 70%.In the Size box, enter 110%.In the Blur box, enter 28 pt. In the Angle box, enter 190°.In the Distance box, enter 20 pt. Also in the Format Shapedialog box, click 3-D Format in the left pane, and then do the following in the 3-D Format pane:Under Depth, in the Depth box, enter 130 pt. Under Surface, click the button next to Material, and then under Standard click Warm Matte (second option from the left). Click the button next to Lighting, and then under Neutral click Three Point (first row, first option from the left). Also in the Format Shapedialog box, click 3-D Rotation in the left pane. In the 3-D Rotation pane, click the button next to Presets, and then under Parallel click Isometric Top Up (first row, third option from the left). Select the rectangle. On the Home tab, in the Clipboard group, click the arrow to the right of Copy, and then click Duplicate. Select the second (duplicate) rectangle. Under Drawing Tools, on the Format tab, in the Size group, click the Size and Position dialog box launcher. In the Format Shape dialog box, click Position in the left pane. In the Positionpane, do the following:In the Horizontal box, enter 4.23”. In the From box, click Top Left Corner.In the Vertical box, enter 3.17”. In the From box, click Top Left Corner. Also in the Format Shape dialog box, click Fill in the left pane. In the Fill pane, select Solid fill, click the button next to Color, and then click More Colors. In the Colors dialog box, on the Custom tab, enter values for Red: 247, Green: 154, and Blue: 91.Select the second rectangle. On the Home tab, in the Clipboard group, click the arrow to the right of Copy, and then click Duplicate. Select the third rectangle. Under Drawing Tools, on the Format tab, in the Size group, click the Size and Position dialog box launcher. In the Format Shape dialog box, click Position in the left pane. In the Positionpane, do the following:In the Horizontal box, enter 3”. In the From box, click Top Left Corner.In the Vertical box, enter 1”. In the From box, click Top Left Corner.Also in the Format Shape dialog box, click Fill in the left pane. In the Fill pane, select Solid fill, click the button next to Color, and then click More Colors. In the Colors dialog box, on the Custom tab, enter values for Red: 93, Green: 199, and Blue: 217.Also in the Format Shape dialog box, click Shadow in the left pane. In the Shadow pane, click the button next to Presets, and then click No Shadow. To add text to this slide, do the following: On the Insert tab, in the Text group, click Text Box. Enter text in the text box, select the text, and then on the Home tab, in the Font group, select Franklin Gothic Medium Cond from the Font list and then select 40 from the Font Size list.On the Home tab, in the Paragraph group, click Center to center the text in the text box.Select the text box. Under Drawing Tools, on the Format tab, in the WordArt Styles group, click the FormatTextEffects dialog box launcher. In the FormatTextEffects dialog box, click Text Fill in the left pane. In the Text Fill pane, select Solid fill, click the button next to Color, and then under Theme Colors click Black, Text 1 (first row, second option from the left).Also in the FormatTextEffects dialog box, click Text Box in the left pane. In the Text Box pane, under Text layout, in the Text direction list, select Rotate all text 90°.Also in the FormatTextEffects dialog box, click 3-D Rotation in the left pane. In the 3-D Rotation pane, click the button next to Presets, and then under Parallel click Isometric Top Up (first row, third option from the left). Under Drawing Tools, on the Format tab, in the bottom right corner of the Size group, click the Size and Position dialog box launcher. In the Format Shape dialog box, click Position in the left pane. In the Positionpane, do the following:In the Horizontal box, enter 2.21”.In the Vertical box, enter 3.35”.Drag the square blue adjustment handles on the top and bottom of the text box to adjust the height so that the text is centered on the top face of the red cube. Select the text box. On the Home tab, in the Clipboard group, click the arrow to the right of Copy, and then click Duplicate. Click in the second text box and edit the text.Select the second text box. Under Drawing Tools, on the Format tab, in the WordArt Styles group, click the FormatTextEffects dialog box launcher. In the FormatTextEffects dialog box, click Text Box in the left pane. In the Text Box pane, under Text layout, in the Text direction list, select Horizontal.Also in the FormatTextEffects dialog box, click 3-D Rotation in the left pane. In the 3-D Rotation pane, click the button next to Presets, and then under Parallel click Isometric Left Down (first row, first option from the left). Under Drawing Tools, on the Format tab, in the bottom right corner of the Size group, click the Size and Position dialog box launcher. In the Format Shape dialog box, click Position in the left pane. In the Positionpane, do the following:In the Horizontal box, enter 3.75”.In the Vertical box, enter 4.77”.Drag the square blue adjustment handles on the left and right of the second text box to adjust the width so that the text is centered on the bottom left face of the orange cube. Select the second text box. On the Home tab, in the Clipboard group, click the arrow to the right of Copy, and then click Duplicate. Click in the third text box and edit the text.Select the third text box. Under Drawing Tools, on the Format tab, in the WordArt Styles group, click the FormatTextEffects dialog box launcher. In the FormatTextEffects dialog box, click 3-D Rotation in the left pane. In the 3-D Rotation pane, click the button next to Presets, and then under Parallel click Isometric Right Up (first row, second option from the left). Under Drawing Tools, on the Format tab, in the Size group, click the Size and Position dialog box launcher. In the Size and Position dialog box, on the Positiontab, do the following:In the Horizontal box, enter 3.81”.In the Vertical box, enter 2.59”. Drag the square blue adjustment handles on the left and right of the third text box to adjust the width so that the text is centered on the bottom right face of the blue cube. To reproduce the background effects on this slide, do the following:On the Design tab, in the Background group, click Background Styles, and then click Format Background. In the Format Background dialog box, click Fill in the left pane, select Gradient fill in the Fill pane, and then do the following:In the Type list, select Radial.Click the button next to Direction, and then click From Center (third option from the left).Under Gradient stops, click Add gradient stops or Remove gradient stops until two stops appear in the slider.Also under Gradient stops, customize the gradient stops as follows:Select the first stop in the slider, and then do the following: In the Position box, enter 0%.Click the button next to Color, and then under Theme Colors click White, Background 1 (first row, first option from the left).In the Transparency box, enter 0%. Select the next stop in the slider, and then do the following: In the Position box, enter 100%.Click the button next to Color, and then under Theme Colors click White, Background 1, Darker 35% (fifth row, first option from the left).In the Transparency box, enter 0%.