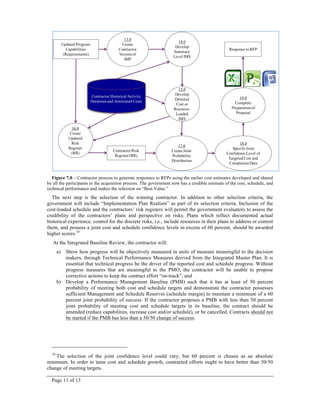
Delivering programs with less capability than promised, while exceeding the cost and planned durations, distorts decision making, contributes to increasing cost growth to other programs, undermines the Federal government’s credibility with taxpayers and contributes to the public’s negative support for these programs.
Many reasons have been hypothesized and documented for cost and schedule growth. The authors review some of these reasons, and propose that government and contractors use the historical variability of the past programs to establish cost and schedule estimates at the outset and periodically update these estimates with up-to-date risks, to increase the probability of program success. For this to happen, the authors recommend changes to estimating, acquisition and contracting processes.
The notion of integrating cost, schedule, technical performance, and risk is possible in theory. In practice care is needed to assure credible information is provided to the Program Manager.
Root cause analysis of why many DOD programs fail to deliver required capabilities within the planned time and budget has shown causes for failure begin with the buyer not knowing what “done looks like” before releasing the Request for Proposal (RFP). These are corrected with better guidance for preparing Measures of Effectiveness, Measures of Performance, and Key Performance Parameters in the RFP.
Getting To Done - A Master Class WorkshopGlen Alleman
The Principles, Processes, Practices, and Tools to Increase the Probability of successfully completing Project's On-Tiem, On-Budget, and Needed Capabilities
From WBS to Integrated Master ScheduleGlen Alleman
A step by step guide to increasing the Probability of Program success starting with the WBS, developing the Integrated Master Plan and Integrated Master Schedule, risk adjusting the IMS, and measuring progress to plan in units of measure meaningful to the decision makers.
Showing how to Increase the Probability of Project Success by applying the ...Glen Alleman
All projects ‒ Traditional and Agile ‒ operate in the presence of uncertainty that creates risk.
Five Immutable Principles and their supporting Processes and Practices can be used to increase the probability of success in the presence of these uncertainties.
IMP & WBS - Getting Both Right is ParamountGlen Alleman
WBS is the starting point for program success. It tells us what DONE looks like in terms of deliverables.
Integrated Master Plan (IMP) tells us how the increasing maturity of the deliverables will be assessed at each Program Event.
Integrated Master Schedule (IMS) tells us the order of the Work Packages needed to produce this increasing maturity.
Control Account Plan (CAP) defines the authorized scope, budget, and period of performance for the work that produces the deliverables defined in the WBS, assessed in the IMP, and sequenced in the IMS.
Capabilities‒Based Planning the capabilities needed to accomplish a mission or fulfill a business strategy
Only when capabilities are defined can we start with requirements elicitation
Establishing schedule margin using monte carlo simulation Glen Alleman
The first order goal is to develop a resource loaded, risk tolerant, Integrated Master Schedule, derived from the Integrated Master Plan that clearly shows the increasing maturity of the program's deliverables, through vertical and horizontal traceability to the program's requirements.
The management of risk is a critical success factor of any project or program. This document is a collection of risk management categories that are used to ask the question “did you think about this risk and its impact on our probability of success?”
Cost and schedule growth for complex projects is created when unrealistic technical performance expectations, unrealistic cost and schedule estimates, inadequate risk assessments, unanticipated technical issues, and poorly performed and ineffective risk management, contribute to project technical and programmatic shortfalls
Earned Value Management Meets Big DataGlen Alleman
The Earned Value Management System (EVMS) maintains period–by–period data in its underlying databases. The contents of the Earned Value repository can be considered BIG DATA, characterized by three attributes – 1) Volume: Large amounts of data; 2) Variety: data comes from different sources, including traditional data bases, documents, and complex records; 3) Velocity: the content is continually being updated by absorbing other data collections, through previously archived data, and through streamed data from external sources.
With this time series information in the repository, analysis of trends, cost and schedule forecasts, and confidence levels of these performance estimates can be calculated using statistical analysis techniques enabled by the Autoregressive Integrated Moving Average (ARIMA) algorithm provided by the R programming system. ARIMA provides a statistically informed Estimate At Completion (EAC) and Estimate to Complete (ETC) to the program in ways not available using standard EVM calculations. Using ARIMA reveals underlying trends not available through standard EVM reporting calculations.
With ARIMA in place and additional data from risk, technical performance and the Work Breakdown Structure, Principal Component Analysis can be used to identify the drivers of unanticipated EAC.
Starting with the development of a Rough Order of Magnitude (ROM) estimate of work and duration, creating the Product Roadmap and Release Plan, the Product and Sprint Backlogs, executing and statusing the Sprint, and informing the Earned Value Management Systems, using Physical Percent Complete of progress to plan.
Establishing the Performance Measurement BaselineGlen Alleman
The Performance Measurement Baseline is a time-phased schedule of all work to be performed, the budgeted cost for this work, and the organizational elements that produce the deliverables from this work.
Increasing the probability of program successGlen Alleman
Program Success starts and end with Process. Along the way, people and tools are needed, but process is the foundation of program success. These processes start with the Concept of Operations, describing what Capabilities are needed by the stakeholder to accomplish the mission of the program. Assessment of progress to plan must be made in units of measure meaningful to the decision makers. Measures of Effectiveness are defined by the Government. Measures of Performance and Technical Performance Measures are defined by Industry.
Avoid software project horror stories - check the reality value of the estima...Harold van Heeringen
Many large software projects turn into software horror stories, resulting in newspaper headlines and even political issues. Often, the project costs and schedule were estimated unrealistically optimistic, using immature estimation techniques. A relatively simple way to avoid many problems is to perform a reality check on the estimate. This presentation was given on the conference of the International Cost Estimating and Analysis Association (ICEAA2014), June 2014 (Denver, USA)
Slides as given for the Feb. 12, 2014 talk at Bay Area Software Testers.
(btw, I failed to give credit for the "Stand Back!" t-shirt image, it was from the XKCD T-shirt here: http://store-xkcd-com.myshopify.com/products/try-science)
Also forgot reference to the paper on Fibonacci numbers in planning poker affecting estimates: http://simula.no/publications/Simula.simula.1282/simula_pdf_file
When we hear that a proposed process, tool, method or any ideas is all about "risk management," check to see if it covers these areas. If not, the suggestion is not really about risk management.
The use of an architecture–centered development process for delivering information technology began with the introduction of client / server based systems. Early client/server and legacy mainframe applications did not provide the architectural flexibility needed to meet the changing business requirements of the modern manufacturing organization. With the introduction of Object Oriented systems, the need for an architecture–centered process became a critical success factor. Object reuse, layered system components, data abstraction,
web based user interfaces, CORBA, and rapid development and deployment processes all provide economic
incentives for object technologies. However, adopting the latest object oriented technology, without an adequate understanding of how this technology fits a specific architecture, risks the creation of an instant legacy
system.
Una pequeña reflexión sobre diferentes maneras de evitar que los perros manchen la calle con sus necesidades. Nos encontramos desde avisos procedentes de las autoridades, tanto apelando a la ley como premiando actitudes positivas, hasta carteles hechos por particulares.
We have lots data. Let’s use it create more credible estimates to help tame the growth beast. In spite the estimating community’s efforts to provide credible estimates, government programs still seem to deliver less than promised, cost more than planned, and take longer than needed. When estimates are consistently biased low:
- Decisions of choice are distorted
- Cost growth causes more growth as programs are stretched out to fund portfolios with fixed budgets
- Taxpayers become more cynical and negative about government
- The estimating community’s credibility is seriously questioned
The Impedance Mismatch in Integrated Engineering Design Systems is an issue in the Integration of commercial off the shelf (COTS) components.
This issue is a member of the Impedance Mismatch
problems found when commercial off the shelf
components are assembled into systems.
This mismatch occurs when event, control sequence,
or data semantics of two or more participating application
domains are mismatched.
During the system integration process the impedance
mismatch must be addressed through some means,
either through an integration layer which hides the
mismatch or through an integrating service, such as
CORBA, which facilitates the impedance adaptation
between the applications.
PM Chapter on Agile IT Project Management MethodsGlen Alleman
The nations prosperity depends of information technology (IT) software. The nation’s IT software industry depends on the timely delivery of high quality products to eager customers. This industry is slipping further behind in quality and timely delivery every year. The gap continues to grow.
A Possible Cure for Unanticipated EAC GrowthGlen Alleman
Delivering programs with less capability than promised, while exceeding the cost and planned durations, distorts decision making, contributes to increasing cost growth to other programs, undermines the Federal government’s credibility with taxpayers and contributes to the public’s negative support for these programs.
Many reasons have been hypothesized and documented for cost and schedule growth. The authors review some of these reasons, and propose that government and contractors use the historical variability of the past programs to establish cost and schedule estimates at the outset and periodically update these estimates with up-to-date risks, to increase the probability of program success. For this to happen, the authors recommend changes to estimating, acquisition and contracting processes.
In December 2015, the UK’s National Audit Office reported that one-third of UK government projects were either unachievable or in-doubt. This would have come as a great surprise to most commentators, in particular that two-thirds of the projects were forecast to be on track! It is not immediately clear from the report on what basis these projects are secure about their on-time delivery. How can a project forecast with confidence that it will deliver on time?
Does Better Scheduling Drive Execution Success?Acumen
This white paper outlines the statistics that support the relationship between better schedules and better execution. Based on an ongoing research study conducted by Acumen, this paper is the hard proof of a need for better planning across all industries.
Why Scheduling Mustn't Be Allowed to Become an Extinct ScienceAcumen
This paper discusses why the emerging 14 Point Schedule Assessment, developed by the Defense Contract Management Agency (DCMA), is fast becoming an established standard within the scheduling community across multiple industries.
www.projectacumen.com
@projectacumen
Evaluating planning strategies for prioritizing projects in suBetseyCalderon89
Evaluating planning strategies for prioritizing projects in sustainability
improvement programs
Amir R. Hessamia , Vahid Faghihib , Amy Kimc and David N. Fordb
aDepartment of Civil and Architectural Engineering, Texas A&M University–Kingsville, Kingsville, USA; bZachry Department of Civil
Engineering, Texas A&M University, College Station, USA; cDepartment of Civil and Environmental Engineering, University of
Washington, Seattle, USA
ABSTRACT
Programs to improve the sustainability of building infrastructures often consist of project portfolios
that need to be prioritized in an appropriate chronological fashion to maximize the program’s
benefits. This is particularly important when a revolving-fund approach is used to leverage savings
from the initial projects to pay for later improvements. The success of the revolving-fund approach
is dependent on the appropriate prioritization of projects. Competing performance measures and
scarce resources make this task of project prioritization during the planning stage a complex and
challenging endeavour. The current study examined the impact of different project prioritization
strategies for revolving-fund sustainability program performance. A novel modeling approach for
sustainability decision-analysis was developed using the system dynamics method, and the model
was calibrated using a campus sustainability improvement program at a major university. The
model was applied to evaluate the effects of five common project-prioritization strategies on three
program-performance measures, across a wide range of initial investment levels. For the university
case study, we found that the strategy of prioritizing projects according to decreasing benefit/cost
ratio performed best. The research demonstrated that using a system dynamics model can allow
sustainability program managers to make better-informed sequencing decisions, leading to a
financially and environmentally successful program implementations.
ARTICLE HISTORY
Received 15 August 2018
Accepted 11 April 2019
KEYWORDS
Project prioritization; system
dynamics; sustainability
improvement; revolving
fund; energy efficiency
Introduction
The development of sustainable infrastructure is of vital
concern in a world of limited resources. Currently, in the
United States, the residential and commercial sectors
account for about 40% of the country’s total consumed
energy (U.S. Energy Information Administration 2016).
Meanwhile, electricity generation, the industrial sector,
and the residential sector generate over 45% of the
country’s CO2 emissions (U.S. Environmental Protection
Agency 2016a). Reducing energy consumption in these
sectors through sustainability improvement programs
can provide great benefits – both in the form of imme-
diate monetary savings for owners and in the overall
context of a better living environment for the public.
A large amount of existing infrastructure was built
prior to the adoption of current sustainability design
and construct ...
Planning projects usually starts with tasks and milestones. The planner gathers this information from the participants – customers, engineers, subject matter experts. This information is usually arranged in the form of activities and milestones. PMBOK defines “project time management” in this manner. The activities are then sequenced according to the projects needs and mandatory dependencies.
Increasing the Probability of Project SuccessGlen Alleman
Risk Management is essential for development and production programs. Information about key cost, performance and schedule attributes are often uncertain or unknown until late in the program.
Risk issues that can be identified early in the program, which may potentially impact the program, termed Known Unknowns, can be alleviated with good risk management. -- Effective Risk Management 2nd Edition, Page 1, Edmund Conrow, American Institute of Aeronautics and Astronautics, 2003
From Principles to Strategies for Systems EngineeringGlen Alleman
From Principles to Strategies How to apply Principles, Practices, and Processes of Systems Engineering to solve complex technical, operational,
and organizational problems
Building a Credible Performance Measurement BaselineGlen Alleman
Establishing a credible Performance Measurement Baseline, with a risk adjusted Integrated Master Plan and Integrated Master Schedule, starts with the WBS and connects Technical Measures of progress to Earned Value
Program Management Office Lean Software Development and Six SigmaGlen Alleman
Successfully combining a PMO, Agile, and Lean / 6 starts with understanding what benefit each paradigm brings to the table. Architecting a solution for the enterprise requires assembling a “Systems” with processes, people, and principles – all sharing the goal of business improvement.
This resource document describes the Program Governance Road map for product development, deployment, and sustainment of products and services in compliance with CMS guidance, ITIL IT management, CMMI best practices, and other guidance to assure high quality software is deployed for sustained operational success in mission critical domains.
Increasing the Probability of Project Success with Five Principles and PracticesGlen Alleman
There are many approaches to managing projects in every domain.
This seminar lays the foundations for increasing the probability of project success, no matter the domain, what technology, what approach to delivering the outcomes of the project.
The principles of this approach are immutable.
The practices for implementing the principles are universally applicable.
Each chart in this presentation, contains guidance that can be applied to your project, no matter the domain.
In our short hour here, we’re going to cover a lot of material.
The bibliography contains the supporting materials we can tailor to your individual project
Seven Habits of a Highly Effective agile project managerGlen Alleman
Recent neurological studies indicate that the role of emotion in human cognition is essential; emotions are not a luxury. Instead, emotions play a critical role in rational decision–making, in perception, in human interaction, and in human intelligence. Habits are the intersection of knowledge, skill, and desire.
The 5 Immutable principles of project managementGlen Alleman
Software development methods are sometimes confused with Project Management principles. There are 5 irreducible principles used to manage projects, no matter the domain or context. We need to assure our development work is guided by these 5 Project Management principles.
UiPath Test Automation using UiPath Test Suite series, part 3DianaGray10
Welcome to UiPath Test Automation using UiPath Test Suite series part 3. In this session, we will cover desktop automation along with UI automation.
Topics covered:
UI automation Introduction,
UI automation Sample
Desktop automation flow
Pradeep Chinnala, Senior Consultant Automation Developer @WonderBotz and UiPath MVP
Deepak Rai, Automation Practice Lead, Boundaryless Group and UiPath MVP
Connector Corner: Automate dynamic content and events by pushing a buttonDianaGray10
Here is something new! In our next Connector Corner webinar, we will demonstrate how you can use a single workflow to:
Create a campaign using Mailchimp with merge tags/fields
Send an interactive Slack channel message (using buttons)
Have the message received by managers and peers along with a test email for review
But there’s more:
In a second workflow supporting the same use case, you’ll see:
Your campaign sent to target colleagues for approval
If the “Approve” button is clicked, a Jira/Zendesk ticket is created for the marketing design team
But—if the “Reject” button is pushed, colleagues will be alerted via Slack message
Join us to learn more about this new, human-in-the-loop capability, brought to you by Integration Service connectors.
And...
Speakers:
Akshay Agnihotri, Product Manager
Charlie Greenberg, Host
Neuro-symbolic is not enough, we need neuro-*semantic*Frank van Harmelen
Neuro-symbolic (NeSy) AI is on the rise. However, simply machine learning on just any symbolic structure is not sufficient to really harvest the gains of NeSy. These will only be gained when the symbolic structures have an actual semantics. I give an operational definition of semantics as “predictable inference”.
All of this illustrated with link prediction over knowledge graphs, but the argument is general.
Software Delivery At the Speed of AI: Inflectra Invests In AI-Powered QualityInflectra
In this insightful webinar, Inflectra explores how artificial intelligence (AI) is transforming software development and testing. Discover how AI-powered tools are revolutionizing every stage of the software development lifecycle (SDLC), from design and prototyping to testing, deployment, and monitoring.
Learn about:
• The Future of Testing: How AI is shifting testing towards verification, analysis, and higher-level skills, while reducing repetitive tasks.
• Test Automation: How AI-powered test case generation, optimization, and self-healing tests are making testing more efficient and effective.
• Visual Testing: Explore the emerging capabilities of AI in visual testing and how it's set to revolutionize UI verification.
• Inflectra's AI Solutions: See demonstrations of Inflectra's cutting-edge AI tools like the ChatGPT plugin and Azure Open AI platform, designed to streamline your testing process.
Whether you're a developer, tester, or QA professional, this webinar will give you valuable insights into how AI is shaping the future of software delivery.
GDG Cloud Southlake #33: Boule & Rebala: Effective AppSec in SDLC using Deplo...James Anderson
Effective Application Security in Software Delivery lifecycle using Deployment Firewall and DBOM
The modern software delivery process (or the CI/CD process) includes many tools, distributed teams, open-source code, and cloud platforms. Constant focus on speed to release software to market, along with the traditional slow and manual security checks has caused gaps in continuous security as an important piece in the software supply chain. Today organizations feel more susceptible to external and internal cyber threats due to the vast attack surface in their applications supply chain and the lack of end-to-end governance and risk management.
The software team must secure its software delivery process to avoid vulnerability and security breaches. This needs to be achieved with existing tool chains and without extensive rework of the delivery processes. This talk will present strategies and techniques for providing visibility into the true risk of the existing vulnerabilities, preventing the introduction of security issues in the software, resolving vulnerabilities in production environments quickly, and capturing the deployment bill of materials (DBOM).
Speakers:
Bob Boule
Robert Boule is a technology enthusiast with PASSION for technology and making things work along with a knack for helping others understand how things work. He comes with around 20 years of solution engineering experience in application security, software continuous delivery, and SaaS platforms. He is known for his dynamic presentations in CI/CD and application security integrated in software delivery lifecycle.
Gopinath Rebala
Gopinath Rebala is the CTO of OpsMx, where he has overall responsibility for the machine learning and data processing architectures for Secure Software Delivery. Gopi also has a strong connection with our customers, leading design and architecture for strategic implementations. Gopi is a frequent speaker and well-known leader in continuous delivery and integrating security into software delivery.
Slack (or Teams) Automation for Bonterra Impact Management (fka Social Soluti...Jeffrey Haguewood
Sidekick Solutions uses Bonterra Impact Management (fka Social Solutions Apricot) and automation solutions to integrate data for business workflows.
We believe integration and automation are essential to user experience and the promise of efficient work through technology. Automation is the critical ingredient to realizing that full vision. We develop integration products and services for Bonterra Case Management software to support the deployment of automations for a variety of use cases.
This video focuses on the notifications, alerts, and approval requests using Slack for Bonterra Impact Management. The solutions covered in this webinar can also be deployed for Microsoft Teams.
Interested in deploying notification automations for Bonterra Impact Management? Contact us at sales@sidekicksolutionsllc.com to discuss next steps.
Kubernetes & AI - Beauty and the Beast !?! @KCD Istanbul 2024Tobias Schneck
As AI technology is pushing into IT I was wondering myself, as an “infrastructure container kubernetes guy”, how get this fancy AI technology get managed from an infrastructure operational view? Is it possible to apply our lovely cloud native principals as well? What benefit’s both technologies could bring to each other?
Let me take this questions and provide you a short journey through existing deployment models and use cases for AI software. On practical examples, we discuss what cloud/on-premise strategy we may need for applying it to our own infrastructure to get it to work from an enterprise perspective. I want to give an overview about infrastructure requirements and technologies, what could be beneficial or limiting your AI use cases in an enterprise environment. An interactive Demo will give you some insides, what approaches I got already working for real.
DevOps and Testing slides at DASA ConnectKari Kakkonen
My and Rik Marselis slides at 30.5.2024 DASA Connect conference. We discuss about what is testing, then what is agile testing and finally what is Testing in DevOps. Finally we had lovely workshop with the participants trying to find out different ways to think about quality and testing in different parts of the DevOps infinity loop.
Key Trends Shaping the Future of Infrastructure.pdfCheryl Hung
Keynote at DIGIT West Expo, Glasgow on 29 May 2024.
Cheryl Hung, ochery.com
Sr Director, Infrastructure Ecosystem, Arm.
The key trends across hardware, cloud and open-source; exploring how these areas are likely to mature and develop over the short and long-term, and then considering how organisations can position themselves to adapt and thrive.
Unsubscribed: Combat Subscription Fatigue With a Membership Mentality by Head...
Cure for cost and schedule growth
1. Page 1 of 13
A Cure For Unanticipated Cost and Schedule Growth
Thomas J. Coonce
Thomas J. Coonce, LLC
tom.coonce@verizon.net
+1 703 362 2568
Glen B. Alleman
Niwot Ridge LLC
glen.alleman@niwotridge.com
+1 303 241 9633
ABSTRACT
Delivering programs with less capability than promised, while exceeding the cost and planned durations,
distorts decision making, contributes to increasing cost growth to other programs, undermines the Federal
government’s credibility with taxpayers and contributes to the public’s negative support for these
programs.
Many reasons have been hypothesized and documented for cost and schedule growth. The authors
review some of these reasons, and propose that government and contractors use the historical variability of
the past programs to establish cost and schedule estimates at the outset and periodically update these
estimates with up-to-date risks, to increase the probability of program success. For this to happen, the
authors recommend changes to estimating, acquisition and contracting processes.
INTRODUCTION
Publically-funded programs have consistently delivered less than originally planned capabilities and cost
more than planned and are late. Because public funds are limited, new programs cannot be started, or
worse, they are started and then must be stretched out to fund the overruns of programs that are being
developed. In short, the entire portfolio of programs is affected when most of the programs require more
funds and take longer than planned. Funding authorizers become skeptical of new proposals because the
estimates are not deemed credible. Decisions of choice are distorted since the estimates are in error, or
worse, decision-makers know the numbers are biased low and make best guesses which result in poor
choices. Furthermore, excessive growth in public programs damages the credibility of the estimating
community and contributes to the public’s negative support for these programs.
This paper discusses the never-ending problem of cost and schedule growth in publically funded
programs and offers some recommendations to improve performance within the current Department of
Defense (DOD) acquisition environment. This paper highlights the magnitude of cost and schedule growth
within the DOD and the National Aeronautics and Space Administration (NASA) and summarizes some of
the known and hypothesized reasons for growth. The paper also summarizes some of the initiatives that
have been put in place to address estimating issues but suggests more can be done to improve them,
effectively communicate them, and set these estimates high enough to reflect the historical experience so as
to minimize or eliminate growth in future programs.
The authors recommend specific changes to the way initial estimates are created and agreed to. In
particular, this paper discusses the value of developing activity-based estimates adjusted to account for
issues that have occurred on past similar programs.
The authors propose that programs be budgeted at the 70 percent probability of meeting both cost and
schedule targets – Joint Confidence Level. 1
They show how this can be done, including active input from
the contracting community, and how contract management can be improved through the use of risk
registers and periodic probability statements about Estimates At Completion (EAC) and Estimated
Completion Dates (ECD). They also enumerate the implementation challenges, and how they can be
overcome.
1
The Joint Confidence Level connects Schedule, Cost, Risk, and Uncertainty in a single assessment of the probability
of program success, http://www.nasa.gov/pdf/724371main_76646-Risk_Analysis_Brochure-Final6.pdf
2. Page 2 of 13
COST AND SCHEDULE GROWTH – A PERSISTENT PROBLEM THROUGH THE DECADES
“In 1982, an unnamed witness at a House Armed Services Committee stated, ‘enough material has been
written on the subject of cost growth during the last ten years to fill a Minuteman silo. Unfortunately, cost
growth is still with us. In a decade since that testimony enough additional information on cost growth has
been written to fill a second minuteman silo.” 2
Table 1 summarizes cost growth associated with NASA and DOD research programs. 3
Although this
information is somewhat dated, the growth trend has not been materially reduced since the time this study
was completed. Figure 1.0 below illustrates the cost and schedule growth of 30 NASA missions that were
developed in the 2007 – 2009 time frame. 4
Table 1.0. Cost Growth Experience, 2004 NASA Study showing increasing growth over the decades in spite of all
efforts to control this growth through improved insight and management processes.
Figure 1.0 – Cost and Schedule Growth of 30 NASA Missions, 2007 - 2009
2
Cost Growth in DOD Major Programs: A Historical Perspective, Col. Harry Calcutt, April 1993,
http://www.dtic.mil/dtic/tr/fulltext/u2/a276950.pdf
3
Unpublished 2004 NASA study performed by Drs Joseph Hamaker and Mathew Schaffer.
4
Unpublished 2009 NASA study
42%
29%
21%
0%
10%
20%
30%
40%
50%
60%
From
Phase B
Start
From
PDR
From
CDR
DevelopmentCostGrowth
29%
23%
19%
0%
10%
20%
30%
40%
50%
60%
From
Phase B
Start
From
PDR
From
CDR
PhaseB/C/DScheduleGrowth
Average Median
NASA in the 90s 36% 26% 78%
NASA in the 70s 43% 26% 75%
NASA in the 80s (GAO) 83% 60% 89%
DoD RDT&E 45% 27% 76%
Cost/Budget Growth
Study
Percent of Projects
Which Experienced
3. Page 3 of 13
Reasons for Cost and Schedule Growth
As stated earlier, volumes have been written about programs failing to provide promised capabilities at
the agreed cost and projected completion dates. Most of these studies attempted to categorize the root
causes, so corrective actions could be taken. Some of the causes are related to estimating and acquisition
initiation activities while others focused on issues associated with management and / or contract execution.
One of the more comprehensive studies was performed by Colonel Harry Calcutt in 1993. 5
Following are
Col. Calcutt’s reasons for growth organized into five categories.
• Requirements:
o Poor initial requirement definition
o Poor performance/cost trade-off during development
o Changes in quantity requirements
• Estimating:
o Errors due to limitation is estimating procedures
o Failure to understand and account for technical risks
o Poor inflation estimates
o Top down pressure to reduce estimates
o Lack of valid independent cost estimates
• Program Management:
o Lack of program management expertise
o Mismanagement/human error
o Over optimism
o Schedule concurrency
o Program stretch outs to keep production lines open
• Contracting:
o Lack of competition
o Contractor buy-in
o Use of wrong type of contract
o Inconsistent contract management/admin procedures
o Too much contractor oversight
o Waste
o Excess profits
o Contractors overstaffed
o Contractor indirect costs unreasonable
o Taking too long to resolve undefinitized contracts
• Budgeting:
o Funding instabilities caused by trying to fund too many programs
o Funding instabilities caused by congressional decisions
o Inefficient production rates due to stretching out programs
o Failure to fund for management reserves
o Failure to fund programs at most likely cost
5
Ibid, Calcutt, p.17
4. Page 4 of 13
A second study from DOD’s Office of Program Assessment and Root Cause Analysis (PARCA)
published a recent report, which categorized growth into two broad categories: 6
• Inception:
o Unrealistic performance expectations
o Unrealistic baseline estimates for cost or schedule
o Immature technologies or excessive manufacturing or integration risk
• Execution related
o Unanticipated design, engineering manufacturing or technology integration issues
o Changes in procurement quantities
o Inadequate program funding or funding instability
o Poor performance by government or contractor personnel
INITIATIVES TO REDUCE COST AND SCHEDULE GROWTH
Over the last five decades, the DOD, NASA, and other civilian agencies have implemented numerous
policy and regulation changes to reduce growth. This paper does not attempt to enumerate all the initiatives
nor assess their effectiveness in combating growth. However, this paper does address those initiatives
dealing with estimating and the processes used to establish and manage contractor baseline estimates.
A few of the more important initiatives to improve the ability of the cost estimating community to
produce better estimates were:
• Need for independent estimating at all levels;
• Standardized Work Breakdown Structures (WBS) for military systems e.g., MIL-STD 881, and
similar structures for NASA and the National Reconnaissance Office;
• Routine cost collection of analogous historical systems upon which to base future estimates;
• Use of a Cost Analysis Requirements Description (CARD) (or similar documents) to be used as a
basis for the estimates;
• Use of technical and program management subject matter expertise to assist in developing
estimates; and
• Policy requirements to budget to higher confidence levels (80 percent cost confidence level within
DOD and 70 percent joint cost and schedule confidence level for NASA projects).
These initiatives are believed to have helped estimators create more credible estimates. Using the actual
experience of similar past projects has been particularly useful as it helps estimators explain the basis for
their estimates and provides leadership with a reference by which to judge the proposed new systems.
However, these data are product-based (based on the systems’ WBS) and Program Management Offices
(PMOs) often think in terms of the materiel developers (contractors’) activities so they find the product-
based estimates difficult to consume, particularly when the independent estimates are higher than those the
PMO receives from one or more contractors. PMOs frequently discount the independent estimates in favor
of the contractor-developed estimates they find easier to understand.
Figure 2 depicts the traditional method in which the cost estimating community develops its estimates.
The chart shows that the cost estimate is a function of the value of the cost driving parameter as well as the
variability of the costs that have been incurred for the product in the past. The figure illustrates that the
higher the input parameter, the higher the cost, but that the estimated cost also depends on the point within
the distribution of cost values that have been incurred on past similar programs. Cost estimators prefer to
provide estimates at the mean or higher for a given WBS element. Estimates created in this way are
considered to be standard acceptable practice and result in credible estimates. However, as noted earlier,
the estimates are not always in the same language as the PMO or the contractors and thus are difficult to
consume.
6
Report to Congress on Performance Assessment and Root Cause Analyses, Office of the Under Secretary of Defense
for Acquisition, Technology and Logistics, March 2014, p. 7, http://www.acq.osd.mil/parca/docs/2014-parca-report-
to-congress.pdf
5. Page 5 of 13
Figure 2.0 – Traditional method of estimating by the WBS product or process defines the variances on the cost
estimate compared to the drivers of the cost, in this example the “weight” of the product being produced. The weight
becomes a “technical performance measure. Being outside the weight bounds will cost more for the product to be
produced.
6. Page 6 of 13
Figure 3 depicts an activity-based estimate built up using the schedule of activities and the resources
associated with the activities. This is known as a cost or resource-loaded schedule that is based upon a set
of expected activity durations and costs for the resources. This is the type of estimate that contractors
submit in response to RFPs and used to set contract baselines for reporting progress to the PMOs. When
independent WBS-based estimates are higher than those submitted by contractors, PMOs find it near
impossible to analyze where the extra cost should be added to the contractors’ activity-based estimates.
Thus, the WBS-based estimates are not as “consumable” as ones that are based on a set of generally agreed
activities.
Figure 3.0 – Sample Activity-Based Estimate derived from the Integrated Master Schedule (IMS). Costs are assigned
for each work element in the IMS, usually within a Work Package, using the WBS number to identify this unique
assignment. These costs are then “rolled” up to the Control Account and then the program at the top. These costs are
reported in DI-MGMT-81861’s IPMR Format 1.
A POSSIBLE SOLUTION TO SOLVE COST AND SCHEDULE GROWTH
While activity-based estimates are easier to explain, they still need to be credible and to do so, they too
must be informed with the variance of the activity durations and costs from similar historical programs. The
variance of the cost associated with an activity-based plan has two components – costs that vary with the
passage of time and cost that are independent of time. A good example of a cost that is time independent is
material. An example of a cost that is time dependent would be systems engineering or program
management which must be in place as long as the program is under development. Similar to the variance
in the cost of each WBS element, each activity has a variance in duration and the cost associated with those
durations (both time dependent and time independent). In the end, the cost and cost variance of a given
system that is aggregated by WBS must be the same of the cost and cost variance that is collected by
activities. This concept is depicted in Figure 4.0 below.
It should be noted that variance of cost and schedules reflect the variation that occur in the “normal”
process of developing similar programs. This is referred to as the natural uncertainty that occurs and
estimates of future programs must take this into account. Some researchers have labeled this uncertainty as
“irreducible” because a manager cannot take specific actions to reduce the “risks”; rather, the manager
must just recognize that this variation occurs as part of the normal process of development.7
The amount of
7
Irreducibility Uncertainty – a Fact of Life for Reserve Estimates, John D. Wright, SPE Annual Technical Conference
and Exhibition, 5-8 October, Denver, Colorado, Society of Petroleum Engineers, 2003.
7. Page 7 of 13
uncertainty that “should” be included has been discussed within the community within the past ten years.
The Weapon Systems Acquisition Reform Act of 2009 specified that all major programs within DOD
should be budgeted at the 80 percent cost confidence level. That policy for the DOD was recently rescinded
in favor of point estimates that reflect “… a confidence level such that it provides a high degree of
confidence that the program can be completed without the need for significant adjustment to program
budgets.”8
NASA requires all programs to be budgeted such that the programs possess a 70 percent
probability of achieving both cost and schedule targets. Assuming cost and schedule are independent,
identically statistical distributions, this implies an 84 percent confidence level for cost separately.
Figure 4.0 – Cost Distributions Are The Same Regardless of Estimating Technique
Some have advocated that estimates just need to be conservative. Others have argued that probabilistic
estimating should not be done at all since the historical data are scant and therefore, assessed values reflect
the estimator’s judgment and those could be biased and difficult to explain. Yet still others have advocated
budgeting programs a high confidence levels (above 80 percent) and perhaps raise it higher if the growth is
not contained. Still others have advocated that budgeting programs at high confidence levels is inefficient
as certain programs will be over-budgeted and other worthy programs will not be started. Others have
argued that high confidence levels will only result in higher costs over time as program managers will
expand requirements to use up any funds that appeared to be in excess of those required.
The authors assert that it is not possible to predict in advance which of these scenarios will occur unless
setting the budget at some confidence level is tried. The authors observe that the community has never
really tried budgeting programs at confidence levels that are based on well-understood historical data.
(NASA has only recently done so and it is too early to conclude whether this has had a positive impact on
cost and schedule growth). Anecdotal information suggests that some programs within the DOD have been
budgeted at a stated 50% confidence level, yet experienced rather significant over runs in costs and
Innovative Design Manufacturing Research Center (IdMRC) – Cost Modeling, 24th
International Forum on
COCOMO – November 2009.
A Framework for Considering Uncertainty in Quantitative Life Cycle Cost Estimation, Proceedings of the ASME
2009 Design Engineering Technical Conferences & Computers and Information Engineering Conference,
IDETC/CIE 2009,
8
FY2011 Annual Report on Cost Assessment Activities, Director, Cost Assessment and Program Evaluation (CAPE),
February 2012, p.7-8.
8. Page 8 of 13
completion dates in excess of plan. The authors take the position that programs should be budgeted at a
higher confidence level (above 80 percent for cost and schedule separately) using agreed to historical data
and then observe if this controls the unanticipated growth.
IMPLEMENTATION DETAILS
Setting the budgets at a high confidence level will necessitate modifications in estimating methods
(noted above), the contracting process, and implementation. These are described below.
The first step requires that government program offices (PMOs) take a more active role in clarifying
requirements, and developing the top-level plan (cost-loaded schedule) with an associated statement about
the probability of success (technical, cost and schedule). This top-level plan ought to form the basis for the
first draft of the annual resources required. The second major step involves getting feedback from the
contracting community concerning the probability of delivering program capabilities for the targeted cost
and delivery date. The government will do this by issuing a Request for Information (RFI). PMOs will then
analyze industry’s feedback, modify the requirements, budget or time (or all three) and then issue a Request
for Proposal (RFP). And finally, along with their technical approach, contractors will submit their cost-
loaded plans, risk registers, and probability statements in response to RFPs.
The processes to complete the first major step – development of the RFI – are depicted in Figure 5.0
below and described in the following paragraphs.
Figure 5.0 – Develop draft plan and obtain industry feedback. This feedback will confirm if the government
generated cost-phased estimate is credible from the past experience of industry. This approach is used in Japan’s
defense acquisition system. It engages the government and the providers in a dialogue in search of a phased plan that
can increase the probability of success for the program
9. Page 9 of 13
The first step in this process (1.0) is to develop an Integrated Master Plan (IMP). This is a top-level
picture of the general sequence of activities needed in order to mature the capabilities desired. This should
be developed per the Department of Defense’s (DOD’s) Integrated Master Plan and Integrated Master
Schedule Preparation and Use Guide.9
The second Step is to develop a top-level Integrated Master Schedule. This schedule is notional but
reflects the PMO’s thoughts on how the system capabilities ought to be developed. By its nature, the
schedule is high level, but still includes a logical structure of activities. It ought to reflect the PMO’s
thoughts about which activities can be performed in parallel and which must be serial. The activity
durations are based on the amount of time of similar past programs.
In Step 3, the PMO adds the resources (costs) associated with the high level schedule developed in
step 2. Ideally, the cost associated with the activities will be available from databases. However, if they are
unavailable, the PMO should estimate the costs. Some of the cost information could come from the
developed independent estimates but transformed into the number of people, labor rates and material costs.
Ideally, these discrete estimates ought to be equal to or higher than the mean of the historical data.
The forth step is to create a risk register (RR) that will be used along with the top-level cost loaded
schedule (developed in step 3) to develop cost and schedule confidence levels (step 5) for the PMO’s draft
plan. The risk register should contain, at a minimum, information about the variation of the activity
durations and associated costs from the historical database. As discussed earlier, this uncertainty represents
the “natural variation” associated with developing similar programs, i.e., the irreducible risks. The risk
register should also include the specific discrete risks that the PMO feels is unique to the program. This
uncertainty (risk) should have an associated probability of occurrence and a cost and/or schedule
consequence if it does occur.
In the fifth step, the PMO should use appropriate Monte Carlo simulation software with the Risk
Register developed in Step 4 and the top-level cost-loaded plan developed in step 3 to develop cost and
schedule confidence levels for the targeted budget and development duration.
In sixth step, the PMO adjusts cost and or program duration to achieve a “reasonable” confidence level.
The authors believe that PMO should select a targeted cost with at least a 70 percent joint cost and schedule
confidence level (above 80 percent for cost and schedule separately).
Once the RFI has been issued, contractors are expected to review and comment on the PMO’s draft plan
and answer the following questions:
1. Is the top-level plan logical given the technical challenges and capabilities required? If no,
a. What other activities should be included or dropped?
b. What changes in logic are required?
2. Are activities durations “consistent” (within family) of their experience?
3. Are the costs “consistent” (within family) of their experience?
4. Is the PMO’s perspective on risks realistic? If not,
a. Which risks are overstated?
b. Which risks are understated?
c. Which risks were missed? What is the contractor’s assessment of probabilities and
consequences for those risks? (Included in their risk register).
Contractors are expected to provide an updated high-level cost-loaded schedule, updated risk register,
and associated probability statement of achieving the desired capabilities within the desired budget and
duration. These submissions are not considered proposals; rather, they are considered inputs to the PMO on
how the contractor might proceed, along with the associated confidence levels for the stated resources.
Upon receipt of the contractors’ responses to the RFI, the PMO modifies the top-level plan and creates a
Request for Proposal (RFP) that reflects the contractors’ concerns and notional plans. This process is
depicted in Figure 6.0 below.
9
Integrated Master Plan and Integrated Master Schedule Preparation and Use Guide, October 21, 2005
10. Page 10 of 13
Figure 6.0 – The process to improve the Request for Proposals (RFP) starts with an assessment of the responses
from the Request for Information, where contractors provided their cost estimates.
In step eight, the PMO assesses the contractors’ concerns and evaluates their top-level plans, risk
registers, and confidence levels on the risk and their reduction through the handling plans. The PMO
evaluates and synthesizes the concerns expressed about the capabilities, top-level plan; the risk registers
and revises the PMO plan including the budget profile (step 9). Certain capabilities might be dropped or
revised to reduce the development risk. The PMO will re-run their Monte-Carlo simulations to determine
the confidence levels for the original budget and duration. PMOs increase the budget and/or development
period in order to achieve at least a 70 joint cost and schedule confidence level (step 11). Once this is done,
the PMO prepares and issues the RFP.
Contractors develop their responses the RFPs in the normal fashion, but will include their final risk
registers along with their implantation plans contained in a schedule model instrumented with Monte
Carlos Simulation software. The response will include probability statements about the achieving the cost
and schedule targets. This response and deliverables should be similar to the cost-loaded schedule
submitted in response to the RFI. This process is depicted in Figure 7.0 below.
8.0
Assess
Responses to
RFI
Updated Risk
Register (RR)
Updated Program Capabilities
(Requirements)
10.0
Re-create
Joint
Probability
Distribution
Updated Cost-Loaded IMS
11.0
Decide on
TargetedCost
and
Completion
Date
Multiple responses
12.0
Create
Request for
Proposal
(RFP)
9.0
Update IMP/
IMS, Risk
Register,
and/or
Modify
Rqmts
11. Page 11 of 13
Figure 7.0 – Contractor process to generate responses to RFPs using the earlier cost estimates developed and shared
by all the participants in the acquisition process. The government now has a credible estimate of the cost, schedule, and
technical performance and makes the selection on “Best Value.”
The next step is the selection of the winning contractor. In addition to other selection criteria, the
government will include “Implementation Plan Realism” as part of its selection criteria. Inclusion of the
cost-loaded schedule and the contractors’ risk registers will permit the government evaluators to assess the
credibility of the contractors’ plans and perspective on risks. Plans which reflect documented actual
historical experience, control for the discrete risks, i.e., include resources in their plans to address or control
them, and possess a joint cost and schedule confidence levels in excess of 60 percent, should be awarded
higher scores.10
At the Integrated Baseline Review, the contractor will:
a) Show how progress will be objectively measured in units of measure meaningful to the decision
makers, through Technical Performance Measures derived from the Integrated Master Plan. It is
essential that technical progress be the driver of the reported cost and schedule progress. Without
progress measures that are meaningful to the PMO, the contractor will be unable to propose
corrective actions to keep the contract effort “on-track”; and
b) Develop a Performance Management Baseline (PMB) such that it has at least of 50 percent
probability of meeting both cost and schedule targets and demonstrate the contractor possesses
sufficient Management and Schedule Reserves (schedule margin) to maintain a minimum of a 60
percent joint probability of success. If the contractor proposes a PMB with less than 50 percent
joint probability of meeting cost and schedule targets in its baseline, the contract should be
amended (reduce capabilities, increase cost and/or schedule), or be cancelled. Contracts should not
be started if the PMB has less than a 50/50 change of success.
10
The selection of the joint confidence level could vary, but 60 percent is chosen as an absolute
minimum. In order to tame cost and schedule growth, contracted efforts ought to have better than 50/50
change of meeting targets.
13.0
Create
Contractor
Versionof
IMP
14.0
Develop
Summary
Level IMS
15.0
Develop
Detailed
Cost or
Resource-
Loaded
IMS
Contractor Historical Activity
Durations and Associated Costs
17.0
Create Joint
Probability
Distribution
16.0
Create
Updated
Risk
Register
(RR)
Contractor Risk
Register (RR)
18.0
Specify Joint
Confidence Level of
Targeted Cost and
Completion Date
19.0
Complete
Preparation of
Proposal
Response to RFP
Updated Program
Capabilities
(Requirements)
12. Page 12 of 13
After the contract is awarded, the PMO and the contractor must actively manage the risks and attempt to
develop the desired capabilities while maintaining a high probability of meeting cost and schedule targets.
The PMO must do its part by holding firm on requirement changes – a well-known cause of cost and
schedule growth. The contractor must communicate progress based on the pre-approved TPMs, and
evolving risks. The contractor should submit updated plans every six months to the PMO along with his
risk register and communicate the probabilities associated with its “Best Case”, “Worst Case” and “Most
Likely” Estimates at completion and the Estimated Completion Date. These terms mean little to the PMO
or other stakeholders without associated probability statements and the drivers of cost and schedule from
the risk register content. This information should allow the contractor and PMO to focus on the future risks
and revise their plans to keep the contracts on track.
THE CHALLENGES
There are several challenges that must be addressed in order to implement these recommendations.
These are briefly discussed below.
First, the estimating community must broaden its data collection effort to capture the durations and
associated costs of common high-level development activities. Some of these data may already exist within
the native schedules contained with the Earned Value Management Central Repository (EVM-CR).
Comparison of initial and final schedules could provide useful analogies for future systems. All programs,
regardless of size, have some form of schedule and the community should make a concerted effort to
collect, store and share these data. The authors assert that the contracting communities, particularly those
involved in the construction industry, have done a better job of collecting these data and effectively using
these data, than the government.
Second, PMOs must take more active roles in creating realistic plans for their programs. As noted above,
this means PMOs must create Integrated Master Plans – the architectural document to develop the required
capabilities. They also need to assure themselves that issued RFPs possess an “achievable” outcome within
the resources available. This means that PMOs must develop a top-level cost-loaded plan and compute
probabilities for meeting the cost and schedule targets. Given limited internal resources, PMO will likely
need to obtain outside assistance to perform this function. This is an additional expense to the PMO, but
one that is easily justified.
Third, asking the contracting community for their top-level picture of probabilities in advance of the
RFP might come at a cost. Serious interested vendors will likely make the investment to develop a
summary-level plan, Risk Register, and model to calculate probabilities, but perhaps not. PMOs might have
to contract for systems engineering contracts to provide their perspectives, but cost should be minimal –
less than four staff months worth of effort, each. This will be a small price to pay to obtain FRPs that have
a higher probability of success.
Forth, the IPMR Data Item Description (DID) will need to be updated to require: a) submission of the
IMP in responses to RFPs, b) EAC and ECD probability statements in Format 5, and c) inclusion of risk
registers and instrumented schedule models every six months. Requesting the IMP within the RFP should
never be optional as it provides the architectural framework for delivering the desired capabilities. As noted
earlier, it provides the foundation for the contractors’ plans – the cost or resource loaded schedule.
Including the probability statements in Format 5 appears to be fairly straightforward and be could be
done with minimal expense, but will be of marginal value to the PMO without the accompanying schedule
model and associated risk registers. A PMO should be able to see the impact to the cost and schedule
outcomes if changes in schedule logic are made of if they have a different perspective on risks. PMOs (or
other stakeholders) should be able to independently exercise the contractors’ models. However, this
requirement could be negotiated in such a way that the contractor will merely be required to develop the
model and be ready to address PMO “what-if” questions.
13. Page 13 of 13
CONCLUSION
This paper discusses the perennial problem of cost and schedule growth in publically funded programs
and offers recommendations to improve performance within the DOD environment. This paper proposes
that programs be budgeted (with active inputs from industry partners) at a 70 percent joint cost and
schedule confidence level and that contracts be periodically reassessed to ensure high probabilities of
success.
The authors observe that few programs have been budgeted for high confidence levels and cost growth
continues. They assert that setting a relatively high probability of success is necessary to attempt to control
growth and restore credibility with authorizers and taxpayers. The authors also address a number of the
challenges to implement their recommendations and offer suggestions to overcome them.