Downloaded 302 times

![Titrasi Redoks
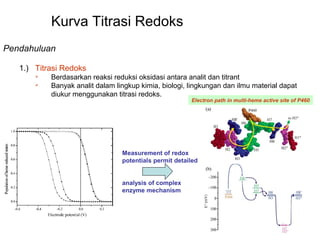
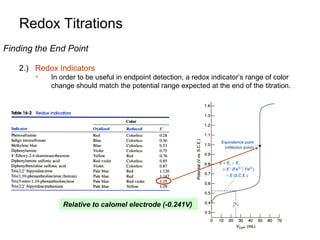
Bentuk kurva titrasi redoks
3.) Wilayah 1: sebelum TE
Use iron half-reaction relative to calomel reference electrode:
Eo = 0.68 V
[ Fe 2+ ]
E = 0.68 − 0.05916 log
[ Fe 3+ ]
](https://image.slidesharecdn.com/titrasiredoks2-131103222847-phpapp01/85/Titrasi-redoks-2-5-320.jpg)
![Redox Titrations
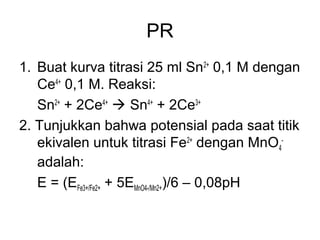
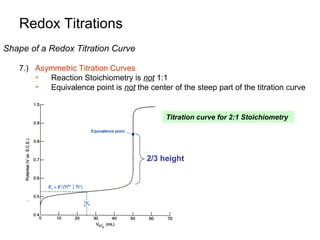
Bentuk kurva titrasi redoks
4.) Daerah 2: Pada titik ekivalen
Enough Ce4+ has been added to react with all Fe2+
-
From Reaction:
-
Primarily only Ce3+ and Fe3+ present
Tiny amounts of Ce4+ and Fe2+ from equilibrium
[Ce3+] = [Fe3+]
[Ce4+] = [Fe2+]
Both Reactions are in Equilibrium at the electrode
[ Fe 2+ ]
E+ = 0.68 − 0.05916 log
[ Fe3+ ]
[Ce 3+ ]
E+ = 1.44 − 0.05916 log
[Ce 4+ ]
](https://image.slidesharecdn.com/titrasiredoks2-131103222847-phpapp01/85/Titrasi-redoks-2-6-320.jpg)
![Redox Titrations
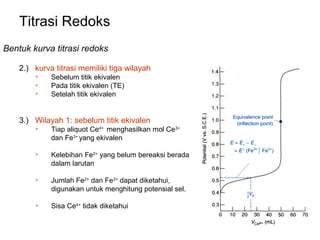
Shape of a Redox Titration Curve
4.) Region 2: At the Equivalence Point
Don’t Know the Concentration of either Fe2+ or Ce4+
Can’t solve either equation independently to determine E+
Instead Add both equations together
[ Fe 2+ ]
E+ = 0.68 − 0.05916 log
[ Fe3+ ]
[Ce 3+ ]
E+ = 1.44 − 0.05916 log
[Ce 4+ ]
Add
[ Fe 2+ ]
[Ce 3+ ]
2 E+ = 0.68 + 1.44 − 0.05916 log
[ Fe3+ ] − 0.05916 log [Ce 4+ ]
Rearrange
[ Fe 2+ ] [Ce 3+ ]
2 E+ = 2.12 − 0.05916 log
[ Fe3+ ] [Ce 4+ ]
](https://image.slidesharecdn.com/titrasiredoks2-131103222847-phpapp01/85/Titrasi-redoks-2-7-320.jpg)
![Redox Titrations
Shape of a Redox Titration Curve
4.) Region 2: At the Equivalence Point
Instead Add both equations together
[ Fe 2+ ] [Ce 3+ ]
2 E+ = 2.12 − 0.05916 log
[ Fe 3+ ] [Ce 4+ ]
[Ce 3 + ] = [ Fe 3 + ]
[Ce 4 + ] = [ Fe 2 + ]
Log term is zero
2 E+ = 2.12V ⇒ E+ = 1.06V
Equivalence-point voltage is independent of the
concentrations and volumes of the reactants](https://image.slidesharecdn.com/titrasiredoks2-131103222847-phpapp01/85/Titrasi-redoks-2-8-320.jpg)
![Redox Titrations
Shape of a Redox Titration Curve
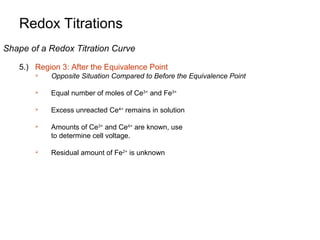
5.) Region 3: After the Equivalence Point
Use iron half-reaction relative to calomel reference electrode:
Eo = 1.44 V
[Ce 3+ ]
E = 1.44 − 0.05916 log
[Ce 4+ ]
](https://image.slidesharecdn.com/titrasiredoks2-131103222847-phpapp01/85/Titrasi-redoks-2-10-320.jpg)
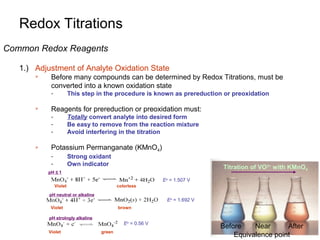

1) A sample containing La3+ was precipitated with sodium oxalate to isolate the La3+. 2) The precipitate was dissolved in acid and titrated with potassium permanganate. 3) From the volume of permanganate used and its molarity, the molarity of the original La3+ sample was calculated.


![Redox titrations [compatibility mode]](https://cdn.slidesharecdn.com/ss_thumbnails/redoxtitrationscompatibilitymode-130421132405-phpapp02-thumbnail.jpg?width=640&height=640&fit=bounds)