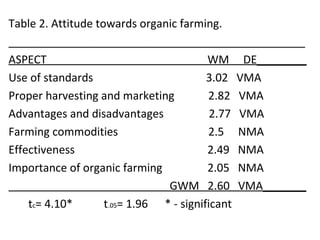
Results and Discussions
dsgarin 3/17/2015
General Steps in the Discussion of
Tables and Statistical Results
• Present summary of data from the table.
• State results of statistical computations for both
descriptive and inferential.
• State the implication(s) and attribute(s) of the
data.
• Corroborate and contrast the results of the finding
through the set of your review literature.
• Use either past or present tense. Do not
editorialize, sermonize or moralize, and campaign.
Presentation of Data
1. Arrange findings based on the statement of the
problem/objectives of the study. Have sub-titles
based on the key words of the objectives.
2. Summarize data in graphical or tabular form or with
the use of other convenient methods such as charts.
3. Introduce graphs, tables, plates and figures before
presenting them. Tables, graphs, figures or plates
that do not occupy the whole page should start or
end a page. They are never placed in between text. If
they occupy more than a page, continuation/s must
follow immediately.
4. In the textual presentation of data from tables,
figures and charts, exact repetition of figures, even
expressing them in words, should be avoided.
Guide in the textual presentation of
data from tables, figures and charts.
IN PERCENTILES IN FRACTIONS IN WORDS IN GENERAL
TERMS
10 1/10 One out of ten Few
20 1/5 One out of five Few
25 1/4 One fourth/A quarter Some
30
33
40
45-49
50
50+1
60
66
70
75
80
90
3/10
1/3
2/5
-
1/2
-
3/5
2/3
7/10
¾
4/5
9/10
Three out ten
One third/One out of three
Two out of five
-
One half
-
Three out of five
Two thirds/Two out of three
Seven out of ten
Three fourths/Three our of four
Four Fifths/four out of five
Nine out of ten
Some
Many
Many
Less than
half/Almost half
-
Majority
A great majority
A great majority
A great majority
Most
Almost all
Almost all
• When the highest figure in the distribution
does not exceed fifty percent, don’t state
majority, just state “the greatest number of
the respondents”
Interpretation of Results
• Interpretation of results follows right after
presentation and analysis of data. This section
explains meanings of the results of described data,
decides whether hypotheses are rejected or
accepted, and gives implications of findings.
• Tabular and graphical interpretation highlights,
statistical interpretation implications, inferences,
attributes are introduced. Assumptions stated may
be played up. In corroborating, contradicting, or
confirming results, literature, quotations and other
evidences are used.
Summary
The summary should make a short but accurate
statement of the findings based on the
statement of the problem/objectives of the
study.
For instance, if one of the objectives of a certain
study deals with determining the academic
performance of education students, then the
summary should focus only on the academic
performance of such students giving emphasis
on whether the performance is high, medium or
low.
CONCLUSION
• For the conclusion, the most appropriate basis is
the statement of the hypothesis of the study.
Were there significant differences in the
findings? For example, from the above summary
of findings, the conclusion can be stated as, “It is
therefore concluded that the academic
performance of the education students differ
significantly.” You can make the necessary
statement of differences after concluding.
RECOMMENDATIONS
The finale of your manuscript is the
recommendation. It is a statement of the
suggestion you offer to your readers based on
the conclusion made from the study.
For example, taking again the conclusion above,
one recommendation you state would be, “Since
the academic performance of education students
differs, it is strongly recommended that teachers
should be to give equal attention to their
students to realize a more or less high and
homogeneous academic performance.”
There is no hard-and-fast rule as to the number
of recommendations that you can offer;
hence, you can make one or more
recommendations per conclusion. Likewise,
recommendations for policy implications like
models or paradigms including future studies
are highly desired in every research study.
Example
The attitudes of the respondents towards organic
farming are shown in Table 2 indicating
differences in weighted means from 2.05 (not
much accepted) to 3.02 (very much accepted).
The general weighted mean is 2.60, very much
accepted. Based on the data, the aspects which
are very much accepted by the respondents are
the use of standards which has the highest
weighted mean, 3.02; followed by proper
harvesting and marketing, 2.82; and advantage
and disadvantage, 2.77. However, the attitudes
Table 2. Attitude towards organic farming.
________________________________________________
ASPECT WM DE________
Use of standards 3.02 VMA
Proper harvesting and marketing 2.82 VMA
Advantages and disadvantages 2.77 VMA
Farming commodities 2.5 NMA
Effectiveness 2.49 NMA
Importance of organic farming 2.05 NMA
GWM 2.60 VMA_______
tc= 4.10* t.05= 1.96 * - significant
of the respondents toward farming commodities,
2.5; effectiveness, 2.49; and importance of organic
farming, 2.05 are not much accepted. The t
computed value, which is higher than the tabular
value at .05 percent level of significance led to the
acceptance of the hypothesis that the attitude
towards organic farming differ.
The finding implies that the attitudes of the
farmers toward organic farming vary. The varying
attitudes of the farmers toward organic farming can
be attributed to patience, talent, honesty and goal
of the farmers. This means that the more
different the levels of patience, talents, honesty,
and goals, the more different the attitudes
toward organic farming. This finding supports
Harr (1945) stating that behaviors of farmers in
composting crop residues requires patience and
resourcefulness.
Summary
The finding shows that the attitude of the
respondent-farmers toward organic farming
differ along various aspects very much accepting
the use of standards, proper harvesting and
marketing, and advantage and disadvantage of
organic farming while not much accepting
farming commodities, effectiveness, and
importance of organic farming.
Conclusion
Based on the findings, it is concluded that the
attitudes of the farmers toward organic farming
vary. The farmers are positive over the use of
standards, proper harvesting and marketing,
and advantage and disadvantage of organic
farming. They are not quite convinced however,
on organic farming commodities, effectiveness,
and importance of organic farming.
Recommendation
1. Since attitudes toward organic farming differs,
the farmers are encourage to attend seminars,
workshops, lectures and demonstrations
regarding all aspects of organic farming to give
them adequate information paving way to
positive attitude towards organic agriculture.
2. The concerned agencies must organize
programs, projects or advocacies to motivate
farmers to go into organic agriculture.

THESIS- Making the Results and Discussions portion

  • 1.
  • 2.
    General Steps inthe Discussion of Tables and Statistical Results • Present summary of data from the table. • State results of statistical computations for both descriptive and inferential. • State the implication(s) and attribute(s) of the data. • Corroborate and contrast the results of the finding through the set of your review literature. • Use either past or present tense. Do not editorialize, sermonize or moralize, and campaign.
  • 3.
    Presentation of Data 1.Arrange findings based on the statement of the problem/objectives of the study. Have sub-titles based on the key words of the objectives. 2. Summarize data in graphical or tabular form or with the use of other convenient methods such as charts. 3. Introduce graphs, tables, plates and figures before presenting them. Tables, graphs, figures or plates that do not occupy the whole page should start or end a page. They are never placed in between text. If they occupy more than a page, continuation/s must follow immediately. 4. In the textual presentation of data from tables, figures and charts, exact repetition of figures, even expressing them in words, should be avoided.
  • 4.
    Guide in thetextual presentation of data from tables, figures and charts. IN PERCENTILES IN FRACTIONS IN WORDS IN GENERAL TERMS 10 1/10 One out of ten Few 20 1/5 One out of five Few 25 1/4 One fourth/A quarter Some 30 33 40 45-49 50 50+1 60 66 70 75 80 90 3/10 1/3 2/5 - 1/2 - 3/5 2/3 7/10 ¾ 4/5 9/10 Three out ten One third/One out of three Two out of five - One half - Three out of five Two thirds/Two out of three Seven out of ten Three fourths/Three our of four Four Fifths/four out of five Nine out of ten Some Many Many Less than half/Almost half - Majority A great majority A great majority A great majority Most Almost all Almost all
  • 5.
    • When thehighest figure in the distribution does not exceed fifty percent, don’t state majority, just state “the greatest number of the respondents”
  • 6.
    Interpretation of Results •Interpretation of results follows right after presentation and analysis of data. This section explains meanings of the results of described data, decides whether hypotheses are rejected or accepted, and gives implications of findings. • Tabular and graphical interpretation highlights, statistical interpretation implications, inferences, attributes are introduced. Assumptions stated may be played up. In corroborating, contradicting, or confirming results, literature, quotations and other evidences are used.
  • 7.
    Summary The summary shouldmake a short but accurate statement of the findings based on the statement of the problem/objectives of the study. For instance, if one of the objectives of a certain study deals with determining the academic performance of education students, then the summary should focus only on the academic performance of such students giving emphasis on whether the performance is high, medium or low.
  • 8.
    CONCLUSION • For theconclusion, the most appropriate basis is the statement of the hypothesis of the study. Were there significant differences in the findings? For example, from the above summary of findings, the conclusion can be stated as, “It is therefore concluded that the academic performance of the education students differ significantly.” You can make the necessary statement of differences after concluding.
  • 9.
    RECOMMENDATIONS The finale ofyour manuscript is the recommendation. It is a statement of the suggestion you offer to your readers based on the conclusion made from the study. For example, taking again the conclusion above, one recommendation you state would be, “Since the academic performance of education students differs, it is strongly recommended that teachers should be to give equal attention to their students to realize a more or less high and homogeneous academic performance.”
  • 10.
    There is nohard-and-fast rule as to the number of recommendations that you can offer; hence, you can make one or more recommendations per conclusion. Likewise, recommendations for policy implications like models or paradigms including future studies are highly desired in every research study.
  • 11.
    Example The attitudes ofthe respondents towards organic farming are shown in Table 2 indicating differences in weighted means from 2.05 (not much accepted) to 3.02 (very much accepted). The general weighted mean is 2.60, very much accepted. Based on the data, the aspects which are very much accepted by the respondents are the use of standards which has the highest weighted mean, 3.02; followed by proper harvesting and marketing, 2.82; and advantage and disadvantage, 2.77. However, the attitudes
  • 12.
    Table 2. Attitudetowards organic farming. ________________________________________________ ASPECT WM DE________ Use of standards 3.02 VMA Proper harvesting and marketing 2.82 VMA Advantages and disadvantages 2.77 VMA Farming commodities 2.5 NMA Effectiveness 2.49 NMA Importance of organic farming 2.05 NMA GWM 2.60 VMA_______ tc= 4.10* t.05= 1.96 * - significant
  • 13.
    of the respondentstoward farming commodities, 2.5; effectiveness, 2.49; and importance of organic farming, 2.05 are not much accepted. The t computed value, which is higher than the tabular value at .05 percent level of significance led to the acceptance of the hypothesis that the attitude towards organic farming differ. The finding implies that the attitudes of the farmers toward organic farming vary. The varying attitudes of the farmers toward organic farming can be attributed to patience, talent, honesty and goal
  • 14.
    of the farmers.This means that the more different the levels of patience, talents, honesty, and goals, the more different the attitudes toward organic farming. This finding supports Harr (1945) stating that behaviors of farmers in composting crop residues requires patience and resourcefulness.
  • 15.
    Summary The finding showsthat the attitude of the respondent-farmers toward organic farming differ along various aspects very much accepting the use of standards, proper harvesting and marketing, and advantage and disadvantage of organic farming while not much accepting farming commodities, effectiveness, and importance of organic farming.
  • 16.
    Conclusion Based on thefindings, it is concluded that the attitudes of the farmers toward organic farming vary. The farmers are positive over the use of standards, proper harvesting and marketing, and advantage and disadvantage of organic farming. They are not quite convinced however, on organic farming commodities, effectiveness, and importance of organic farming.
  • 17.
    Recommendation 1. Since attitudestoward organic farming differs, the farmers are encourage to attend seminars, workshops, lectures and demonstrations regarding all aspects of organic farming to give them adequate information paving way to positive attitude towards organic agriculture. 2. The concerned agencies must organize programs, projects or advocacies to motivate farmers to go into organic agriculture.