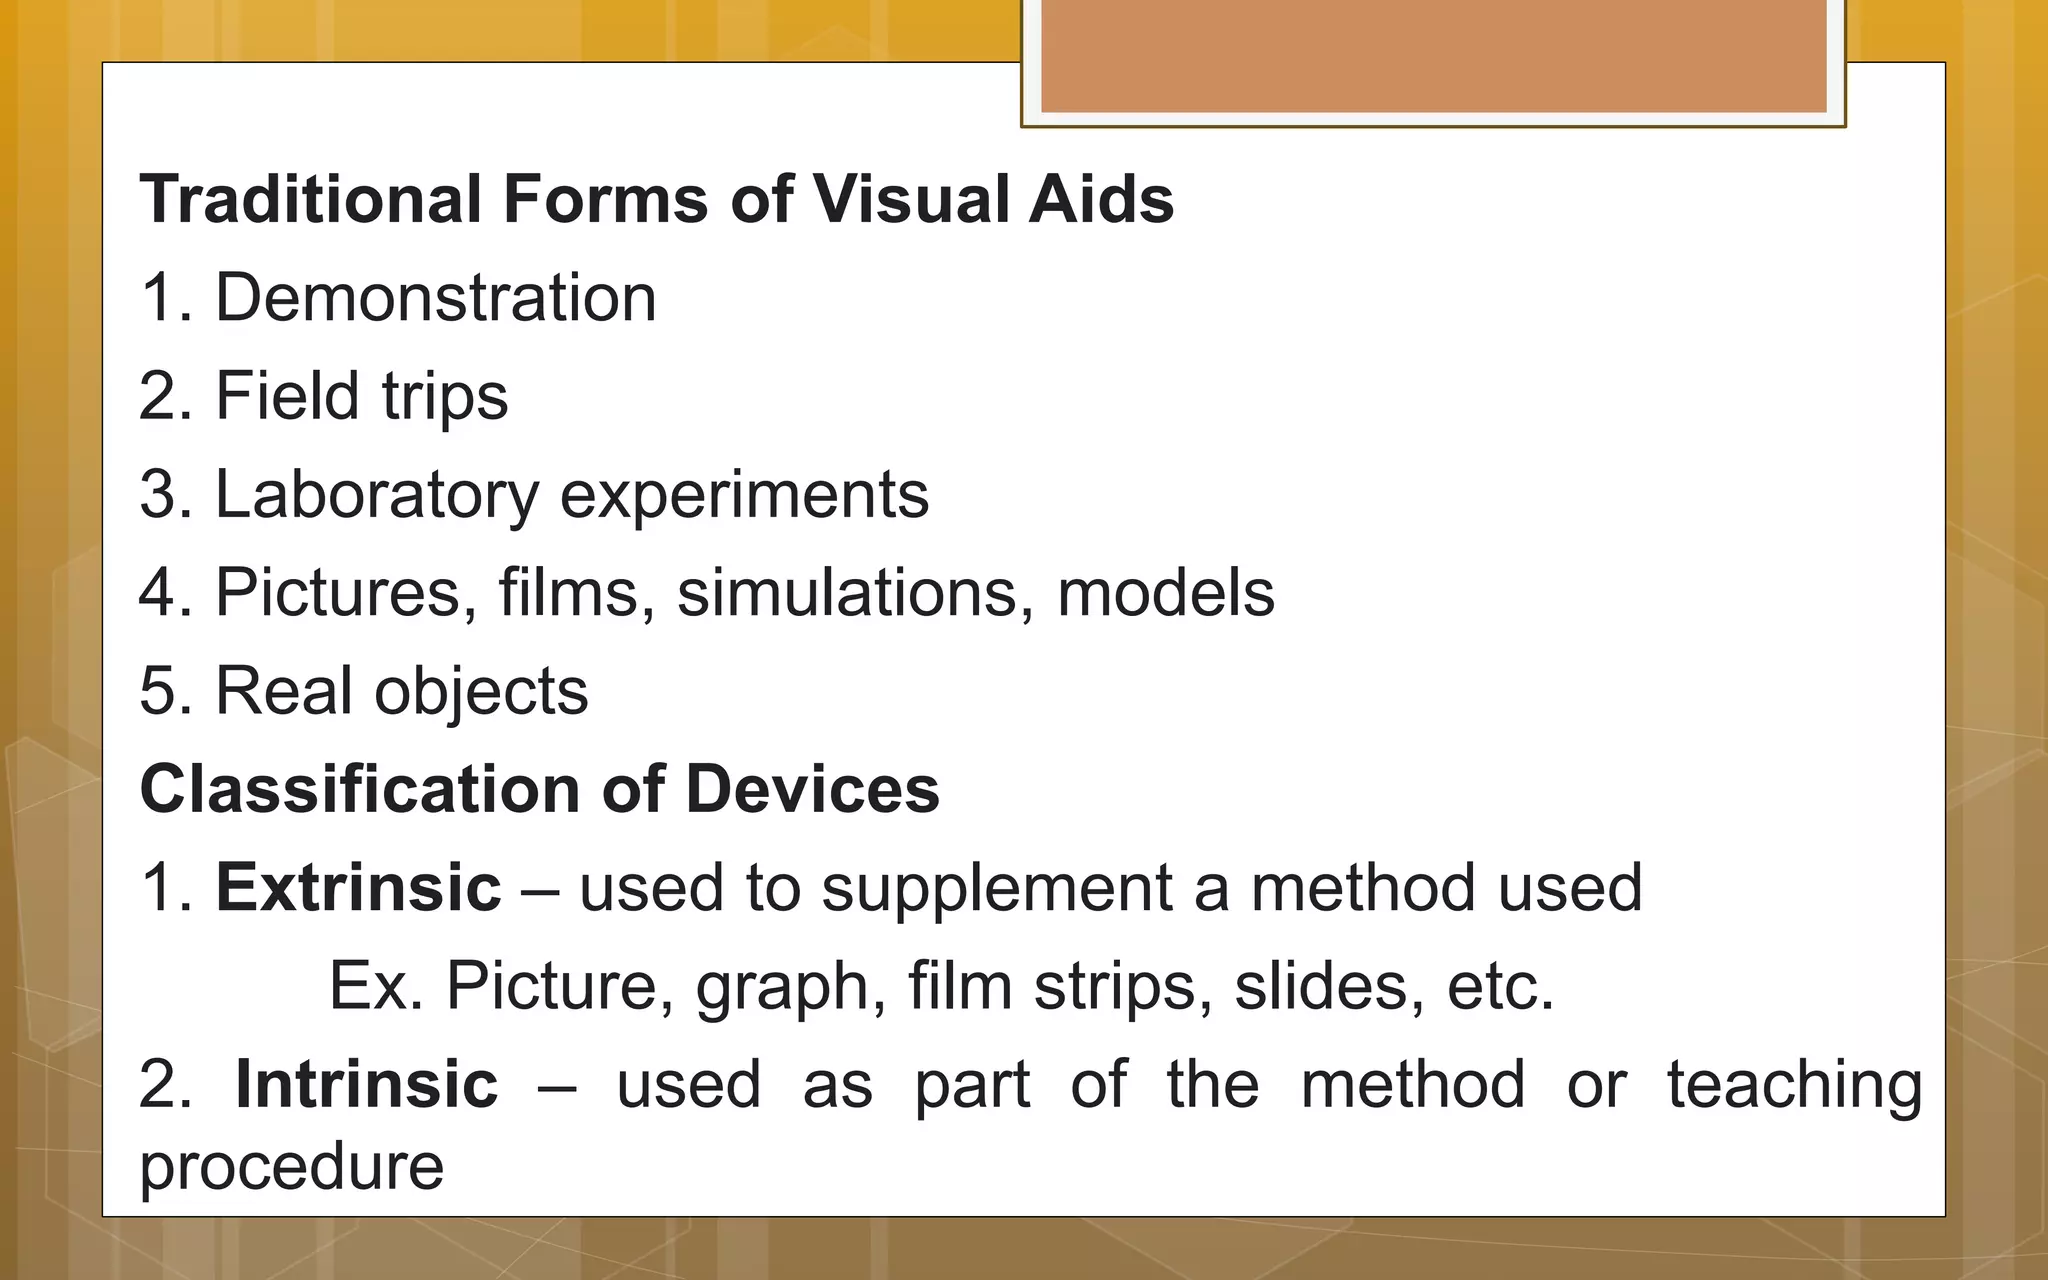
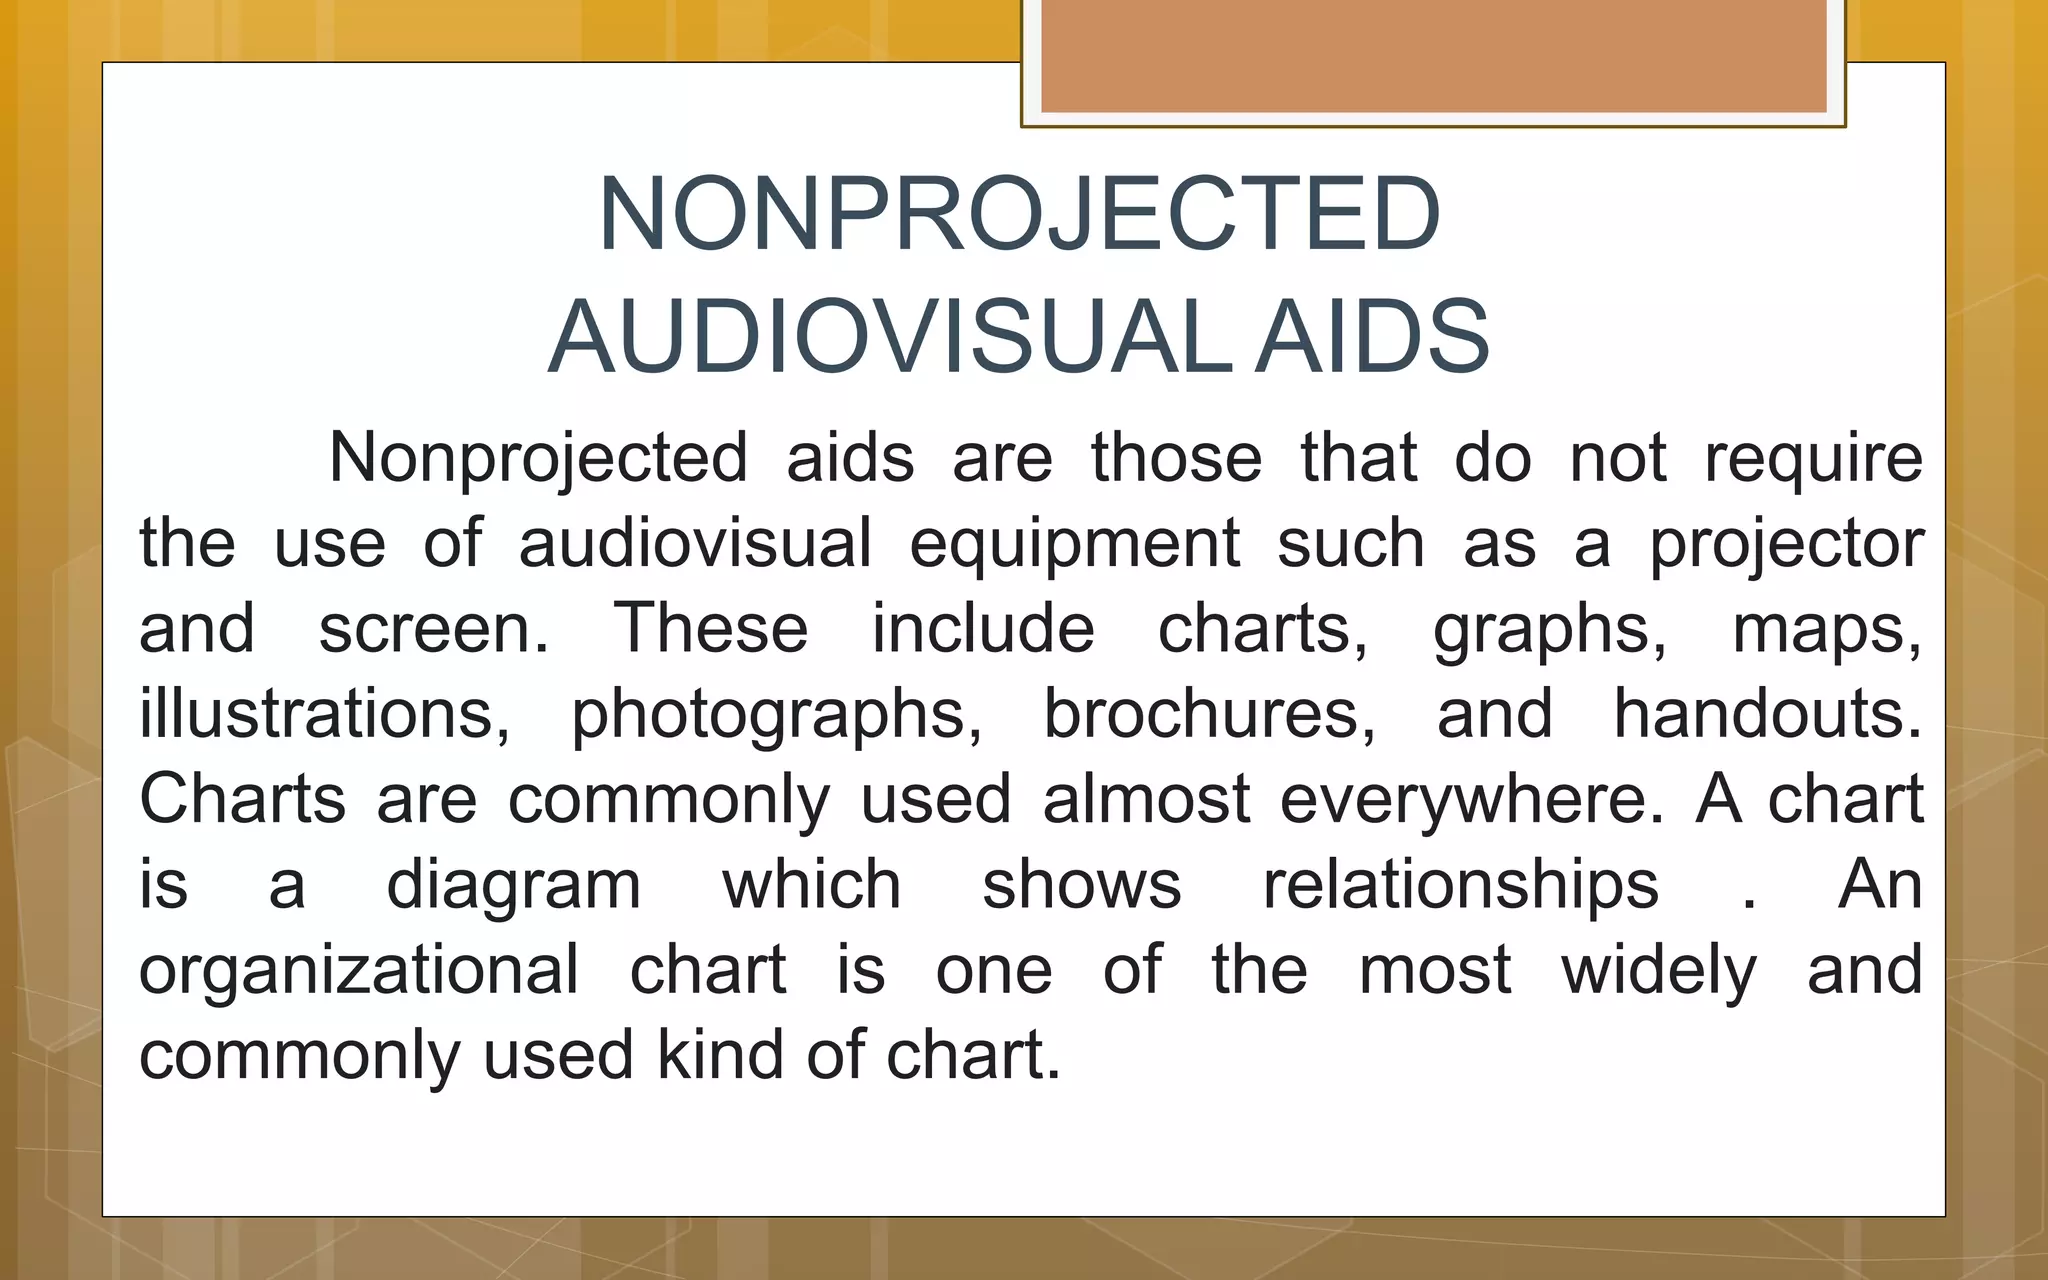
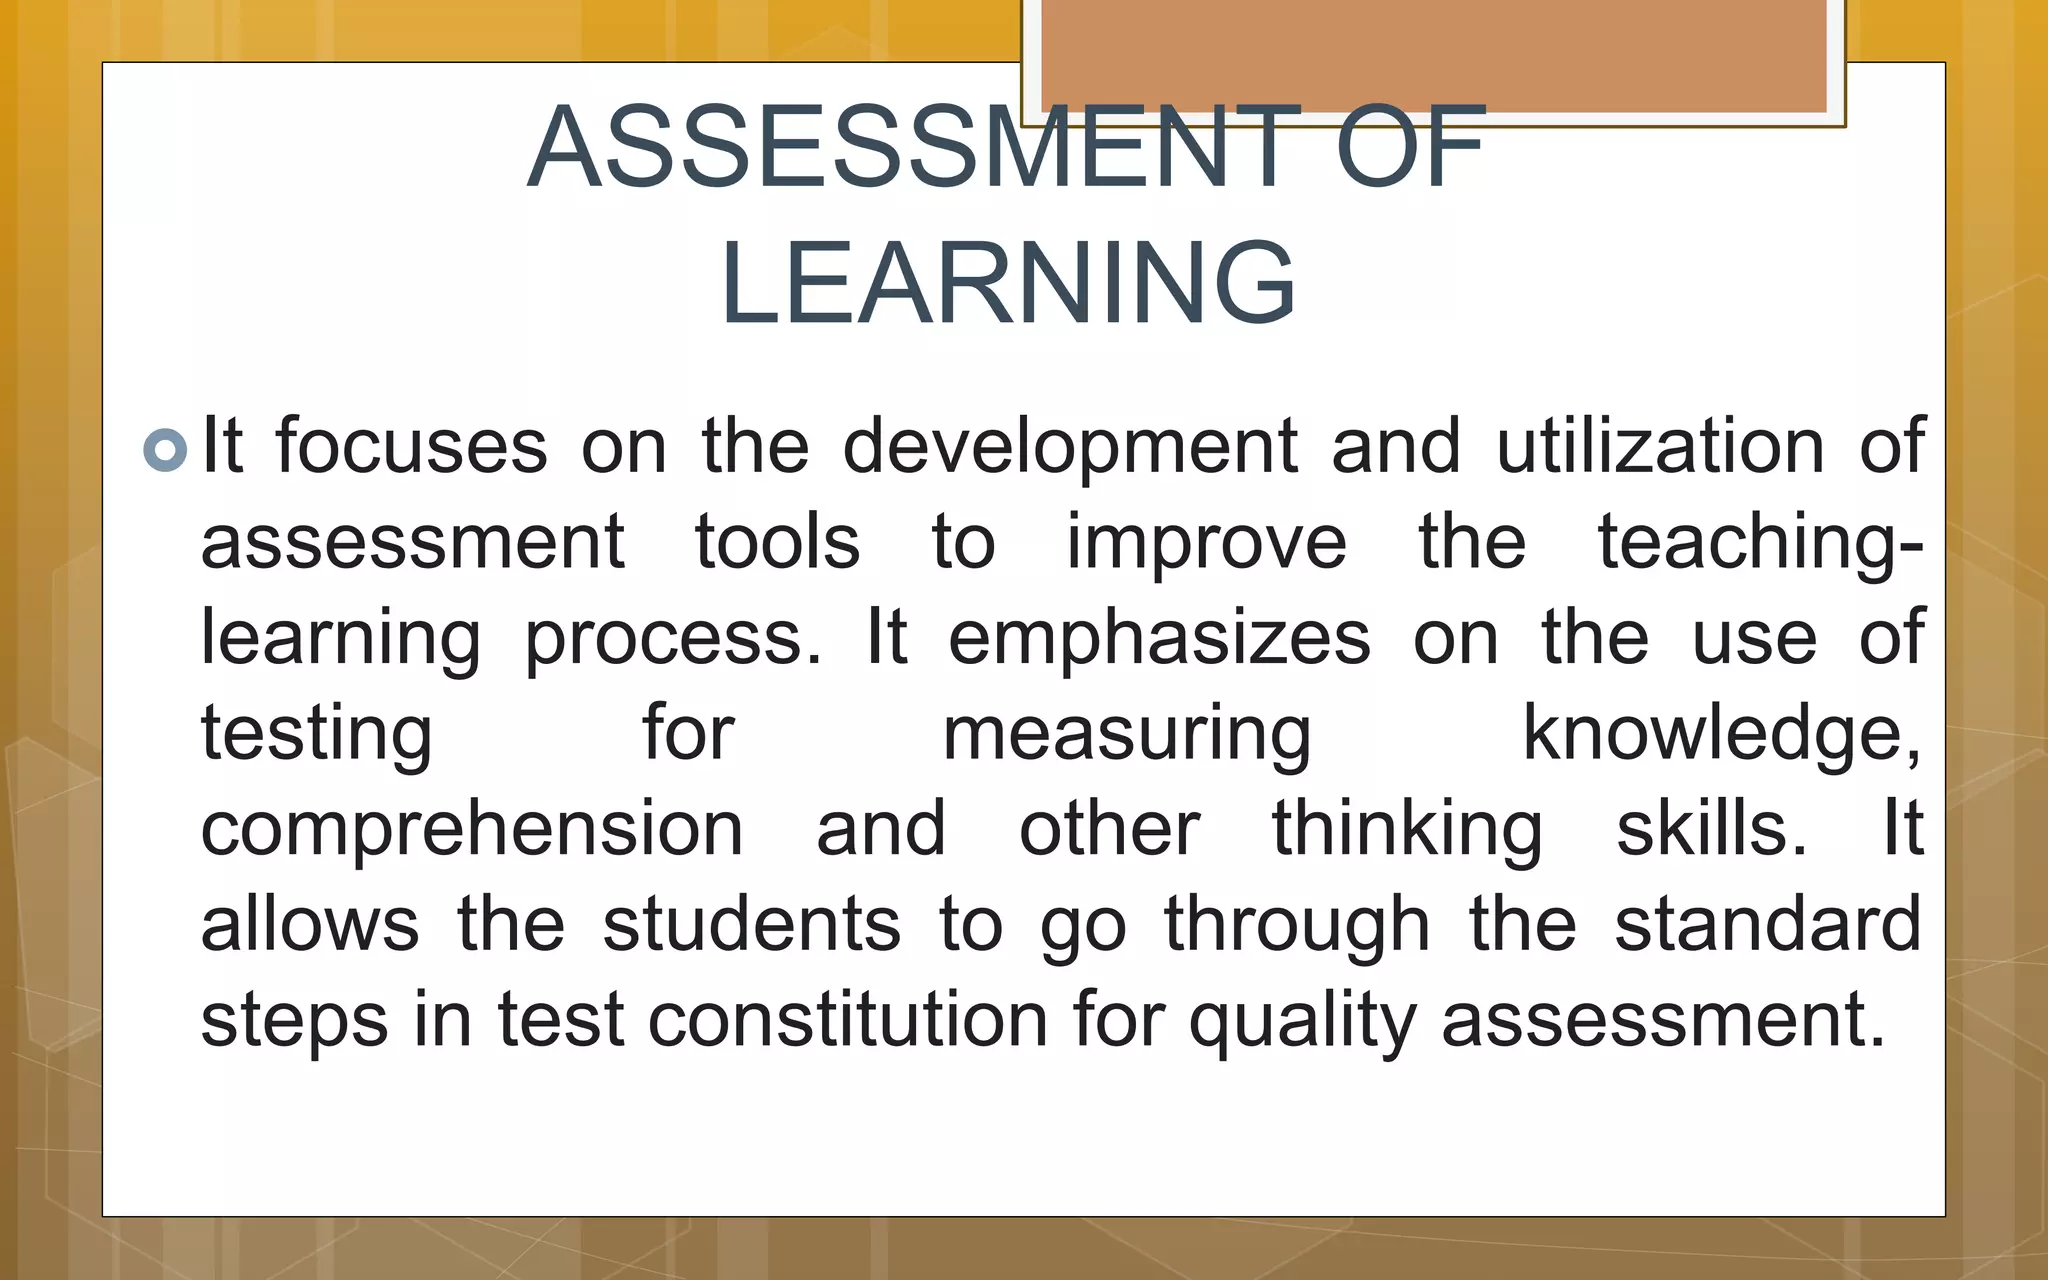
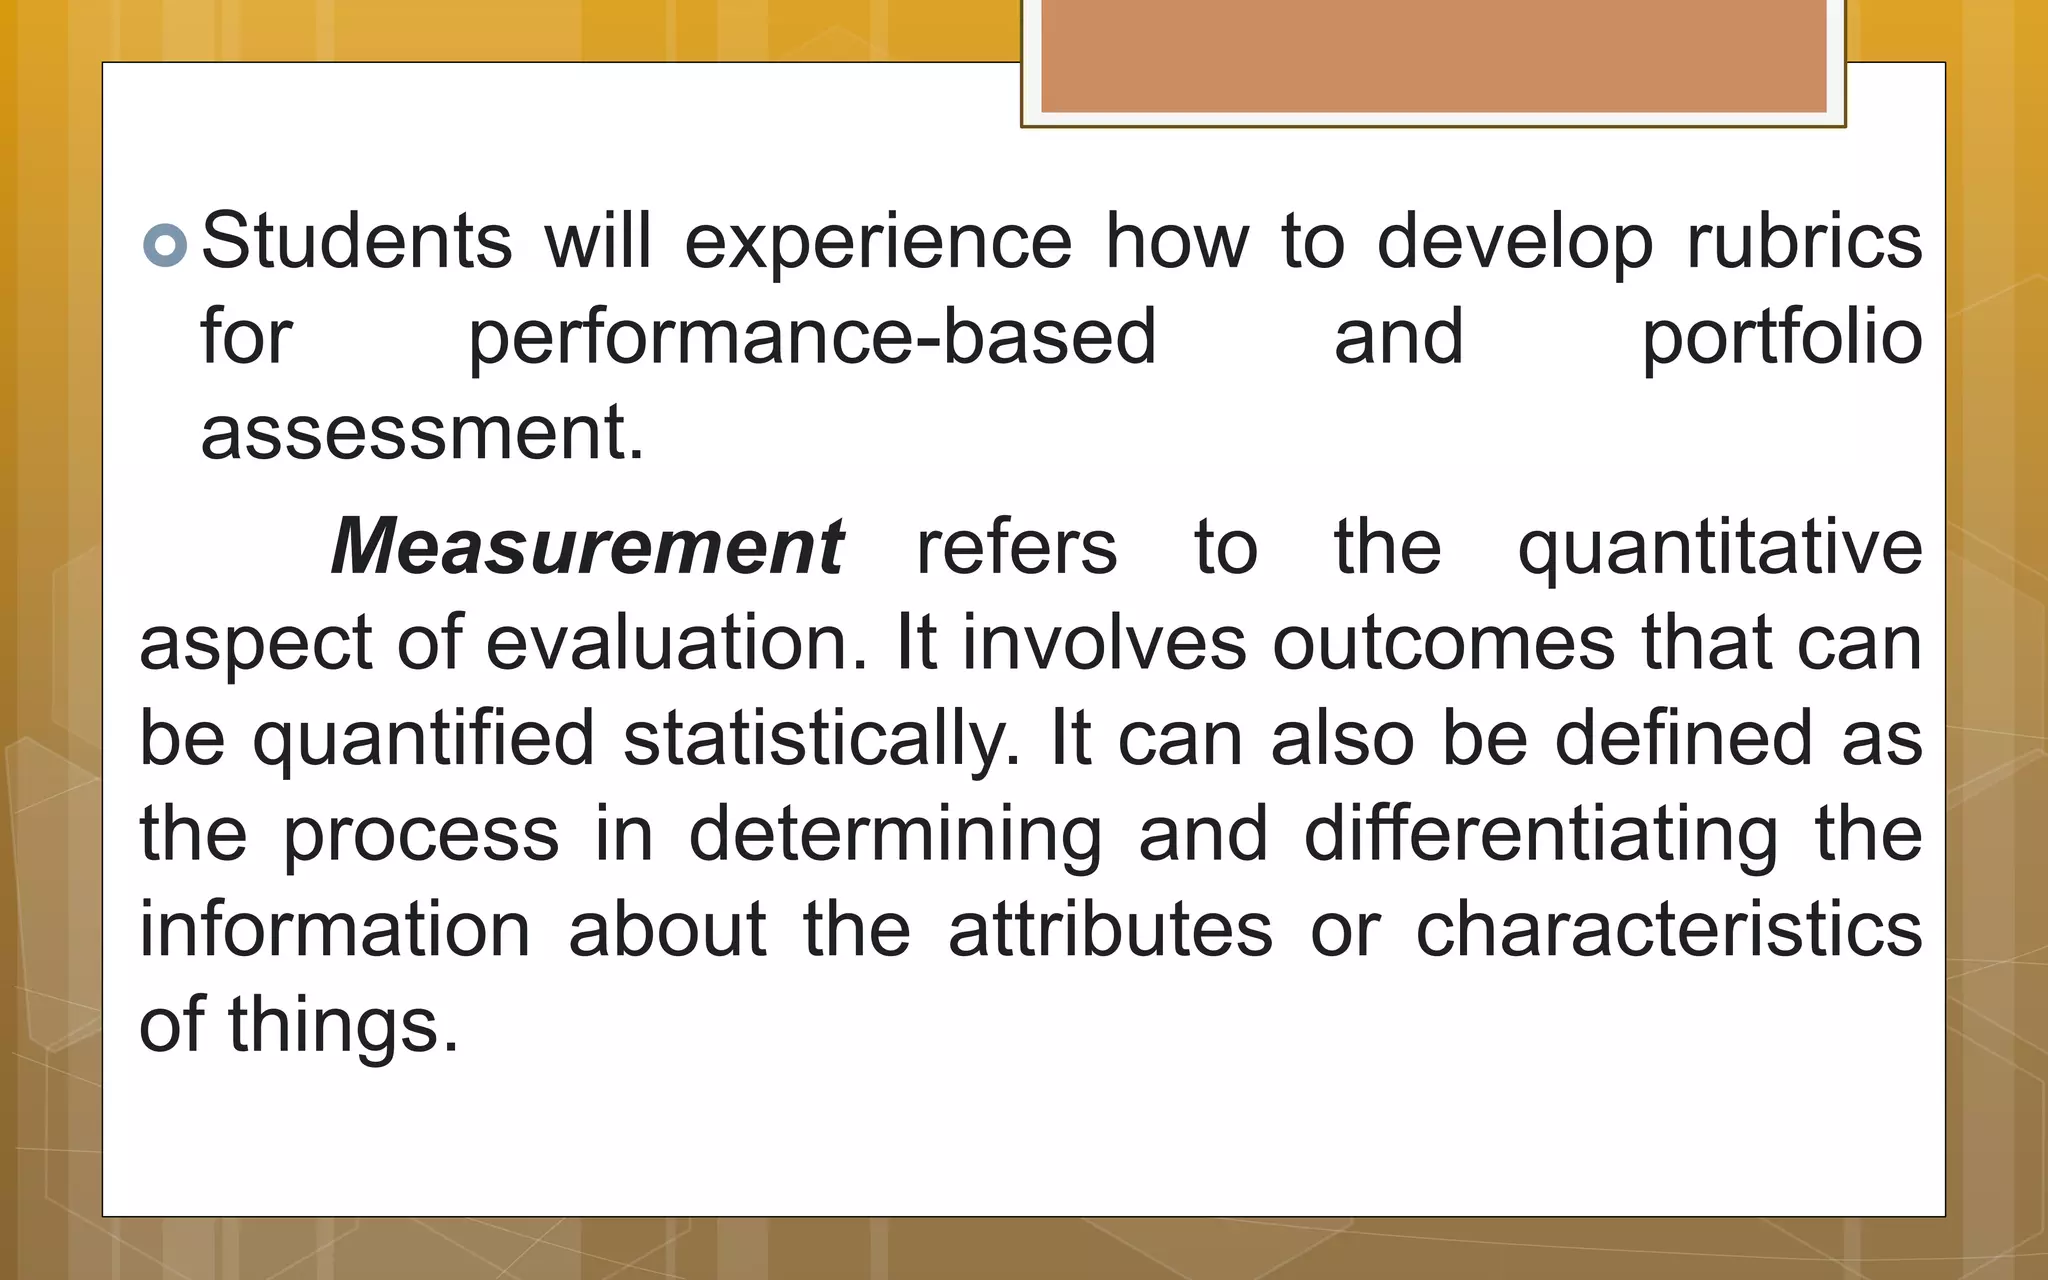
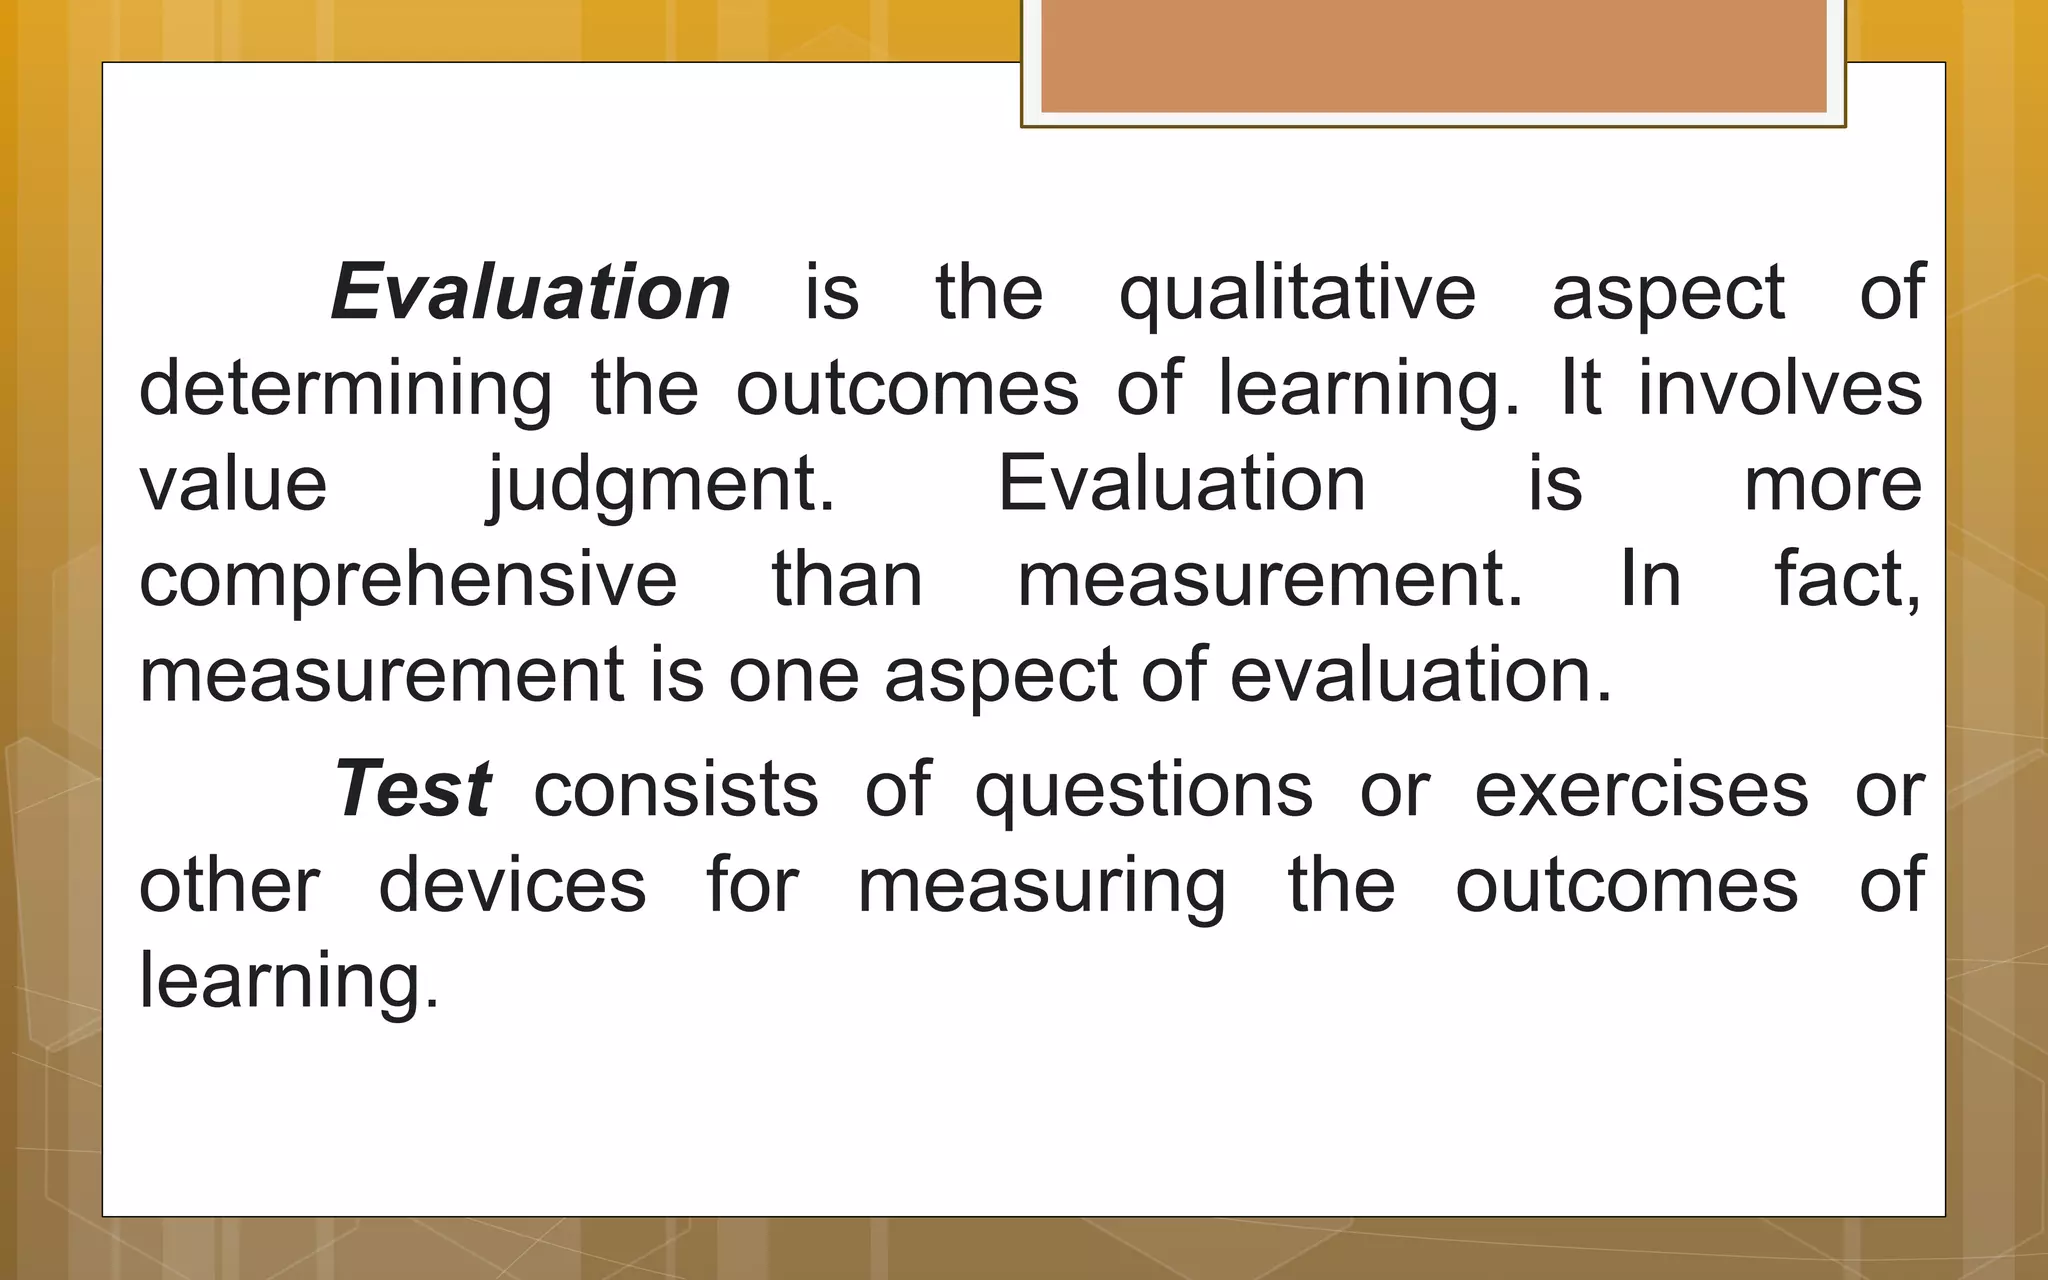
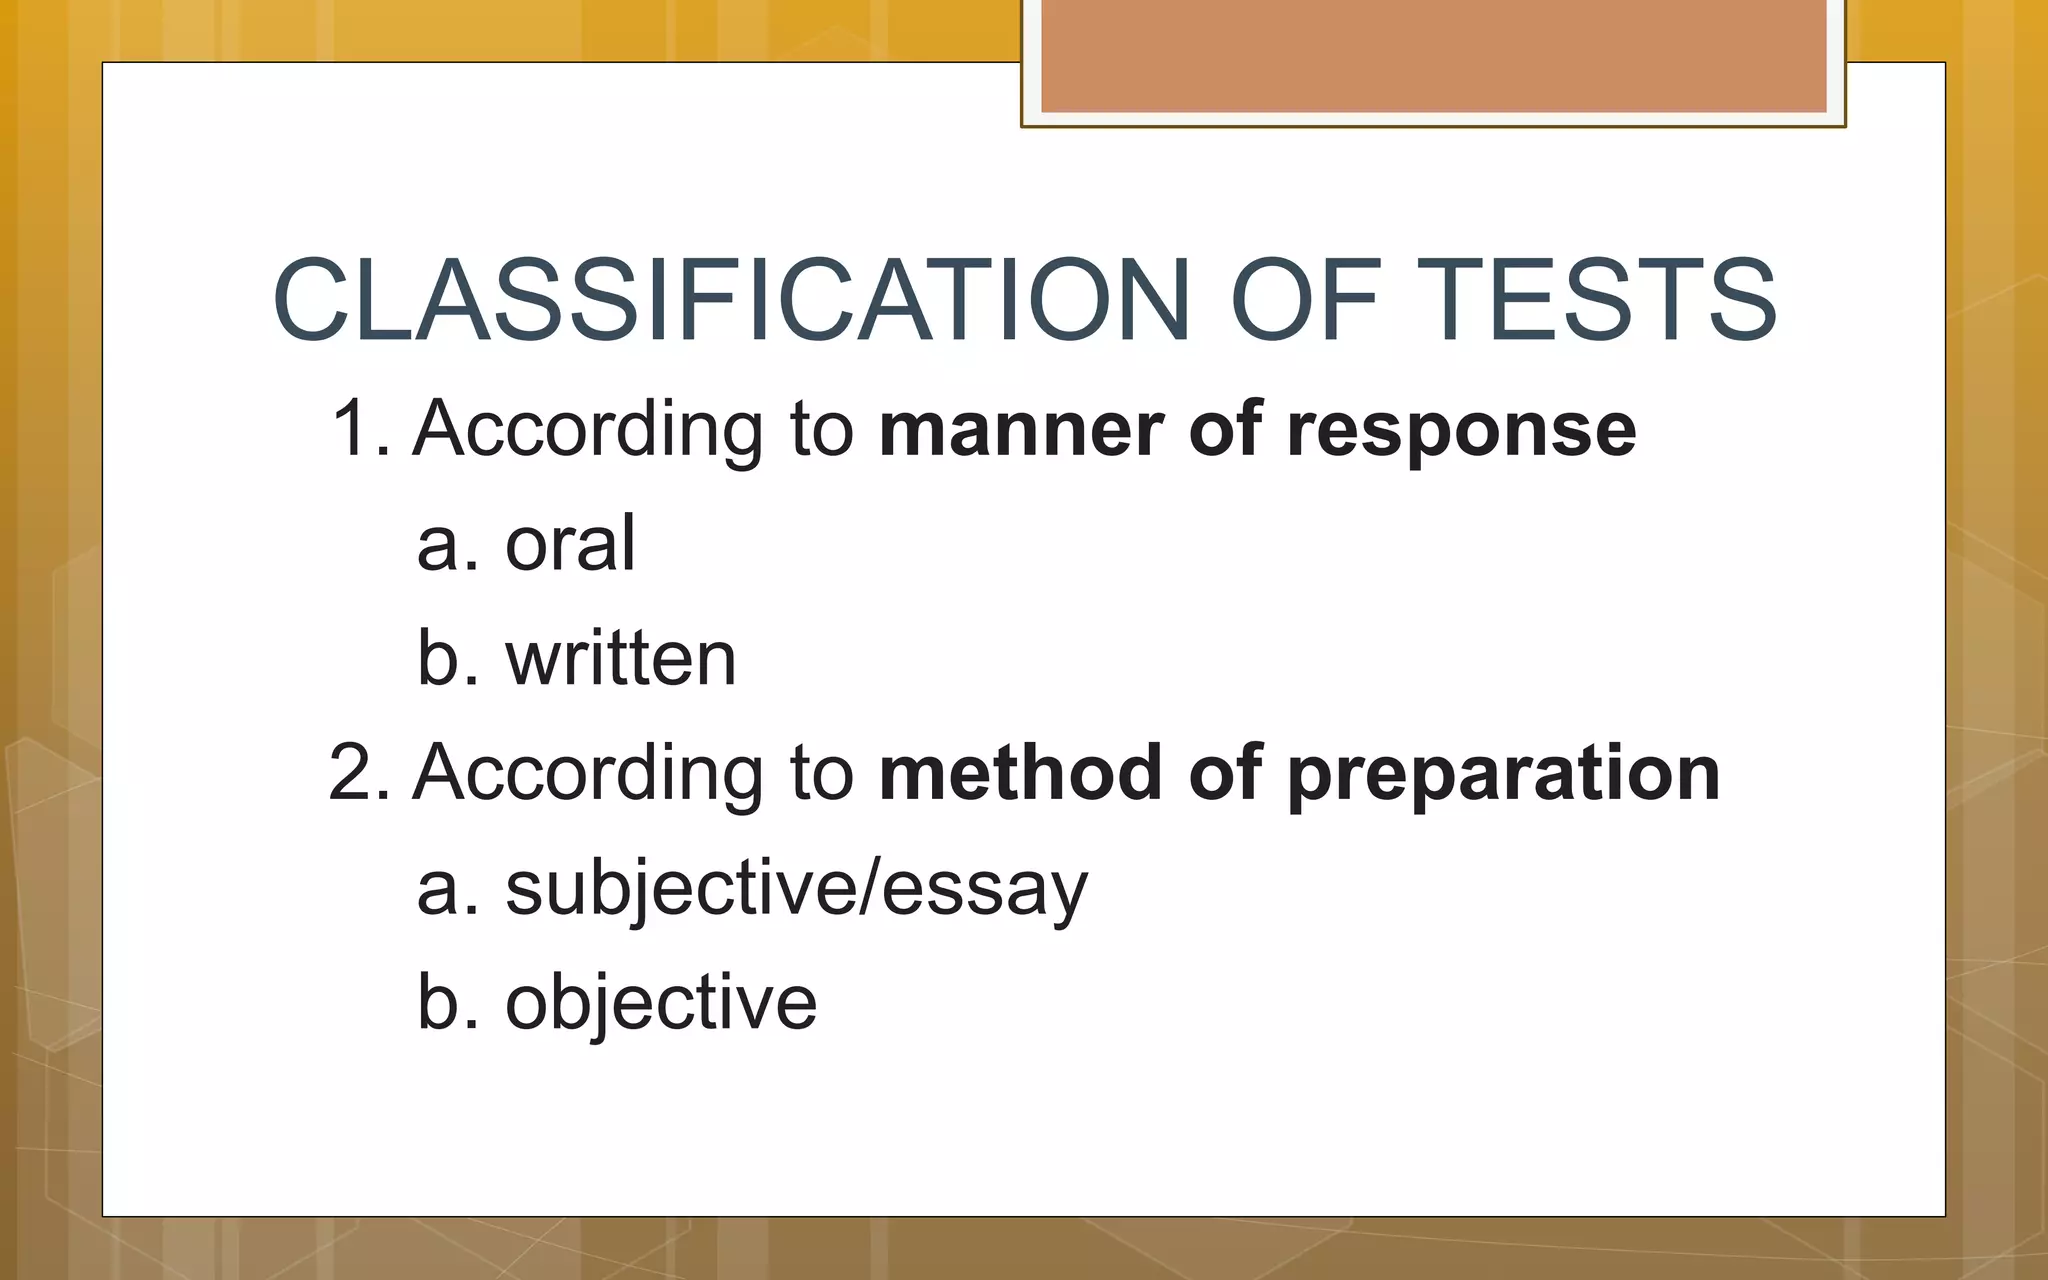
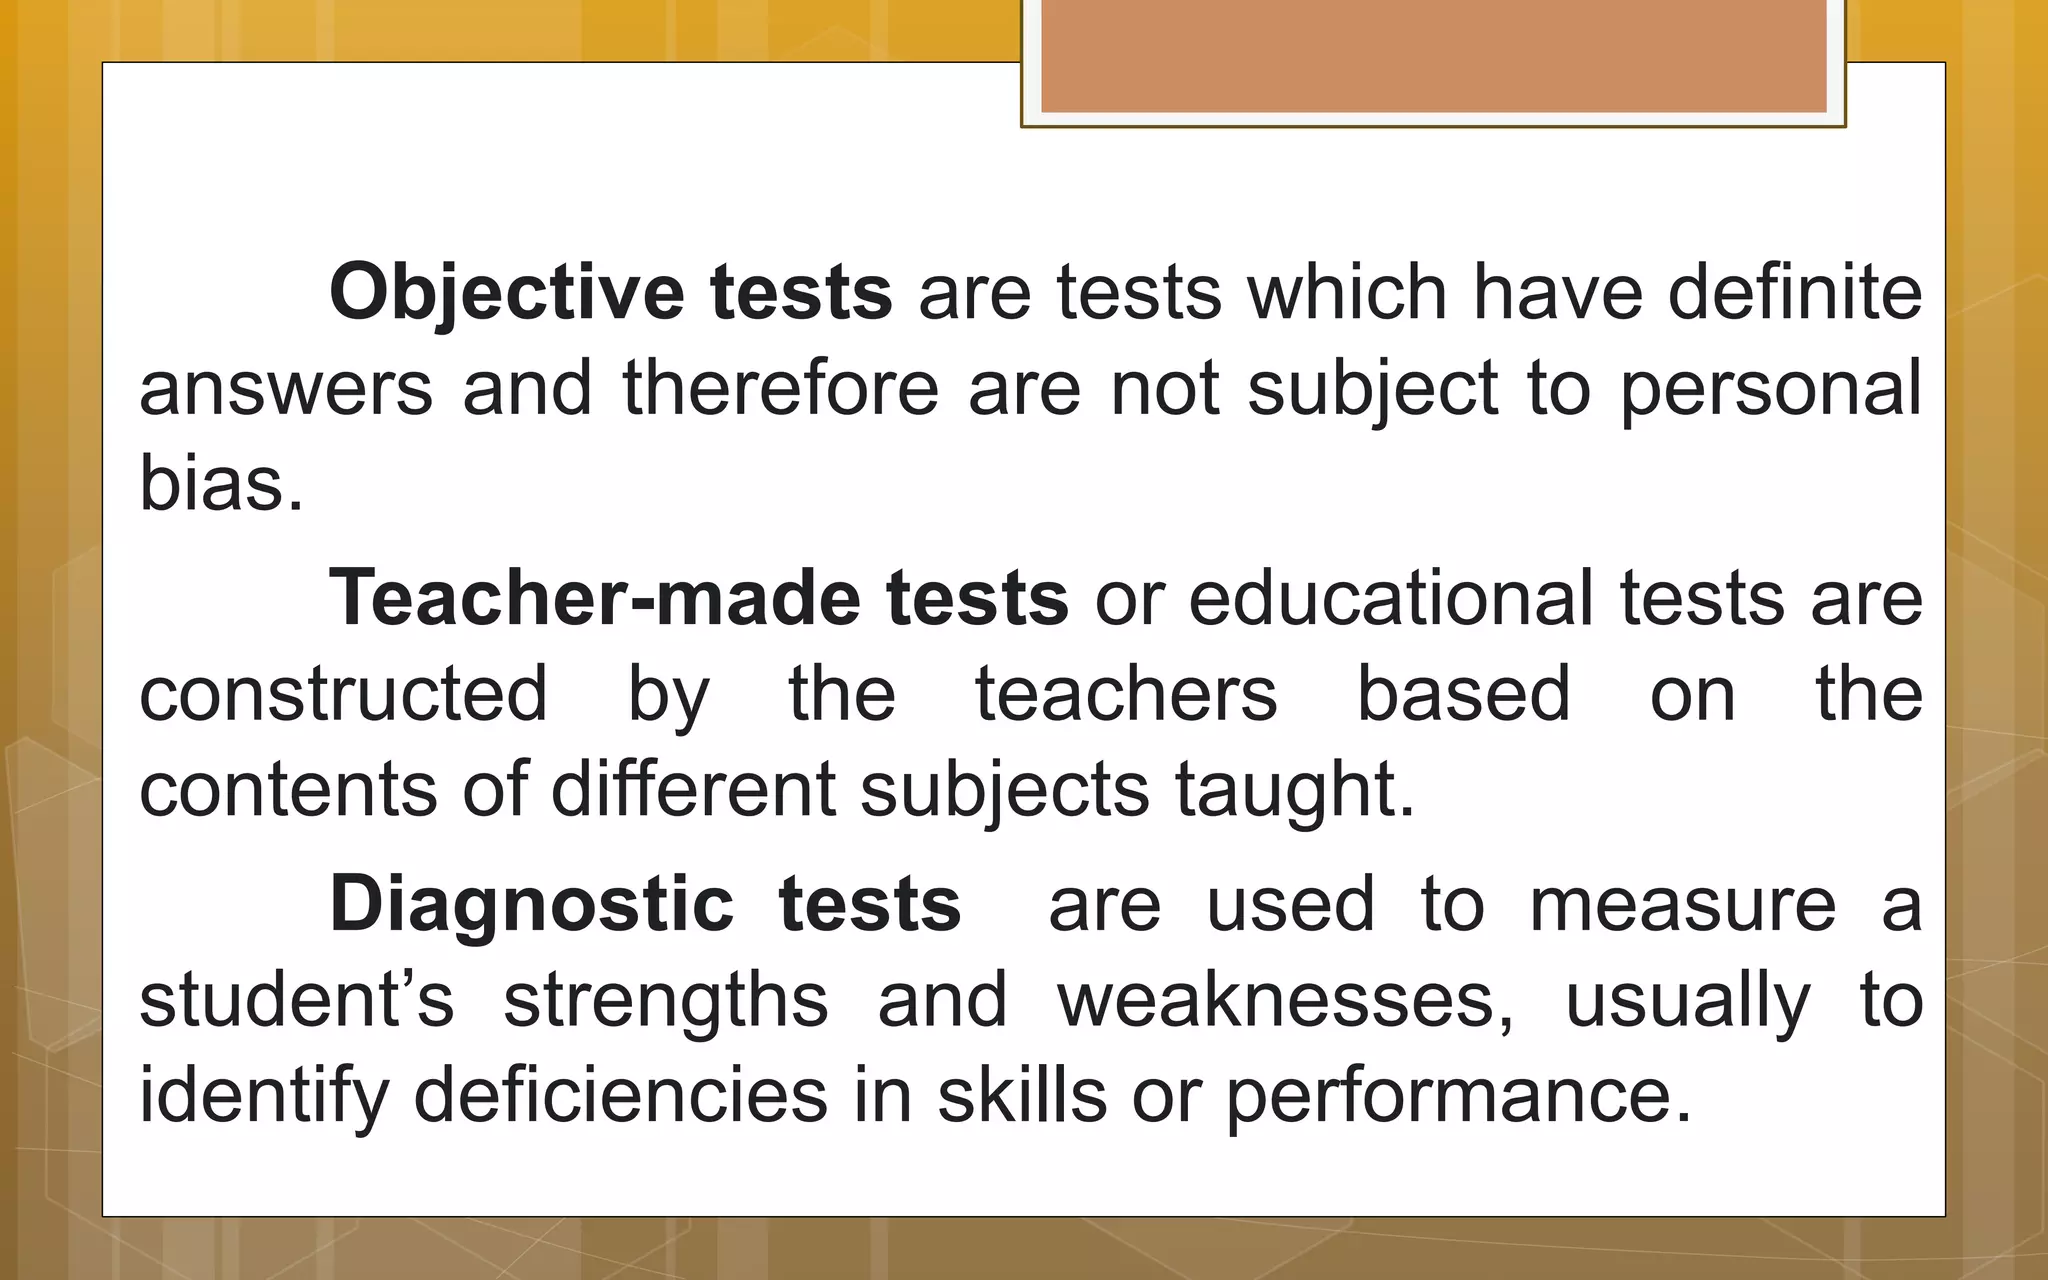
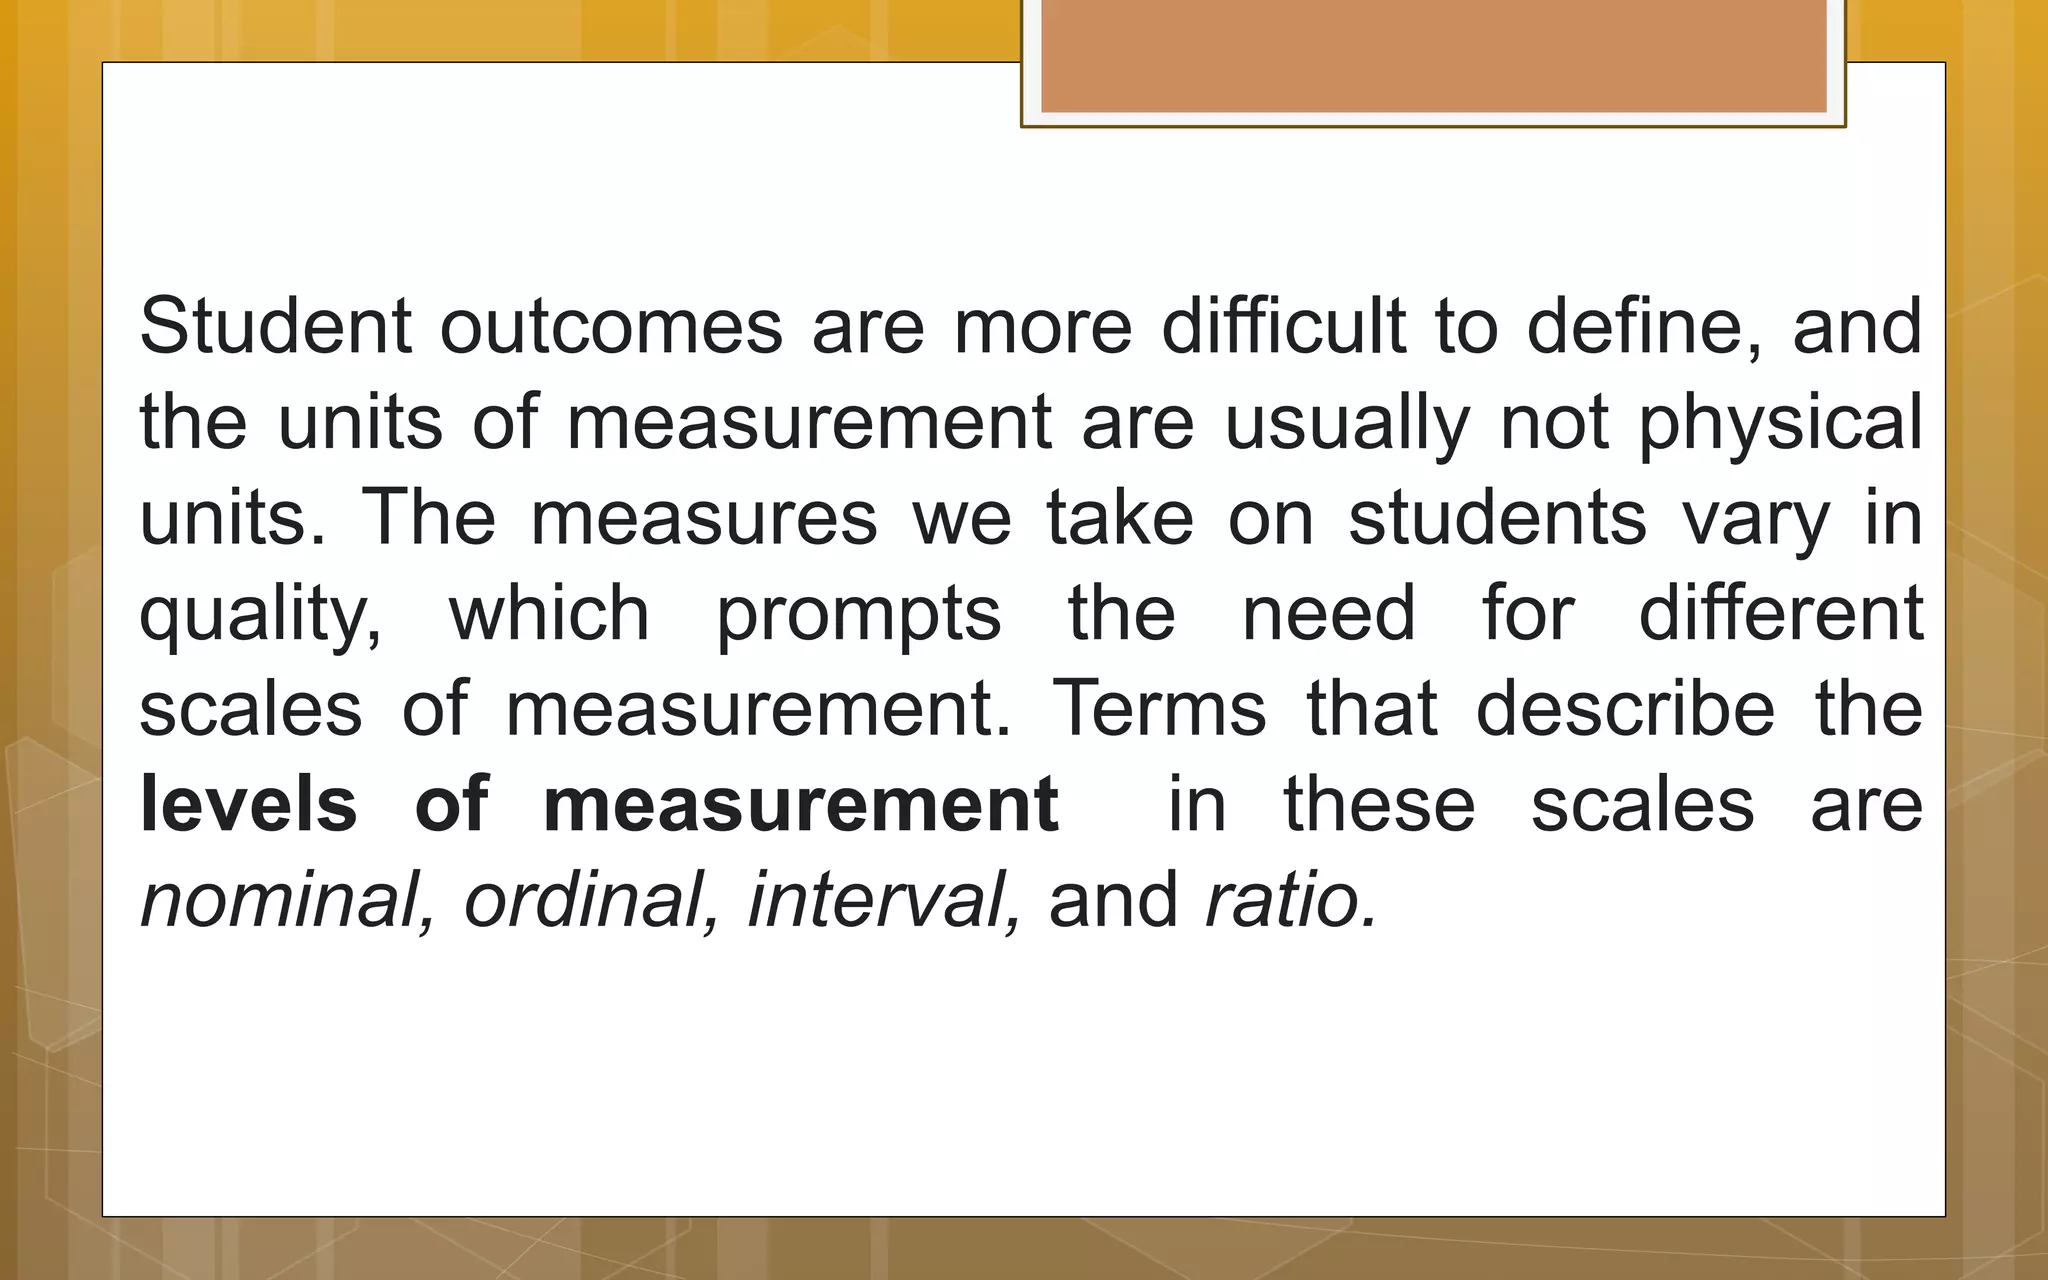
SlideShare a Scribd company logo
1 of 103
ASSESSMENT
OF
LEARNING
Acero, Wendy Angeli P.
BEED – GENERAL EDUCATION
III
EDUCATIONAL TECHNOLOGY
 Audiovisual aids are defined as any device used to aid in
the communication of an idea. As such, virtually anything
can be used as an audio visual aid provided it
successfully communicates the idea or information for
which it is designed. An audiovisual aid includes still
photography, motion picture, audio or video tape, slide or
filmstrip, that is prepared individually or in combination to
communicate information or to elicit a desired audience
response.
Even though early aids, such as maps and
drawings, are still in use, advances in the
audiovisual field have opened up new methods
of presenting these aids, such as videotapes
and multimedia equipment which allow more
professional and entertaining presentations not
only in the classrooms but also anywhere in
which ideas are to be conveyed to the audience.
DEVICE
Device is any means other than the subject-matter
itself that is employed by the teacher in presenting the
subject matter to the learner.
Purpose of Visual Devices
1. To challenge students’ attention
2. To stimulate the imagination and develop the mental
imagery of the pupils
3. To facilitate the understanding of the pupils
4. To provide motivation to the learners
5. To develop the ability to listen
Traditional Forms of Visual Aids
1. Demonstration
2. Field trips
3. Laboratory experiments
4. Pictures, films, simulations, models
5. Real objects
Classification of Devices
1. Extrinsic – used to supplement a method used
Ex. Picture, graph, film strips, slides, etc.
2. Intrinsic – used as part of the method or teaching
procedure
Ex. Pictures accompanying an article
3. Material Devices – device that have no bearing
on the subject matter
Ex. Blackboard, chalk, books, pencils, etc.
4. Mental Devices – a kind of device that is
related in form and the meaning to the subject
matter being presented
Ex. Questions, projects, drills, lesson plans,
etc.
NONPROJECTED
AUDIOVISUAL AIDS
Nonprojected aids are those that do not require
the use of audiovisual equipment such as a projector
and screen. These include charts, graphs, maps,
illustrations, photographs, brochures, and handouts.
Charts are commonly used almost everywhere. A chart
is a diagram which shows relationships . An
organizational chart is one of the most widely and
commonly used kind of chart.
ASSESSMENT OF
LEARNING
It focuses on the development and utilization of
assessment tools to improve the teaching-
learning process. It emphasizes on the use of
testing for measuring knowledge,
comprehension and other thinking skills. It
allows the students to go through the standard
steps in test constitution for quality assessment.
Students will experience how to develop rubrics
for performance-based and portfolio
assessment.
Measurement refers to the quantitative
aspect of evaluation. It involves outcomes that can
be quantified statistically. It can also be defined as
the process in determining and differentiating the
information about the attributes or characteristics
of things.
Evaluation is the qualitative aspect of
determining the outcomes of learning. It involves
value judgment. Evaluation is more
comprehensive than measurement. In fact,
measurement is one aspect of evaluation.
Test consists of questions or exercises or
other devices for measuring the outcomes of
learning.
CLASSIFICATION OF TESTS
1. According to manner of response
a. oral
b. written
2. According to method of preparation
a. subjective/essay
b. objective
3. According to the nature of answer
a. personality tests
b. intelligence test
c. aptitude test
d. achievement or summative test
e. sociometric test
f. diagnostic or formative test
g. trade or vocational test
Objective tests are tests which have definite
answers and therefore are not subject to personal
bias.
Teacher-made tests or educational tests are
constructed by the teachers based on the
contents of different subjects taught.
Diagnostic tests are used to measure a
student’s strengths and weaknesses, usually to
identify deficiencies in skills or performance.
Formative and summative are terms often
used with evaluation, but they may also be used
with testing. Formative testing is done to monitor
students’ attainment of the instructional objectives.
Formative testing occurs over a period of time and
monitors student progress. Summative testing is
done at the conclusion of instruction and
measures the extent to which students have
attained the desired outcomes.
Standardized tests are already valid,
reliable and objective. Standardized tests are tests
for which contents have been selected and for
which norms or standards have been established.
Psychological tests and government national
examinations are examples of standardized tests.
Standards or norms are the goals to be
achieved expressed in terms of the average
performance of the population tested.
Criterion-referenced measure is a measuring
device with a predetermined level of success or
standard on the part of the test-takers. For example, a
level of 75 percent score in all the items could be
considered a satisfactory performance.
Norm-referenced measure is a test that is
scored on the basis of the norm or standard level of
accomplishment by the whole group taking the test.
The grades of the students are based on the normal
curve of distribution.
CRITERIA OF A GOOD
EXAMINATION
 A good examination must pass the following criteria:
Validity
Validity refers to the degree to which a test measures
what it is intended to measure. It is the usefulness of the test for
a given measure. A valid test is always reliable. To test the
validity of a test it is to be pretested in order to determine if it
really measures what it intends to measure or what it purports
to measure.
Reliability
Reliability pertains to the degree to which a test
measures what it suppose to measure. The test of
reliability is the consistency of the results when it is
administered to different groups of individuals with similar
characteristics in different places at different time. Also, the
results are almost similar when the test is given to the
same group of individuals at different days and the
coefficient of correlation is not less than 0.85.
Objectivity
Objectivity is the degree to which personal
bias is eliminated in the scoring of the answers.
When we refer to the quality of measurement,
essentially we mean the amount of information
contained in a score generated by the
measurement. Measures of student instructional
outcomes are rarely as precise as those of
physical characteristics such as height and
weight.
Student outcomes are more difficult to define, and
the units of measurement are usually not physical
units. The measures we take on students vary in
quality, which prompts the need for different
scales of measurement. Terms that describe the
levels of measurement in these scales are
nominal, ordinal, interval, and ratio.
Measurements may differ in the amount of
information the numbers contain. These differences
are distinguished by the terms nominal, ordinal,
interval and ratio scales of measurement.
The terms nominal, ordinal, interval and ratio
actually form a hierarchy. Nominal scales of
measurement are the least sophisticated and contain
the least information. Ordinal, interval, and ratio
scales increase respectively in sophistication.
The arrangement is a hierarchy in the higher levels,
along with additional data. For example, numbers
from an interval scale of measurement contain all of
the information that nominal and ordinal scales
would provide, plus some supplementary input.
However, a ratio scale of the same attribute would
contain even more information than the interval
scale. This idea will become more clear as each
scale of measurement is described.
Nominal Measurement
Nominal scales are the least sophisticated; they merely
classify objects or events by assigning numbers to them. These
numbers are arbitrary and imply no quantification, but the
categories must be mutually exclusive and exhaustive. For
example, one could nominally designate baseball positions by
assigning the pitcher the numeral 1; the catcher, 2; the first
baseman, 3; the second baseman, 4; and so on. These
assignments are arbitrary; no arithmetic of these numbers is
meaningful. For example, 1 plus 2 does not equal 3, because a
pitcher plus a catcher does not equal a first baseman.
Ordinal Measurement
Ordinal scales classify, but they also assign
rank order. An example of ordinal measurement is
ranking individuals in a class according to their
test scores. Student scores could be ordered from
first, second, third, and so forth to the lowest
score. Such a scale gives more information than
nominal measurement, but it still has limitations.
The units of ordinal measurement are most likely unequal.
The number of points separating the first and second
students probably does not equal the number separating
the fifth and sixth students. These unequal units of
measurement are analogous to a ruler in which some
inches are longer than others. Addition and subtraction of
such units yield meaningless numbers.
Interval Measurement
In order to be able to add and subtract scores, we
use interval scales, sometimes called equal interval or
equal unit measurement. This measurement scale
contains the nominal and ordinal properties and is also
characterized by equal units between score points.
Examples include thermometers and calendar years. For
instance, the difference in temperature between 10° and
20° is the same as that between 47° and 57°.
Likewise, the difference in length of time between 1946
and 1948 equals that between 1973 and 1975. these
measures are defined in terms of physical properties such
that the intervals are equal. For example, a year is the time
it takes for the earth to orbit the sun. The advantage of
equal units of measurement is straightforward: Sums and
differences now make sense, both numerically and
logically. Note, however, the zero point in interval
measurement is really an arbitrary decision; for example,
0° does not mean that there is no temperature.
Ratio Measurement
The most sophisticated type of measurement
includes all the preceding properties, but in a ratio scale,
the zero point is not arbitrary; a score of zero includes the
absence of what is being measured. For example, if a
person’s wealth equaled zero, he or she would have no
wealth at all. This is unlike a social studies test, where
missing every items (i.e., receiving a score of zero) may
not indicate the complete absence of social studies
knowledge.
Ratio measurement is rarely achieved in educational
assessment, either in cognitive or affective areas. The
desirability of ratio measurement scales is that they allow
ratio comparisons, such as Ann is 1-1/2 times as tall as her
little sister, Mary. We can seldom say that one’s
intelligences or achievement is 1-1/2 times as great as that
of another person. An IQ of 120 may be 1-1/2 times as
great numerically as an IQ of 80, but a person with an IQ
of 120 is not 1-1/2 times as intelligent as a person with an
IQ of 80.
Note that carefully designed tests over a specified
domain of possible items can approach ratio
measurement. For example, consider an objective
concerning multiplication facts for pairs of numbers less
than 10. In all, there are 45 such combinations. However,
the teacher might randomly select 5 or 10 test problems to
give to a particular student. Then, the proportion of items
that the students get correct could be used to estimate
how many of the 45 possible items the student has
mastered.
If the student answers 4 or 5 items correctly, it is legitimate
to estimate that the student would get 36 of the 45 items
correct if all 45 items were administered. This is possible
because the set of possible items was specifically defined
in the objective, and the test items were a random,
representative sample from that set. Most educational
measurements are better than strictly nominal or ordinal
measures, but few can meet the rigorous requirements of
interval measurement.
Educational testing usually falls, somewhere
between ordinal and interval scales in
sophistication. Fortunately, empirical studies have
shown arithmetic operations on these scales are
appropriate, and the scores do provide adequate
information for most decisions about students and
instruction. Also, as we will see later, certain
procedures can be applied to score with
reasonable confidence.
Norm-Referenced and Criterion Referenced
Measurement
When we contrast norm-referenced measurement
(or testing) with criterion-referenced measurement, we
are basically referring to two different ways of interpreting
information. However, Popham (1998, page 135) points
out that certain characteristics tend to go with each type of
measurement, and it is unlikely that results of norm-
referenced tests are interpreted in criterion-referenced
ways and vice versa.
Norm-referenced interpretation historically has been used
in education; norm-referenced tests continue to comprise a
substantial portion of the measurement in today’s schools. The
terminology of criterion-referenced measurements has existed
for close to three decades, having been formally introduced with
Glaser’s (1963) classic article. Over the measurement applies in
the classroom. Do not infer that just because a test is published,
it will necessarily be norm-referenced, or if teacher-constructed,
criterion-referenced. Again, we emphasize that the type of
measurement or testing depends on how the scores are
interpreted. Both types can be used effectively by the teacher.
Norm-Referenced Interpretation
Norm-referenced interpretation stems from the
desire to differentiate among individuals or to
discriminate among the individuals of some defined
group on whatever is being measured. In norm-
referenced measurement, an individual’s score is
interpreted by comparing it to the scores of a defined
group, often called the normative group. Norms
represent the scores earned by one or more groups of
students who have taken the test.
Norm-referenced interpretation is a relative
interpretation based on an individual’s position with respect
to some group, often called the normative group. Norms
consist of the scores, usually in some form of descriptive
statistics, of the normative group.
In norm-referenced interpretation, the individual’s
position in the normative group is of concern; thus, this
kind of positioning does not specify the performance in
absolute terms. The norm being used is the basis of
comparison and the individual score is designated by its
position in the normative group.
Achievement Test as An Example. Most standardized
achievement tests, especially those covering several skills and
academic areas, are primarily designed for norm-referenced
interpretations. However, the form of results and the
interpretations of these tests are somewhat complex and require
concepts not yet introduced in this text. Scores on teacher-
constructed tests are often given norm-referenced
interpretations. Grading on the performance measure. Specified
percentages of scores are assigned the different grades, and an
individual’s score is positioned in the distribution of scores. (We
mention this only as an example; we do not endorse this
procedure.)
Suppose an algebra teacher has a total of 150
students in five classes, and the classes have a common
final examination. The teacher decides that the distribution
of letter grades assigned to the final examination
performance will be 10 percent As, 20 percent Bs, 40
percent Cs, 20 percent Ds, and 10 percent Fs. (note that
the final examination grade is not necessarily the course
grade.) Since the grading is based on all 150 scores, do
not assume that 3 students in each class will receive As,
on the final examination.
James receives a score on the final exam such that 21
students have higher scores and 128 students have lower
scores. What will James’s letter grade be on the exam? The top
15 scores will receive As, and the next 30 scores (20 percent of
150) will receive Bs. Counting from the top score down, James’s
score is positioned 22nd, so he will receive a B on the final
examination. Note that in this interpretation example, we did not
specify James’s actual numerical score on the exam. That
would have been necessary in order to determine that his score
positioned 22nd in the group of 150 score. But in terms of the
interpretation of the score, it was based strictly on its position in
the total group of scores.
Criterion-Referenced Interpretation
The concepts of criterion-referenced testing have
developed with a dual meaning for criterion-referenced. On
one hand, it means referencing an individual’s
performance to some criterion that is a defined
performance level. The individual’s score is interpreted in
absolute rather than relative terms. The criterion, in this
situation, means some level of specified performance that
has been determined independently of how others might
perform.
A second meaning for criterion-referenced involves
the idea of a defined behavioral domain—that is, defined
body of learner behaviors. The learner’s performance on a
test is referenced to a specifically defined group of
behaviors. The criterion in this situation is the desired
behaviors.
Criterion-referenced interpretation is an absolute
rather than relative interpretation, referenced to a defined
body of learner behaviors, or, as is commonly done, to
some specified level of performance.
Criterion-referenced tests require the specification of
learner behaviors prior to constructing the test. The
behaviors should be readily identifiable from instructional
objectives. Criterion-referenced tests tend to focus on
specific learner behaviors, and usually only a limited
number are covered on any one test.
Suppose before the test is administered an 80-
percent-correct criterion is established as the minimum
performance required for mastery of each objective.
A student who does not attain the criterion has not
mastered the skill sufficiently to move ahead in the
instructional sequence. To a large extent, the
criterion is based on teacher judgment. No
magical, universal criterion for mastery exists,
although some curriculum materials that contain
criterion-referenced tests do suggest criteria for
mastery. Also, unless objectives are appropriate
and the criterion, regardless of what it is.
Distinctions between Norm-Referenced and
Criterion-Referenced Tests
Although interpretations, not characteristics,
provide the distinction between norm-referenced and
criterion-referenced tests, the two types do tend to
differ in some ways. Norm-referenced tests are
usually more general and comprehensive and cover a
large domain of content and learning tasks. They are
used for survey testing, although this is not their
exclusive use.
Criterion-referenced tests focus on a specific group
of learner behaviors. To show the contrast, consider an
example. Arithmetic skills represent a general and broad
category of student outcomes and would likely be
measured by a norm-referenced test. On the other hand,
behaviors such as solving addition problems with two five-
digit numbers or determining the multiplication products of
three-and four digit numbers are much more specific and
may be measured by criterion-referenced tests.
A criterion-referenced test tends to focus more on
sub skills than on broad skills. Thus, criterion-referenced
tests tend to be shorter. If mastery learning is involved,
criterion-referenced measurement would be used.
Norm-referenced test scores are transformed to
positions within the normative group. Criterion-referenced
test scores are usually given in the percentage of correct
answers or another indicator of mastery or the lack thereof.
Criterion-referenced tests tend to lend themselves more to
individualizing instruction than do norm-referenced tests.
In individualizing instruction, a student’s performance is
interpreted more appropriately by comparison to the
desired behaviors for that particular student, rather than by
comparison with the performance of a group.
Norm-referenced test items tend to be of average
difficulty. Criterion-referenced tests have item difficulty
matched to the learning tasks. This distinction in item
difficulty is necessary because norm-referenced tests
emphasize the discrimination among individuals and
criterion-referenced tests emphasize the description of
performance. Easy items, for example, do little for
discriminating among individuals, but they may be
necessary for describing performance.
Finally, when measuring attitudes, interests, and
aptitudes, it is practically impossible to interpret the results
without comparing them to a reference group. The
reference groups in such cases are usually typical
students or students with high interests in certain areas.
Teachers have no basis for anticipating these
kinds of scores; therefore, in order to ascribe
meaning to such a score, a referent group must
be used. For instance, a score of 80 on an interest
inventory has no meaning in itself. On the other
hand, if a score of 80 is the typical response by a
group interested in mechanical areas, the score
takes on meaning.
STAGES IN TEST
CONSTRUCTION
I. Planning the Test
A. Determining the Objectives
B. Preparing the Table of Specifications
C. Selecting the Appropriate Item Format
D. Writing the Test Items
E. Editing the Test Items
II. Trying Out the Test
A. Administering the First Tryout – then Item
Analysis
B. Administering the Second Tryout – then Item
Analysis
C. Preparing the Final Form of the Test
III. Establishing Test Validity
IV. Establishing the Test Reliability
V. Interpreting the Test Score
MAJOR CONSIDERATIONS IN
TEST CONSTRUCTION
 The following are the major considerations in test
construction:
Type of Test
Our usual idea of testing is an in-class test that is
administered by the teacher. However, there are many
variations on this theme: group tests, individual tests,
written tests, oral tests, speed tests, power tests, pretests
and post tests. Each of these has different characteristics
that must be considered when the tests are planned.
If it is a take-home test rather than an in-class
test, how do you make sure that students work
independently, have equal access to sources and
resources, or spend a sufficient but not enormous
amount of time on the task? If it is a pretest, should it
exactly match the past test so that a gain score can
be computed, or should the pretest contain items that
are diagnostic of prerequisite skills and knowledge? If
it is an achievement test, should partial credit be
awarded, should there be penalties for guessing, or
should points be deducted for grammar and spelling
errors?
Obviously, the test plan must include a wide array of
issues. Anticipating these potential problems allows the
test constructor to develop positions or policies that are
consistent with his or her testing philosophy. These can
then be communicated to students, administrators,
parents, and others who may be affected by the testing
program. Make a list of the objectives, the subject matter
taught and the activities undertaken. These are contained
in the daily lesson plans of the teacher and in the
references or textbook used.
Such tests are usually very indirect methods that only
approximate real-world applications. The constraints in
classroom testing are often due to time and the development
level of the students.
Test Length
A major decision in the test planning is how many items
should be included on the test. There should be enough to cover
the content adequately, but the length of the class period or the
attention span or fatigue limits of the students usually restrict the
test length. Decisions about test length are usually based on
practical constraints more than on theoretical considerations.
Most teachers want test scores to be
determined by how much the student understands
rather than by how quickly he or she answers the
questions. Thus, teachers prefer power tests,
where at least 90 percent of the students have
time to attempt 90 percent of the test items. Just
how many items will fit into a given test occasion
is something that is learned through experience
with similar groups of students.
Item Formats
Determining what kind of terms to include on the test is a
major decision. Should they be objectively scored formats such
as multiple choice or matching type? Should they cause the
students to organize their own thoughts through short answer or
essay formats? These are important questions that can be
answered only by the teacher in terms of the local context, his
or her students, his or her classroom, and the specific purpose
of the test. Once the planning decisions are made, the item
writing begins. This tank is often the most feared by the
beginning test constructors. However, the procedures are more
common sense than formal rules.
POINTS TO BE CONSIDERED
IN PREPARING A TEST
1. Are the instructional objectives clearly defined?
2. What knowledge, skills and attitudes do you want to
measure?
3. Did you prepare a table of specifications?
4. Did you formulate well defined and clear test items?
5. Did you employ correct English in writing the items?
6. Did you avoid giving clues to the correct answer?
7. Did you test the important ideas rather than the trivial?
8. Did you adapt the test’s difficulty to your student’s
ability?
9. Did you avoid using textbooks jargons?
10 Did you cast the items in positive form?
11. Did you prepare a scoring key?
12. Does each item have a single correct answer?
13. Did you review your items?
GENERAL PRINCIPLES IN
CONSTRUCTING DIFFERENT
TYPES OF TESTS
1. The test items should be selected very carefully. Only
important facts should be included.
2. The test should have extensive sampling of items.
3. The test items should be carefully expressed in
simple, clear, definite, and meaningful sentences.
4. There should be only one possible correct response
for each test item.
5. Each item should be independent. Leading clues to
other items should be avoided.
6. Lifting sentences from books should not be done to
encourage thinking and understanding.
7. The first person personal pronouns/and we should not
be used.
8. Various types of test items should be made to avoid
monotony.
9. Majority of the test items should be of moderate
difficulty. Dew difficult and few easy items should be
included.
10. The test items should be arranged in an ascending
order of difficulty. Easy items should be at the beginning to
encourage the examinee to pursue the test and the most
difficult items should be at the end.
11. Clear, concise, and complete directions should precede
all types of test. Sample test items may be provided for
expected responses.
12. Items which can be answered by previous experience
alone without knowledge of the subject matter should not
be included.
13. Catchy words should not be used in the test items.
14. Test items must be based upon the objectives of
the course and upon the course content.
15. The test should measure the degree of
achievement or determine the difficulties of the
learners.
16. The test should emphasize ability to apply and
use facts as well as knowledge of facts.
17. The test should be of such length that it can be
completed within the time allotted by all or nearly all of the
pupils. The teacher should perform the test herself to
determine its approximate time allotment.
18. Rules governing good language expression, grammar,
spelling, punctuation, and capitalization should be
observed in all items
19. Information on how scoring will be done should be
provided.
20. Scoring Keys in correcting and scoring tests should be
provided.
POINTERS TO BE OBSERVED IN
CONSTRUCTING AND SCORING
THE DIFFERENT TUPES OF TESTS
A. RECALL TYPES
1. Simple recall type
a. This type consists of questions calling for a single
word or expression as an answer.
b. Items usually begin with who, where, when, and
what.
c. Score is the number of correct answers.
2. Completion type
a. Only important words or phrases should be
omitted to avoid confusion.
b. Blanks should be of equal lengths.
c. The blank, as much as possible, is placed near
or at the end of the sentence.
d. Articles a, an, and the should not be provided
before the omitted word or phrase to avoid clues for
answers.
e. Score is the number of correct answers.
3. Enumeration type
a. The exact number of expected answers should
be stated.
b. Blanks should be of equal lengths.
c. Score is the number of correct answers.
4. Identification type
a. The items should make an examinee think of a
word, number, or group of words that would complete the
statement or answer the problem.
b. Score is the number of correct answers.
B. RECOGNITION TYPES
1. True-false or alternate-response type
a. Declarative sentences should be used.
b. The number of “true” and “false” items should be more
or less equal.
c. The truth or falsity of the sentence should not be too
evident.
d. Negative statements should be avoided.
e. The “modified true-false” is more preferable than the
“plain true-false”.
f. In arranging the items, avoid the regular recurrence of
“true” and “false” statements.
g. Avoid using specific determiners like: all, always, never,
none, nothing, most, often, some, etc. and avoid weak
statements as may, sometimes, as a rule, in general etc.
h. Minimize the use of qualitative terms like: few, great,
many, more, etc.
i. Avoid leading clues to answers in all items.
j. Score is the number of correct answers in “modified true-
false and right answers minus wrong answers in “plain
true-false”.
2. Yes-No type
a. The items should be in interrogative sentences.
b. The same rules as in “true-false” are applied.
3. Multiple-response type
a. There should be three to five choices. The number of
choices used in the first item should be the same number
of choices in all the items of this type of test.
b. The choices should be numbered or lettered so that only
the number or letter can be written on the blank provided.
c. If the choices are figures, they should be arranged in
ascending order.
d. Avoid the use of “a” or “an” as the last word prior to the listing
of the responses.
e. Random occurrence of responses should be employed.
f. The choices, as much as possible, should be at the end of the
statements.
g. The choices should be related in some way or should belong
to the same class.
h. Avoid the use of “none of these” as one of the choices.
i. Score is the number of correct answers.
4. Best answer type
a. There should be three to five choices all of which are right but
vary in their degree of merit, importance or desirability.
b. The other rules for multiple-response items are applied here.
c. Score is the number of correct answers.
5. Matching type
a. There should be two columns. Under “A” are the stimuli which
should be longer and more descriptive than the responses
under column “B”. The response may be a word, a phrase, a
number, or a formula.
b. The stimuli under column “A” should be numbered and
the responses under column “B” should be lettered.
Answers will be indicated by letters only on lines provided
in column “A”.
c. The number of pairs usually should not exceed twenty
items. Less than ten introduces chance elements. Twenty
pairs may be used but more than twenty is decidedly
wasteful of time.
d. The number of responses in column “B” should be two
or more than the number of items in Column “A” to avoid
guessing.
e. Only one correct matching for each item should
be possible.
f. Matching sets should neither be too long nor too
short.
g. All items should be on the same page to avoid
turning of pages in the process of matching pairs.
h. Score is the number of correct answers.
C. ESSAY TYPE EXAMINATIONS
Common types of essay questions.(The types are
related to purposes of which the essay examinations are to
be used.)
1. Comparison of two things
2. Explanation of the use or meaning of a statement
or passage.
3. Analysis
4. Decisions for or against
5. Discussion
How to construct essay examinations.
1. Determine the objectives or essentials for each question to be
evaluated.
2. Phrase questions in simple, clear and concise language.
3. Suit the length of the questions to the time available for
answering the essay examination. The teacher should try to
answer the test herself,
4. Scoring:
a. Have a model answer in advance.
b. Indicate the number of points for each question.
c. Score a point for each essential.
ADVANTAGES AND
DISADVANTAGES OF THE
OBJECTIVE TYPE OF TESTS
Advantages
a. The objective test is free from personal bias in scoring.
b. It is easy to score. With a scoring key, the test can be
corrected by different individuals without affecting the accuracy of the
grades given.
c. It has high validity because it is comprehensive with wide
sampling of essentials.
d. It is less time-consuming since many items can be answered
in a given time.
e. It is fair to students since the slow writers can accomplish
the test as fast as the fast writers.
Disadvantages
a. It is difficult to construct and requires more
time to prepare.
b. It does not afford the students the
opportunity in training for self- and thought
organization.
c. It cannot be used to test ability in theme
writing or journalistic writing.
ADVANTAGES AND
DISADVANTAGES OF THE
ESSAY TYPE OF TESTS
Advantages
a. The essay examination can be used in practically all
subjects of the school curriculum.
b. It trains students for thought organization and self
expression.
c. It affords students opportunities to express their
originality and independence of thinking.
d. Only the essay test can be used in some subjects like
composition writing journalistic writing which cannot be tested
the objective type test.
e. Essay examination measures higher mental abilities
comparison, interpretation, criticism, defense of opinion and
decision
f. The essay test is easily prepared.
g. It is inexpensive.
Disadvantages
a. The limited sampling of items makes the test unreliable
measure of achievements or abilities.
b. Questions usually are not well prepared.
c. Scoring is highly subjective due to the influence of the
corrector's personal judgment.
d. Grading of the essay test is inaccurate measure pupils'
achievements due to subjectivity of scoring.
STATISTICAL MEASURES OR
TOOLS USED IN
INTERPRETING NUMERICAL
DATA
Frequency Distributions
A simple, common sense technique for describing a
set of test scores is through the use of frequency
distribution. A frequency distribution is merely listing of
the possible score values and the number of persons who
achieved each scores. Such an arrangement presents the
scores in a more simple and understandable manner than
merely listing all of the separate scores. Consider a
specific set of scores to clarify these ideas.
A set of scores for a group of 25 students who took a 50-
item test is listed in Table 1. It is easier to analyze the scores if
they are arranged in a simple frequency distribution. (The
frequency distribution for the same set of score is given in Table
2). The steps that are involved in creating the frequency
distribution are:
First, list the possible score values in rank order, from
highest to lowest. Then, a second column indicates the
frequency or number of persons who received each score. For
example, three students received a score of 47, two received
40, and so forth. There is no need to list score values below the
lowest score that anyone received.
ASSESSMENT OF
LEARNING
When there is a wide range of scores in a frequency
distribution, the distribution can be quite long , with a lot of
zeros in the column of frequencies. Such a frequency
distribution can make interpretation difficult and confusing.
A grouped frequency distribution would be more
appropriate in this kind of situation. Groups of score
values are listed rather than each separate possible score
value.
If we were to change the frequency distribution and
Table 2 into a grouped frequency distribution, we might
choose intervals such as 48 -50 , 45 -47, and so forth. The
frequency corresponding to intervals 48 -50 would be 9 (1
+ 3 + 5). The choice of width of the interval is arbitrary, but
it must be the same for all intervals. In addition, it is a good
idea to have an odd-numbered interval width (we used 3
above) so that the midpoint of the interval is a whole
number. This strategy will simplify subsequent graphs at
description of data. The grouped frequency distribution is
presented in Table 3.
Frequency distributions summarize sets of test scores by listing
the number of people who received each test score. All of the test
scores can be listed separately, or the scores can be grouped in a
frequency distribution.
MEASURES OF CENTRAL TENDENCY
Frequency distributions are helpful for indicating the shape to
describe a distributions of scores, but we need more information than
the shape to describe a distribution adequately. We need to know
where on the scale of measurement a distribution is located and how
the scores are dispersed in the distribution. For the former, we
compute measures of central tendency, and for the latter, we
compute measures of dispersion. Measures of central tendency are
points of the scale of measurement, and they are representative of
how the scores tend to average. There are three commonly used
measures of central tendency: the mean, the median, and the mode,
but the mean is by far the most widely used .
The Mean
The mean of a set of scores is the arithmetic
mean. It is found by summing the scores and
dividing the sum by the number of scores . The
mean is the most commonly used measure of
central tendency because it is easily understood
and is based on all the scores in the set; hence ,
it summarizes a lot of information. The formula of
the mean is as follows.
The Median
Another measure of central tendency is the median
which is the point that divides distribution in half; that is,
half of the scores fall above the median and half of the
scores fall below the median.
When there are only a few scores, the median can
often be found by inspection. If there is an odd number of
scores, the middle score is the median. When there is
even a number of scores, the median is halfway between
the two middle scores . However, when they are tied
scores in the middle of the distribution, or when the scores
are in a frequency distribution, the median may not be so
obvious.
Consider again the frequency distribution in
Table 2. There were 25 scores in the distribution,
so the middle score should be the median. A
straightforward way to find this median is to
augment the frequency distribution with a column
of cumulative frequencies. Cumulative frequencies
indicate the number of scores at or below each
score. Table 4 indicates the cumulative
frequencies for the data in Table 2.
For example, 7 persons scored at or below a score of
40, and 21 persons scored at or below a score of 48.
To find the median, we need to locate the middle score in
the cumulative frequency column, because this score is the
median. Since there are 25 scores in the distribution, the middle
one is the 13th, a score of 46. Thus, 46 is a median of this
distribution; half of the people scored above 46 and half scored.
When there are ties in the middle of the distribution, there
may be a need to interpolate between scores to get the exact
median. However, such precision is not needed for most
classroom tests. The whole number closest to the median is
usually sufficient.
The Mode
The measure of central tendency that is the easiest to
find is the mode. The mode is the most frequently occurring
score in the distribution. The mode of the scores in Table 1 is
48. Five persons had two scores of 48 and no other score
occurred as often.
Each of these three measures of central tendency - the
mean, the median, and the mode means a legitimate definition
of “average” performance on this test. However, each does
provide different information. The arithmetic average was 44;
half the people scored at or below 46 and more people received
48 than any other score.
There are some distributions in which all three measures of
central tendency are equal, but more often than not they will be
different. The choice of which measure of central tendency is best will
differ from situation to situation. The mean is used most often, perhaps
because it includes information from all of the scores.
When a distribution has a small number of very extreme
scores, though, the median may be a better definition of central
tendency. The mode provides the least information and is used
infrequently as “average”. The mode can be used with nominal scale
data, just as an indicator of the most frequently appearing category.
The mean, the median, and the mode all describe central tendency:
 The mean is the arithmetic average.
 The median divides the distribution in half.
 The mode is the most frequent score.
MEASURES OF
DISPERSION
Measures of central tendency are useful for summarizing
average performance, but they tell us nothing about how the
scores are distributed or “spread out” around the averages . Two
sets of test scores may have equal measures of central
tendency, but they may differ in other ways. One of the
distributions may have the scores tightly clustered around the
average, and the other distribution may have scores that are
widely separated. As you may have anticipated, there are
descriptive statistics that measure dispersion, which also are
called measures of variability. These measures indicate how
spread out the scores tend to be.
The Range
The range indicates the difference between the highest
and lowest scores in a distribution. It is simple to calculate, but it
provides limited information. We subtract the lowest from the
highest score and add 1 so that we include both scores in the
spread between them. For the scores of Table 2, the range is
50 - 34 + 1 = 17.
A problem with using the range is that only the two most
extreme scores are used in this computation. There is no
indication of the spread of scores between highest and lowest.
Measures of dispersion that take into consideration every score
in the distribution are the variance and standard deviation. The
standard deviation is used a great deal in interpreting scores
from standardized tests.
The Variance
The variance measures how widely the scores in the
distribution are spread about the mean . In other words,
the variance is the average squared difference between
the scores and the mean. As a formula, it looks like this:
The computation of the variance for the scores of
Table 1 is illustrated in Table 5. The data for the students
K through V are omitted to save space, but these values
are included in the column totals and in the computation.
The Standard Deviation
The standard deviation also indicates how spread
out the scores are, but is expressed in the same units as
original scores. The standard deviation is computed by
finding the square root of the variance.
S = S2
For the data in Table 1, the variance is 22.8. The
standard deviation is 22.8, or 4.77. The scores of most norm
groups have the shape of a “normal” distribution- a symmetrical
bell-shaped distribution with which most people are familiar.
With a normal distribution, about 95 percent of the scores are
within two standard deviations of the mean.
Even when scores are not normally distributed, most of
the scores will be within two standard deviations of the mean. In
the example, the mean minus two standard deviations is 34.46,
and the mean plus two standard deviations is 53.54. Therefore,
only one score is outside of this interval; the lowest score, 34, is
slightly more than two standard deviations from the mean.
Graphing Distributions
A graph of distribution of test course is often better understood
than is the frequency distribution or a mere table of numbers. The
general pattern of scores, as well as any unique characteristics of the
distribution, can be seen easily in simple graphs. There are several
kinds of graphs that can be used, but a simple bar graph, or histogram,
is as useful as any.
The general shape of the distribution is clear from the graph.
Most of the scores in this distribution are high, at the upper end of the
graph. Such a shape is quite common for the scores of classroom tests.
That is, test scores will be grouped toward the right end of the
measurement scale.
A normal distribution has most of the test scores in the middle of
the distribution and progressively fewer scores toward extremes. The
scores of norm groups are seldom graphed but they could be if we
were concerned about seeing the specific shape of the distribution of
scores. Usually, we know or assume that the scores are normally
distributed.
Source: Reviewer for the Licensure
Examination for Teachers (LET) by MANILA
REVIEW INSTITUTE, inc> AND CECILIO D.
DUKA

More Related Content

What's hot

Assessment of learning by lorna reyes et.al
Assessment of learning by lorna reyes et.alAssessment of learning by lorna reyes et.al
Assessment of learning by lorna reyes et.al
Lorna Reyes
 
Formative Assessment vs. Summative Assessment
Formative Assessment vs. Summative AssessmentFormative Assessment vs. Summative Assessment
Formative Assessment vs. Summative Assessment
jcheek2008
 
What are the different assessment types?
What are the different assessment types?What are the different assessment types?
What are the different assessment types?
Jarrod Main
 
Assessment of student's learning a practical approach chapter 1 - (04-july-...
Assessment of student's learning   a practical approach chapter 1 - (04-july-...Assessment of student's learning   a practical approach chapter 1 - (04-july-...
Assessment of student's learning a practical approach chapter 1 - (04-july-...
Engr. Maria Reza Nebril
 
Properties of Assessment Methods
Properties of Assessment MethodsProperties of Assessment Methods
Properties of Assessment Methods
Monica Angeles
 
Assessment of learning
Assessment of learningAssessment of learning
Assessment of learning
sallyreyes
 

What's hot (20)

Assessment for Learning [RELO Andes Webinar]
Assessment for Learning [RELO Andes Webinar]Assessment for Learning [RELO Andes Webinar]
Assessment for Learning [RELO Andes Webinar]
 
Assessment of learning by lorna reyes et.al
Assessment of learning by lorna reyes et.alAssessment of learning by lorna reyes et.al
Assessment of learning by lorna reyes et.al
 
Test and Assessment Types
Test and Assessment TypesTest and Assessment Types
Test and Assessment Types
 
Guiding Principles for the Assessment of Student Learning
Guiding Principles for the Assessment of Student LearningGuiding Principles for the Assessment of Student Learning
Guiding Principles for the Assessment of Student Learning
 
Types of Assessment
Types of AssessmentTypes of Assessment
Types of Assessment
 
Assessment of Learning - Guiding Principles and Tools Used
Assessment of Learning - Guiding Principles and Tools UsedAssessment of Learning - Guiding Principles and Tools Used
Assessment of Learning - Guiding Principles and Tools Used
 
Assessment of Learning
Assessment of LearningAssessment of Learning
Assessment of Learning
 
Formative Assessment vs. Summative Assessment
Formative Assessment vs. Summative AssessmentFormative Assessment vs. Summative Assessment
Formative Assessment vs. Summative Assessment
 
Diagnostic testing & remedial teaching
Diagnostic testing & remedial teachingDiagnostic testing & remedial teaching
Diagnostic testing & remedial teaching
 
What are the different assessment types?
What are the different assessment types?What are the different assessment types?
What are the different assessment types?
 
Assessment for learning
Assessment for learningAssessment for learning
Assessment for learning
 
Assessment of student's learning a practical approach chapter 1 - (04-july-...
Assessment of student's learning   a practical approach chapter 1 - (04-july-...Assessment of student's learning   a practical approach chapter 1 - (04-july-...
Assessment of student's learning a practical approach chapter 1 - (04-july-...
 
Matching assessment methods with the learning targets
Matching assessment methods with the learning targetsMatching assessment methods with the learning targets
Matching assessment methods with the learning targets
 
Properties of Assessment Methods
Properties of Assessment MethodsProperties of Assessment Methods
Properties of Assessment Methods
 
5 construction of diagnostic test
5 construction of diagnostic test5 construction of diagnostic test
5 construction of diagnostic test
 
Assessing learning outcomes objectives
Assessing learning outcomes objectivesAssessing learning outcomes objectives
Assessing learning outcomes objectives
 
Measurement, Evaluation, Assessment, and Tests
Measurement, Evaluation, Assessment, and TestsMeasurement, Evaluation, Assessment, and Tests
Measurement, Evaluation, Assessment, and Tests
 
12 Principles of High Quality Assessments (RE-UPLOADED)
12 Principles of High Quality Assessments (RE-UPLOADED)12 Principles of High Quality Assessments (RE-UPLOADED)
12 Principles of High Quality Assessments (RE-UPLOADED)
 
Assessment of learning
Assessment of learningAssessment of learning
Assessment of learning
 
Ed8 Assessment of Learning 2
Ed8 Assessment of Learning 2 Ed8 Assessment of Learning 2
Ed8 Assessment of Learning 2
 

Similar to ASSESSMENT OF LEARNING

A.4.BENITEZ.NANCY.CATEDRA INTEGRADORA NRC5653.pptx
A.4.BENITEZ.NANCY.CATEDRA INTEGRADORA NRC5653.pptxA.4.BENITEZ.NANCY.CATEDRA INTEGRADORA NRC5653.pptx
A.4.BENITEZ.NANCY.CATEDRA INTEGRADORA NRC5653.pptx
rocio123gr
 
1reviewofhighqualityassessment.pptx
1reviewofhighqualityassessment.pptx1reviewofhighqualityassessment.pptx
1reviewofhighqualityassessment.pptx
CamposJansen
 
Evaluation and measurement nursing education
Evaluation and measurement nursing educationEvaluation and measurement nursing education
Evaluation and measurement nursing education
parvathysree
 
Evaluate student’s performance.pptx
Evaluate student’s performance.pptxEvaluate student’s performance.pptx
Evaluate student’s performance.pptx
Javptt
 

Similar to ASSESSMENT OF LEARNING (20)

Educational Technology and Assessment of Learning
Educational Technology and Assessment of LearningEducational Technology and Assessment of Learning
Educational Technology and Assessment of Learning
 
EDUCATIONAL TECHNOLOGY AND ASSESSMENT OF LEARNING
EDUCATIONAL TECHNOLOGY AND ASSESSMENT OF LEARNINGEDUCATIONAL TECHNOLOGY AND ASSESSMENT OF LEARNING
EDUCATIONAL TECHNOLOGY AND ASSESSMENT OF LEARNING
 
EDUCATIONAL TECHNOLOGY AND ASSESSMENT OF LEARNING
EDUCATIONAL TECHNOLOGY AND ASSESSMENT OF LEARNINGEDUCATIONAL TECHNOLOGY AND ASSESSMENT OF LEARNING
EDUCATIONAL TECHNOLOGY AND ASSESSMENT OF LEARNING
 
Assessment of Learning
Assessment of LearningAssessment of Learning
Assessment of Learning
 
Assessment of learning
Assessment of learningAssessment of learning
Assessment of learning
 
Assessment of learning and educational technology ed 09 ocampos
Assessment of learning and educational technology ed   09 ocamposAssessment of learning and educational technology ed   09 ocampos
Assessment of learning and educational technology ed 09 ocampos
 
Assessment of learning and Educational Technology
Assessment of learning and Educational Technology Assessment of learning and Educational Technology
Assessment of learning and Educational Technology
 
Educational technology-assessment-of-learning-and-statistical-measures-ed-09-...
Educational technology-assessment-of-learning-and-statistical-measures-ed-09-...Educational technology-assessment-of-learning-and-statistical-measures-ed-09-...
Educational technology-assessment-of-learning-and-statistical-measures-ed-09-...
 
Educational Technology and Assessment of Learning
Educational Technology and Assessment of LearningEducational Technology and Assessment of Learning
Educational Technology and Assessment of Learning
 
Assessment of Learning
Assessment of LearningAssessment of Learning
Assessment of Learning
 
CHAPTER 2.pptx
CHAPTER 2.pptxCHAPTER 2.pptx
CHAPTER 2.pptx
 
Assessment of learning ( Anna Marie Pajara
Assessment of learning ( Anna Marie PajaraAssessment of learning ( Anna Marie Pajara
Assessment of learning ( Anna Marie Pajara
 
Measurement & Evaluation pptx
Measurement & Evaluation pptxMeasurement & Evaluation pptx
Measurement & Evaluation pptx
 
Educational Evaluation for Special Education
Educational Evaluation for Special EducationEducational Evaluation for Special Education
Educational Evaluation for Special Education
 
Evaluation: Determining the Effect of the Intervention
Evaluation: Determining the Effect of the Intervention Evaluation: Determining the Effect of the Intervention
Evaluation: Determining the Effect of the Intervention
 
Professional Education 6 - Assessment of Learning 1
Professional Education 6 - Assessment of Learning 1Professional Education 6 - Assessment of Learning 1
Professional Education 6 - Assessment of Learning 1
 
A.4.BENITEZ.NANCY.CATEDRA INTEGRADORA NRC5653.pptx
A.4.BENITEZ.NANCY.CATEDRA INTEGRADORA NRC5653.pptxA.4.BENITEZ.NANCY.CATEDRA INTEGRADORA NRC5653.pptx
A.4.BENITEZ.NANCY.CATEDRA INTEGRADORA NRC5653.pptx
 
1reviewofhighqualityassessment.pptx
1reviewofhighqualityassessment.pptx1reviewofhighqualityassessment.pptx
1reviewofhighqualityassessment.pptx
 
Evaluation and measurement nursing education
Evaluation and measurement nursing educationEvaluation and measurement nursing education
Evaluation and measurement nursing education
 
Evaluate student’s performance.pptx
Evaluate student’s performance.pptxEvaluate student’s performance.pptx
Evaluate student’s performance.pptx
 

Recently uploaded

Recently uploaded (20)

HMCS Vancouver Pre-Deployment Brief - May 2024 (Web Version).pptx
HMCS Vancouver Pre-Deployment Brief - May 2024 (Web Version).pptxHMCS Vancouver Pre-Deployment Brief - May 2024 (Web Version).pptx
HMCS Vancouver Pre-Deployment Brief - May 2024 (Web Version).pptx
 
ICT role in 21st century education and it's challenges.
ICT role in 21st century education and it's challenges.ICT role in 21st century education and it's challenges.
ICT role in 21st century education and it's challenges.
 
How to Create and Manage Wizard in Odoo 17
How to Create and Manage Wizard in Odoo 17How to Create and Manage Wizard in Odoo 17
How to Create and Manage Wizard in Odoo 17
 
80 ĐỀ THI THỬ TUYỂN SINH TIẾNG ANH VÀO 10 SỞ GD – ĐT THÀNH PHỐ HỒ CHÍ MINH NĂ...
80 ĐỀ THI THỬ TUYỂN SINH TIẾNG ANH VÀO 10 SỞ GD – ĐT THÀNH PHỐ HỒ CHÍ MINH NĂ...80 ĐỀ THI THỬ TUYỂN SINH TIẾNG ANH VÀO 10 SỞ GD – ĐT THÀNH PHỐ HỒ CHÍ MINH NĂ...
80 ĐỀ THI THỬ TUYỂN SINH TIẾNG ANH VÀO 10 SỞ GD – ĐT THÀNH PHỐ HỒ CHÍ MINH NĂ...
 
Fostering Friendships - Enhancing Social Bonds in the Classroom
Fostering Friendships - Enhancing Social Bonds  in the ClassroomFostering Friendships - Enhancing Social Bonds  in the Classroom
Fostering Friendships - Enhancing Social Bonds in the Classroom
 
2024-NATIONAL-LEARNING-CAMP-AND-OTHER.pptx
2024-NATIONAL-LEARNING-CAMP-AND-OTHER.pptx2024-NATIONAL-LEARNING-CAMP-AND-OTHER.pptx
2024-NATIONAL-LEARNING-CAMP-AND-OTHER.pptx
 
Kodo Millet PPT made by Ghanshyam bairwa college of Agriculture kumher bhara...
Kodo Millet  PPT made by Ghanshyam bairwa college of Agriculture kumher bhara...Kodo Millet  PPT made by Ghanshyam bairwa college of Agriculture kumher bhara...
Kodo Millet PPT made by Ghanshyam bairwa college of Agriculture kumher bhara...
 
Understanding Accommodations and Modifications
Understanding  Accommodations and ModificationsUnderstanding  Accommodations and Modifications
Understanding Accommodations and Modifications
 
TỔNG ÔN TẬP THI VÀO LỚP 10 MÔN TIẾNG ANH NĂM HỌC 2023 - 2024 CÓ ĐÁP ÁN (NGỮ Â...
TỔNG ÔN TẬP THI VÀO LỚP 10 MÔN TIẾNG ANH NĂM HỌC 2023 - 2024 CÓ ĐÁP ÁN (NGỮ Â...TỔNG ÔN TẬP THI VÀO LỚP 10 MÔN TIẾNG ANH NĂM HỌC 2023 - 2024 CÓ ĐÁP ÁN (NGỮ Â...
TỔNG ÔN TẬP THI VÀO LỚP 10 MÔN TIẾNG ANH NĂM HỌC 2023 - 2024 CÓ ĐÁP ÁN (NGỮ Â...
 
HMCS Max Bernays Pre-Deployment Brief (May 2024).pptx
HMCS Max Bernays Pre-Deployment Brief (May 2024).pptxHMCS Max Bernays Pre-Deployment Brief (May 2024).pptx
HMCS Max Bernays Pre-Deployment Brief (May 2024).pptx
 
Wellbeing inclusion and digital dystopias.pptx
Wellbeing inclusion and digital dystopias.pptxWellbeing inclusion and digital dystopias.pptx
Wellbeing inclusion and digital dystopias.pptx
 
Sensory_Experience_and_Emotional_Resonance_in_Gabriel_Okaras_The_Piano_and_Th...
Sensory_Experience_and_Emotional_Resonance_in_Gabriel_Okaras_The_Piano_and_Th...Sensory_Experience_and_Emotional_Resonance_in_Gabriel_Okaras_The_Piano_and_Th...
Sensory_Experience_and_Emotional_Resonance_in_Gabriel_Okaras_The_Piano_and_Th...
 
Exploring_the_Narrative_Style_of_Amitav_Ghoshs_Gun_Island.pptx
Exploring_the_Narrative_Style_of_Amitav_Ghoshs_Gun_Island.pptxExploring_the_Narrative_Style_of_Amitav_Ghoshs_Gun_Island.pptx
Exploring_the_Narrative_Style_of_Amitav_Ghoshs_Gun_Island.pptx
 
Jamworks pilot and AI at Jisc (20/03/2024)
Jamworks pilot and AI at Jisc (20/03/2024)Jamworks pilot and AI at Jisc (20/03/2024)
Jamworks pilot and AI at Jisc (20/03/2024)
 
Accessible Digital Futures project (20/03/2024)
Accessible Digital Futures project (20/03/2024)Accessible Digital Futures project (20/03/2024)
Accessible Digital Futures project (20/03/2024)
 
Application orientated numerical on hev.ppt
Application orientated numerical on hev.pptApplication orientated numerical on hev.ppt
Application orientated numerical on hev.ppt
 
SOC 101 Demonstration of Learning Presentation
SOC 101 Demonstration of Learning PresentationSOC 101 Demonstration of Learning Presentation
SOC 101 Demonstration of Learning Presentation
 
Holdier Curriculum Vitae (April 2024).pdf
Holdier Curriculum Vitae (April 2024).pdfHoldier Curriculum Vitae (April 2024).pdf
Holdier Curriculum Vitae (April 2024).pdf
 
NO1 Top Black Magic Specialist In Lahore Black magic In Pakistan Kala Ilam Ex...
NO1 Top Black Magic Specialist In Lahore Black magic In Pakistan Kala Ilam Ex...NO1 Top Black Magic Specialist In Lahore Black magic In Pakistan Kala Ilam Ex...
NO1 Top Black Magic Specialist In Lahore Black magic In Pakistan Kala Ilam Ex...
 
On_Translating_a_Tamil_Poem_by_A_K_Ramanujan.pptx
On_Translating_a_Tamil_Poem_by_A_K_Ramanujan.pptxOn_Translating_a_Tamil_Poem_by_A_K_Ramanujan.pptx
On_Translating_a_Tamil_Poem_by_A_K_Ramanujan.pptx
 

ASSESSMENT OF LEARNING

  • 1. ASSESSMENT OF LEARNING Acero, Wendy Angeli P. BEED – GENERAL EDUCATION III
  • 2. EDUCATIONAL TECHNOLOGY  Audiovisual aids are defined as any device used to aid in the communication of an idea. As such, virtually anything can be used as an audio visual aid provided it successfully communicates the idea or information for which it is designed. An audiovisual aid includes still photography, motion picture, audio or video tape, slide or filmstrip, that is prepared individually or in combination to communicate information or to elicit a desired audience response.
  • 3. Even though early aids, such as maps and drawings, are still in use, advances in the audiovisual field have opened up new methods of presenting these aids, such as videotapes and multimedia equipment which allow more professional and entertaining presentations not only in the classrooms but also anywhere in which ideas are to be conveyed to the audience.
  • 4. DEVICE Device is any means other than the subject-matter itself that is employed by the teacher in presenting the subject matter to the learner. Purpose of Visual Devices 1. To challenge students’ attention 2. To stimulate the imagination and develop the mental imagery of the pupils 3. To facilitate the understanding of the pupils 4. To provide motivation to the learners 5. To develop the ability to listen
  • 5. Traditional Forms of Visual Aids 1. Demonstration 2. Field trips 3. Laboratory experiments 4. Pictures, films, simulations, models 5. Real objects Classification of Devices 1. Extrinsic – used to supplement a method used Ex. Picture, graph, film strips, slides, etc. 2. Intrinsic – used as part of the method or teaching procedure
  • 6. Ex. Pictures accompanying an article 3. Material Devices – device that have no bearing on the subject matter Ex. Blackboard, chalk, books, pencils, etc. 4. Mental Devices – a kind of device that is related in form and the meaning to the subject matter being presented Ex. Questions, projects, drills, lesson plans, etc.
  • 7. NONPROJECTED AUDIOVISUAL AIDS Nonprojected aids are those that do not require the use of audiovisual equipment such as a projector and screen. These include charts, graphs, maps, illustrations, photographs, brochures, and handouts. Charts are commonly used almost everywhere. A chart is a diagram which shows relationships . An organizational chart is one of the most widely and commonly used kind of chart.
  • 8. ASSESSMENT OF LEARNING It focuses on the development and utilization of assessment tools to improve the teaching- learning process. It emphasizes on the use of testing for measuring knowledge, comprehension and other thinking skills. It allows the students to go through the standard steps in test constitution for quality assessment.
  • 9. Students will experience how to develop rubrics for performance-based and portfolio assessment. Measurement refers to the quantitative aspect of evaluation. It involves outcomes that can be quantified statistically. It can also be defined as the process in determining and differentiating the information about the attributes or characteristics of things.
  • 10. Evaluation is the qualitative aspect of determining the outcomes of learning. It involves value judgment. Evaluation is more comprehensive than measurement. In fact, measurement is one aspect of evaluation. Test consists of questions or exercises or other devices for measuring the outcomes of learning.
  • 11. CLASSIFICATION OF TESTS 1. According to manner of response a. oral b. written 2. According to method of preparation a. subjective/essay b. objective
  • 12. 3. According to the nature of answer a. personality tests b. intelligence test c. aptitude test d. achievement or summative test e. sociometric test f. diagnostic or formative test g. trade or vocational test
  • 13. Objective tests are tests which have definite answers and therefore are not subject to personal bias. Teacher-made tests or educational tests are constructed by the teachers based on the contents of different subjects taught. Diagnostic tests are used to measure a student’s strengths and weaknesses, usually to identify deficiencies in skills or performance.
  • 14. Formative and summative are terms often used with evaluation, but they may also be used with testing. Formative testing is done to monitor students’ attainment of the instructional objectives. Formative testing occurs over a period of time and monitors student progress. Summative testing is done at the conclusion of instruction and measures the extent to which students have attained the desired outcomes.
  • 15. Standardized tests are already valid, reliable and objective. Standardized tests are tests for which contents have been selected and for which norms or standards have been established. Psychological tests and government national examinations are examples of standardized tests. Standards or norms are the goals to be achieved expressed in terms of the average performance of the population tested.
  • 16. Criterion-referenced measure is a measuring device with a predetermined level of success or standard on the part of the test-takers. For example, a level of 75 percent score in all the items could be considered a satisfactory performance. Norm-referenced measure is a test that is scored on the basis of the norm or standard level of accomplishment by the whole group taking the test. The grades of the students are based on the normal curve of distribution.
  • 17. CRITERIA OF A GOOD EXAMINATION  A good examination must pass the following criteria: Validity Validity refers to the degree to which a test measures what it is intended to measure. It is the usefulness of the test for a given measure. A valid test is always reliable. To test the validity of a test it is to be pretested in order to determine if it really measures what it intends to measure or what it purports to measure.
  • 18. Reliability Reliability pertains to the degree to which a test measures what it suppose to measure. The test of reliability is the consistency of the results when it is administered to different groups of individuals with similar characteristics in different places at different time. Also, the results are almost similar when the test is given to the same group of individuals at different days and the coefficient of correlation is not less than 0.85.
  • 19. Objectivity Objectivity is the degree to which personal bias is eliminated in the scoring of the answers. When we refer to the quality of measurement, essentially we mean the amount of information contained in a score generated by the measurement. Measures of student instructional outcomes are rarely as precise as those of physical characteristics such as height and weight.
  • 20. Student outcomes are more difficult to define, and the units of measurement are usually not physical units. The measures we take on students vary in quality, which prompts the need for different scales of measurement. Terms that describe the levels of measurement in these scales are nominal, ordinal, interval, and ratio.
  • 21. Measurements may differ in the amount of information the numbers contain. These differences are distinguished by the terms nominal, ordinal, interval and ratio scales of measurement. The terms nominal, ordinal, interval and ratio actually form a hierarchy. Nominal scales of measurement are the least sophisticated and contain the least information. Ordinal, interval, and ratio scales increase respectively in sophistication.
  • 22. The arrangement is a hierarchy in the higher levels, along with additional data. For example, numbers from an interval scale of measurement contain all of the information that nominal and ordinal scales would provide, plus some supplementary input. However, a ratio scale of the same attribute would contain even more information than the interval scale. This idea will become more clear as each scale of measurement is described.
  • 23. Nominal Measurement Nominal scales are the least sophisticated; they merely classify objects or events by assigning numbers to them. These numbers are arbitrary and imply no quantification, but the categories must be mutually exclusive and exhaustive. For example, one could nominally designate baseball positions by assigning the pitcher the numeral 1; the catcher, 2; the first baseman, 3; the second baseman, 4; and so on. These assignments are arbitrary; no arithmetic of these numbers is meaningful. For example, 1 plus 2 does not equal 3, because a pitcher plus a catcher does not equal a first baseman.
  • 24. Ordinal Measurement Ordinal scales classify, but they also assign rank order. An example of ordinal measurement is ranking individuals in a class according to their test scores. Student scores could be ordered from first, second, third, and so forth to the lowest score. Such a scale gives more information than nominal measurement, but it still has limitations.
  • 25. The units of ordinal measurement are most likely unequal. The number of points separating the first and second students probably does not equal the number separating the fifth and sixth students. These unequal units of measurement are analogous to a ruler in which some inches are longer than others. Addition and subtraction of such units yield meaningless numbers.
  • 26. Interval Measurement In order to be able to add and subtract scores, we use interval scales, sometimes called equal interval or equal unit measurement. This measurement scale contains the nominal and ordinal properties and is also characterized by equal units between score points. Examples include thermometers and calendar years. For instance, the difference in temperature between 10° and 20° is the same as that between 47° and 57°.
  • 27. Likewise, the difference in length of time between 1946 and 1948 equals that between 1973 and 1975. these measures are defined in terms of physical properties such that the intervals are equal. For example, a year is the time it takes for the earth to orbit the sun. The advantage of equal units of measurement is straightforward: Sums and differences now make sense, both numerically and logically. Note, however, the zero point in interval measurement is really an arbitrary decision; for example, 0° does not mean that there is no temperature.
  • 28. Ratio Measurement The most sophisticated type of measurement includes all the preceding properties, but in a ratio scale, the zero point is not arbitrary; a score of zero includes the absence of what is being measured. For example, if a person’s wealth equaled zero, he or she would have no wealth at all. This is unlike a social studies test, where missing every items (i.e., receiving a score of zero) may not indicate the complete absence of social studies knowledge.
  • 29. Ratio measurement is rarely achieved in educational assessment, either in cognitive or affective areas. The desirability of ratio measurement scales is that they allow ratio comparisons, such as Ann is 1-1/2 times as tall as her little sister, Mary. We can seldom say that one’s intelligences or achievement is 1-1/2 times as great as that of another person. An IQ of 120 may be 1-1/2 times as great numerically as an IQ of 80, but a person with an IQ of 120 is not 1-1/2 times as intelligent as a person with an IQ of 80.
  • 30. Note that carefully designed tests over a specified domain of possible items can approach ratio measurement. For example, consider an objective concerning multiplication facts for pairs of numbers less than 10. In all, there are 45 such combinations. However, the teacher might randomly select 5 or 10 test problems to give to a particular student. Then, the proportion of items that the students get correct could be used to estimate how many of the 45 possible items the student has mastered.
  • 31. If the student answers 4 or 5 items correctly, it is legitimate to estimate that the student would get 36 of the 45 items correct if all 45 items were administered. This is possible because the set of possible items was specifically defined in the objective, and the test items were a random, representative sample from that set. Most educational measurements are better than strictly nominal or ordinal measures, but few can meet the rigorous requirements of interval measurement.
  • 32. Educational testing usually falls, somewhere between ordinal and interval scales in sophistication. Fortunately, empirical studies have shown arithmetic operations on these scales are appropriate, and the scores do provide adequate information for most decisions about students and instruction. Also, as we will see later, certain procedures can be applied to score with reasonable confidence.
  • 33. Norm-Referenced and Criterion Referenced Measurement When we contrast norm-referenced measurement (or testing) with criterion-referenced measurement, we are basically referring to two different ways of interpreting information. However, Popham (1998, page 135) points out that certain characteristics tend to go with each type of measurement, and it is unlikely that results of norm- referenced tests are interpreted in criterion-referenced ways and vice versa.
  • 34. Norm-referenced interpretation historically has been used in education; norm-referenced tests continue to comprise a substantial portion of the measurement in today’s schools. The terminology of criterion-referenced measurements has existed for close to three decades, having been formally introduced with Glaser’s (1963) classic article. Over the measurement applies in the classroom. Do not infer that just because a test is published, it will necessarily be norm-referenced, or if teacher-constructed, criterion-referenced. Again, we emphasize that the type of measurement or testing depends on how the scores are interpreted. Both types can be used effectively by the teacher.
  • 35. Norm-Referenced Interpretation Norm-referenced interpretation stems from the desire to differentiate among individuals or to discriminate among the individuals of some defined group on whatever is being measured. In norm- referenced measurement, an individual’s score is interpreted by comparing it to the scores of a defined group, often called the normative group. Norms represent the scores earned by one or more groups of students who have taken the test.
  • 36. Norm-referenced interpretation is a relative interpretation based on an individual’s position with respect to some group, often called the normative group. Norms consist of the scores, usually in some form of descriptive statistics, of the normative group. In norm-referenced interpretation, the individual’s position in the normative group is of concern; thus, this kind of positioning does not specify the performance in absolute terms. The norm being used is the basis of comparison and the individual score is designated by its position in the normative group.
  • 37. Achievement Test as An Example. Most standardized achievement tests, especially those covering several skills and academic areas, are primarily designed for norm-referenced interpretations. However, the form of results and the interpretations of these tests are somewhat complex and require concepts not yet introduced in this text. Scores on teacher- constructed tests are often given norm-referenced interpretations. Grading on the performance measure. Specified percentages of scores are assigned the different grades, and an individual’s score is positioned in the distribution of scores. (We mention this only as an example; we do not endorse this procedure.)
  • 38. Suppose an algebra teacher has a total of 150 students in five classes, and the classes have a common final examination. The teacher decides that the distribution of letter grades assigned to the final examination performance will be 10 percent As, 20 percent Bs, 40 percent Cs, 20 percent Ds, and 10 percent Fs. (note that the final examination grade is not necessarily the course grade.) Since the grading is based on all 150 scores, do not assume that 3 students in each class will receive As, on the final examination.
  • 39. James receives a score on the final exam such that 21 students have higher scores and 128 students have lower scores. What will James’s letter grade be on the exam? The top 15 scores will receive As, and the next 30 scores (20 percent of 150) will receive Bs. Counting from the top score down, James’s score is positioned 22nd, so he will receive a B on the final examination. Note that in this interpretation example, we did not specify James’s actual numerical score on the exam. That would have been necessary in order to determine that his score positioned 22nd in the group of 150 score. But in terms of the interpretation of the score, it was based strictly on its position in the total group of scores.
  • 40. Criterion-Referenced Interpretation The concepts of criterion-referenced testing have developed with a dual meaning for criterion-referenced. On one hand, it means referencing an individual’s performance to some criterion that is a defined performance level. The individual’s score is interpreted in absolute rather than relative terms. The criterion, in this situation, means some level of specified performance that has been determined independently of how others might perform.
  • 41. A second meaning for criterion-referenced involves the idea of a defined behavioral domain—that is, defined body of learner behaviors. The learner’s performance on a test is referenced to a specifically defined group of behaviors. The criterion in this situation is the desired behaviors. Criterion-referenced interpretation is an absolute rather than relative interpretation, referenced to a defined body of learner behaviors, or, as is commonly done, to some specified level of performance.
  • 42. Criterion-referenced tests require the specification of learner behaviors prior to constructing the test. The behaviors should be readily identifiable from instructional objectives. Criterion-referenced tests tend to focus on specific learner behaviors, and usually only a limited number are covered on any one test. Suppose before the test is administered an 80- percent-correct criterion is established as the minimum performance required for mastery of each objective.
  • 43. A student who does not attain the criterion has not mastered the skill sufficiently to move ahead in the instructional sequence. To a large extent, the criterion is based on teacher judgment. No magical, universal criterion for mastery exists, although some curriculum materials that contain criterion-referenced tests do suggest criteria for mastery. Also, unless objectives are appropriate and the criterion, regardless of what it is.
  • 44. Distinctions between Norm-Referenced and Criterion-Referenced Tests Although interpretations, not characteristics, provide the distinction between norm-referenced and criterion-referenced tests, the two types do tend to differ in some ways. Norm-referenced tests are usually more general and comprehensive and cover a large domain of content and learning tasks. They are used for survey testing, although this is not their exclusive use.
  • 45. Criterion-referenced tests focus on a specific group of learner behaviors. To show the contrast, consider an example. Arithmetic skills represent a general and broad category of student outcomes and would likely be measured by a norm-referenced test. On the other hand, behaviors such as solving addition problems with two five- digit numbers or determining the multiplication products of three-and four digit numbers are much more specific and may be measured by criterion-referenced tests.
  • 46. A criterion-referenced test tends to focus more on sub skills than on broad skills. Thus, criterion-referenced tests tend to be shorter. If mastery learning is involved, criterion-referenced measurement would be used. Norm-referenced test scores are transformed to positions within the normative group. Criterion-referenced test scores are usually given in the percentage of correct answers or another indicator of mastery or the lack thereof. Criterion-referenced tests tend to lend themselves more to individualizing instruction than do norm-referenced tests.
  • 47. In individualizing instruction, a student’s performance is interpreted more appropriately by comparison to the desired behaviors for that particular student, rather than by comparison with the performance of a group. Norm-referenced test items tend to be of average difficulty. Criterion-referenced tests have item difficulty matched to the learning tasks. This distinction in item difficulty is necessary because norm-referenced tests emphasize the discrimination among individuals and
  • 48. criterion-referenced tests emphasize the description of performance. Easy items, for example, do little for discriminating among individuals, but they may be necessary for describing performance. Finally, when measuring attitudes, interests, and aptitudes, it is practically impossible to interpret the results without comparing them to a reference group. The reference groups in such cases are usually typical students or students with high interests in certain areas.
  • 49. Teachers have no basis for anticipating these kinds of scores; therefore, in order to ascribe meaning to such a score, a referent group must be used. For instance, a score of 80 on an interest inventory has no meaning in itself. On the other hand, if a score of 80 is the typical response by a group interested in mechanical areas, the score takes on meaning.
  • 50. STAGES IN TEST CONSTRUCTION I. Planning the Test A. Determining the Objectives B. Preparing the Table of Specifications C. Selecting the Appropriate Item Format D. Writing the Test Items E. Editing the Test Items
  • 51. II. Trying Out the Test A. Administering the First Tryout – then Item Analysis B. Administering the Second Tryout – then Item Analysis C. Preparing the Final Form of the Test III. Establishing Test Validity IV. Establishing the Test Reliability V. Interpreting the Test Score
  • 52. MAJOR CONSIDERATIONS IN TEST CONSTRUCTION  The following are the major considerations in test construction: Type of Test Our usual idea of testing is an in-class test that is administered by the teacher. However, there are many variations on this theme: group tests, individual tests, written tests, oral tests, speed tests, power tests, pretests and post tests. Each of these has different characteristics that must be considered when the tests are planned.
  • 53. If it is a take-home test rather than an in-class test, how do you make sure that students work independently, have equal access to sources and resources, or spend a sufficient but not enormous amount of time on the task? If it is a pretest, should it exactly match the past test so that a gain score can be computed, or should the pretest contain items that are diagnostic of prerequisite skills and knowledge? If it is an achievement test, should partial credit be awarded, should there be penalties for guessing, or should points be deducted for grammar and spelling errors?
  • 54. Obviously, the test plan must include a wide array of issues. Anticipating these potential problems allows the test constructor to develop positions or policies that are consistent with his or her testing philosophy. These can then be communicated to students, administrators, parents, and others who may be affected by the testing program. Make a list of the objectives, the subject matter taught and the activities undertaken. These are contained in the daily lesson plans of the teacher and in the references or textbook used.
  • 55. Such tests are usually very indirect methods that only approximate real-world applications. The constraints in classroom testing are often due to time and the development level of the students. Test Length A major decision in the test planning is how many items should be included on the test. There should be enough to cover the content adequately, but the length of the class period or the attention span or fatigue limits of the students usually restrict the test length. Decisions about test length are usually based on practical constraints more than on theoretical considerations.
  • 56. Most teachers want test scores to be determined by how much the student understands rather than by how quickly he or she answers the questions. Thus, teachers prefer power tests, where at least 90 percent of the students have time to attempt 90 percent of the test items. Just how many items will fit into a given test occasion is something that is learned through experience with similar groups of students.
  • 57. Item Formats Determining what kind of terms to include on the test is a major decision. Should they be objectively scored formats such as multiple choice or matching type? Should they cause the students to organize their own thoughts through short answer or essay formats? These are important questions that can be answered only by the teacher in terms of the local context, his or her students, his or her classroom, and the specific purpose of the test. Once the planning decisions are made, the item writing begins. This tank is often the most feared by the beginning test constructors. However, the procedures are more common sense than formal rules.
  • 58. POINTS TO BE CONSIDERED IN PREPARING A TEST 1. Are the instructional objectives clearly defined? 2. What knowledge, skills and attitudes do you want to measure? 3. Did you prepare a table of specifications? 4. Did you formulate well defined and clear test items? 5. Did you employ correct English in writing the items?
  • 59. 6. Did you avoid giving clues to the correct answer? 7. Did you test the important ideas rather than the trivial? 8. Did you adapt the test’s difficulty to your student’s ability? 9. Did you avoid using textbooks jargons? 10 Did you cast the items in positive form? 11. Did you prepare a scoring key? 12. Does each item have a single correct answer? 13. Did you review your items?
  • 60. GENERAL PRINCIPLES IN CONSTRUCTING DIFFERENT TYPES OF TESTS 1. The test items should be selected very carefully. Only important facts should be included. 2. The test should have extensive sampling of items. 3. The test items should be carefully expressed in simple, clear, definite, and meaningful sentences. 4. There should be only one possible correct response for each test item.
  • 61. 5. Each item should be independent. Leading clues to other items should be avoided. 6. Lifting sentences from books should not be done to encourage thinking and understanding. 7. The first person personal pronouns/and we should not be used. 8. Various types of test items should be made to avoid monotony. 9. Majority of the test items should be of moderate difficulty. Dew difficult and few easy items should be included.
  • 62. 10. The test items should be arranged in an ascending order of difficulty. Easy items should be at the beginning to encourage the examinee to pursue the test and the most difficult items should be at the end. 11. Clear, concise, and complete directions should precede all types of test. Sample test items may be provided for expected responses. 12. Items which can be answered by previous experience alone without knowledge of the subject matter should not be included.
  • 63. 13. Catchy words should not be used in the test items. 14. Test items must be based upon the objectives of the course and upon the course content. 15. The test should measure the degree of achievement or determine the difficulties of the learners. 16. The test should emphasize ability to apply and use facts as well as knowledge of facts.
  • 64. 17. The test should be of such length that it can be completed within the time allotted by all or nearly all of the pupils. The teacher should perform the test herself to determine its approximate time allotment. 18. Rules governing good language expression, grammar, spelling, punctuation, and capitalization should be observed in all items 19. Information on how scoring will be done should be provided. 20. Scoring Keys in correcting and scoring tests should be provided.
  • 65. POINTERS TO BE OBSERVED IN CONSTRUCTING AND SCORING THE DIFFERENT TUPES OF TESTS A. RECALL TYPES 1. Simple recall type a. This type consists of questions calling for a single word or expression as an answer. b. Items usually begin with who, where, when, and what. c. Score is the number of correct answers.
  • 66. 2. Completion type a. Only important words or phrases should be omitted to avoid confusion. b. Blanks should be of equal lengths. c. The blank, as much as possible, is placed near or at the end of the sentence. d. Articles a, an, and the should not be provided before the omitted word or phrase to avoid clues for answers. e. Score is the number of correct answers.
  • 67. 3. Enumeration type a. The exact number of expected answers should be stated. b. Blanks should be of equal lengths. c. Score is the number of correct answers. 4. Identification type a. The items should make an examinee think of a word, number, or group of words that would complete the statement or answer the problem. b. Score is the number of correct answers.
  • 68. B. RECOGNITION TYPES 1. True-false or alternate-response type a. Declarative sentences should be used. b. The number of “true” and “false” items should be more or less equal. c. The truth or falsity of the sentence should not be too evident. d. Negative statements should be avoided. e. The “modified true-false” is more preferable than the “plain true-false”.
  • 69. f. In arranging the items, avoid the regular recurrence of “true” and “false” statements. g. Avoid using specific determiners like: all, always, never, none, nothing, most, often, some, etc. and avoid weak statements as may, sometimes, as a rule, in general etc. h. Minimize the use of qualitative terms like: few, great, many, more, etc. i. Avoid leading clues to answers in all items. j. Score is the number of correct answers in “modified true- false and right answers minus wrong answers in “plain true-false”.
  • 70. 2. Yes-No type a. The items should be in interrogative sentences. b. The same rules as in “true-false” are applied. 3. Multiple-response type a. There should be three to five choices. The number of choices used in the first item should be the same number of choices in all the items of this type of test. b. The choices should be numbered or lettered so that only the number or letter can be written on the blank provided.
  • 71. c. If the choices are figures, they should be arranged in ascending order. d. Avoid the use of “a” or “an” as the last word prior to the listing of the responses. e. Random occurrence of responses should be employed. f. The choices, as much as possible, should be at the end of the statements. g. The choices should be related in some way or should belong to the same class. h. Avoid the use of “none of these” as one of the choices. i. Score is the number of correct answers.
  • 72. 4. Best answer type a. There should be three to five choices all of which are right but vary in their degree of merit, importance or desirability. b. The other rules for multiple-response items are applied here. c. Score is the number of correct answers. 5. Matching type a. There should be two columns. Under “A” are the stimuli which should be longer and more descriptive than the responses under column “B”. The response may be a word, a phrase, a number, or a formula.
  • 73. b. The stimuli under column “A” should be numbered and the responses under column “B” should be lettered. Answers will be indicated by letters only on lines provided in column “A”. c. The number of pairs usually should not exceed twenty items. Less than ten introduces chance elements. Twenty pairs may be used but more than twenty is decidedly wasteful of time. d. The number of responses in column “B” should be two or more than the number of items in Column “A” to avoid guessing.
  • 74. e. Only one correct matching for each item should be possible. f. Matching sets should neither be too long nor too short. g. All items should be on the same page to avoid turning of pages in the process of matching pairs. h. Score is the number of correct answers.
  • 75. C. ESSAY TYPE EXAMINATIONS Common types of essay questions.(The types are related to purposes of which the essay examinations are to be used.) 1. Comparison of two things 2. Explanation of the use or meaning of a statement or passage. 3. Analysis 4. Decisions for or against 5. Discussion
  • 76. How to construct essay examinations. 1. Determine the objectives or essentials for each question to be evaluated. 2. Phrase questions in simple, clear and concise language. 3. Suit the length of the questions to the time available for answering the essay examination. The teacher should try to answer the test herself, 4. Scoring: a. Have a model answer in advance. b. Indicate the number of points for each question. c. Score a point for each essential.
  • 77. ADVANTAGES AND DISADVANTAGES OF THE OBJECTIVE TYPE OF TESTS Advantages a. The objective test is free from personal bias in scoring. b. It is easy to score. With a scoring key, the test can be corrected by different individuals without affecting the accuracy of the grades given. c. It has high validity because it is comprehensive with wide sampling of essentials. d. It is less time-consuming since many items can be answered in a given time. e. It is fair to students since the slow writers can accomplish the test as fast as the fast writers.
  • 78. Disadvantages a. It is difficult to construct and requires more time to prepare. b. It does not afford the students the opportunity in training for self- and thought organization. c. It cannot be used to test ability in theme writing or journalistic writing.
  • 79. ADVANTAGES AND DISADVANTAGES OF THE ESSAY TYPE OF TESTS Advantages a. The essay examination can be used in practically all subjects of the school curriculum. b. It trains students for thought organization and self expression. c. It affords students opportunities to express their originality and independence of thinking. d. Only the essay test can be used in some subjects like composition writing journalistic writing which cannot be tested the objective type test.
  • 80. e. Essay examination measures higher mental abilities comparison, interpretation, criticism, defense of opinion and decision f. The essay test is easily prepared. g. It is inexpensive. Disadvantages a. The limited sampling of items makes the test unreliable measure of achievements or abilities. b. Questions usually are not well prepared. c. Scoring is highly subjective due to the influence of the corrector's personal judgment. d. Grading of the essay test is inaccurate measure pupils' achievements due to subjectivity of scoring.
  • 81. STATISTICAL MEASURES OR TOOLS USED IN INTERPRETING NUMERICAL DATA Frequency Distributions A simple, common sense technique for describing a set of test scores is through the use of frequency distribution. A frequency distribution is merely listing of the possible score values and the number of persons who achieved each scores. Such an arrangement presents the scores in a more simple and understandable manner than merely listing all of the separate scores. Consider a specific set of scores to clarify these ideas.
  • 82. A set of scores for a group of 25 students who took a 50- item test is listed in Table 1. It is easier to analyze the scores if they are arranged in a simple frequency distribution. (The frequency distribution for the same set of score is given in Table 2). The steps that are involved in creating the frequency distribution are: First, list the possible score values in rank order, from highest to lowest. Then, a second column indicates the frequency or number of persons who received each score. For example, three students received a score of 47, two received 40, and so forth. There is no need to list score values below the lowest score that anyone received.
  • 84. When there is a wide range of scores in a frequency distribution, the distribution can be quite long , with a lot of zeros in the column of frequencies. Such a frequency distribution can make interpretation difficult and confusing. A grouped frequency distribution would be more appropriate in this kind of situation. Groups of score values are listed rather than each separate possible score value.
  • 85. If we were to change the frequency distribution and Table 2 into a grouped frequency distribution, we might choose intervals such as 48 -50 , 45 -47, and so forth. The frequency corresponding to intervals 48 -50 would be 9 (1 + 3 + 5). The choice of width of the interval is arbitrary, but it must be the same for all intervals. In addition, it is a good idea to have an odd-numbered interval width (we used 3 above) so that the midpoint of the interval is a whole number. This strategy will simplify subsequent graphs at description of data. The grouped frequency distribution is presented in Table 3.
  • 86.
  • 87. Frequency distributions summarize sets of test scores by listing the number of people who received each test score. All of the test scores can be listed separately, or the scores can be grouped in a frequency distribution. MEASURES OF CENTRAL TENDENCY Frequency distributions are helpful for indicating the shape to describe a distributions of scores, but we need more information than the shape to describe a distribution adequately. We need to know where on the scale of measurement a distribution is located and how the scores are dispersed in the distribution. For the former, we compute measures of central tendency, and for the latter, we compute measures of dispersion. Measures of central tendency are points of the scale of measurement, and they are representative of how the scores tend to average. There are three commonly used measures of central tendency: the mean, the median, and the mode, but the mean is by far the most widely used .
  • 88. The Mean The mean of a set of scores is the arithmetic mean. It is found by summing the scores and dividing the sum by the number of scores . The mean is the most commonly used measure of central tendency because it is easily understood and is based on all the scores in the set; hence , it summarizes a lot of information. The formula of the mean is as follows.
  • 89.
  • 90. The Median Another measure of central tendency is the median which is the point that divides distribution in half; that is, half of the scores fall above the median and half of the scores fall below the median. When there are only a few scores, the median can often be found by inspection. If there is an odd number of scores, the middle score is the median. When there is even a number of scores, the median is halfway between the two middle scores . However, when they are tied scores in the middle of the distribution, or when the scores are in a frequency distribution, the median may not be so obvious.
  • 91. Consider again the frequency distribution in Table 2. There were 25 scores in the distribution, so the middle score should be the median. A straightforward way to find this median is to augment the frequency distribution with a column of cumulative frequencies. Cumulative frequencies indicate the number of scores at or below each score. Table 4 indicates the cumulative frequencies for the data in Table 2.
  • 92.
  • 93. For example, 7 persons scored at or below a score of 40, and 21 persons scored at or below a score of 48. To find the median, we need to locate the middle score in the cumulative frequency column, because this score is the median. Since there are 25 scores in the distribution, the middle one is the 13th, a score of 46. Thus, 46 is a median of this distribution; half of the people scored above 46 and half scored. When there are ties in the middle of the distribution, there may be a need to interpolate between scores to get the exact median. However, such precision is not needed for most classroom tests. The whole number closest to the median is usually sufficient.
  • 94. The Mode The measure of central tendency that is the easiest to find is the mode. The mode is the most frequently occurring score in the distribution. The mode of the scores in Table 1 is 48. Five persons had two scores of 48 and no other score occurred as often. Each of these three measures of central tendency - the mean, the median, and the mode means a legitimate definition of “average” performance on this test. However, each does provide different information. The arithmetic average was 44; half the people scored at or below 46 and more people received 48 than any other score.
  • 95. There are some distributions in which all three measures of central tendency are equal, but more often than not they will be different. The choice of which measure of central tendency is best will differ from situation to situation. The mean is used most often, perhaps because it includes information from all of the scores. When a distribution has a small number of very extreme scores, though, the median may be a better definition of central tendency. The mode provides the least information and is used infrequently as “average”. The mode can be used with nominal scale data, just as an indicator of the most frequently appearing category. The mean, the median, and the mode all describe central tendency:  The mean is the arithmetic average.  The median divides the distribution in half.  The mode is the most frequent score.
  • 96. MEASURES OF DISPERSION Measures of central tendency are useful for summarizing average performance, but they tell us nothing about how the scores are distributed or “spread out” around the averages . Two sets of test scores may have equal measures of central tendency, but they may differ in other ways. One of the distributions may have the scores tightly clustered around the average, and the other distribution may have scores that are widely separated. As you may have anticipated, there are descriptive statistics that measure dispersion, which also are called measures of variability. These measures indicate how spread out the scores tend to be.
  • 97. The Range The range indicates the difference between the highest and lowest scores in a distribution. It is simple to calculate, but it provides limited information. We subtract the lowest from the highest score and add 1 so that we include both scores in the spread between them. For the scores of Table 2, the range is 50 - 34 + 1 = 17. A problem with using the range is that only the two most extreme scores are used in this computation. There is no indication of the spread of scores between highest and lowest. Measures of dispersion that take into consideration every score in the distribution are the variance and standard deviation. The standard deviation is used a great deal in interpreting scores from standardized tests.
  • 98. The Variance The variance measures how widely the scores in the distribution are spread about the mean . In other words, the variance is the average squared difference between the scores and the mean. As a formula, it looks like this:
  • 99. The computation of the variance for the scores of Table 1 is illustrated in Table 5. The data for the students K through V are omitted to save space, but these values are included in the column totals and in the computation. The Standard Deviation The standard deviation also indicates how spread out the scores are, but is expressed in the same units as original scores. The standard deviation is computed by finding the square root of the variance. S = S2
  • 100. For the data in Table 1, the variance is 22.8. The standard deviation is 22.8, or 4.77. The scores of most norm groups have the shape of a “normal” distribution- a symmetrical bell-shaped distribution with which most people are familiar. With a normal distribution, about 95 percent of the scores are within two standard deviations of the mean. Even when scores are not normally distributed, most of the scores will be within two standard deviations of the mean. In the example, the mean minus two standard deviations is 34.46, and the mean plus two standard deviations is 53.54. Therefore, only one score is outside of this interval; the lowest score, 34, is slightly more than two standard deviations from the mean.
  • 101.
  • 102. Graphing Distributions A graph of distribution of test course is often better understood than is the frequency distribution or a mere table of numbers. The general pattern of scores, as well as any unique characteristics of the distribution, can be seen easily in simple graphs. There are several kinds of graphs that can be used, but a simple bar graph, or histogram, is as useful as any. The general shape of the distribution is clear from the graph. Most of the scores in this distribution are high, at the upper end of the graph. Such a shape is quite common for the scores of classroom tests. That is, test scores will be grouped toward the right end of the measurement scale. A normal distribution has most of the test scores in the middle of the distribution and progressively fewer scores toward extremes. The scores of norm groups are seldom graphed but they could be if we were concerned about seeing the specific shape of the distribution of scores. Usually, we know or assume that the scores are normally distributed.
  • 103. Source: Reviewer for the Licensure Examination for Teachers (LET) by MANILA REVIEW INSTITUTE, inc> AND CECILIO D. DUKA