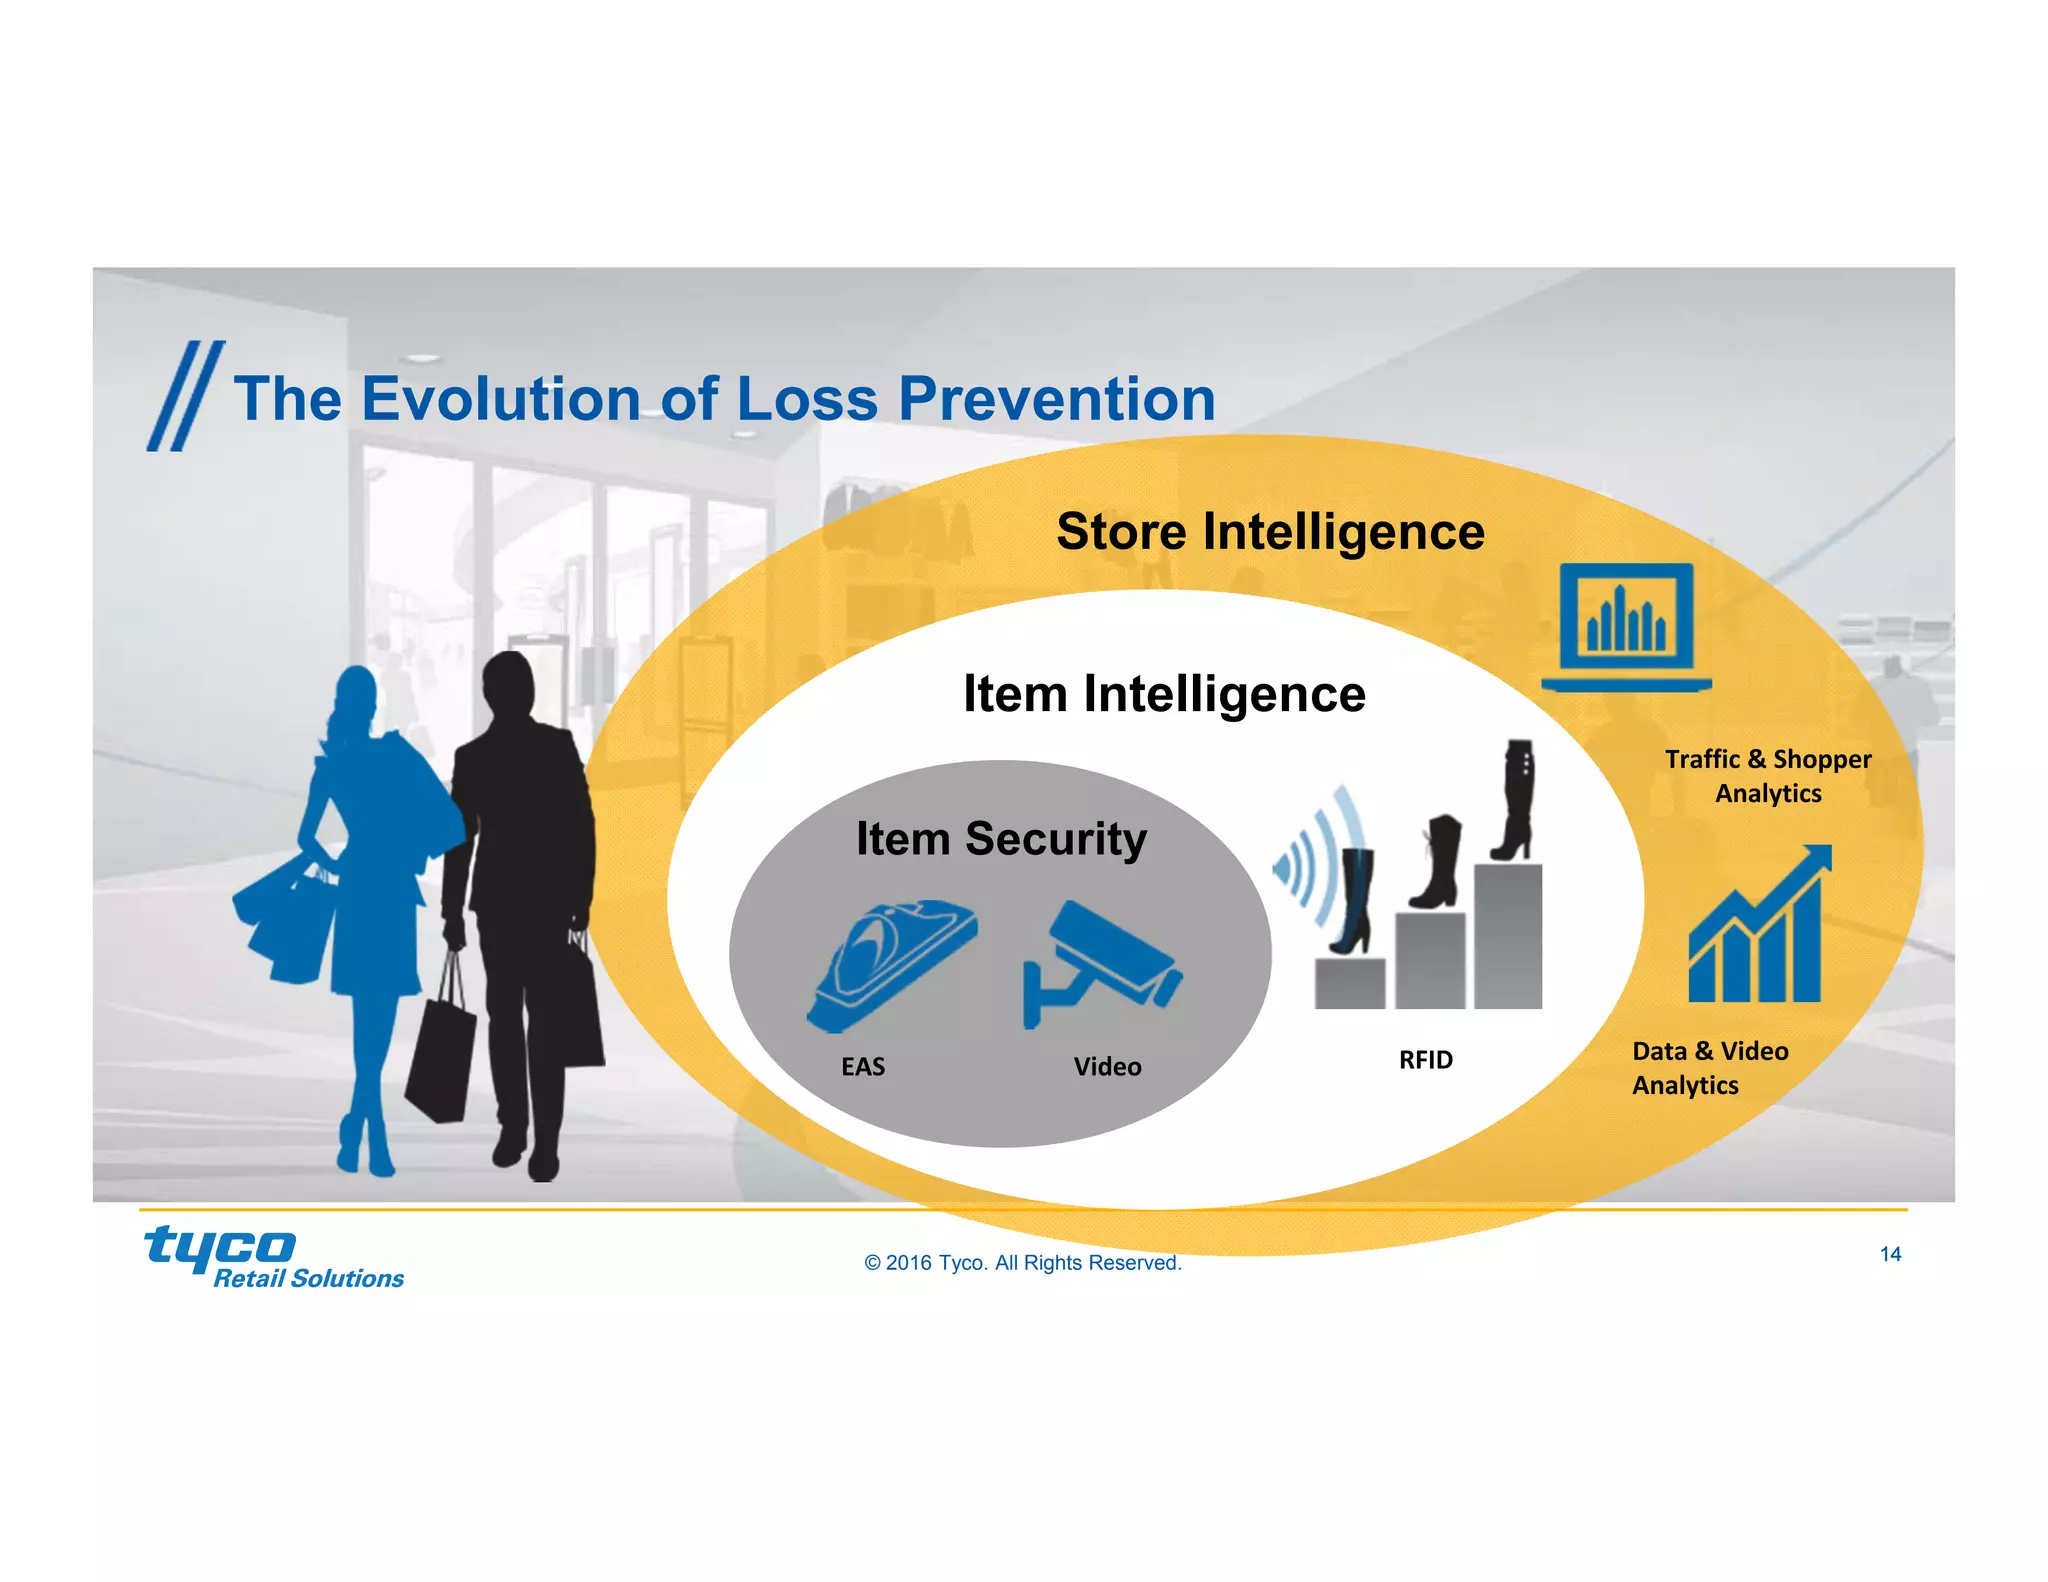
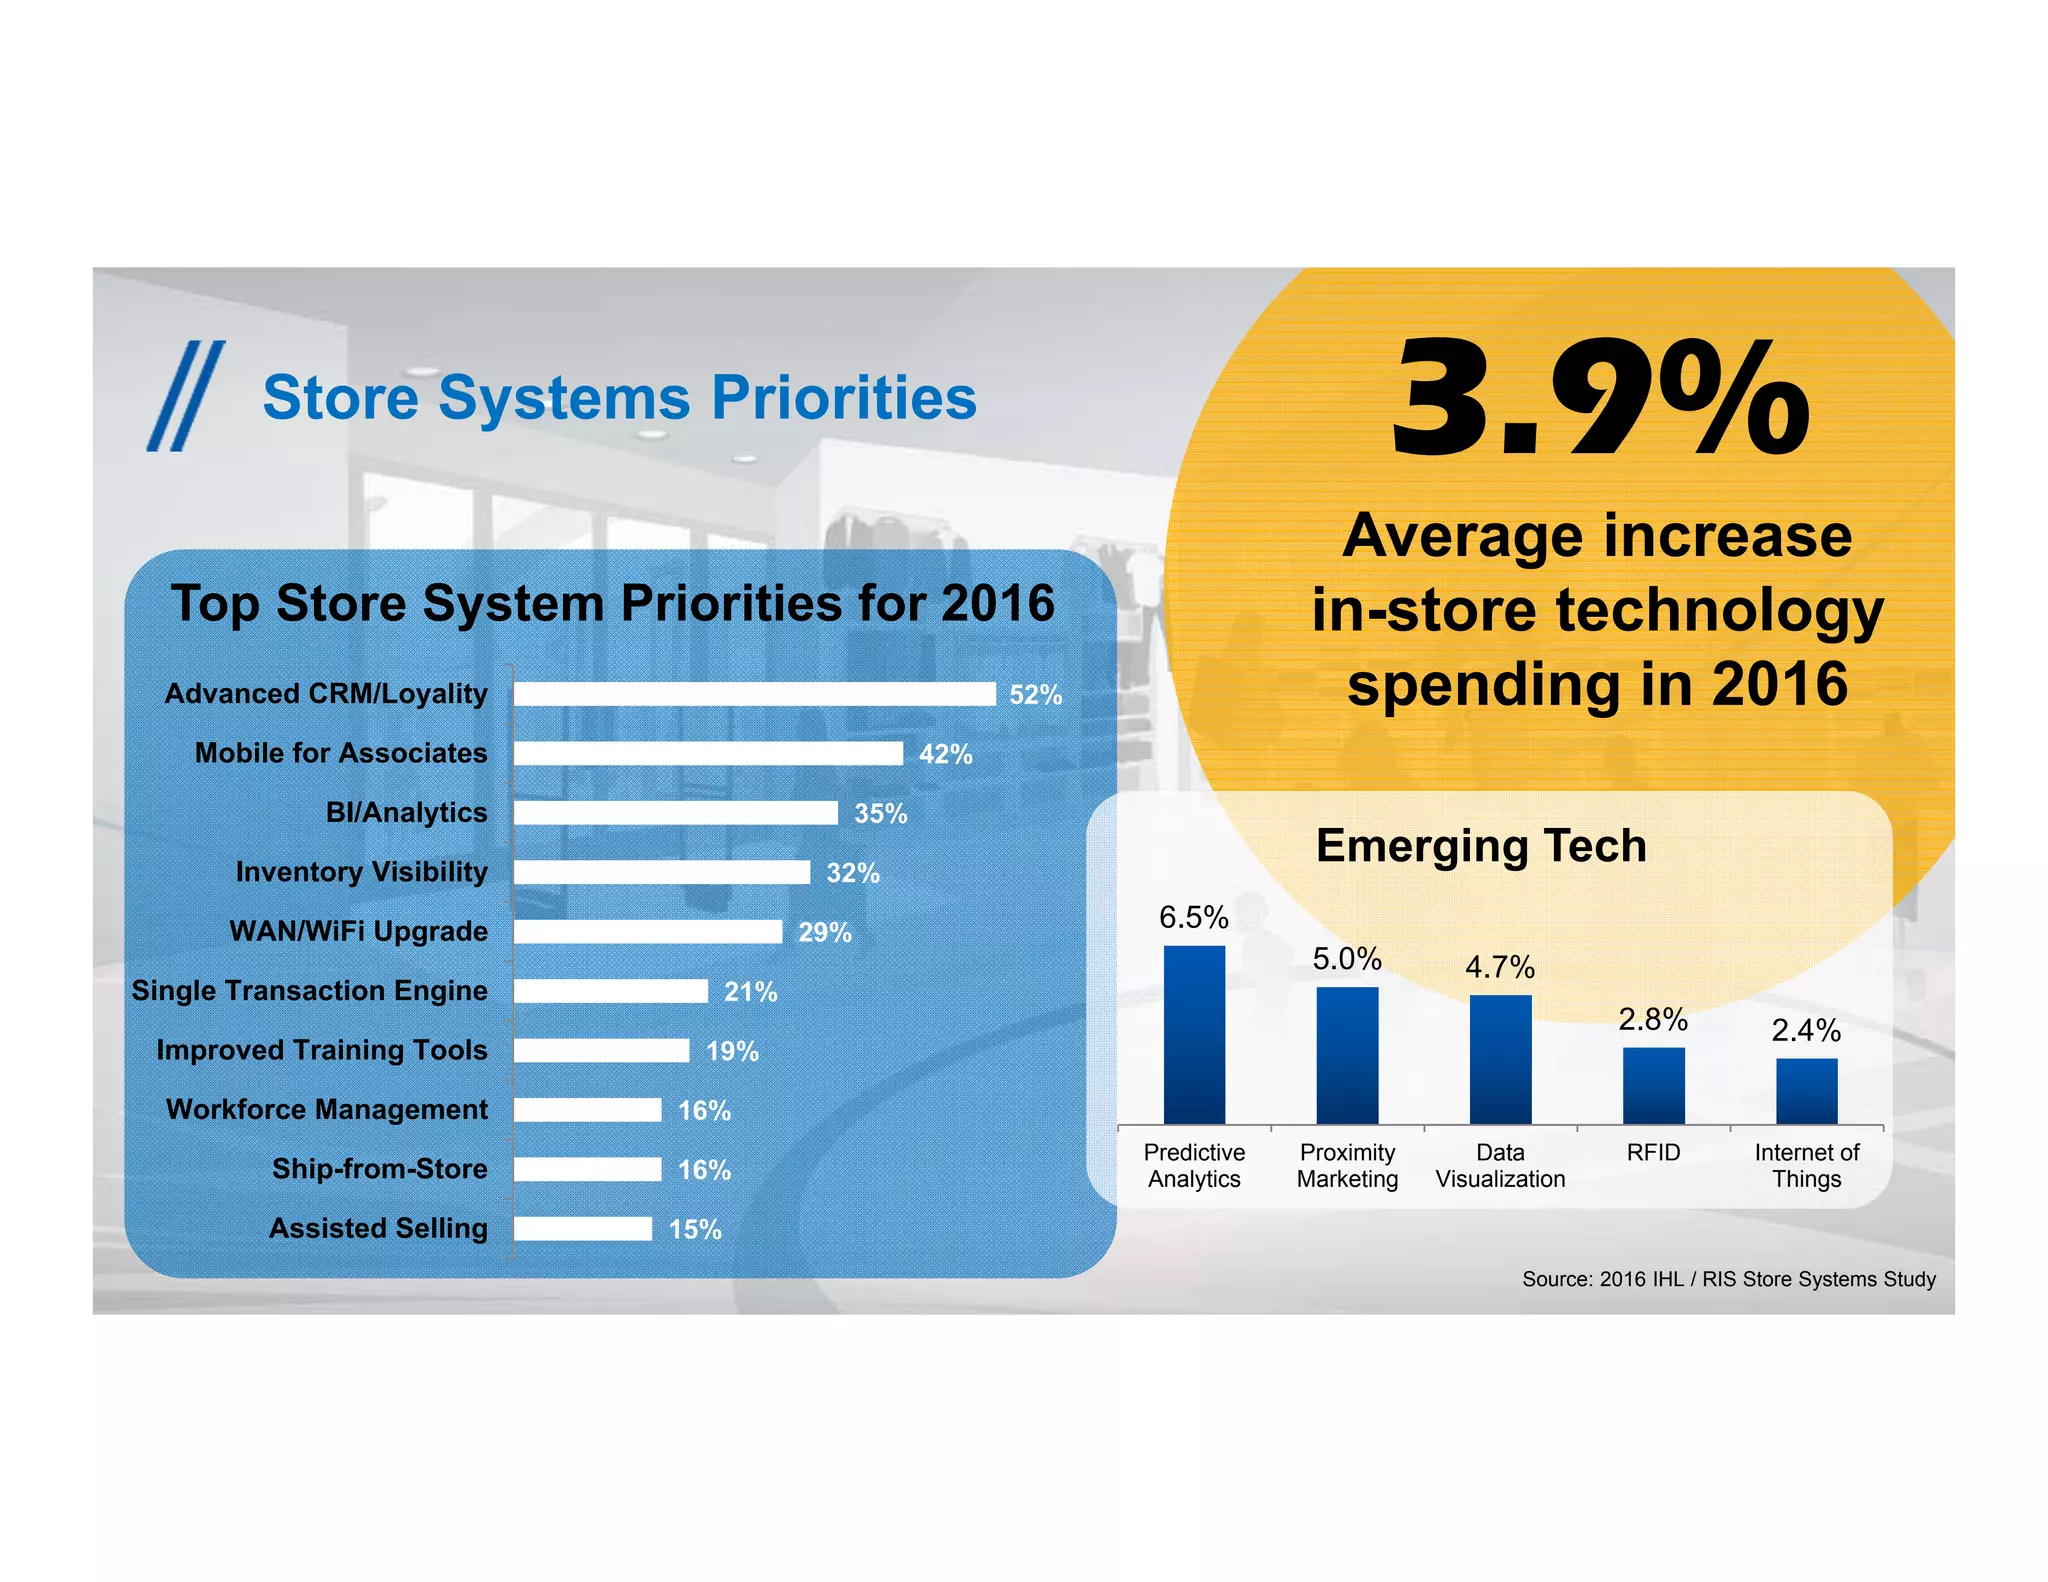
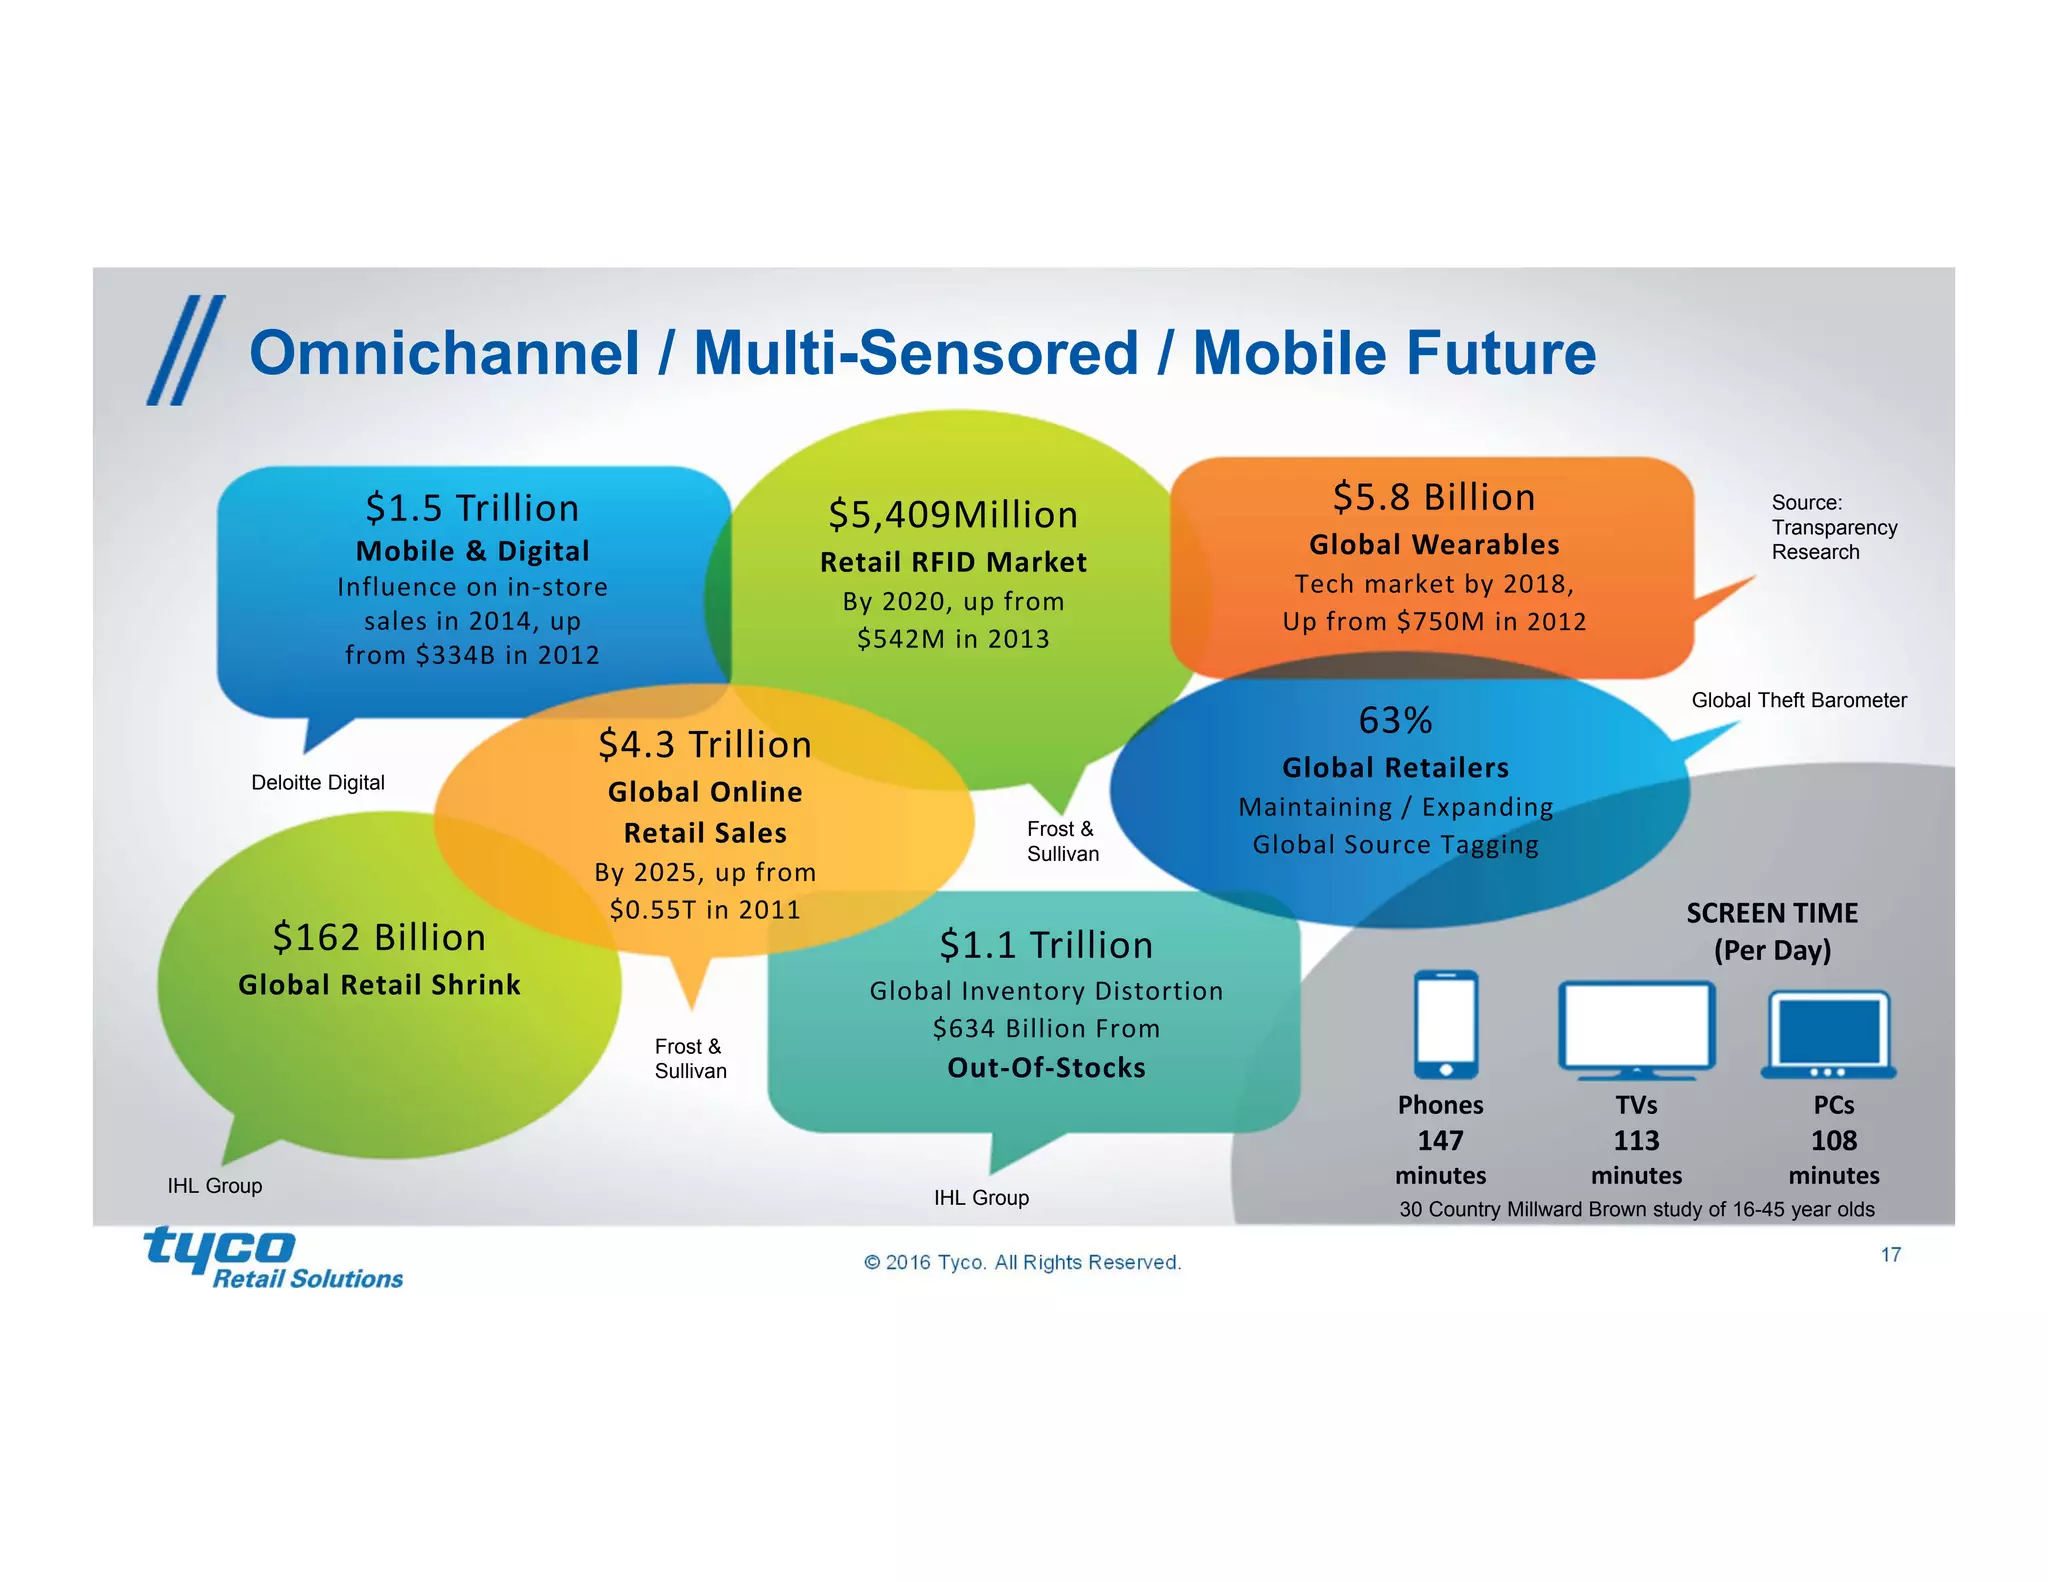
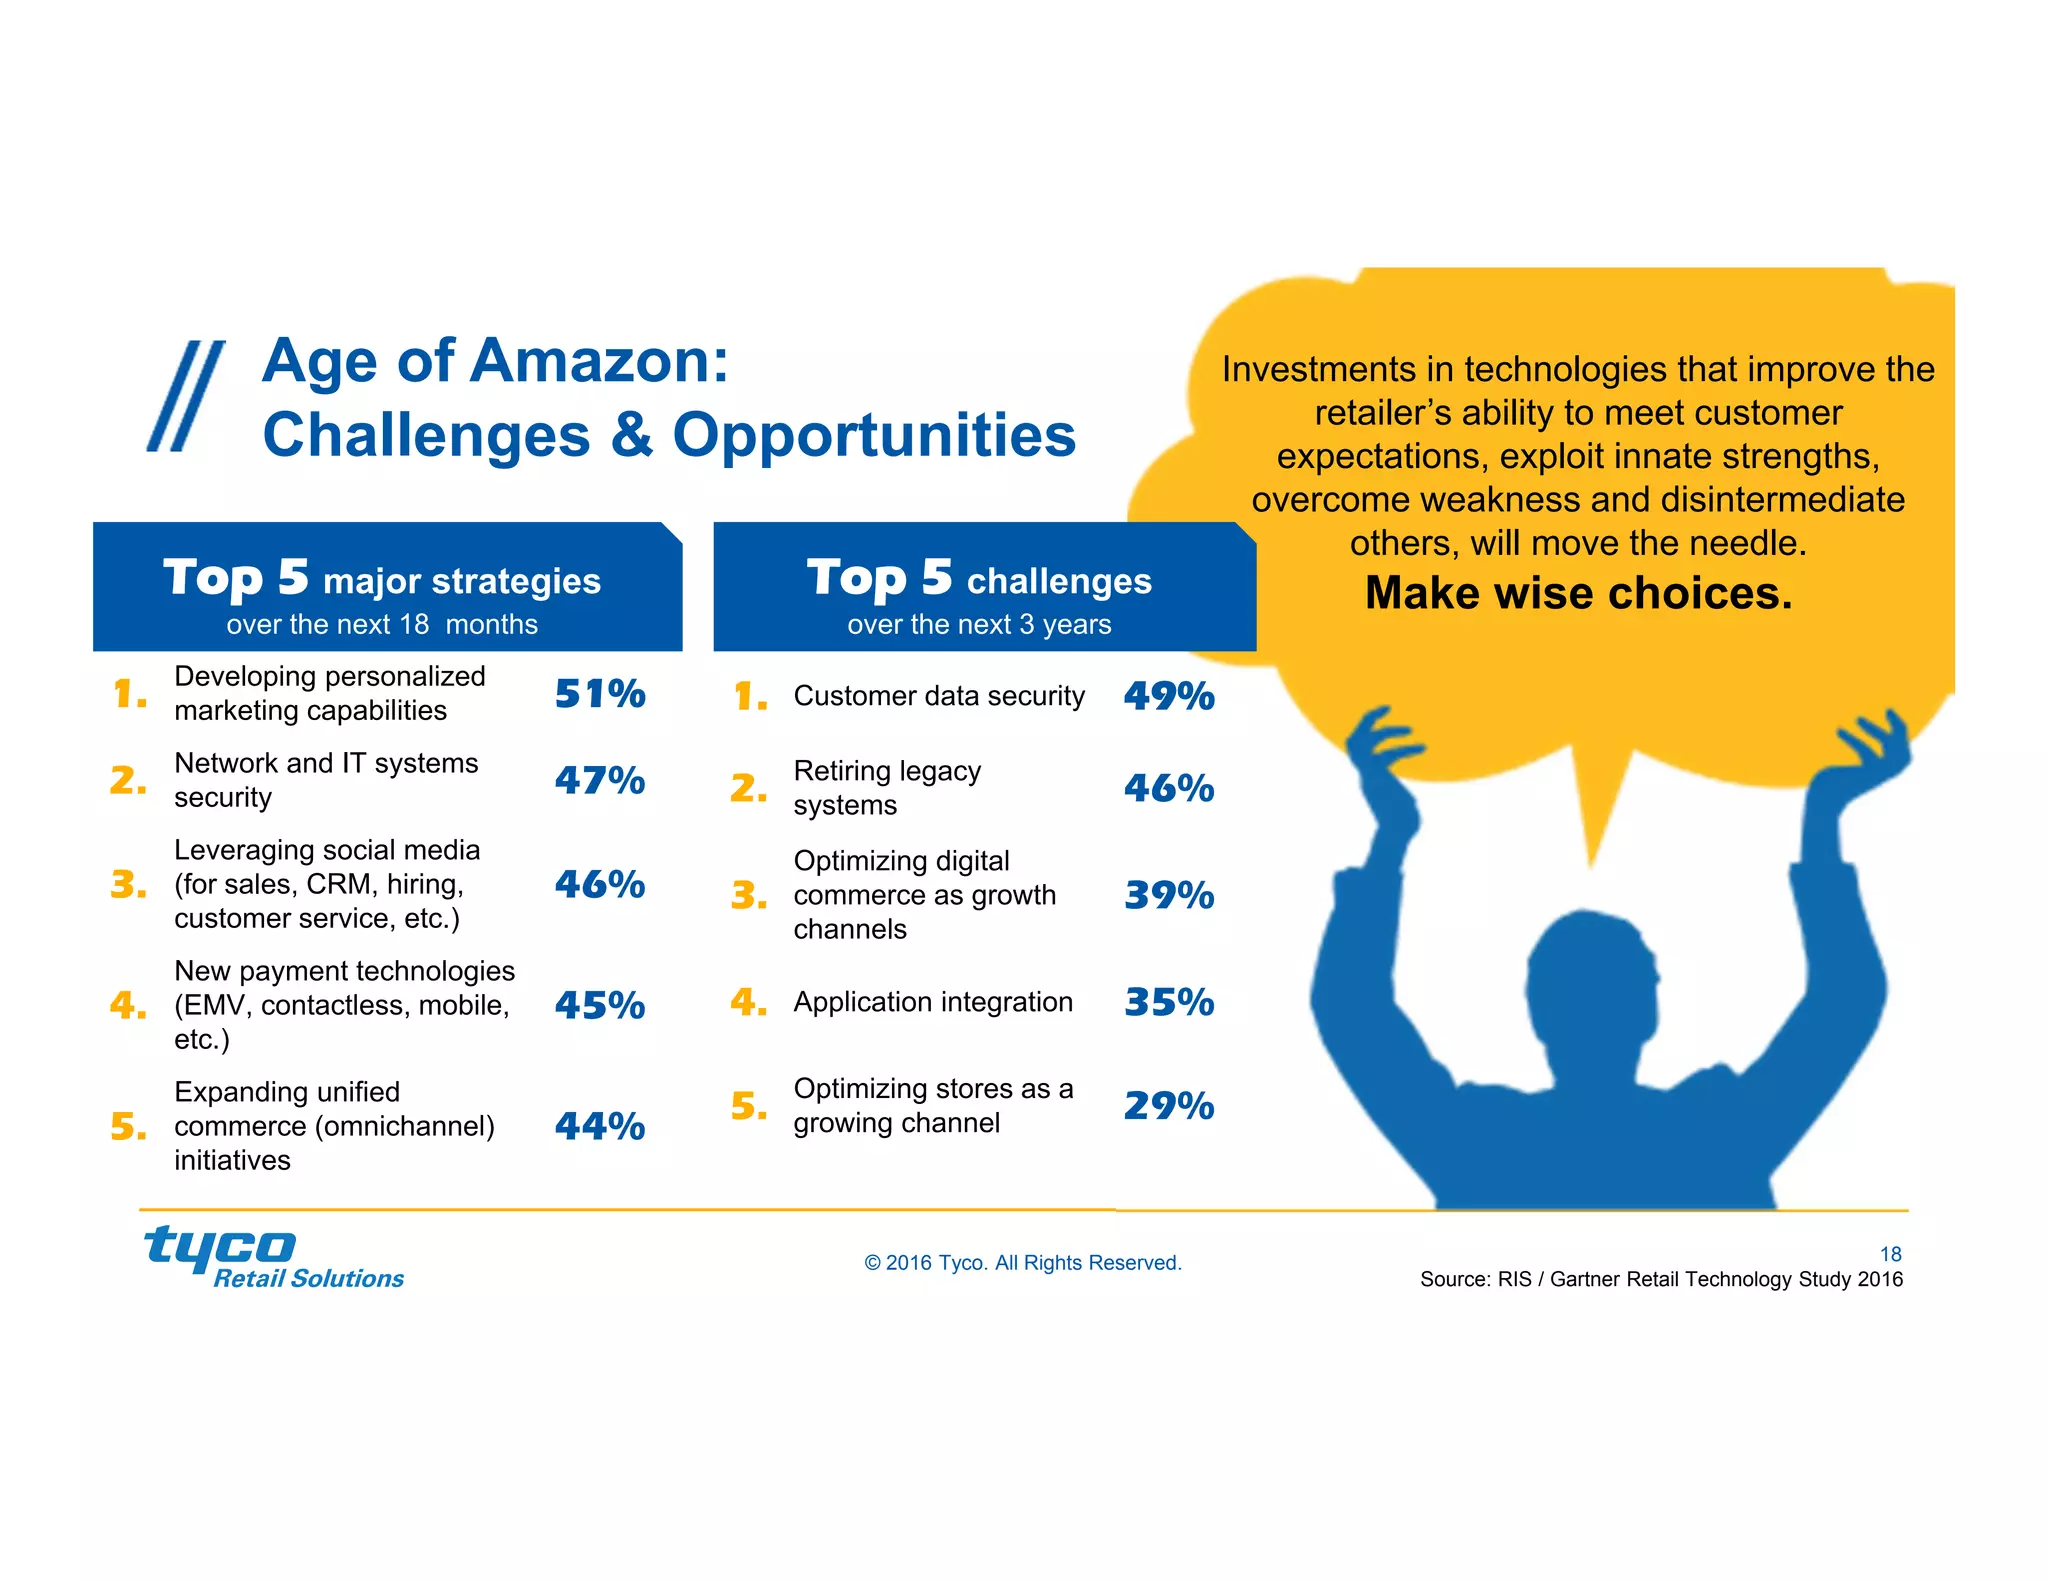
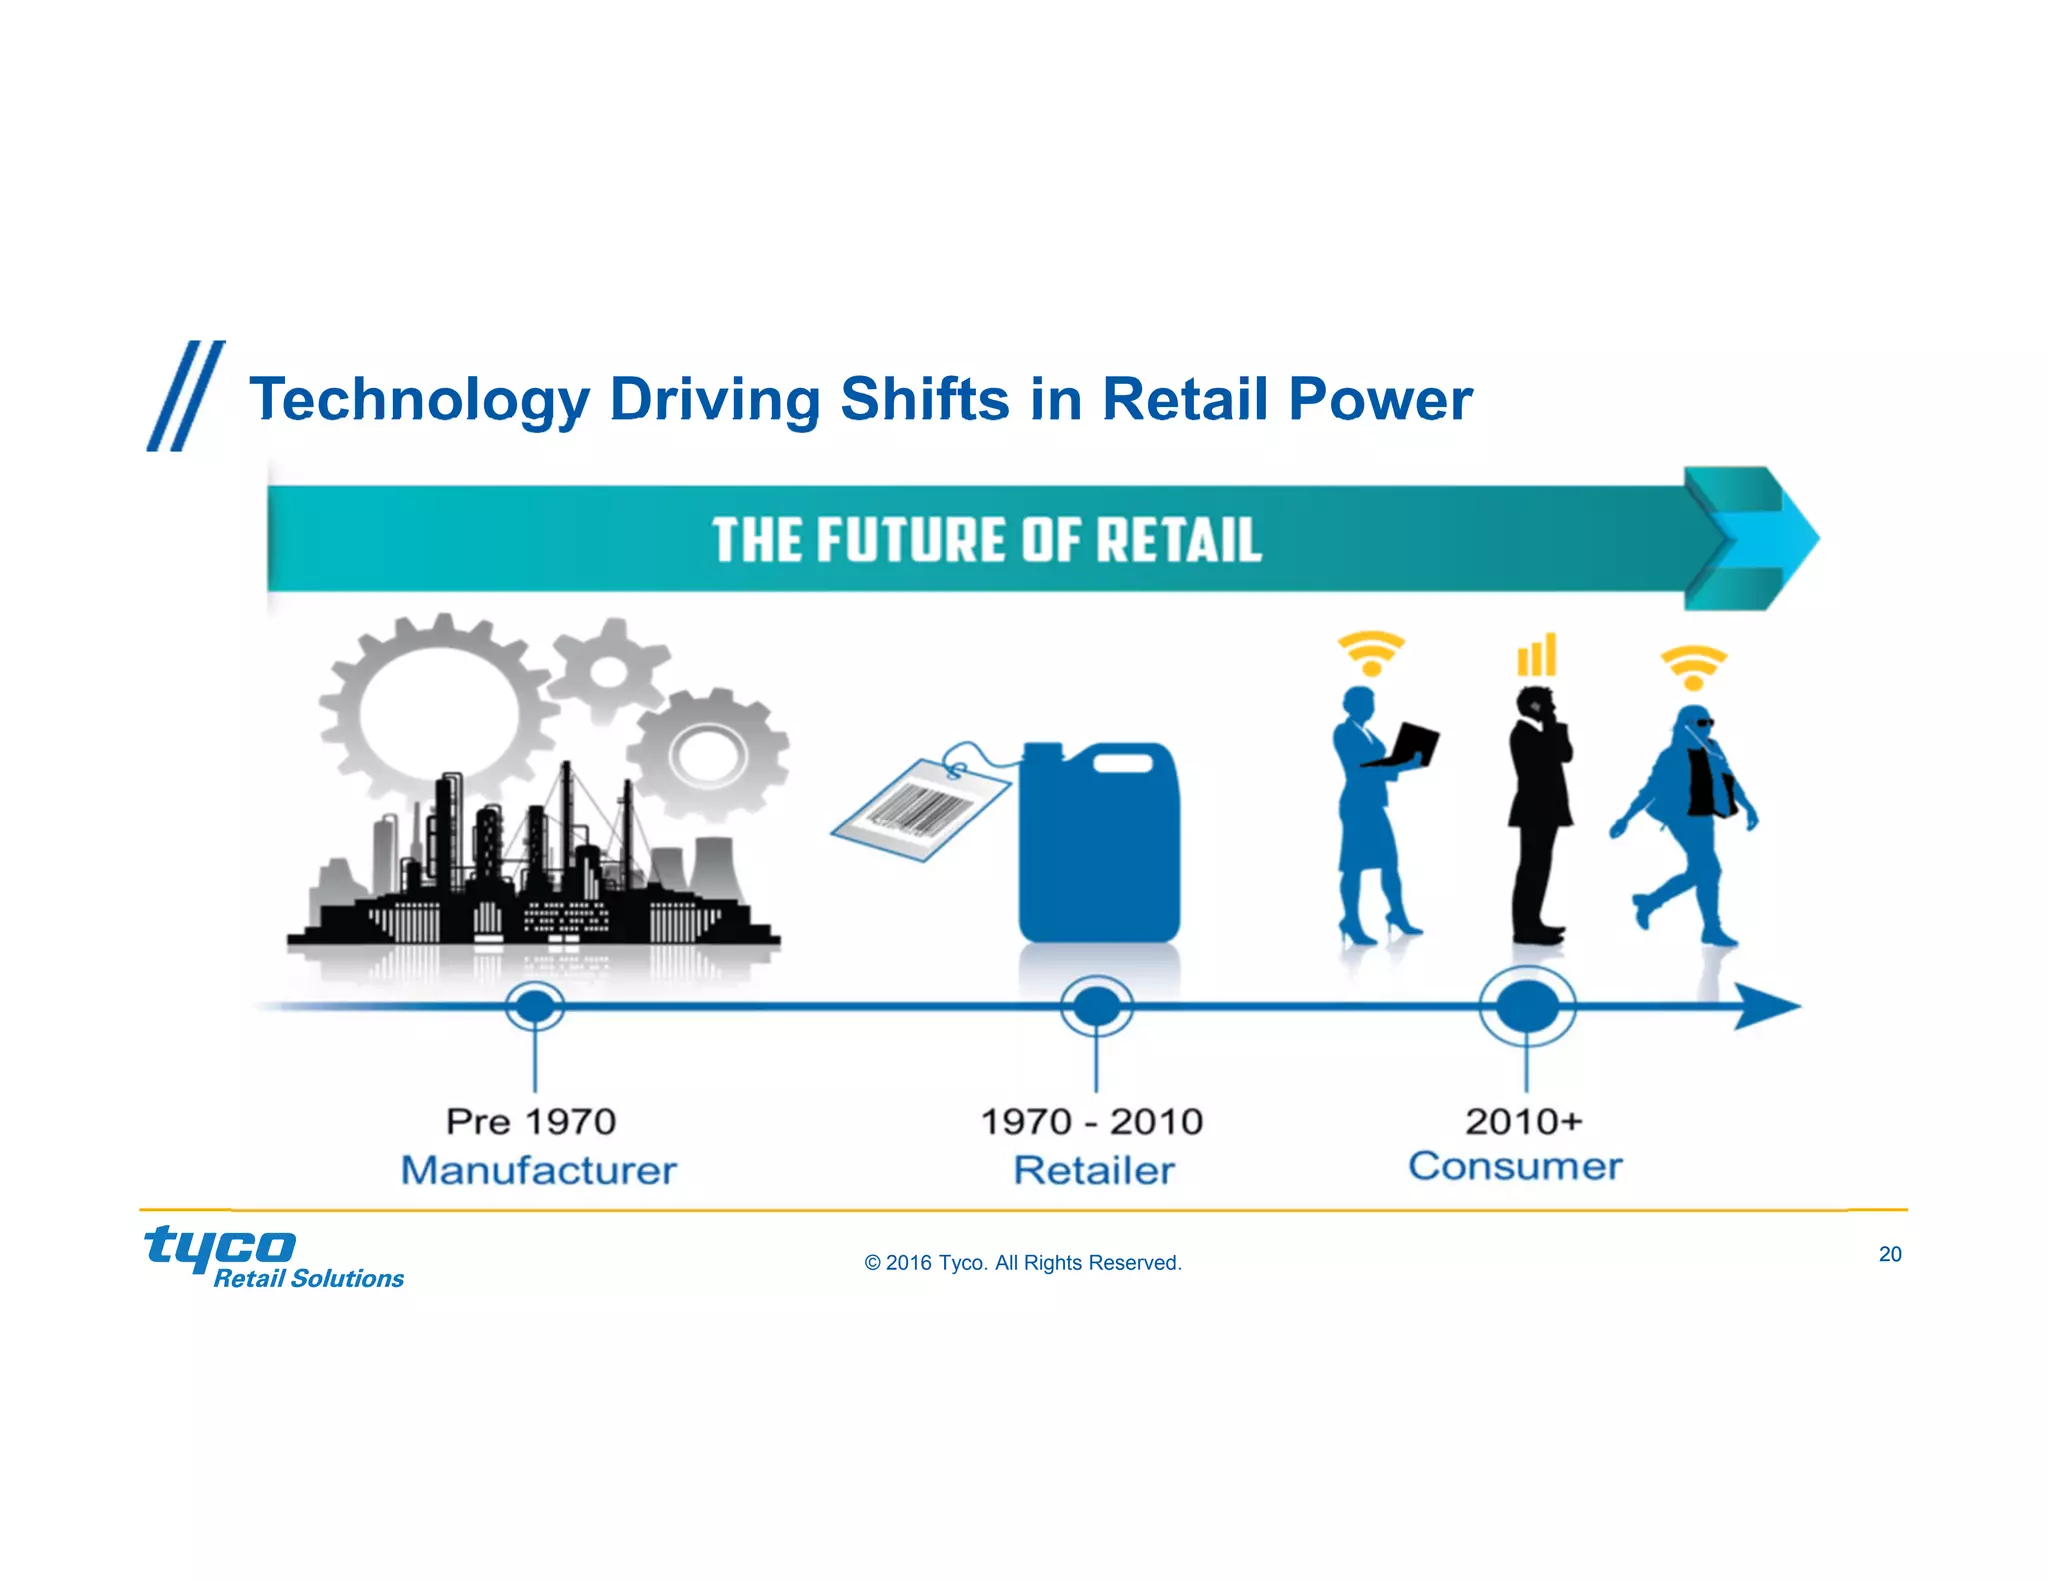
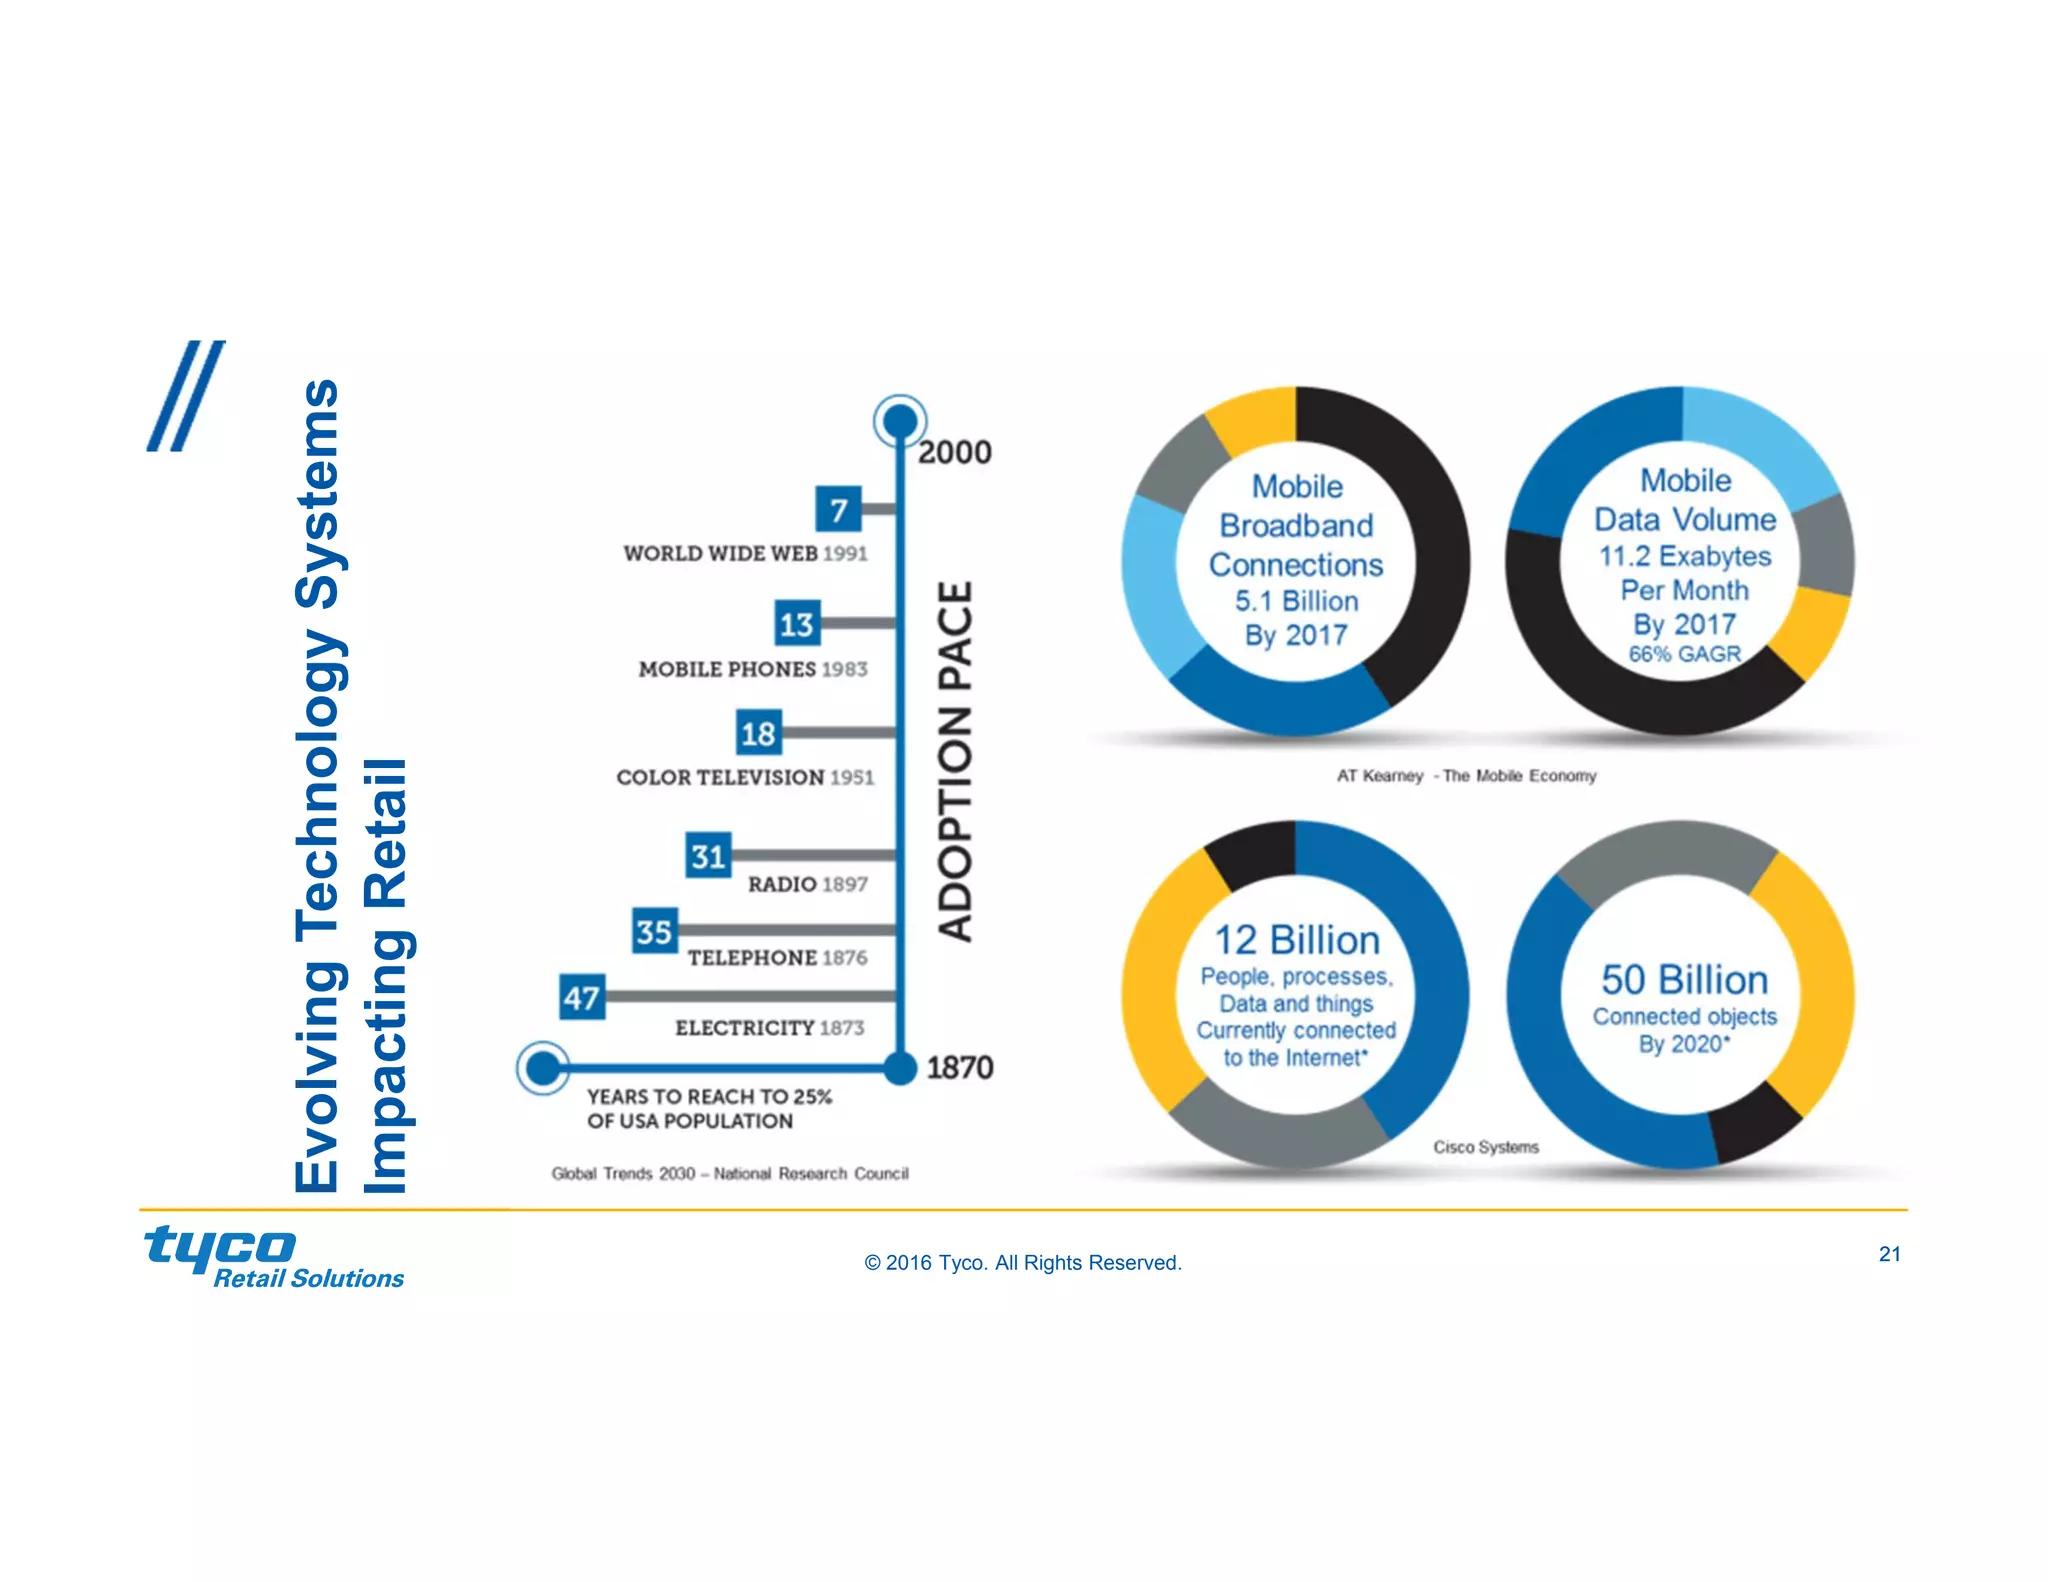
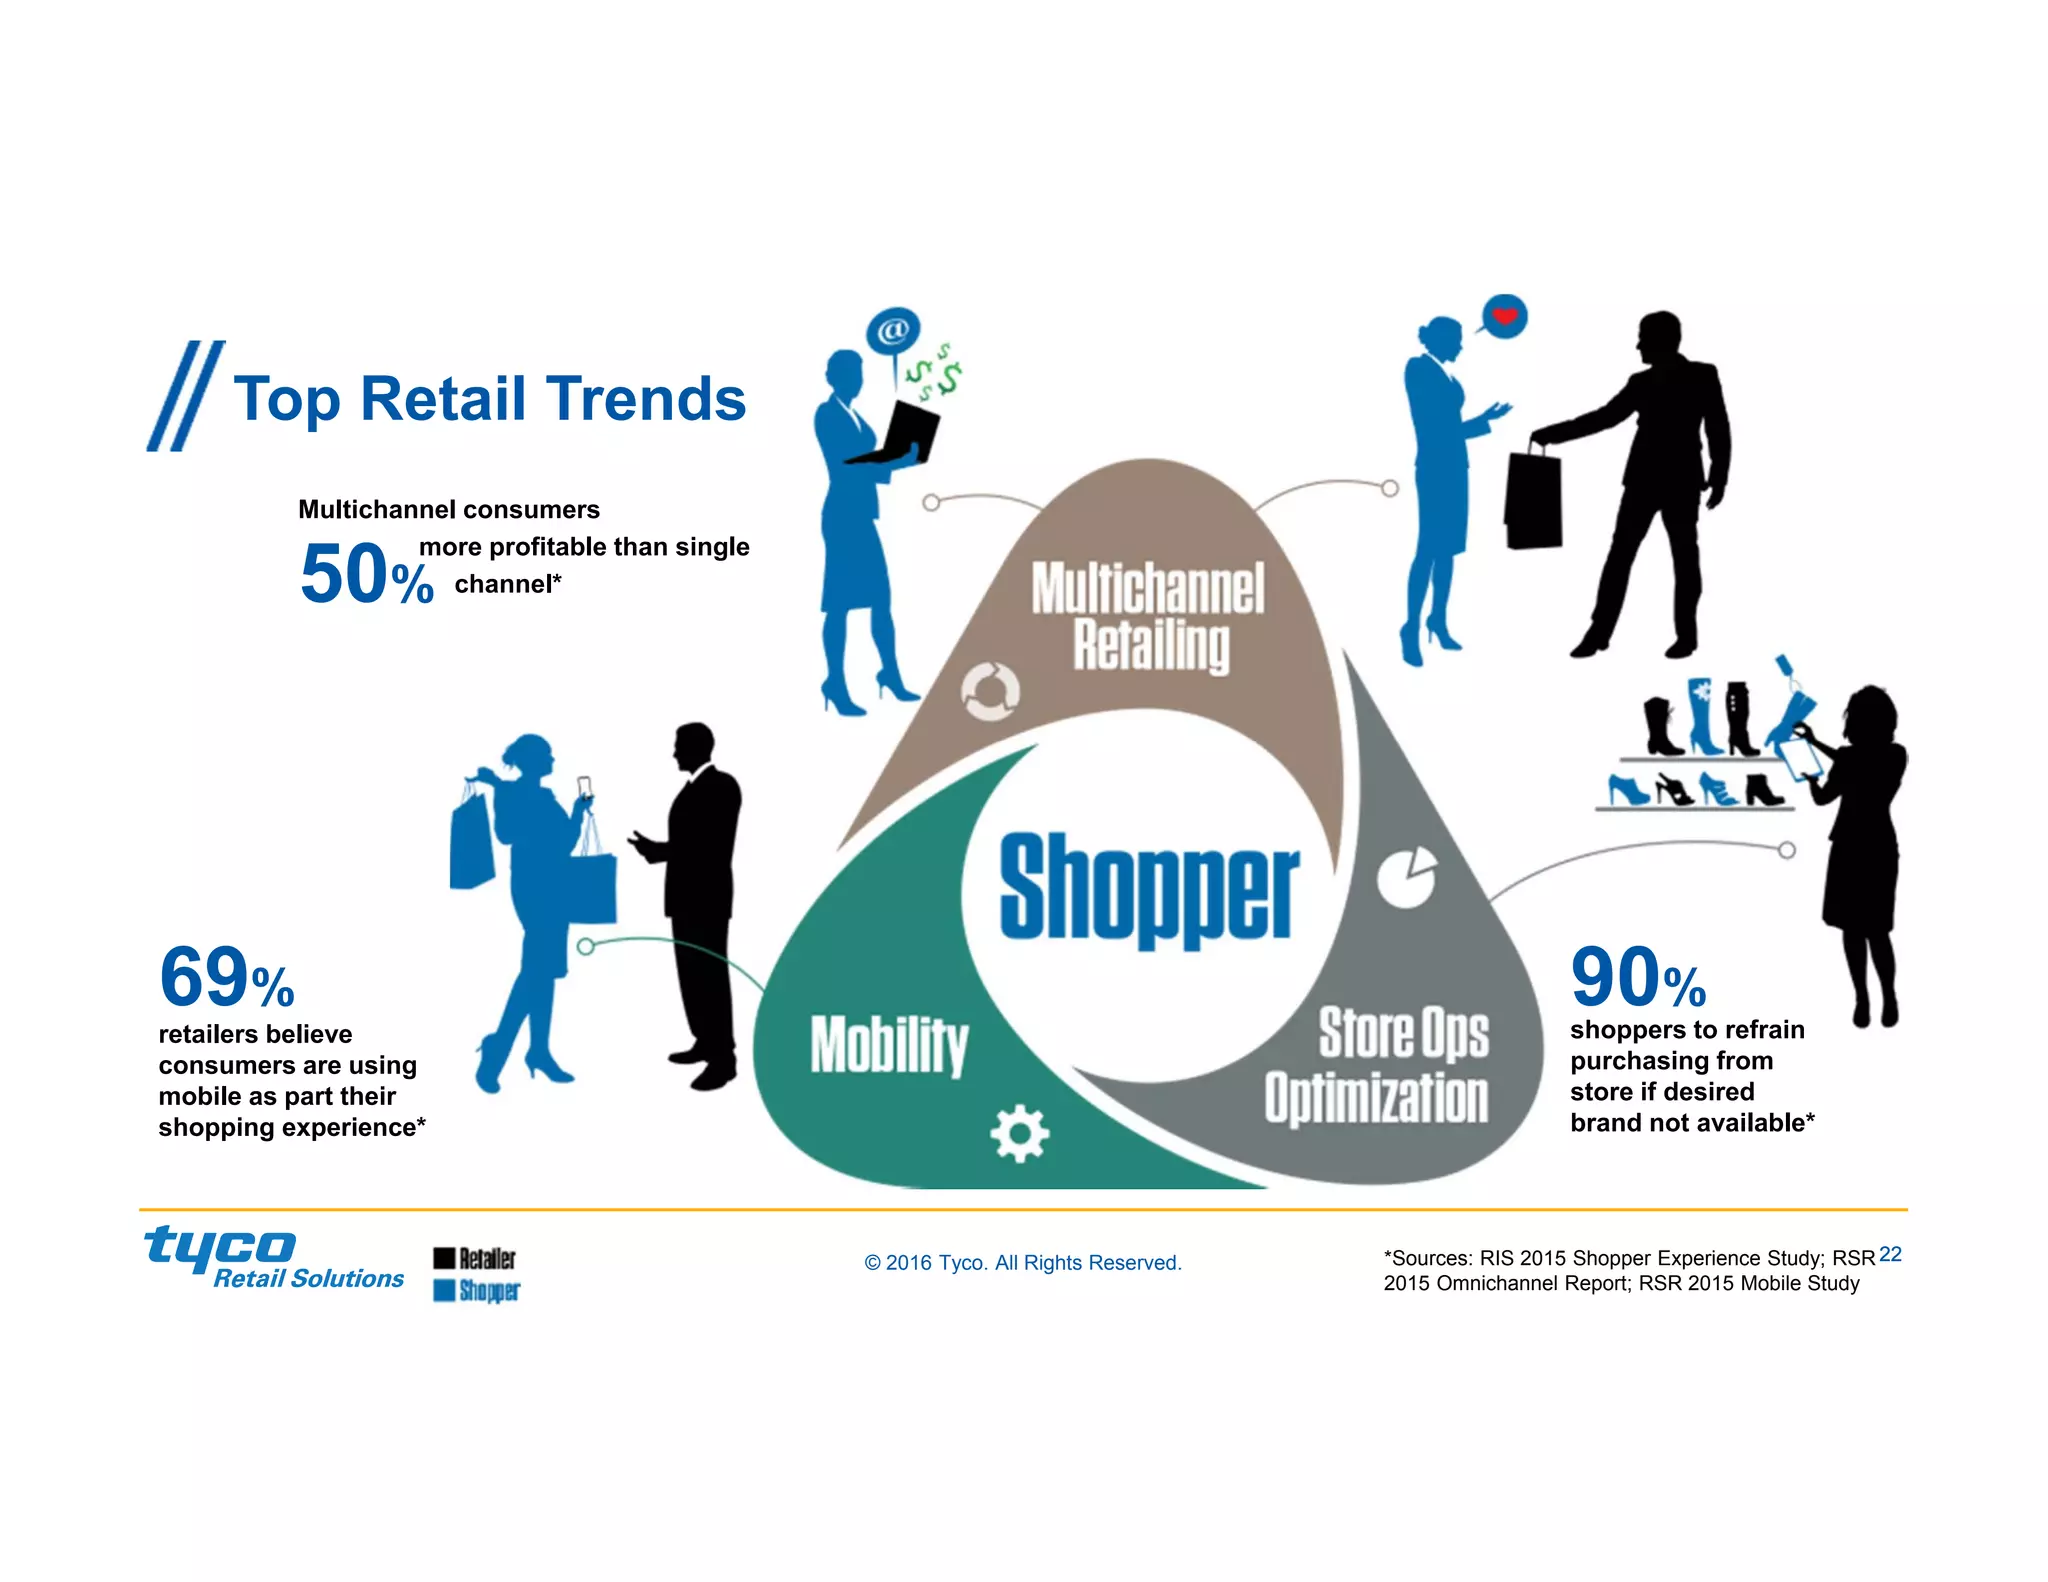
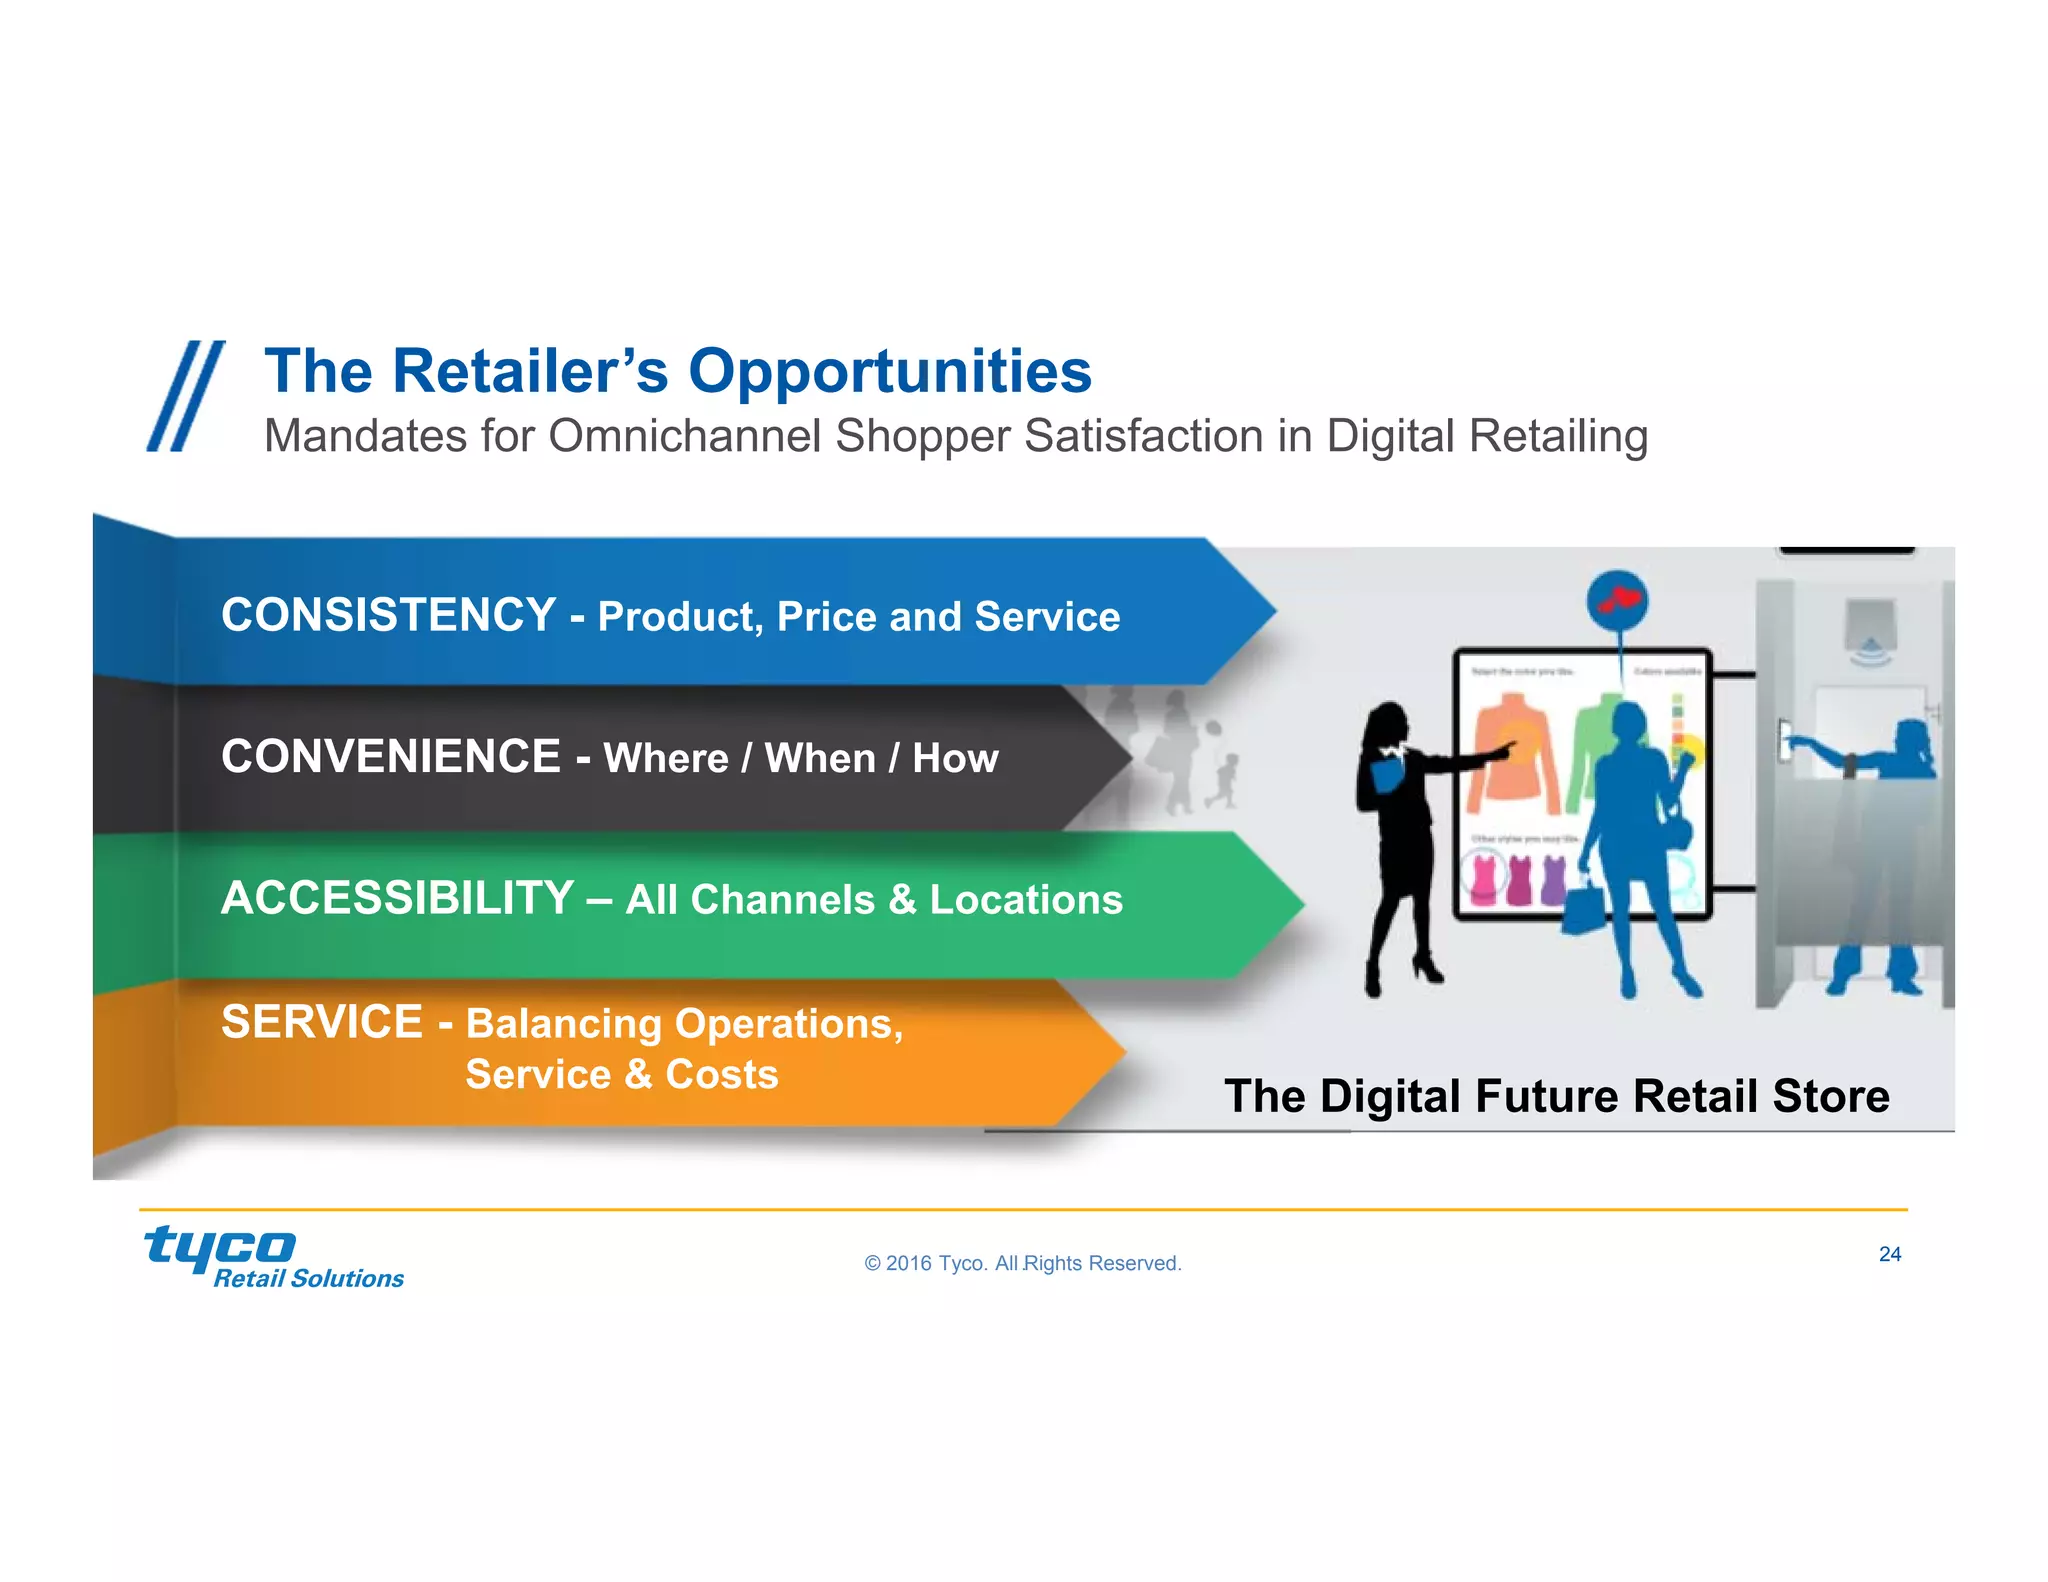
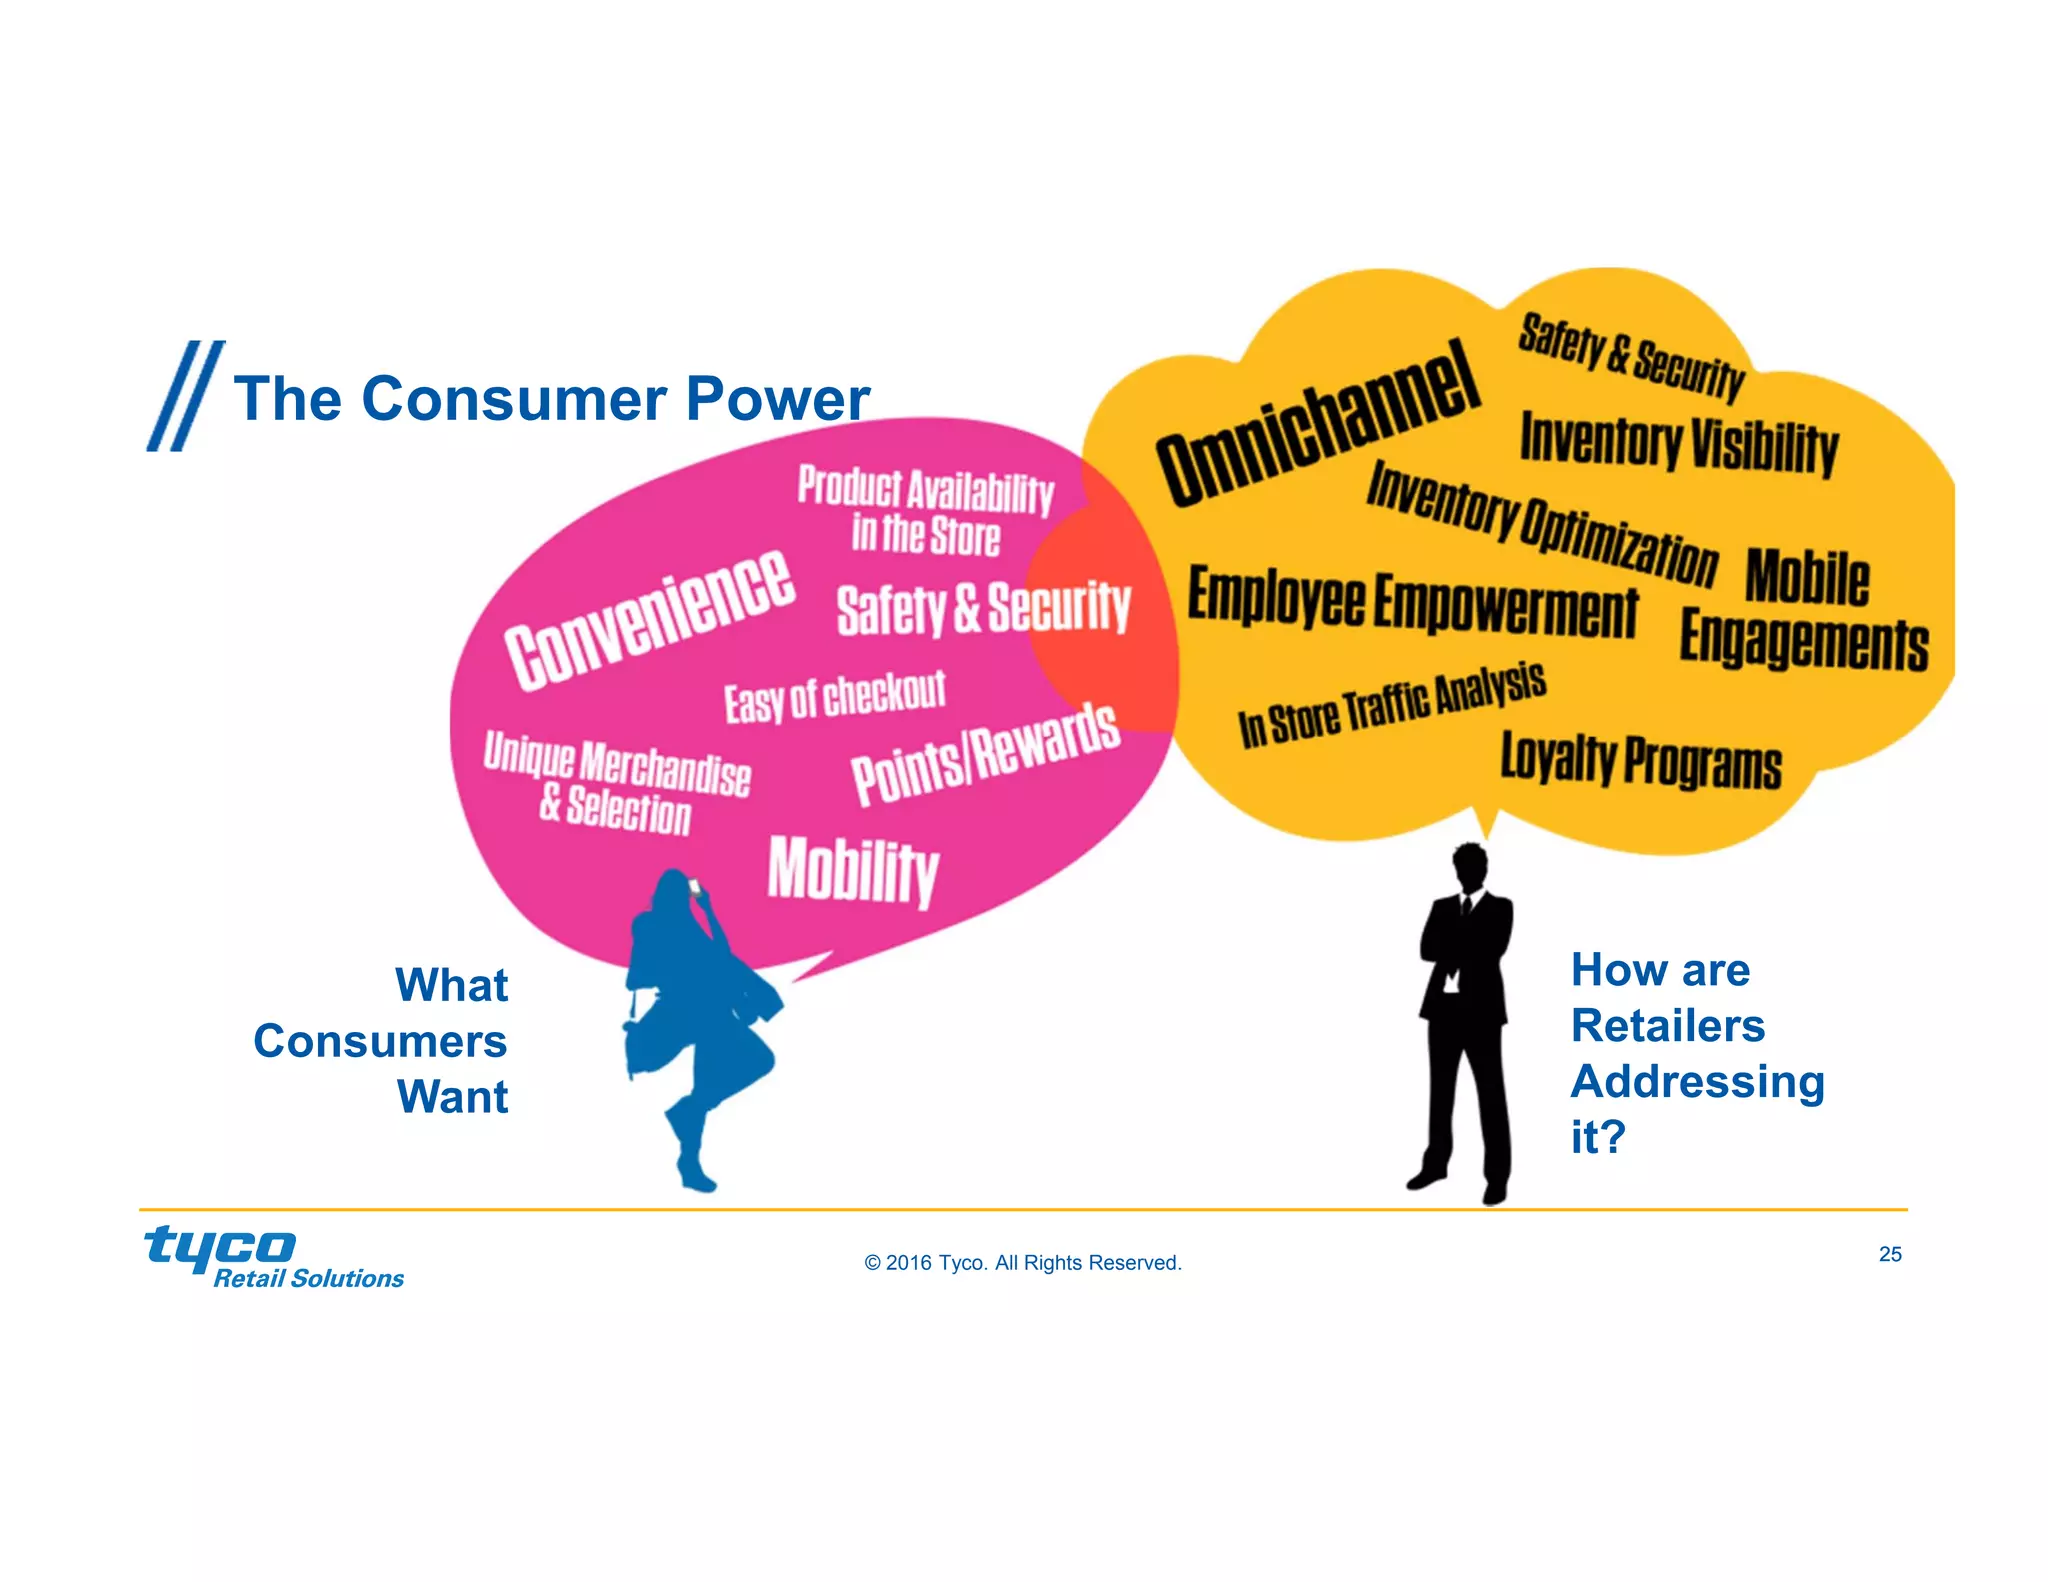
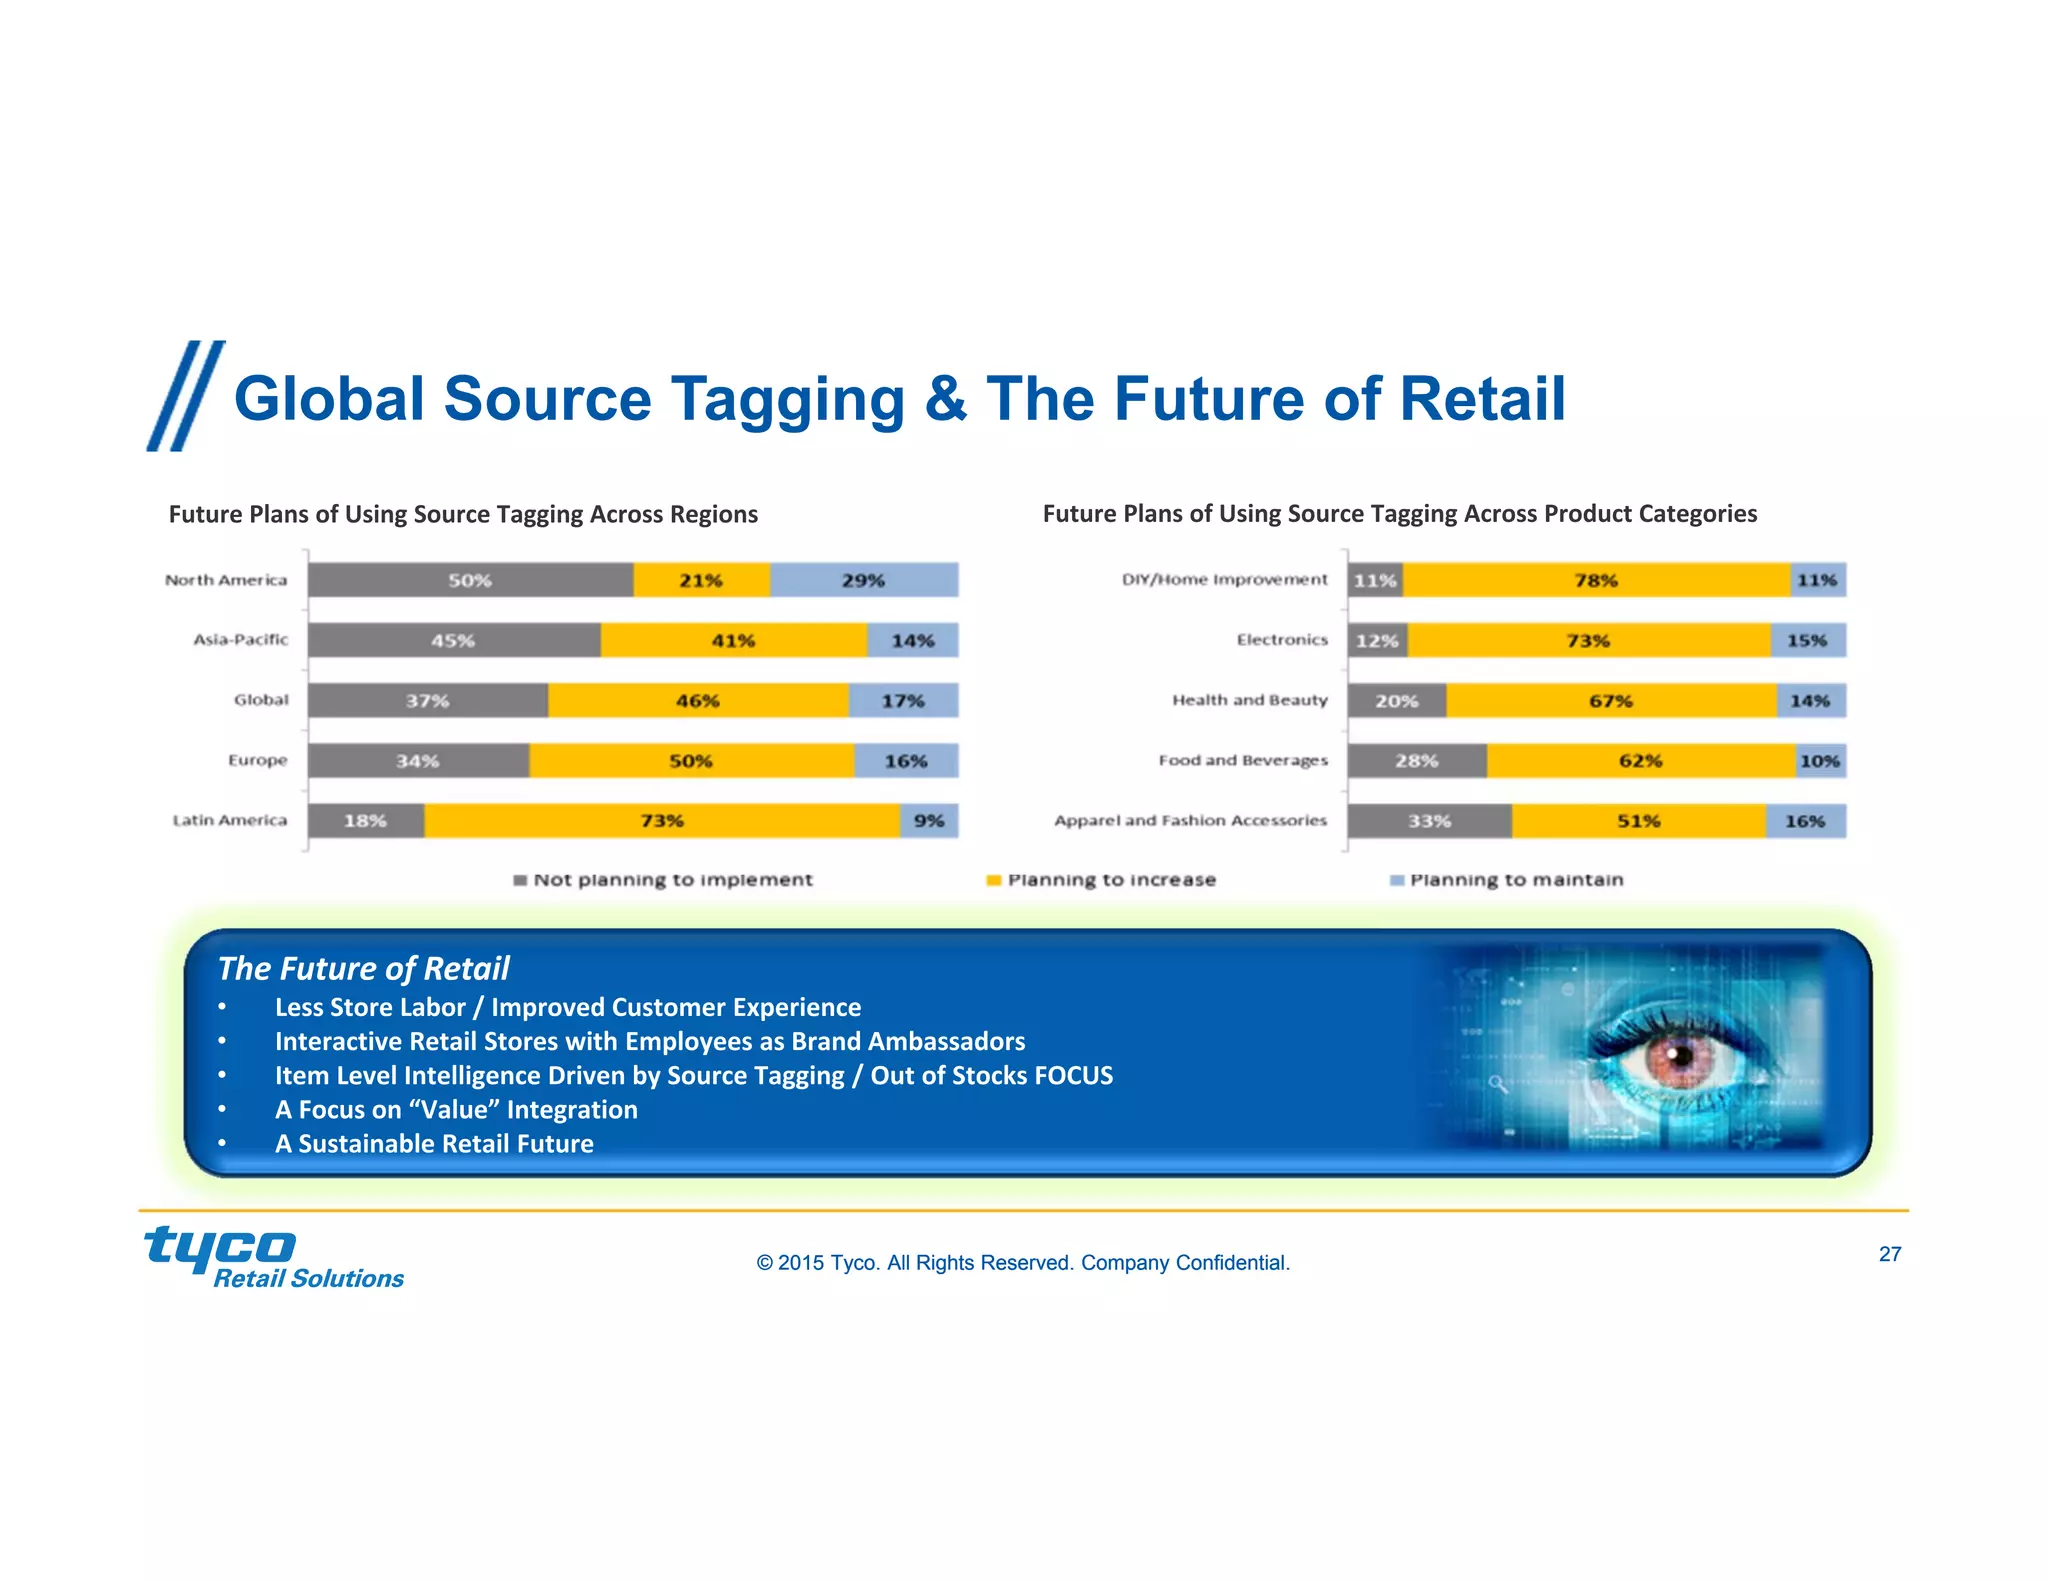
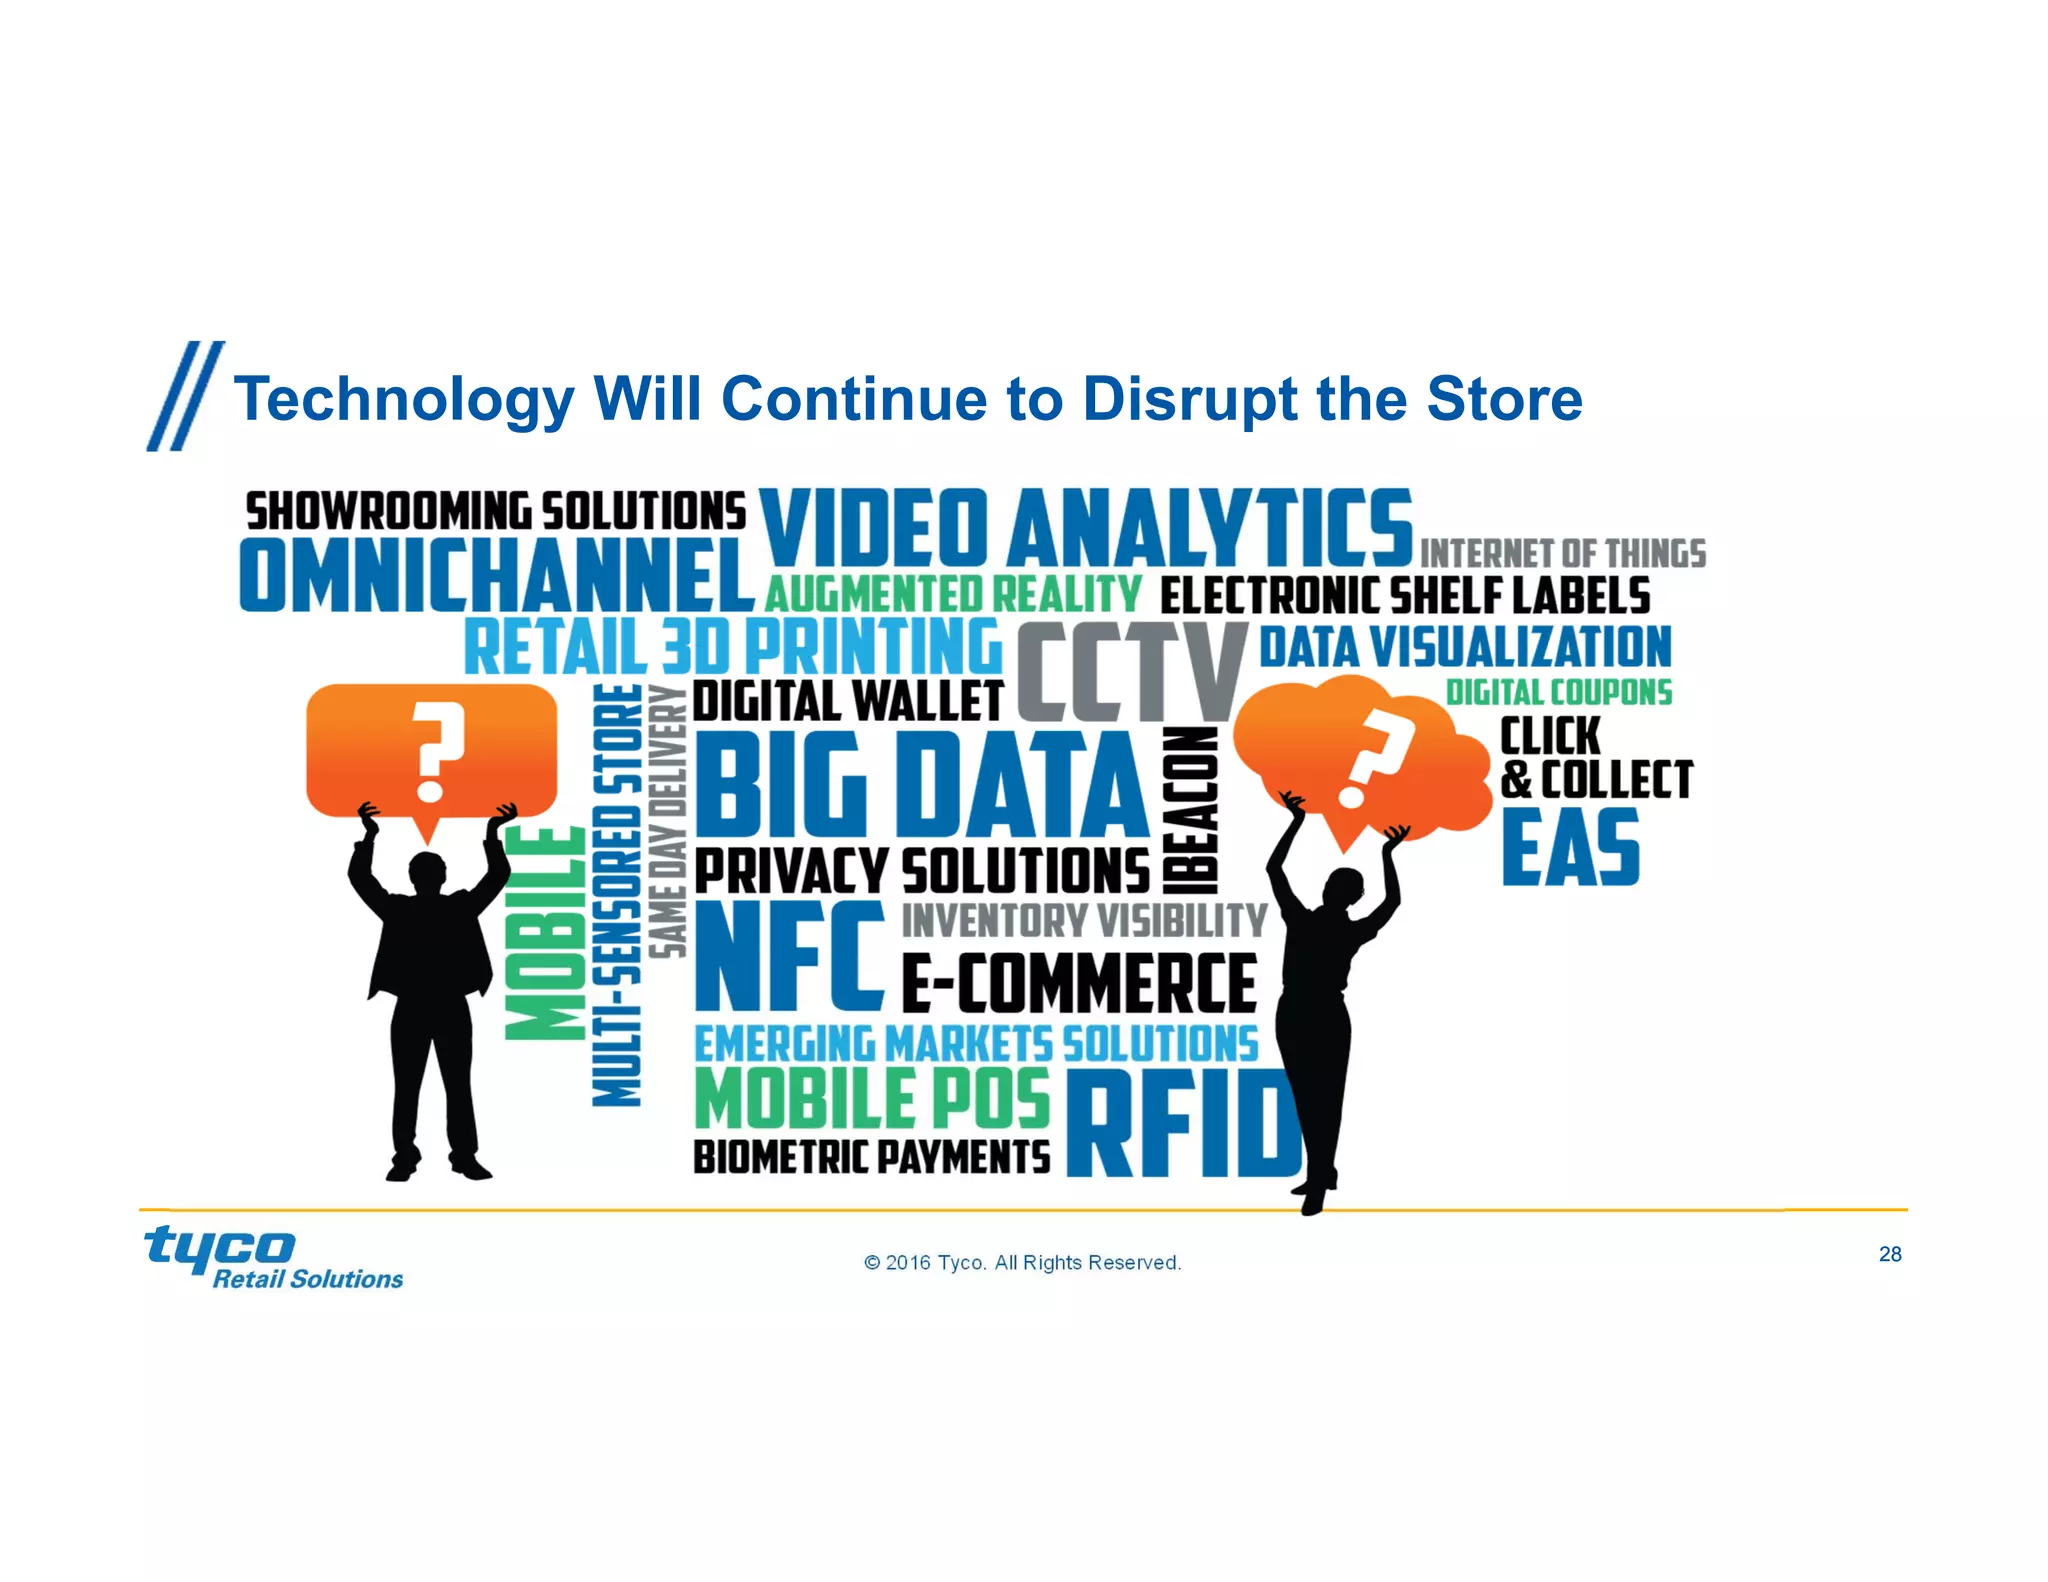
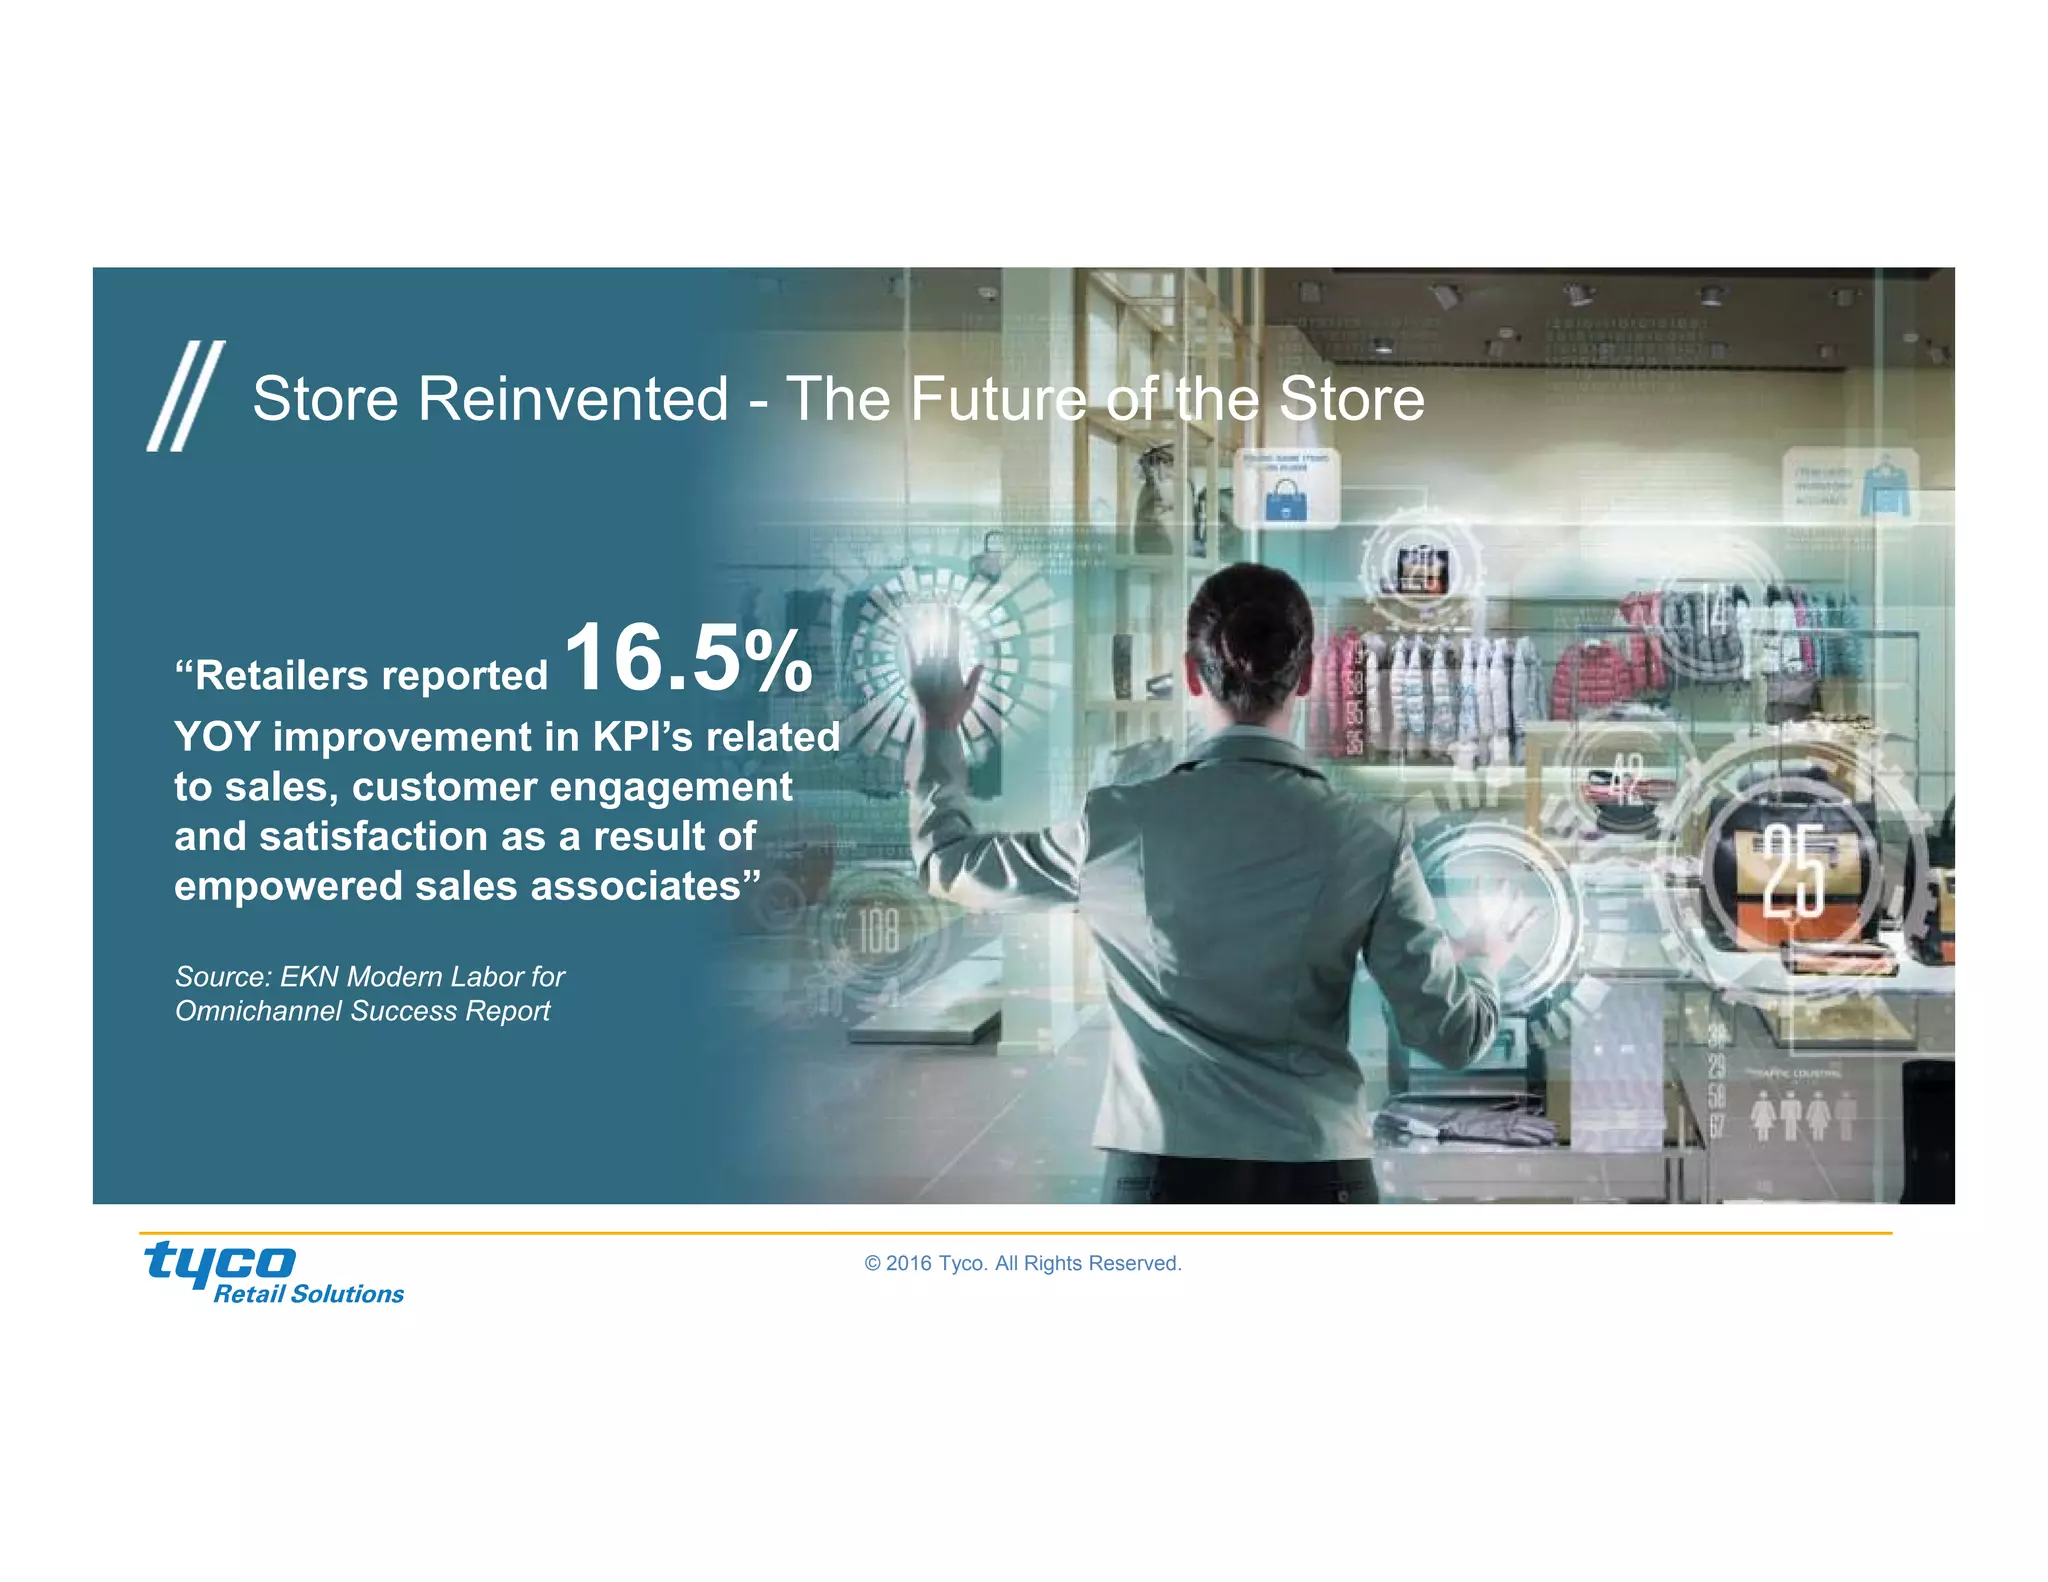
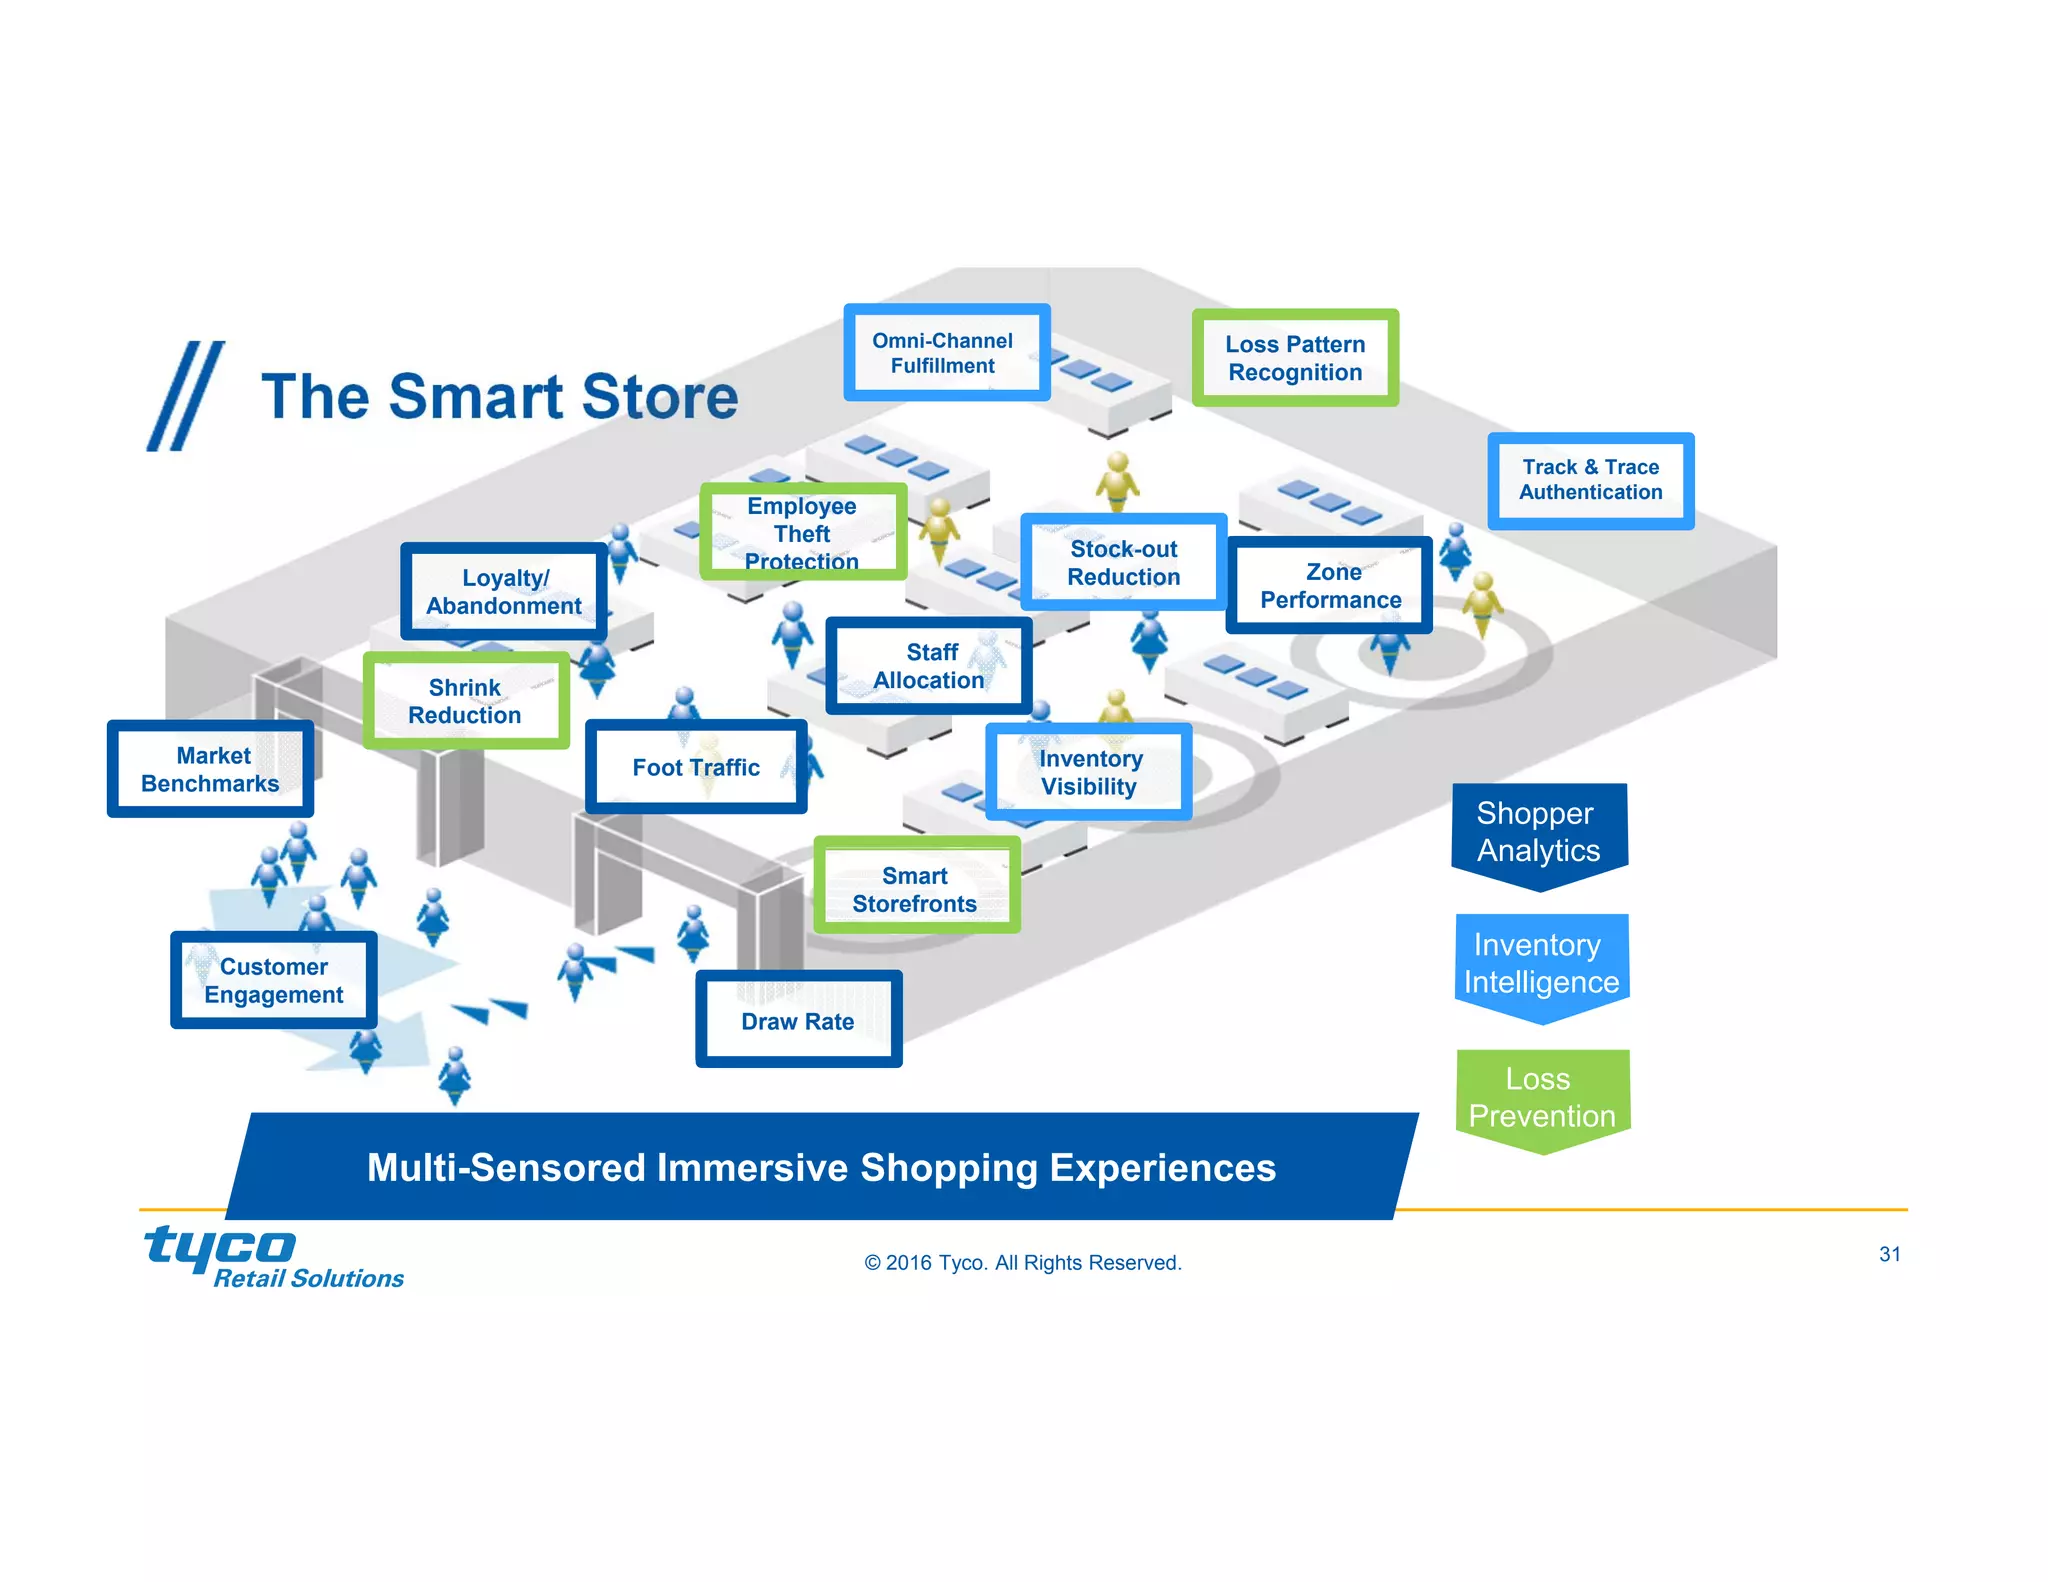
Tony D‘Onofrio
May 2016
The Disruptive
Future of Retail
© 2016 Tyco. All Rights Reserved.
Agenda
2
© 2016 Tyco. All Rights Reserved.
3
Tony D‘Onofrio
May 2016
4© 2016 Tyco. All Rights Reserved.
The Global Retail Market in 2019
Source: Euromonitor
5© 2016 Tyco. All Rights Reserved.
Global Retail Market Data
Store CountRetail Market Growth Sales Volume
Source: Euromonitor
6© 2016 Tyco. All Rights Reserved.
Global Retail Sales – The World is Flat
Best and worst performers: retail sales volume in 2016 (% change)
Russia
Hungary
Ukraine
Azerbaijan
Venezuela
India
China
Algeria
Romania
Vietnam
Worst performers Best performers
-30 -25 -20 -15 -10 -5 0 0 2 4 6 8 10
Up 2.7% in 2016
same as 2015
Sources: The Economist Intelligence Unit, Planet Retail.
2015
2016 forecast
2017 forecast
Retail sales volumes by regions (% change)
Asia-Pacific
Latin
America
Western
Europe
Middle East
& Africa
North
America World
5
4
3
2
1
0
-1
-2
-3
-4
5
4
3
2
1
0
-1
-2
-3
-4
7© 2016 Tyco. All Rights Reserved.
GRDI
Country
Attractiveness
Tyco Confidential
Source: AT Kearney 2015 Global 
Retail Development Index
8© 2016 Tyco. All Rights Reserved.
2015 Global Retail Development Index
Source: AT Kearney 2015 Global 
Retail Development Index
Level of globalization
by product sector, FY2014
Product sector profiles, FY2014
The Global Top 250 Retailers
Source: 2016 Deloitte Global Powers of Retailing
10© 2016 Tyco. All Rights Reserved.
Q Ratio LeadersFastest Growing
Source: 2016 Deloitte Global Powers of Retailing
Top 10 Fastest Growing / Q Ratio Retailers
Retailer Country
FY2009 - 2014 retail
Revenue CAGR¹
RANK Retailer Country Q Ratio
Vipshop Holdings Limited China 320.8% 1 Hermès International SCA France 6.422
JD.com Inc. China 106.3% 2 Tractor Supply Company US 6.113
Axel Johnson AB/ Axfood,
Axstores
Sweden 49.3% 3
H & M Hennes & Mauritz
AB
Sweden 5.811
AB Acquisition LLC (now
Albertsons Companies Inc.)
US 45.3% 4 Inditex S.A. Spain 5.792
Steinhoff International
Holdings Ltd.
S. Africa 41.6% 5 Amazon.com Inc. US 5.307
Southeastern Grocers LLC
(formerly BI-LO Holding LLC)
US
36.0% 6
Nike Inc./Direct to
Consumer
US 5.180
Yonghui Superstores Co.
Ltd.
China
33.7% 7 Next plc UK 4.952
OJSC Dixy Group Russia 33.3% 8 The TJX Companies Inc. US 4.438
Chongqing Department Store
Co. Ltd.
China
32.5% 9 Vipshop Holdings Limited China 4.400
Jumbo Groep Holding B.V. Netherlands 30.1% 10 Ross Stores Inc. US 4.369
© 2016 Tyco. All Rights Reserved.
11
Make Wise
Technology
Choices
Make Wise
Technology
Choices
Tony D‘Onofrio
May 2016
12© 2016 Tyco. All Rights Reserved.
Retailer Losses
Shrinkage Inventory Distortion Returns
Return
$642.6
Overstock
$471.9
Out‐of‐Stocks
$634.1
Source: Global Theft Retail 
Barometer, IHL Group 
13© 2016 Tyco. All Rights Reserved.
Global Retail Shrink Highest Global Shrink Countries 2014 -2015
Cost of Retail Crime as % of Total Sales
39%
16%
7%
38%
Shoplifting Dishonest Employee Theft
Admin/non-crime Loss
Supplier Fraud
Source: Global Theft Barometer, 2014-2015
MEXICO FINLANDNETHERLANDS
FINLAND HONG KONGMEXICO
1.68%1.48% 1.38%
4.48%2.80% 1.38%
14© 2016 Tyco. All Rights Reserved. 14
The Evolution of Loss Prevention
Item Intelligence
Store Intelligence
Item Security
Data & Video 
Analytics
EAS Video RFID
Traffic & Shopper
Analytics
15© 2016 Tyco. All Rights Reserved.
Store Systems Priorities
Top Store System Priorities for 2016
15%
16%
16%
19%
21%
29%
32%
35%
42%
52%
Assisted Selling
Ship-from-Store
Workforce Management
Improved Training Tools
Single Transaction Engine
WAN/WiFi Upgrade
Inventory Visibility
BI/Analytics
Mobile for Associates
Advanced CRM/Loyality
3.9%
Average increase
in-store technology
spending in 2016
Source: 2016 IHL / RIS Store Systems Study
6.5%
5.0% 4.7%
2.8% 2.4%
Predictive
Analytics
Proximity
Marketing
Data
Visualization
RFID Internet of
Things
Emerging Tech
16© 2016 Tyco. All Rights Reserved.
Status of In-Store Technology Deployments
Source: RIS / Gartner Retail Technology Study 2016
6%
7%
11%
13%
16%
19%
25%
27%
29%
31%
19%
15%
18%
20%
20%
22%
21%
20%
20%
12%
15%
16%
12%
19%
19%
17%
21%
17%
10%
11%
13%
8%
15%
12%
12%
14%
6%
12%
9%
9%
Location-based sensing for MarComm
In-store video analytics
Clienteling/guided selling
Shopper tracking capability
Digital devices (signage, kiosks, magic mirrors, etc.)
Real-time store monitoring / KPIs
Mobile devices for associates / manager
In-store pickup / return of web goods
WiFi for customers
In-store shipping
Up-to-date tech in place Started major upgrade
Will start within 12 months Will start within 12-24 months
17© 2016 Tyco. All Rights Reserved. 17
Omnichannel / Multi-Sensored / Mobile Future
SCREEN TIME
(Per Day)
30 Country Millward Brown study of 16-45 year olds
Source:
Transparency
Research
Deloitte Digital
Frost &
Sullivan
Frost &
Sullivan
Global Theft Barometer
IHL Group
IHL Group
$1.5 Trillion
Mobile & Digital
Influence on in‐store
sales in 2014, up
from $334B in 2012
$5,409Million
Retail RFID Market
By 2020, up from
$542M in 2013
$5.8 Billion
Global Wearables
Tech market by 2018,
Up from $750M in 2012
$162 Billion
Global Retail Shrink
$4.3 Trillion
Global Online 
Retail Sales
By 2025, up from
$0.55T in 2011
$1.1 Trillion
Global Inventory Distortion
$634 Billion From 
Out‐Of‐Stocks
63%
Global Retailers
Maintaining / Expanding
Global Source Tagging
Phones
147
minutes
TVs
113
minutes
PCs
108
minutes
18© 2016 Tyco. All Rights Reserved.
Age of Amazon:
Challenges & Opportunities
Source: RIS / Gartner Retail Technology Study 2016
1.
Developing personalized
marketing capabilities 51%
2.
Network and IT systems
security 47%
3.
Leveraging social media
(for sales, CRM, hiring,
customer service, etc.)
46%
4.
New payment technologies
(EMV, contactless, mobile,
etc.)
45%
5.
Expanding unified
commerce (omnichannel)
initiatives
44%
Top 5 major strategies
over the next 18 months
Top 5 challenges
over the next 3 years
1. Customer data security 49%
2.
Retiring legacy
systems 46%
3.
Optimizing digital
commerce as growth
channels
39%
4. Application integration 35%
5.
Optimizing stores as a
growing channel 29%
Investments in technologies that improve the
retailer’s ability to meet customer
expectations, exploit innate strengths,
overcome weakness and disintermediate
others, will move the needle.
Make wise choices.
© 2016 Tyco. All Rights Reserved.
19
The
Disruptive
Future of
Retail
The
Disruptive
Future of
Retail
Tony D‘Onofrio
May 2016
20© 2016 Tyco. All Rights Reserved. 20
Technology Driving Shifts in Retail Power
21© 2016 Tyco. All Rights Reserved. 21
EvolvingTechnologySystems
ImpactingRetail
22© 2016 Tyco. All Rights Reserved. 22
Top Retail Trends
Multichannel consumers
more profitable than single
channel*
shoppers to refrain
purchasing from
store if desired
brand not available*
*Sources: RIS 2015 Shopper Experience Study; RSR
2015 Omnichannel Report; RSR 2015 Mobile Study
retailers believe
consumers are using
mobile as part their
shopping experience*
50%
69% 90%
23© 2016 Tyco. All Rights Reserved. 23
Relevancy of the Store
Educate & empower in-store
employees using technology
#1
Brick & mortar stores account
retailer revenues*
85%
Sources: PSFK and RSR Research; RSR 2015 Store Report
Opportunity for improving
in-store experience*
© 2016 Tyco. All Rights Reserved.. 24
The Retailer’s Opportunities
Mandates for Omnichannel Shopper Satisfaction in Digital Retailing
CONSISTENCY - Product, Price and Service
CONVENIENCE - Where / When / How
ACCESSIBILITY – All Channels & Locations
SERVICE - Balancing Operations,
Service & Costs
The Digital Future Retail Store
25© 2016 Tyco. All Rights Reserved. 25
The Consumer Power
What
Consumers
Want
How are
Retailers
Addressing
it?
26© 2016 Tyco. All Rights Reserved.
The Consumer / Retailer Information Dichotomy
Retailers
Consumers
How do consumers in general feel about disclosing information about themselves? 
0% 20% 40% 60% 80% 100%
Retailers
Consumers
Store employees welcome the customer by name when he or she enters the store
Source: HUI Research (2015)
27© 2015 Tyco. All Rights Reserved. Company Confidential.© 2015 Tyco. All Rights Reserved. Company Confidential. 27
Global Source Tagging & The Future of Retail
Future Plans of Using Source Tagging Across Regions Future Plans of Using Source Tagging Across Product Categories
The Future of Retail
• Less Store Labor / Improved Customer Experience
• Interactive Retail Stores with Employees as Brand Ambassadors
• Item Level Intelligence Driven by Source Tagging / Out of Stocks FOCUS
• A Focus on “Value” Integration
• A Sustainable Retail Future
28© 2016 Tyco. All Rights Reserved. 28
Technology Will Continue to Disrupt the Store
29© 2016 Tyco. All Rights Reserved.
Tony D’Onofrio
Email: adonofrio@tycoint.com
Phone: +41 791 508 208
Thank You
© 2016 Tyco. All Rights Reserved.
Store Reinvented - The Future of the Store
“Retailers reported 16.5%
YOY improvement in KPI’s related
to sales, customer engagement
and satisfaction as a result of
empowered sales associates”
Source: EKN Modern Labor for
Omnichannel Success Report
31© 2016 Tyco. All Rights Reserved.
The Smart Store
Shopper
Analytics
Staff
Allocation
Loyalty/
Abandonment
Zone
Performance
Market
Benchmarks
Customer
Engagement
Draw Rate
Foot Traffic
Inventory
Intelligence
Omni-Channel
Fulfillment
Inventory
Visibility
Track & Trace
Authentication
Stock-out
Reduction
Loss
Prevention
Loss Pattern
Recognition
Employee
Theft
Protection
Shrink
Reduction
Smart
Storefronts
Multi-Sensored Immersive Shopping Experiences
32© 2016 Tyco. All Rights Reserved.
RFID Market in Retail: 2010-2020 Revenue
Note: All figures are rounded. The base year is 2013. Source: Frost & Sullivan
By Products By Region
33© 2016 Tyco. All Rights Reserved.
Benefits from RFID in Retail
Revenue 
Customer Sat 
Product availability
and merchandizing
Reduced OOS
Better display execution
Better omni-channel
execution
Inventory Intelligence
Inventory Accuracy
Margin 
OpEx 
Planning and
allocation
Reduced markdowns
Reduced inventory
carrying costs
Better omni-channel
execution
OpEx 
Labor
efficiency
Counting
Replenishment
Receiving
Stocking
COGS 
Loss
prevention
Shrink pattern
recognition
34© 2016 Tyco. All Rights Reserved.
Macy’s RFID Journey
• Inventory count 1x / year
• Inventory accuracy deteriorates
2-3% per month
• Inventory accuracy 60-70%
BEFORE RFID
• 1x / year & can cycle count up to
24x / year
• Achieve nearly 99% accuracy
w/annual inventory
• Annual inventory accuracy 95%
• RFID categories out performed
non-RFID categories with avg.
10% sales lift
WITH RFID
• B2F – Back to Front, Sales Floor
Replenishment
• Increased sales and margins,
reducing MDs
• 1/3 reduction in basic stock
required on-hand
• Improved display compliance from
avg. 65-70% to nearly 100%
• P2LU – Pick to the Last Unit
• Leverage 15-20% of store
inventory that exits in single units
• Omni-channel readiness enabling
$1B reduction in store inventory
• Sales lift on regular & 1st MD
merchandise
BEYOND 
REPLENISHMENT
Peter Longo
Macy’s, President,
Operations and Logistics -
January 2015
RFID is your foundational ‘air supply’ 
to deliver an omni‐channel promise.
Source: GS1 panel discussion ‐‐ January 13, 2015 at NRF Big Show

The_Disruptive_Future_of_Retail_Mayl_(final)

  • 1.
    Tony D‘Onofrio May 2016 TheDisruptive Future of Retail
  • 2.
    © 2016 Tyco.All Rights Reserved. Agenda 2
  • 3.
    © 2016 Tyco.All Rights Reserved. 3 Tony D‘Onofrio May 2016
  • 4.
    4© 2016 Tyco.All Rights Reserved. The Global Retail Market in 2019 Source: Euromonitor
  • 5.
    5© 2016 Tyco.All Rights Reserved. Global Retail Market Data Store CountRetail Market Growth Sales Volume Source: Euromonitor
  • 6.
    6© 2016 Tyco.All Rights Reserved. Global Retail Sales – The World is Flat Best and worst performers: retail sales volume in 2016 (% change) Russia Hungary Ukraine Azerbaijan Venezuela India China Algeria Romania Vietnam Worst performers Best performers -30 -25 -20 -15 -10 -5 0 0 2 4 6 8 10 Up 2.7% in 2016 same as 2015 Sources: The Economist Intelligence Unit, Planet Retail. 2015 2016 forecast 2017 forecast Retail sales volumes by regions (% change) Asia-Pacific Latin America Western Europe Middle East & Africa North America World 5 4 3 2 1 0 -1 -2 -3 -4 5 4 3 2 1 0 -1 -2 -3 -4
  • 7.
    7© 2016 Tyco.All Rights Reserved. GRDI Country Attractiveness Tyco Confidential Source: AT Kearney 2015 Global  Retail Development Index
  • 8.
    8© 2016 Tyco.All Rights Reserved. 2015 Global Retail Development Index Source: AT Kearney 2015 Global  Retail Development Index
  • 9.
    Level of globalization byproduct sector, FY2014 Product sector profiles, FY2014 The Global Top 250 Retailers Source: 2016 Deloitte Global Powers of Retailing
  • 10.
    10© 2016 Tyco.All Rights Reserved. Q Ratio LeadersFastest Growing Source: 2016 Deloitte Global Powers of Retailing Top 10 Fastest Growing / Q Ratio Retailers Retailer Country FY2009 - 2014 retail Revenue CAGR¹ RANK Retailer Country Q Ratio Vipshop Holdings Limited China 320.8% 1 Hermès International SCA France 6.422 JD.com Inc. China 106.3% 2 Tractor Supply Company US 6.113 Axel Johnson AB/ Axfood, Axstores Sweden 49.3% 3 H & M Hennes & Mauritz AB Sweden 5.811 AB Acquisition LLC (now Albertsons Companies Inc.) US 45.3% 4 Inditex S.A. Spain 5.792 Steinhoff International Holdings Ltd. S. Africa 41.6% 5 Amazon.com Inc. US 5.307 Southeastern Grocers LLC (formerly BI-LO Holding LLC) US 36.0% 6 Nike Inc./Direct to Consumer US 5.180 Yonghui Superstores Co. Ltd. China 33.7% 7 Next plc UK 4.952 OJSC Dixy Group Russia 33.3% 8 The TJX Companies Inc. US 4.438 Chongqing Department Store Co. Ltd. China 32.5% 9 Vipshop Holdings Limited China 4.400 Jumbo Groep Holding B.V. Netherlands 30.1% 10 Ross Stores Inc. US 4.369
  • 11.
    © 2016 Tyco.All Rights Reserved. 11 Make Wise Technology Choices Make Wise Technology Choices Tony D‘Onofrio May 2016
  • 12.
    12© 2016 Tyco.All Rights Reserved. Retailer Losses Shrinkage Inventory Distortion Returns Return $642.6 Overstock $471.9 Out‐of‐Stocks $634.1 Source: Global Theft Retail  Barometer, IHL Group 
  • 13.
    13© 2016 Tyco.All Rights Reserved. Global Retail Shrink Highest Global Shrink Countries 2014 -2015 Cost of Retail Crime as % of Total Sales 39% 16% 7% 38% Shoplifting Dishonest Employee Theft Admin/non-crime Loss Supplier Fraud Source: Global Theft Barometer, 2014-2015 MEXICO FINLANDNETHERLANDS FINLAND HONG KONGMEXICO 1.68%1.48% 1.38% 4.48%2.80% 1.38%
  • 14.
    14© 2016 Tyco.All Rights Reserved. 14 The Evolution of Loss Prevention Item Intelligence Store Intelligence Item Security Data & Video  Analytics EAS Video RFID Traffic & Shopper Analytics
  • 15.
    15© 2016 Tyco.All Rights Reserved. Store Systems Priorities Top Store System Priorities for 2016 15% 16% 16% 19% 21% 29% 32% 35% 42% 52% Assisted Selling Ship-from-Store Workforce Management Improved Training Tools Single Transaction Engine WAN/WiFi Upgrade Inventory Visibility BI/Analytics Mobile for Associates Advanced CRM/Loyality 3.9% Average increase in-store technology spending in 2016 Source: 2016 IHL / RIS Store Systems Study 6.5% 5.0% 4.7% 2.8% 2.4% Predictive Analytics Proximity Marketing Data Visualization RFID Internet of Things Emerging Tech
  • 16.
    16© 2016 Tyco.All Rights Reserved. Status of In-Store Technology Deployments Source: RIS / Gartner Retail Technology Study 2016 6% 7% 11% 13% 16% 19% 25% 27% 29% 31% 19% 15% 18% 20% 20% 22% 21% 20% 20% 12% 15% 16% 12% 19% 19% 17% 21% 17% 10% 11% 13% 8% 15% 12% 12% 14% 6% 12% 9% 9% Location-based sensing for MarComm In-store video analytics Clienteling/guided selling Shopper tracking capability Digital devices (signage, kiosks, magic mirrors, etc.) Real-time store monitoring / KPIs Mobile devices for associates / manager In-store pickup / return of web goods WiFi for customers In-store shipping Up-to-date tech in place Started major upgrade Will start within 12 months Will start within 12-24 months
  • 17.
    17© 2016 Tyco.All Rights Reserved. 17 Omnichannel / Multi-Sensored / Mobile Future SCREEN TIME (Per Day) 30 Country Millward Brown study of 16-45 year olds Source: Transparency Research Deloitte Digital Frost & Sullivan Frost & Sullivan Global Theft Barometer IHL Group IHL Group $1.5 Trillion Mobile & Digital Influence on in‐store sales in 2014, up from $334B in 2012 $5,409Million Retail RFID Market By 2020, up from $542M in 2013 $5.8 Billion Global Wearables Tech market by 2018, Up from $750M in 2012 $162 Billion Global Retail Shrink $4.3 Trillion Global Online  Retail Sales By 2025, up from $0.55T in 2011 $1.1 Trillion Global Inventory Distortion $634 Billion From  Out‐Of‐Stocks 63% Global Retailers Maintaining / Expanding Global Source Tagging Phones 147 minutes TVs 113 minutes PCs 108 minutes
  • 18.
    18© 2016 Tyco.All Rights Reserved. Age of Amazon: Challenges & Opportunities Source: RIS / Gartner Retail Technology Study 2016 1. Developing personalized marketing capabilities 51% 2. Network and IT systems security 47% 3. Leveraging social media (for sales, CRM, hiring, customer service, etc.) 46% 4. New payment technologies (EMV, contactless, mobile, etc.) 45% 5. Expanding unified commerce (omnichannel) initiatives 44% Top 5 major strategies over the next 18 months Top 5 challenges over the next 3 years 1. Customer data security 49% 2. Retiring legacy systems 46% 3. Optimizing digital commerce as growth channels 39% 4. Application integration 35% 5. Optimizing stores as a growing channel 29% Investments in technologies that improve the retailer’s ability to meet customer expectations, exploit innate strengths, overcome weakness and disintermediate others, will move the needle. Make wise choices.
  • 19.
    © 2016 Tyco.All Rights Reserved. 19 The Disruptive Future of Retail The Disruptive Future of Retail Tony D‘Onofrio May 2016
  • 20.
    20© 2016 Tyco.All Rights Reserved. 20 Technology Driving Shifts in Retail Power
  • 21.
    21© 2016 Tyco.All Rights Reserved. 21 EvolvingTechnologySystems ImpactingRetail
  • 22.
    22© 2016 Tyco.All Rights Reserved. 22 Top Retail Trends Multichannel consumers more profitable than single channel* shoppers to refrain purchasing from store if desired brand not available* *Sources: RIS 2015 Shopper Experience Study; RSR 2015 Omnichannel Report; RSR 2015 Mobile Study retailers believe consumers are using mobile as part their shopping experience* 50% 69% 90%
  • 23.
    23© 2016 Tyco.All Rights Reserved. 23 Relevancy of the Store Educate & empower in-store employees using technology #1 Brick & mortar stores account retailer revenues* 85% Sources: PSFK and RSR Research; RSR 2015 Store Report Opportunity for improving in-store experience*
  • 24.
    © 2016 Tyco.All Rights Reserved.. 24 The Retailer’s Opportunities Mandates for Omnichannel Shopper Satisfaction in Digital Retailing CONSISTENCY - Product, Price and Service CONVENIENCE - Where / When / How ACCESSIBILITY – All Channels & Locations SERVICE - Balancing Operations, Service & Costs The Digital Future Retail Store
  • 25.
    25© 2016 Tyco.All Rights Reserved. 25 The Consumer Power What Consumers Want How are Retailers Addressing it?
  • 26.
    26© 2016 Tyco.All Rights Reserved. The Consumer / Retailer Information Dichotomy Retailers Consumers How do consumers in general feel about disclosing information about themselves?  0% 20% 40% 60% 80% 100% Retailers Consumers Store employees welcome the customer by name when he or she enters the store Source: HUI Research (2015)
  • 27.
    27© 2015 Tyco.All Rights Reserved. Company Confidential.© 2015 Tyco. All Rights Reserved. Company Confidential. 27 Global Source Tagging & The Future of Retail Future Plans of Using Source Tagging Across Regions Future Plans of Using Source Tagging Across Product Categories The Future of Retail • Less Store Labor / Improved Customer Experience • Interactive Retail Stores with Employees as Brand Ambassadors • Item Level Intelligence Driven by Source Tagging / Out of Stocks FOCUS • A Focus on “Value” Integration • A Sustainable Retail Future
  • 28.
    28© 2016 Tyco.All Rights Reserved. 28 Technology Will Continue to Disrupt the Store
  • 29.
    29© 2016 Tyco.All Rights Reserved. Tony D’Onofrio Email: adonofrio@tycoint.com Phone: +41 791 508 208 Thank You
  • 30.
    © 2016 Tyco.All Rights Reserved. Store Reinvented - The Future of the Store “Retailers reported 16.5% YOY improvement in KPI’s related to sales, customer engagement and satisfaction as a result of empowered sales associates” Source: EKN Modern Labor for Omnichannel Success Report
  • 31.
    31© 2016 Tyco.All Rights Reserved. The Smart Store Shopper Analytics Staff Allocation Loyalty/ Abandonment Zone Performance Market Benchmarks Customer Engagement Draw Rate Foot Traffic Inventory Intelligence Omni-Channel Fulfillment Inventory Visibility Track & Trace Authentication Stock-out Reduction Loss Prevention Loss Pattern Recognition Employee Theft Protection Shrink Reduction Smart Storefronts Multi-Sensored Immersive Shopping Experiences
  • 32.
    32© 2016 Tyco.All Rights Reserved. RFID Market in Retail: 2010-2020 Revenue Note: All figures are rounded. The base year is 2013. Source: Frost & Sullivan By Products By Region
  • 33.
    33© 2016 Tyco.All Rights Reserved. Benefits from RFID in Retail Revenue  Customer Sat  Product availability and merchandizing Reduced OOS Better display execution Better omni-channel execution Inventory Intelligence Inventory Accuracy Margin  OpEx  Planning and allocation Reduced markdowns Reduced inventory carrying costs Better omni-channel execution OpEx  Labor efficiency Counting Replenishment Receiving Stocking COGS  Loss prevention Shrink pattern recognition
  • 34.
    34© 2016 Tyco.All Rights Reserved. Macy’s RFID Journey • Inventory count 1x / year • Inventory accuracy deteriorates 2-3% per month • Inventory accuracy 60-70% BEFORE RFID • 1x / year & can cycle count up to 24x / year • Achieve nearly 99% accuracy w/annual inventory • Annual inventory accuracy 95% • RFID categories out performed non-RFID categories with avg. 10% sales lift WITH RFID • B2F – Back to Front, Sales Floor Replenishment • Increased sales and margins, reducing MDs • 1/3 reduction in basic stock required on-hand • Improved display compliance from avg. 65-70% to nearly 100% • P2LU – Pick to the Last Unit • Leverage 15-20% of store inventory that exits in single units • Omni-channel readiness enabling $1B reduction in store inventory • Sales lift on regular & 1st MD merchandise BEYOND  REPLENISHMENT Peter Longo Macy’s, President, Operations and Logistics - January 2015 RFID is your foundational ‘air supply’  to deliver an omni‐channel promise. Source: GS1 panel discussion ‐‐ January 13, 2015 at NRF Big Show