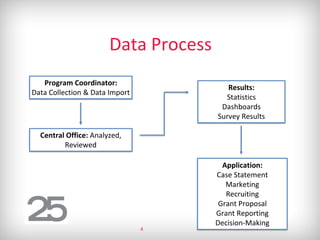
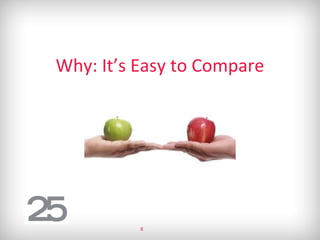
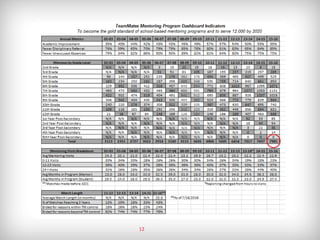
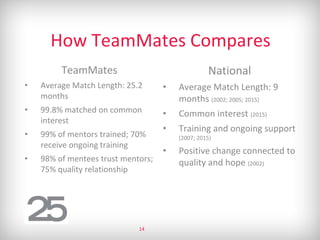
The Science Behind
TeamMates
Tess Starman
Data and Match Support Specialist
TeamMates Mentoring
1
Agenda
• How do we currently collect and use
data?
• Why do we do it?
• How does our Program look? How does
it compare?
• Now what?
2
Where do you use data?
How do you use data?
3
Data Process
Program Coordinator:
Data Collection & Data Import
Central Office: Analyzed,
Reviewed
Results:
Statistics
Dashboards
Survey Results
Application:
Case Statement
Marketing
Recruiting
Grant Proposal
Grant Reporting
Decision-Making
4
But, Why?
5
Why: It’s a Clear Picture
6
Why: It Speaks to People
7
Why: It’s Easy to Compare
8
Why: It Shows The Impact
9
Why: It Aligns us with Our
Mission and Vision
10
Why: It Measures the Gold
Standard
What does the Gold
Standard mean to you?
11
12
How does your Chapter impact
these statistics?
How do YOU impact these
statistics?
13
How TeamMates Compares
TeamMates
• Average Match Length: 25.2
months
• 99.8% matched on common
interest
• 99% of mentors trained; 70%
receive ongoing training
• 98% of mentees trust mentors;
75% quality relationship
National
• Average Match Length: 9
months (2002; 2005; 2015)
• Common interest (2015)
• Training and ongoing support
(2007; 2015)
• Positive change connected to
quality and hope (2002)
14
Partnership Day 3: Now What?
• Resources available
• Data Specialist
• Case Statement
• Dashboard & Dashboards 101 Guide
• Data Import
15
Experiment
16
Thank you!
Tess Starman
Data and Match Support Specialist
TeamMates Mentoring
tstarman@teammates.org
402-680-7341
17

The Science Behind TeamMates

  • 1.
    The Science Behind TeamMates TessStarman Data and Match Support Specialist TeamMates Mentoring 1
  • 2.
    Agenda • How dowe currently collect and use data? • Why do we do it? • How does our Program look? How does it compare? • Now what? 2
  • 3.
    Where do youuse data? How do you use data? 3
  • 4.
    Data Process Program Coordinator: DataCollection & Data Import Central Office: Analyzed, Reviewed Results: Statistics Dashboards Survey Results Application: Case Statement Marketing Recruiting Grant Proposal Grant Reporting Decision-Making 4
  • 5.
  • 6.
    Why: It’s aClear Picture 6
  • 7.
    Why: It Speaksto People 7
  • 8.
    Why: It’s Easyto Compare 8
  • 9.
    Why: It ShowsThe Impact 9
  • 10.
    Why: It Alignsus with Our Mission and Vision 10
  • 11.
    Why: It Measuresthe Gold Standard What does the Gold Standard mean to you? 11
  • 12.
  • 13.
    How does yourChapter impact these statistics? How do YOU impact these statistics? 13
  • 14.
    How TeamMates Compares TeamMates •Average Match Length: 25.2 months • 99.8% matched on common interest • 99% of mentors trained; 70% receive ongoing training • 98% of mentees trust mentors; 75% quality relationship National • Average Match Length: 9 months (2002; 2005; 2015) • Common interest (2015) • Training and ongoing support (2007; 2015) • Positive change connected to quality and hope (2002) 14
  • 15.
    Partnership Day 3:Now What? • Resources available • Data Specialist • Case Statement • Dashboard & Dashboards 101 Guide • Data Import 15
  • 16.
  • 17.
    Thank you! Tess Starman Dataand Match Support Specialist TeamMates Mentoring tstarman@teammates.org 402-680-7341 17