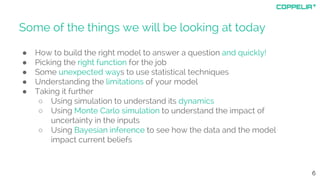
Modelling for Decisions
Using Monte Carlo simulation, Bayesian inference and a
lot of common sense
A quick introduction
Photo credits at www.coppelia.
io/photo-credits/
Who is this person?
Simon Raper
Founder of data sciences
service company called
COPPELIA
Started coding
when I was 8 on a
ZX-81
Then abandoned
the sciences until I
was 25! And was
shocked
But I was really lucky
Dot com boom gave me a
crash course in IT
(allowed to do
ANYTHING!)
Did machine learning not
financial engineering!
Lots of business experience,
especially in media
(Channel 4, ITV, News UK,
McDonalds, Unilever, AOL,
Credit-Suisse, Jaguar,
Sainsbury’s)
3
Areas of Expertise
classical statistics
(R, SPSS, SAS, matlab)
bayesian statistics
(R, winbugs)
simulation
(agent-based, system dynamics)
big data
(aws, hadoop, hive, spark, mahout, mongodb)
machine learning
(R, mahout, mllib)
coding
(R, python, java, sql, javascript, d3)
4
Some past projects Machine4 at Channel 4
The Content Universe at
Channel 4
Market Simulation at
mindshare
Bayesian and mixed
effects modelling at
mindshare
Drunks and Lampposts
5
Some of the things we will be looking at today
● How to build the right model to answer a question and quickly!
● Picking the right function for the job
● Some unexpected ways to use statistical techniques
● Understanding the limitations of your model
● Taking it further
○ Using simulation to understand its dynamics
○ Using Monte Carlo simulation to understand the impact of
uncertainty in the inputs
○ Using Bayesian inference to see how the data and the model
impact current beliefs
6
To begin with a controversial statement!
The majority of statistical models used in business are either unnecessary or
used inappropriately.
There’s a reluctance to ask why a statistical model is needed and whether it is worth
the effort of development.
In many cases we would be better served by clear thinking about a specific problem
(how the data relates to the business decision) resorting to statistical modelling (as
opposed to plain old fashioned mathematical modelling) only where the benefits are
obvious.
7
So what does make a good model?
A good model in this sense has the following virtues. (They might seem obvious but it
is surprising how often they are forgotten!)
● It captures all the features of the world that are relevant to the decision and
leaves out those which are not
● Its purpose is to relate the available data to the decision
● It only uses statistical theory when the benefits outweigh the costs
● It incorporates common sense assumptions
● It incorporates uncertainty
● Its inadequacies are understood and communicated to the decision maker
8
Some wisdom to keep in the back of your head
There is a quote attributed to John Tukey (himself a founding figure in statistics)
“An approximate answer to the right problem is worth a good deal more
“than an exact answer to an approximate problem.”
And another very popular but always true (almost by definition) quote by George Box
“All models are wrong but some are useful”
9
Now for a real decision and some data
The decision: The CMO has to decide on next year's marketing budget. She would like
to how much she should spend in total on product P.
The available data are:
● A time series of weekly sales for product P going back five years
● A time series of weekly marketing spend for product P going back five years
● Annual sales figures for P and its three main competitors going back five years
● Annual marketing spend for P and its three main competitors going back five
years
● Some research showing the demographic profile of buyers of product P and the
amount of switching there is in the category
10
What they never mention in the text books!
The work needs to be done in a day and there is only one person who can
work on it. (Note the time and resource constraints have a huge impact on
the choice of approach)
11
The paranoid statistician’s checklist
● Is it representative?
● How well does it cover all the
possibilities?
● Is it accurate?
● Are there missing values?
12
Always start by looking at the data
13
The next move: add as much info as you can
Where can you find this information?
1. Common sense
2. Questions to the decision maker (or anyone else who
understands the domain)
3. Logical constraints
14
And list all your common sense assumptions
(nothing is too obvious)
1. If you don't spend anything then there will be no uplift due to marketing spend!
2. There's a threshold below which any spend will be effective. Obviously if I spend only £10 nothing is
going to happen (unless it's bribing a single customer!)
3. There's an eventual limit to what marketing spend can do (it can't generate more sales than there
are people who can buy the product)
4. It's likely that marketing spend will be most effective on those who are least loyal to a competitor
brand
5. For business/political reasons there's a minimum and a maximum possible budget available
6. The effectiveness of marketing spend will be constrained by the reach of our marketing channels
7. The effectiveness of marketing spend will be determined by competitor spend
8. There will be a default position which the decision maker resorts to in the absence of any
information from you (e.g. spend the same as last year)
9. There's a whole load of other factors (creative, choice of channels, overall strategy) that will affect
the impact of the marketing spend
15
You can tame a problem by picking the right
function
16
We have good
reasons for picking
this one
The problem is reduced to finding values for the
parameters
Some barmat calculations for L:
11.5 million men who would buy the product
product lasts 2 weeks
cost £1
max annual sales 26x11.5= 300 million
sales of all four brands are 290 million so 10
million headroom
90% are loyal buyers, 10% switch regularly
P has 50% of the market and so has 5% of the
10% but another 5% available.
0.05 x 290 + 0.62 x 10 = 21 million
only 15% reachable by media 21x0.15 = 3 million
17
Does this seem very very
rough? Yes. But are taking
note of that. Later we will
look at how sensitive our
results are to these
assumptions.
The data should help us here but … an impasse: we
don’t have the uplifts
Call in the econometricians for a 3 month project?
Are we really stuck
though?
18
The solution is common sense and some nice tricks!
19
Yes it’s rough but it does the job: we can make
decisions
20
And now the important thing is understanding how it
is wrong and what that means!
1. Competitors not dealt with
2. Conditional on assumptions
3. Confounding factors
4. Scale of precision
5. Not a statistical model
21
Nevertheless….
Another example using the logistic curve
A web start-up has just launched its new product. Customers pay per day to use the product so
the number of customers can drop as well as rise over time. However word does seem to be
spreading as the daily number of customers appears to be climbing
They want to know two things
1. When should they spend their marketing budget?
2. For financial planning purposes they would like to know when the adoption curve will start
to level out. They have done their own market sizing work and they estimate that this will
happen at about 4000 customers a day. At their most pessimistic they put it at 3000 and at
the most optimistic they say 5000.
22
We can use the simulation to understand the impact
of feedback loops
23
And we can use Monte Carlo simulation to explore
the impact of uncertainty
A wide concept but in our case we are talking about using computer simulated random
sampling to model the effect of uncertainty in the inputs to a system on the outputs of that
system
1. Define inputs
2. Generate inputs from probability distribution
3. Perform computation on inputs
4. Aggregate results
24
Finally we might be interested in what the data says
about our assumptions
A Bayesian example: A wet umbrella
● Prior belief = Fairly certain it is not raining
● Data = Man walks into the room with a wet umbrella
● Model = Wet umbrellas highly improbable without rain
● Posterior belief: Shifted to fairly certain it is raining
25
We can use Bayesian methods to understand how
the data might update our beliefs about L
26
A quick recap
● How to build the right model to answer a question and quickly!
● Picking the right function for the job
● Some unexpected ways to use statistical techniques
● Understanding the limitations of your model
● Taking it further
○ Using simulation to understand its dynamics
○ Using Monte Carlo simulation to understand the impact of
uncertainty in the inputs
○ Using Bayesian inference to see how the data and the model
impact current beliefs
27
28
Thank you
If you’d like to know more talk to me at simon@coppelia.io
Follow me on twitter @coppeliamla
Or visit my blog www.coppelia.io/blog

Modelling for decisions

  • 1.
    Modelling for Decisions UsingMonte Carlo simulation, Bayesian inference and a lot of common sense
  • 2.
    A quick introduction Photocredits at www.coppelia. io/photo-credits/
  • 3.
    Who is thisperson? Simon Raper Founder of data sciences service company called COPPELIA Started coding when I was 8 on a ZX-81 Then abandoned the sciences until I was 25! And was shocked But I was really lucky Dot com boom gave me a crash course in IT (allowed to do ANYTHING!) Did machine learning not financial engineering! Lots of business experience, especially in media (Channel 4, ITV, News UK, McDonalds, Unilever, AOL, Credit-Suisse, Jaguar, Sainsbury’s) 3
  • 4.
    Areas of Expertise classicalstatistics (R, SPSS, SAS, matlab) bayesian statistics (R, winbugs) simulation (agent-based, system dynamics) big data (aws, hadoop, hive, spark, mahout, mongodb) machine learning (R, mahout, mllib) coding (R, python, java, sql, javascript, d3) 4
  • 5.
    Some past projectsMachine4 at Channel 4 The Content Universe at Channel 4 Market Simulation at mindshare Bayesian and mixed effects modelling at mindshare Drunks and Lampposts 5
  • 6.
    Some of thethings we will be looking at today ● How to build the right model to answer a question and quickly! ● Picking the right function for the job ● Some unexpected ways to use statistical techniques ● Understanding the limitations of your model ● Taking it further ○ Using simulation to understand its dynamics ○ Using Monte Carlo simulation to understand the impact of uncertainty in the inputs ○ Using Bayesian inference to see how the data and the model impact current beliefs 6
  • 7.
    To begin witha controversial statement! The majority of statistical models used in business are either unnecessary or used inappropriately. There’s a reluctance to ask why a statistical model is needed and whether it is worth the effort of development. In many cases we would be better served by clear thinking about a specific problem (how the data relates to the business decision) resorting to statistical modelling (as opposed to plain old fashioned mathematical modelling) only where the benefits are obvious. 7
  • 8.
    So what doesmake a good model? A good model in this sense has the following virtues. (They might seem obvious but it is surprising how often they are forgotten!) ● It captures all the features of the world that are relevant to the decision and leaves out those which are not ● Its purpose is to relate the available data to the decision ● It only uses statistical theory when the benefits outweigh the costs ● It incorporates common sense assumptions ● It incorporates uncertainty ● Its inadequacies are understood and communicated to the decision maker 8
  • 9.
    Some wisdom tokeep in the back of your head There is a quote attributed to John Tukey (himself a founding figure in statistics) “An approximate answer to the right problem is worth a good deal more “than an exact answer to an approximate problem.” And another very popular but always true (almost by definition) quote by George Box “All models are wrong but some are useful” 9
  • 10.
    Now for areal decision and some data The decision: The CMO has to decide on next year's marketing budget. She would like to how much she should spend in total on product P. The available data are: ● A time series of weekly sales for product P going back five years ● A time series of weekly marketing spend for product P going back five years ● Annual sales figures for P and its three main competitors going back five years ● Annual marketing spend for P and its three main competitors going back five years ● Some research showing the demographic profile of buyers of product P and the amount of switching there is in the category 10
  • 11.
    What they nevermention in the text books! The work needs to be done in a day and there is only one person who can work on it. (Note the time and resource constraints have a huge impact on the choice of approach) 11
  • 12.
    The paranoid statistician’schecklist ● Is it representative? ● How well does it cover all the possibilities? ● Is it accurate? ● Are there missing values? 12
  • 13.
    Always start bylooking at the data 13
  • 14.
    The next move:add as much info as you can Where can you find this information? 1. Common sense 2. Questions to the decision maker (or anyone else who understands the domain) 3. Logical constraints 14
  • 15.
    And list allyour common sense assumptions (nothing is too obvious) 1. If you don't spend anything then there will be no uplift due to marketing spend! 2. There's a threshold below which any spend will be effective. Obviously if I spend only £10 nothing is going to happen (unless it's bribing a single customer!) 3. There's an eventual limit to what marketing spend can do (it can't generate more sales than there are people who can buy the product) 4. It's likely that marketing spend will be most effective on those who are least loyal to a competitor brand 5. For business/political reasons there's a minimum and a maximum possible budget available 6. The effectiveness of marketing spend will be constrained by the reach of our marketing channels 7. The effectiveness of marketing spend will be determined by competitor spend 8. There will be a default position which the decision maker resorts to in the absence of any information from you (e.g. spend the same as last year) 9. There's a whole load of other factors (creative, choice of channels, overall strategy) that will affect the impact of the marketing spend 15
  • 16.
    You can tamea problem by picking the right function 16 We have good reasons for picking this one
  • 17.
    The problem isreduced to finding values for the parameters Some barmat calculations for L: 11.5 million men who would buy the product product lasts 2 weeks cost £1 max annual sales 26x11.5= 300 million sales of all four brands are 290 million so 10 million headroom 90% are loyal buyers, 10% switch regularly P has 50% of the market and so has 5% of the 10% but another 5% available. 0.05 x 290 + 0.62 x 10 = 21 million only 15% reachable by media 21x0.15 = 3 million 17 Does this seem very very rough? Yes. But are taking note of that. Later we will look at how sensitive our results are to these assumptions.
  • 18.
    The data shouldhelp us here but … an impasse: we don’t have the uplifts Call in the econometricians for a 3 month project? Are we really stuck though? 18
  • 19.
    The solution iscommon sense and some nice tricks! 19
  • 20.
    Yes it’s roughbut it does the job: we can make decisions 20
  • 21.
    And now theimportant thing is understanding how it is wrong and what that means! 1. Competitors not dealt with 2. Conditional on assumptions 3. Confounding factors 4. Scale of precision 5. Not a statistical model 21 Nevertheless….
  • 22.
    Another example usingthe logistic curve A web start-up has just launched its new product. Customers pay per day to use the product so the number of customers can drop as well as rise over time. However word does seem to be spreading as the daily number of customers appears to be climbing They want to know two things 1. When should they spend their marketing budget? 2. For financial planning purposes they would like to know when the adoption curve will start to level out. They have done their own market sizing work and they estimate that this will happen at about 4000 customers a day. At their most pessimistic they put it at 3000 and at the most optimistic they say 5000. 22
  • 23.
    We can usethe simulation to understand the impact of feedback loops 23
  • 24.
    And we canuse Monte Carlo simulation to explore the impact of uncertainty A wide concept but in our case we are talking about using computer simulated random sampling to model the effect of uncertainty in the inputs to a system on the outputs of that system 1. Define inputs 2. Generate inputs from probability distribution 3. Perform computation on inputs 4. Aggregate results 24
  • 25.
    Finally we mightbe interested in what the data says about our assumptions A Bayesian example: A wet umbrella ● Prior belief = Fairly certain it is not raining ● Data = Man walks into the room with a wet umbrella ● Model = Wet umbrellas highly improbable without rain ● Posterior belief: Shifted to fairly certain it is raining 25
  • 26.
    We can useBayesian methods to understand how the data might update our beliefs about L 26
  • 27.
    A quick recap ●How to build the right model to answer a question and quickly! ● Picking the right function for the job ● Some unexpected ways to use statistical techniques ● Understanding the limitations of your model ● Taking it further ○ Using simulation to understand its dynamics ○ Using Monte Carlo simulation to understand the impact of uncertainty in the inputs ○ Using Bayesian inference to see how the data and the model impact current beliefs 27
  • 28.
    28 Thank you If you’dlike to know more talk to me at simon@coppelia.io Follow me on twitter @coppeliamla Or visit my blog www.coppelia.io/blog