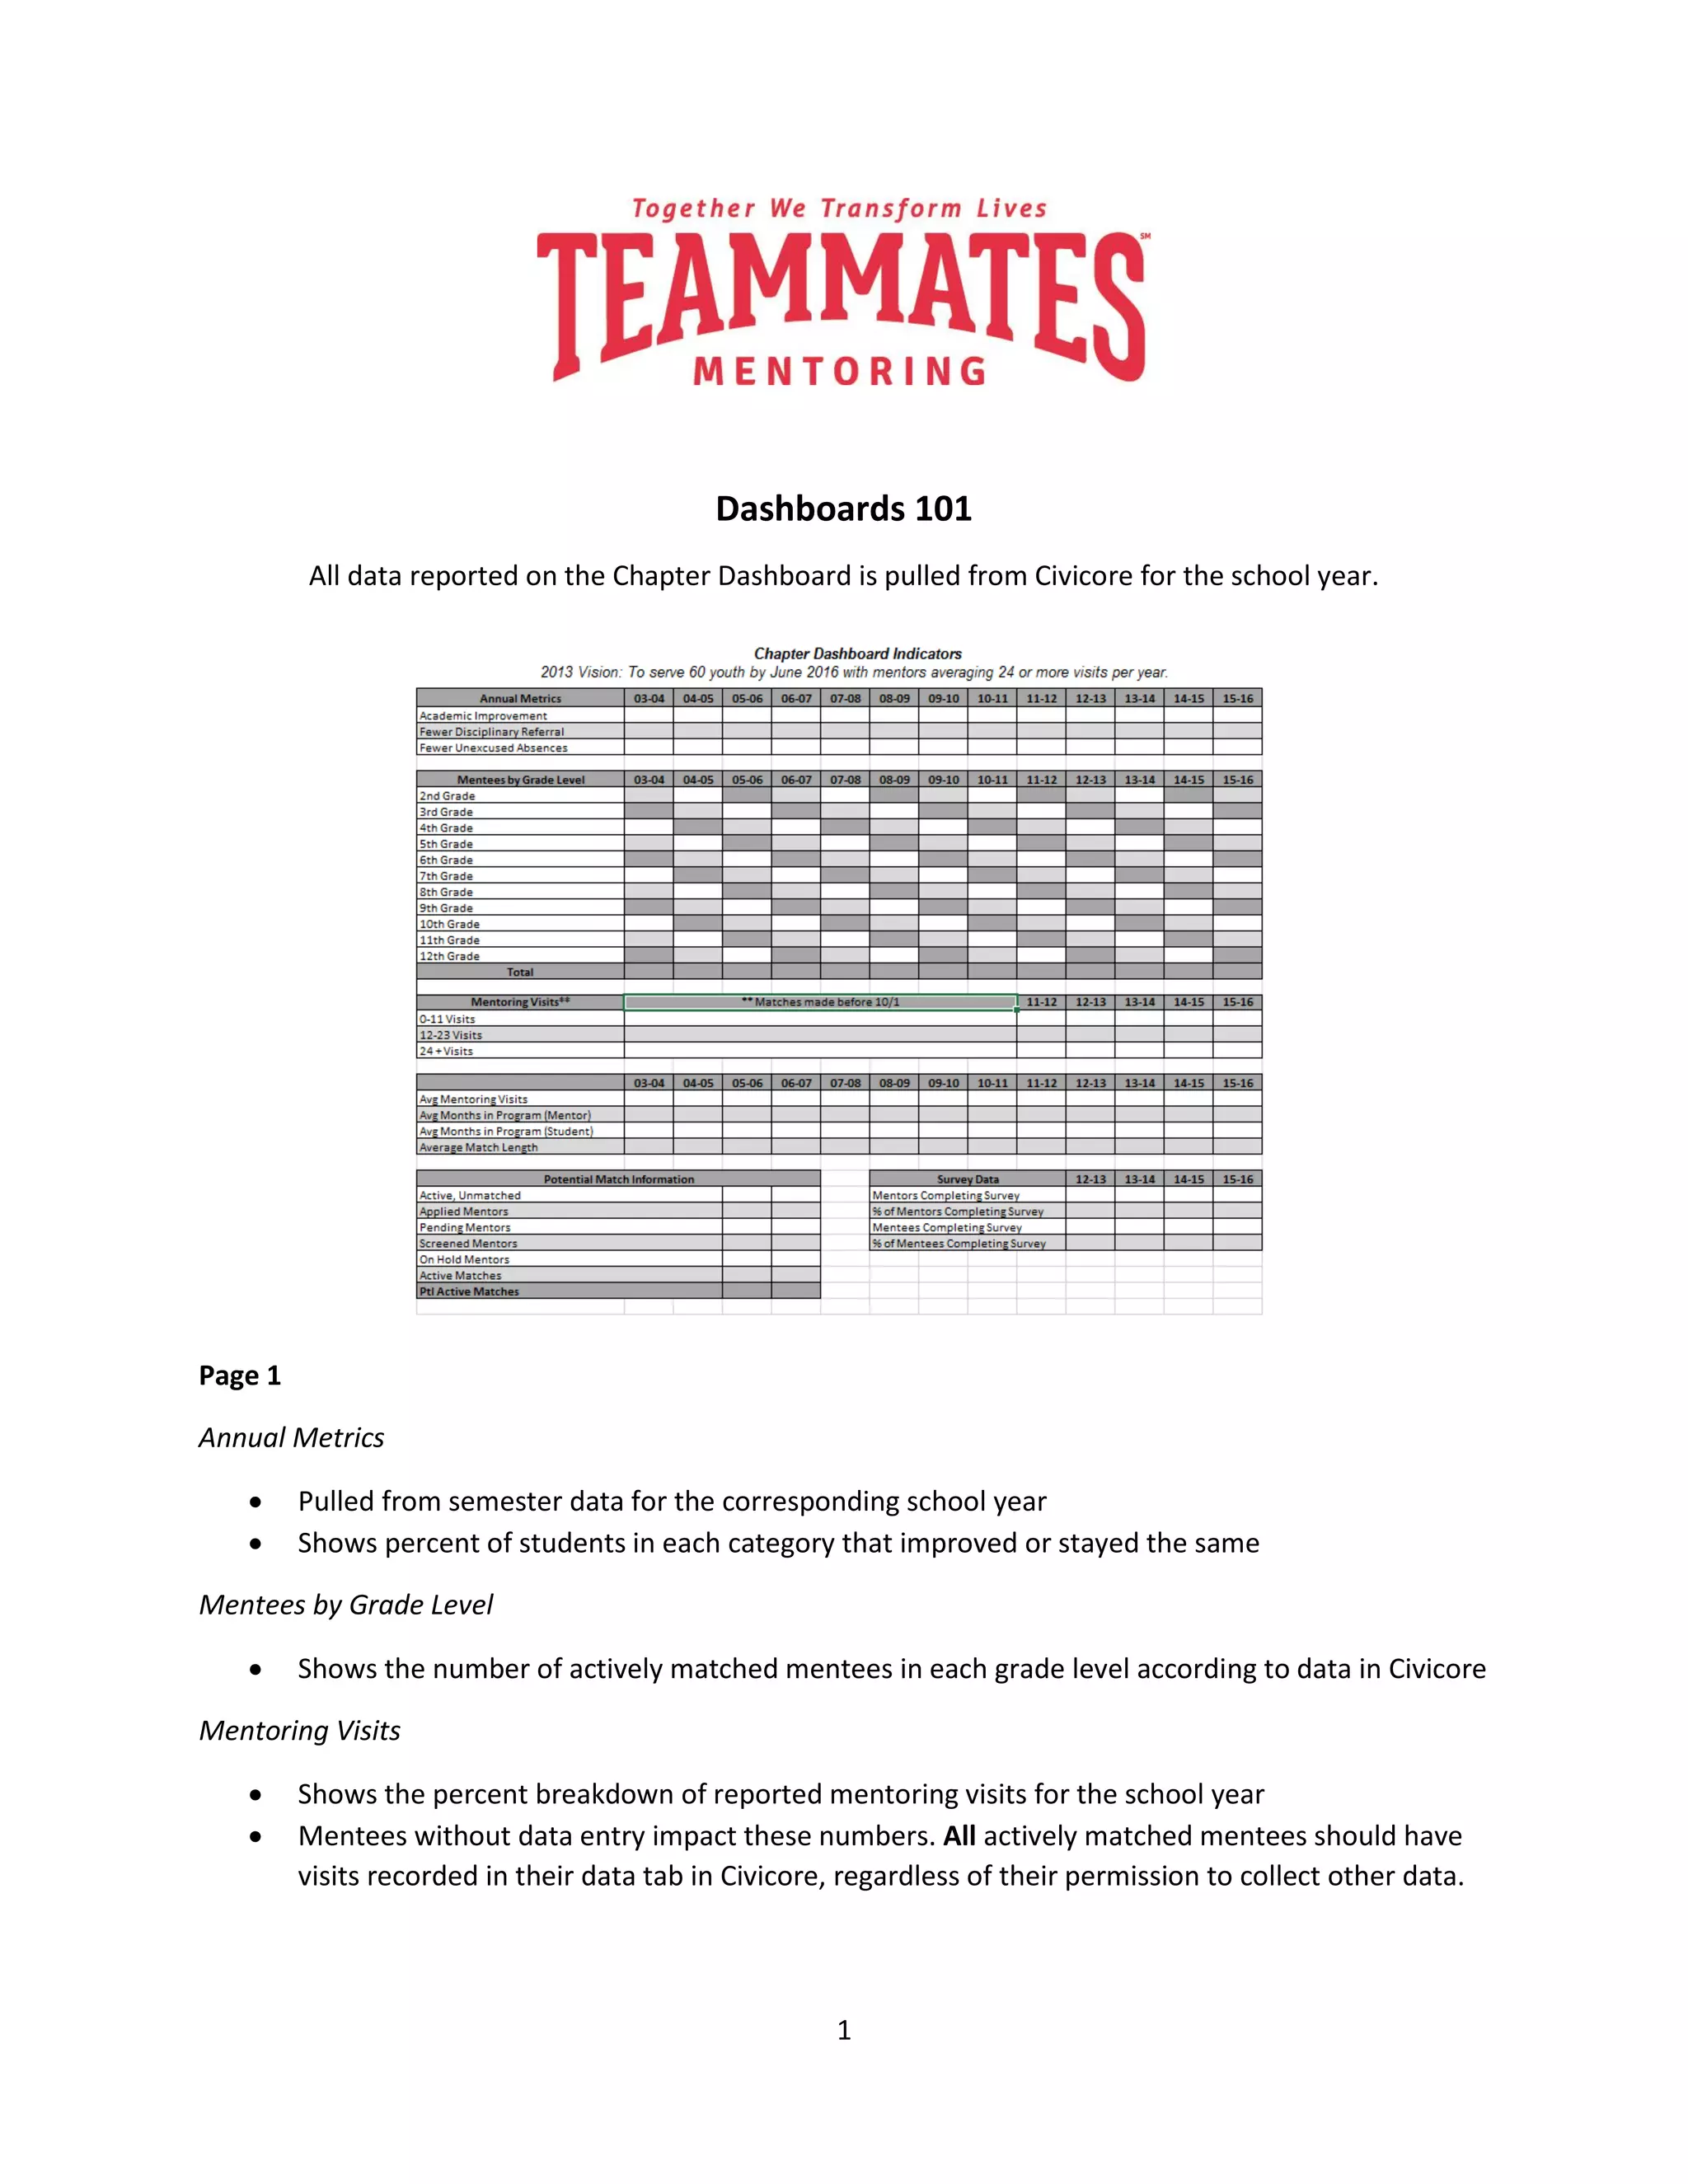
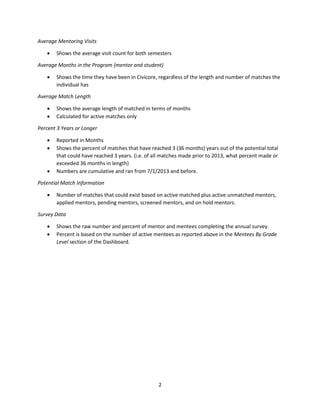
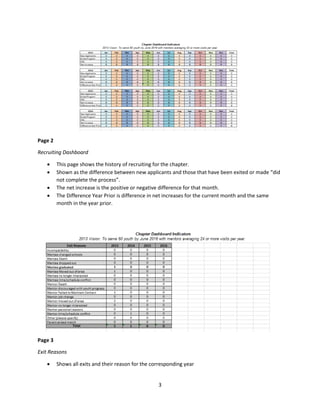
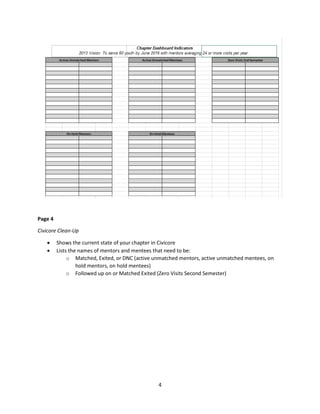
1
Dashboards 101
All data reported on the Chapter Dashboard is pulled from Civicore for the school year.
Page 1
Annual Metrics
 Pulled from semester data for the corresponding school year
 Shows percent of students in each category that improved or stayed the same
Mentees by Grade Level
 Shows the number of actively matched mentees in each grade level according to data in Civicore
Mentoring Visits
 Shows the percent breakdown of reported mentoring visits for the school year
 Mentees without data entry impact these numbers. All actively matched mentees should have
visits recorded in their data tab in Civicore, regardless of their permission to collect other data.
2
Average Mentoring Visits
 Shows the average visit count for both semesters
Average Months in the Program (mentor and student)
 Shows the time they have been in Civicore, regardless of the length and number of matches the
individual has
Average Match Length
 Shows the average length of matched in terms of months
 Calculated for active matches only
Percent 3 Years or Longer
 Reported in Months
 Shows the percent of matches that have reached 3 (36 months) years out of the potential total
that could have reached 3 years. (i.e. of all matches made prior to 2013, what percent made or
exceeded 36 months in length)
 Numbers are cumulative and ran from 7/1/2013 and before.
Potential Match Information
 Number of matches that could exist based on active matched plus active unmatched mentors,
applied mentors, pending mentors, screened mentors, and on hold mentors.
Survey Data
 Shows the raw number and percent of mentor and mentees completing the annual survey.
 Percent is based on the number of active mentees as reported above in the Mentees By Grade
Level section of the Dashboard.
3
Page 2
Recruiting Dashboard
 This page shows the history of recruiting for the chapter.
 Shown as the difference between new applicants and those that have been exited or made “did
not complete the process”.
 The net increase is the positive or negative difference for that month.
 The Difference Year Prior is difference in net increases for the current month and the same
month in the year prior.
Page 3
Exit Reasons
 Shows all exits and their reason for the corresponding year
4
Page 4
Civicore Clean-Up
 Shows the current state of your chapter in Civicore
 Lists the names of mentors and mentees that need to be:
o Matched, Exited, or DNC (active unmatched mentors, active unmatched mentees, on
hold mentors, on hold mentees)
o Followed up on or Matched Exited (Zero Visits Second Semester)

Dashboards 101

  • 1.
    1 Dashboards 101 All datareported on the Chapter Dashboard is pulled from Civicore for the school year. Page 1 Annual Metrics  Pulled from semester data for the corresponding school year  Shows percent of students in each category that improved or stayed the same Mentees by Grade Level  Shows the number of actively matched mentees in each grade level according to data in Civicore Mentoring Visits  Shows the percent breakdown of reported mentoring visits for the school year  Mentees without data entry impact these numbers. All actively matched mentees should have visits recorded in their data tab in Civicore, regardless of their permission to collect other data.
  • 2.
    2 Average Mentoring Visits Shows the average visit count for both semesters Average Months in the Program (mentor and student)  Shows the time they have been in Civicore, regardless of the length and number of matches the individual has Average Match Length  Shows the average length of matched in terms of months  Calculated for active matches only Percent 3 Years or Longer  Reported in Months  Shows the percent of matches that have reached 3 (36 months) years out of the potential total that could have reached 3 years. (i.e. of all matches made prior to 2013, what percent made or exceeded 36 months in length)  Numbers are cumulative and ran from 7/1/2013 and before. Potential Match Information  Number of matches that could exist based on active matched plus active unmatched mentors, applied mentors, pending mentors, screened mentors, and on hold mentors. Survey Data  Shows the raw number and percent of mentor and mentees completing the annual survey.  Percent is based on the number of active mentees as reported above in the Mentees By Grade Level section of the Dashboard.
  • 3.
    3 Page 2 Recruiting Dashboard This page shows the history of recruiting for the chapter.  Shown as the difference between new applicants and those that have been exited or made “did not complete the process”.  The net increase is the positive or negative difference for that month.  The Difference Year Prior is difference in net increases for the current month and the same month in the year prior. Page 3 Exit Reasons  Shows all exits and their reason for the corresponding year
  • 4.
    4 Page 4 Civicore Clean-Up Shows the current state of your chapter in Civicore  Lists the names of mentors and mentees that need to be: o Matched, Exited, or DNC (active unmatched mentors, active unmatched mentees, on hold mentors, on hold mentees) o Followed up on or Matched Exited (Zero Visits Second Semester)