Download as PDF, PPTX


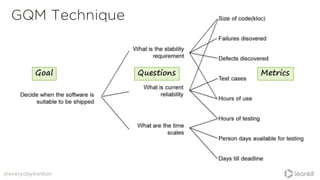


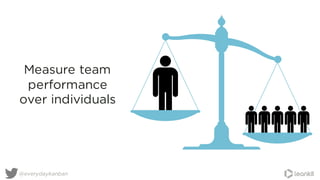
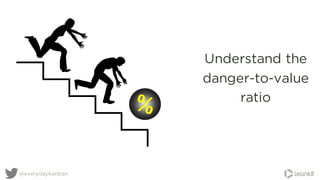
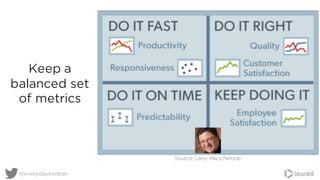


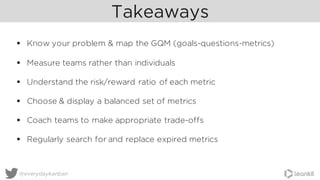


The document discusses the importance of metric-driven coaching in achieving organizational goals through careful selection and use of metrics. It emphasizes understanding the GQM (Goal-Question-Metric) technique, measuring team performance over individuals, and avoiding pitfalls associated with misinterpreting metrics. Key takeaways include ensuring metrics align with customer needs, making informed decisions, and maintaining a balanced set of metrics tailored to specific contexts.


![[WMD 2015] Qualaroo >> Sean Ellis, "Rhythm Is A Hacker: The Advantages & Chal...](https://cdn.slidesharecdn.com/ss_thumbnails/05seanellisfinal-150430205644-conversion-gate01-thumbnail.jpg?width=640&height=640&fit=bounds)


![Key Performance Indicators [KPIs] Orientation](https://cdn.slidesharecdn.com/ss_thumbnails/2cbskpisorientation-130511014700-phpapp01-thumbnail.jpg?width=640&height=640&fit=bounds)


