This document summarizes the Quake-catcher Network's (QCN) rapid deployment of low-cost accelerometers in Chile following the 2010 M8.8 Maule earthquake. The QCN recorded over 120 seconds of strong shaking from the mainshock with its single sensor in Chile at the time. After the mainshock, the QCN Rapid Aftershock Mobilization Program deployed 100 additional low-cost accelerometers across Chile over the next few weeks, significantly increasing the network's density for recording aftershocks. The new sensors provided high-resolution data on ground shaking across the region.
Microwave radiation anomaly of Wenchuan earthquake and its mechanism.pptgrssieee
The document presents a study on microwave radiation anomalies before the 2008 Wenchuan earthquake in China. A new method is proposed to extract microwave radiation anomalies from satellite data by eliminating effects of terrain and weather. Analysis found positive microwave anomalies from 40 days to 2 days before the earthquake near the epicenter. Experimental work on rock samples under loading showed that microwave radiation increases in the fracturing stage, providing a potential explanation for the observed pre-earthquake microwave anomalies.
This document summarizes a research paper on using discrete wavelet transform (DWT) and empirical mode decomposition (EMD) to remove "ghosting effects" from seismic signals. It begins with an introduction to earthquakes and how they are recorded via seismographs. It then describes existing filtering methods and their limitations. The proposed method uses 1D convolutional filtering and vibration analysis with DWT and EMD to enhance noisy seismic wave signals. It involves steps like magnitude spectrum estimation, windowing, phase estimation, noise variance prediction, and directional estimation. The method is able to attenuate coherent noise and improve seismic wave detection, separation and tracking. In conclusion, time-scale directional filters are a powerful tool for seismic data
Time dependent probabilistic seismic hazard assessmentIIT Roorkee
This document discusses time-dependent probabilistic seismic hazard assessment (PSHA) and summarizes two case studies. It introduces the concepts of time-dependent PSHA and the epidemic-type aftershock sequence (ETAS) model for modeling short-term earthquake clustering. A case study on the Lower Rhine Embayment in Germany uses the ETAS model in PSHA and finds that neglecting aftershocks can underestimate hazard by up to 8%. Ongoing aftershock sequences from historic events contribute significantly to present hazard levels. The document concludes by proposing a time-dependent PSHA for Northeast India to evaluate underestimation from removing aftershocks.
Ionospheric TEC Disturbances over South KoreaFollowing the 2011 Great Tohoku ...researchinventy
1) Ionospheric TEC disturbances were observed in South Korea following the 2011 Tohoku earthquake in Japan. Impulsive TEC enhancements were first observed approximately 16.5 minutes after the earthquake.
2) Small-scale TIDs with a period of around 4 minutes were observed from 6:15-7:10 UT. Medium-scale TIDs with a period of around 15 minutes and duration of 60 minutes were also observed. The amplitude of the medium-scale TIDs was seen to dampen clearly over time.
3) Detailed analysis of GPS data from a station in South Korea found repeated short-period oscillations in TEC variations from 07:15-08:15 UT, indicating regular
1. A seismic hazard assessment was conducted for Khyber Pakhtunkhwa (KPK) province in Pakistan using Cornel's probabilistic seismic hazard assessment (PSHA) methodology.
2. Earthquake data was compiled from various sources and homogenized to generate a composite earthquake catalogue for the region dating back to 1500 AD.
3. The catalogue was processed which included declustering, completeness analysis, and developing Gutenberg-Richter recurrence models for seismic zones.
4. Hazard curves were computed for KPK using the CRISIS 2007 software and PSHA methodology.
1) The document summarizes the steps taken to perform a seismic hazard assessment of Khyber Pakhtunkhwa (KPK) province in Pakistan. These steps include compiling an earthquake catalog from various sources, homogenizing the magnitudes, de-clustering the catalog, performing completeness analysis, defining seismic zones, and developing Gutenberg-Richter recurrence models.
2) Shallow seismic zones were defined based on clustering of shallow earthquakes in the de-clustered catalog. Deep seismic zones were also identified based on deep earthquake locations.
3) Gutenberg-Richter recurrence models were developed for each seismic zone to obtain cumulative frequency of earthquakes per year needed for probabilistic seismic hazard analysis.
1) The document analyzes potential mechanisms for forming ionospheric precursors to earthquakes, including internal gravity waves (IGWs) and electric fields. Modeling results support the hypothesis that seismogenic electric fields in the ionosphere can cause changes preceding strong quakes.
2) Factors examined that could generate such fields include small-scale IGWs near the epicenter and vertical electric fields penetrating from the atmosphere. Modeling experiments combining these factors with data from a Greece earthquake achieved similarities to observations.
3) Further research on ionospheric precursors through increased experimental data collection and statistical analysis could help verify their existence before earthquakes. This report was presented with funding from the International Disaster and Risk Conference
The document discusses the use of Synthetic Aperture Radar (SAR) and InSAR techniques for monitoring solid earth geophysics hazards. SAR uses microwaves to generate high-resolution images of the Earth's surface independently of solar illumination. InSAR uses multiple SAR images to measure surface changes down to the centimeter scale, such as caused by earthquakes or subsidence. It discusses various InSAR techniques including DifSAR, Persistent Scatterer InSAR, and Corner Reflector InSAR and their applications in oil and gas, mining, infrastructure and hazard monitoring. The document also lists several commercial and open-source InSAR processing software packages.
Trabalho de Sistemas Paralelos e Distribuidos apresentado em 17 de Junho de 2009: "Grid Computing: Boinc Overview" por Rodrigo Neves, Nuno Mestre, Francisco Machado e João Lopes
Trabalho de Sistemas Paralelos e Distribuidos apresentado em 17 de Junho de 2009: "Volunteer Computing With Boinc" por Diamantino Cruz e Ricardo Madeira
Barack Obama forecasted that the US economic recovery may not begin until 2010 during his first full news conference at the White House. He pressed Congress to quickly pass his economic recovery plan to stimulate the economy and create or save 4 million jobs. While Obama has enacted multiple programs to boost the economy, he still expects a difficult 2009 with no improvement until next year. Obama is actively promoting his economic stimulus bill through speeches and town halls to help explain it to Americans.
A man died after the roof of a large vegetable warehouse collapsed in Portage la Prairie, Manitoba. Three others were trapped when the 24-meter section of roof caved in due to heavy freezing rain. Emergency responders used shovels and rescue equipment to remove one person alive from the rubble, but a second victim was recovered deceased. Two other workers suffered injuries but were treated. The entire building was at risk of collapsing further, and the family of the victim gathered to mourn. The incident is being investigated.
The Heritage Minister appeared before Parliament to provide details on over $270 million in new arts spending. However, he was questioned about cuts made last year that eliminated $44 million for programs including support for Canadian artists to travel abroad. Liberal MPs argue some cuts were made to punish groups that criticized the government, while Moore insists the money will instead go to a new $21.6 million fund to support international opportunities for artists. The opposition is calling for documents explaining the cuts, which Moore refuses to release due to cabinet secrecy.
A 56-year-old man will appear in court today charged with aggravated sexual assault, kidnapping with a firearm, and impersonating a police officer. According to an investigator, the man allegedly abducted a 16-year-old girl last Thursday while claiming to be a police officer. The girl managed to escape on Saturday night.
A surprise attack was carried out on the Sri Lankan cricket team in Lahore, Pakistan. Twelve gunmen threw grenades and opened fire on the team's bus with rifles and rockets, wounding several players and killing several police officers and civilians. While the perpetrators are unclear, Pakistan has been battling Islamist insurgents with ties to al-Qaeda. The test match was canceled and the Sri Lankan team was evacuated in the aftermath of the sophisticated attack.
Asian and European markets fell further as investors worried over global financial losses, with Japanese shares close to a 26-year low. North American markets also tumbled the previous day. The Bank of Canada is expected to cut interest rates by half a percentage point to 0.5% to stimulate the economy, with more details on the rate cut available at CBC News.
Canada's mining sector is optimistic that commodity prices have hit bottom and are hoping for recovery and better times ahead. The world's largest mining conference is taking place in Toronto, where Jim Davidson, the CFO of Athabasca Potash, is hoping to find investors for a new $2.5 billion potash mine in Saskatchewan. While downturns are difficult, Canada's Minister of Natural Resources believes every downturn is followed by an equal upturn, and the industry's responsibility is to prepare for the next upswing.
Creating Great Content Has Never Been Easier - March 2011WriterAccess
You need great content to grow your business. This great content should be created by great writers who know how to get the great results you demand for your investment. But finding expert writers and managing the workflow takes a lot of time and experience. Until now!
Join host Byron White, founder of WriterAccess.com, a new service of ideaLaunch that offers direct connection to thousands of U.S.-based writers available for paid assignments created to your specification. Byron will discuss how to select and manage freelance writers, and how to create assignment specifications and instructions for success. Both writers and clients will learn lessons we learned in the development of WriterAccess and from observations on the tens of thousands of content assignments completed at WriterAccess.com.
Best of all, Byron will discuss the newly launched “project complexity” pricing option now available on WriterAccess, which offers an elevated “fair price” scale for complex projects demanding higher skills and experience for the high quality content you demand.
In this webinar you'll learn:
How to price writing assignments
How to price yourself as a writer
Selecting the best writers
Selecting the best clients
How and why to reject work from writers
Why rejection of your work is a good thing
Writer skill levels evaluation and guide
Tracking content performance
7S McKinsey Model for PowerPoint. This template is designed from the idea of the well-known model from McKinsey. If you just like the structure of the diagram, you can customize the model to that i.e. change the letters and text.
The document is comprised entirely of repeated placeholder text stating "This is an example text" and variations thereof. It provides no substantive information that could be summarized.
Designing windows 8 metro applicationsAndrej Tozon
The document discusses design principles for Metro applications on Windows 8. It outlines several key principles: focus on high quality pixel-level design; prioritize content over graphical elements; ensure interactions are fast and fluid; go beyond real-world metaphors to create an authentically digital experience; and leverage the Windows ecosystem. It also lists eight characteristics that define a Metro-style app, such as using the Metro design style, connecting to the cloud, and embracing Metro principles.
This document lists the names of students in Form 5 ICT at SMSTJ for the second semester of 2012. It includes 3 columns - the form/class designation, the student's name, and their family name. There are approximately 60-70 students listed across 5 different forms: 5 Batani, 5 Farabi, 5 Farghani, 5 Khawarizmi, 5 Zahrawi, 5 Kindi, and 5 Razi.
This document appears to be a sample or template for a presentation on pie charts. It contains repetitive placeholder text and instructions to replace it with one's own text. It also includes multiple advertisements for downloading templates from SlideShop.com, saving on purchases through a free download account, and information on getting product and site support from SlideShop.com.
A Novel Strong-Motion Seismic Network for Community Participation in Earthqua...Ali Osman Öncel
1) The Quake-Catcher Network (QCN) uses MEMS accelerometers and volunteer computers to create a low-cost seismic network that records earthquake ground motions.
2) Volunteer computers run software that monitors MEMS sensors and detects earthquake triggers, sending only metadata to central servers to rapidly identify quakes.
3) QCN aims to increase seismic station density worldwide to better detect, locate and characterize earthquakes through distributed computing and low-cost sensors.
This document provides a tutorial about a seismic sensor network. It discusses:
1) The special demands of seismic and acoustic applications including large-scale deployment, challenged networks, and remote monitoring requirements.
2) An overview of the software and hardware used in the network including the CDCCs, Q330 data loggers, Duiker data collection software, and DTS remote management software.
3) How to assemble a seismic node in 30 minutes by connecting sensors, data loggers, and wireless nodes together and reprogramming the nodes.
ANALYSIS OF SEISMIC SIGNAL AND DETECTION OF ABNORMALITIESCSEIJJournal
Seismic signals are ground vibrations used to detect seismic events. However, seismic signal captured from
sensors is distorted signal contains noise and makes actual event detection difficult. In most cases, external
noise such as manmade or any heavy vehicle vibration always overlaps with the seismic reflections over
time. The presence of noise in the seismic signal makes it difficult to determine the magnitude at which the
seismic events have occurred. The aim of our study is to process the signals received from seismic sensor
and identify it as seismic events signal and non-seismic events signal based on the magnitude. The authors
propose a robust noise suppression method using bandpass filter, IIR Wiener filter and event detection
using recursive Short-Term Average (STA)/Long Term Average (LTA) and Carl Short Term Average
(STA)/Long Term Average (LTA). The proposed study determines reference magnitude to distinguish
seismic and non-seismic activity. The projected study is based on the analysis of seismic signal received
from single sensor and sensor networks (SN) and determines the magnitude to distinguish seismic and nonseismic events and time of an actual earthquake event. The experimental dataset is a broadband seismic
signal from BSVK and CUKG station sensors located at Basavakalyan, Karnataka, and the Central
University of Karnataka respectively. The proposed approach helps to extract the information about preseismic event, actual seismic event, post-seismic event activities and identify the abnormal pattern that
supports to detect heearth’s activities before the actual seismic event.
Analysis of Seismic Signal and Detection of AbnormalitiesCSEIJJournal
This document summarizes a study that analyzed seismic signals and detected abnormalities. The study proposed a noise suppression method using bandpass filtering, IIR Wiener filtering, and event detection using recursive Short-Term Average (STA)/Long Term Average (LTA) and Carl STA/LTA algorithms. The methods were applied to broadband seismic data from two stations in India to distinguish seismic and non-seismic events and determine the magnitude and time of actual earthquakes. Frequency domain analysis showed abnormal signal activities before earthquakes between 1-4Hz. Recursive STA/LTA and Carl STA/LTA were used to record event times and signal-to-noise ratios were computed at different processing stages to classify signals
Recovery of aftershock sequences using waveform cross correlation: from catas...Ivan Kitov
Description of a software package for signal detection and association using waveform cross correlation. Recovery of aftershock sequences of the largest events: Sumatra 2004 and Tohoku 2011. Finding of a small aftershock of the September 9, 2016 DPRK test.
Earthquake trend prediction using long short-term memory RNNIJECEIAES
The prediction of a natural calamity such as earthquakes has been an area of interest for a long time but accurate results in earthquake forecasting have evaded scientists, even leading some to deem it intrinsically impossible to forecast them accurately. In this paper an attempt to forecast earthquakes and trends using a data of a series of past earthquakes. A type of recurrent neural network called Long Short-Term Memory (LSTM) is used to model the sequence of earthquakes. The trained model is then used to predict the future trend of earthquakes. An ordinary Feed Forward Neural Network (FFNN) solution for the same problem was done for comparison. The LSTM neural network was found to outperform the FFNN. The R^2 score of the LSTM is better than the FFNN’s by 59%.
Meteorological Technology International, Jan 2010laurajairam
This document discusses advances in satellite sensor technology that enable more accurate climate monitoring from space. Specifically:
1. Prior satellite sensors had limitations like coarse spectral resolution and degrading calibration over time, making it difficult to establish long-term climate trends from space data.
2. New technologies can achieve much greater measurement accuracy, stability over decades, fine spectral resolution, and precise knowledge of spectral response needed for undisputed climate monitoring.
3. Advances like onboard high-accuracy blackbody calibration sources and hyperspectral imaging bring National Institute of Standards and Technology calibration capabilities to satellites. This eliminates prior limitations and allows climate trends to be reliably measured from space.
1) Advances in satellite sensor calibration technology have enabled more accurate monitoring of global climate trends from space.
2) Prior satellite sensors had limitations like spectral resolution and radiometric accuracy that made establishing long-term climate records difficult.
3) New satellite instruments under development can provide continuous high-resolution spectral coverage, onboard calibration, and reduced measurement uncertainties, enabling undisputed climate monitoring from space.
Advanced earthquake monitoring techniques allow for more accurate earthquake detection and analysis. New monitoring stations have over 600 sensors installed. Shake maps can now be created for major cities to show seismic shaking. The 3D Full-Scale Earthquake Testing Facility in Japan will replicate large earthquakes to test building designs. Instrumenting buildings provides data to engineer earthquake-resistant structures. Improved monitoring through networks of sensors helps provide warning of impending shaking and tsunamis.
02 chapter: Earthquake: Strong Motion and Estimation of Seismic HazardPriodeep Chowdhury
This document discusses strong ground motion from earthquakes and methods for measuring and analyzing it. It describes how modern accelerographs can record ground acceleration digitally up to 100 Hz. Parameters derived from ground motion records are used to analyze earthquake and site characteristics and their impact on structures. Evaluating seismic hazard requires understanding characteristics controlling ground motion as well as the seismicity and tectonics of the surrounding region, using either deterministic or probabilistic approaches.
This document presents an underwater acoustic sensor network for early warning generation of tsunamis. It discusses flaws in existing tsunami early warning systems, and proposes an integrated system using underwater sensor networks, satellites, and terrestrial communication networks. Key challenges addressed include power optimization, modulation schemes, and routing for underwater acoustic networks. Performance is measured by reliability and timeliness of warnings. Further improvements could include better simulations, decision support, and tsunami modeling.
Identify the possibility of predication of seismic activity through the ionos...ashrafrateb1985
The document summarizes research using data from the DEMETER microsatellite to study possible links between seismic activity and ionospheric disturbances. It presents two case studies: 1) Unusual ionospheric observations detected by DEMETER over Japan days before a 2004 earthquake. Spectrograms showed electromagnetic perturbations. 2) Observations by DEMETER of ultra-low and extremely low frequency emissions one day before a 2004 Indonesia earthquake, including anomalies in the electric field and ELF magnetic field variations. The document examines the satellite's scientific objectives, instruments, and operation modes to systematically search for seismic-related signals in the ionosphere.
This document provides an introduction to analyzing seismic records and extracting parameters for data exchange and research. It discusses analyzing analog and digital records from single stations and networks to identify phases, determine onset times, amplitudes, periods, and other parameters. These procedures are now often automated but traditionally involved manual analysis. The document outlines challenges like noise, dispersion, and differences between body and surface waves. It emphasizes the importance of understanding seismic wave propagation and record characteristics for accurate interpretation.
This document discusses using k-means clustering to detect minerals from remote sensing images. It begins with an abstract describing using k-means clustering on hyperspectral images to segment and extract features to detect minerals like giacomo. It then provides background on remote sensing, k-means clustering algorithms, and describes the giacomo mineral deposit in Peru that contains silicon dioxide and titanium dioxide. It concludes with discussing using sobel edge detection as part of the mineral detection process from remote sensing images.
This document provides updates from Oak Ridge National Laboratory on their neutron scattering facilities, the High Flux Isotope Reactor (HFIR) and Spallation Neutron Source (SNS). It discusses progress made in restarting operations at HFIR and increasing power and reliability at SNS. Instruments are being commissioned at both facilities and general user programs are scheduled to begin in 2007 and 2008. It also announces a combined user meeting in October 2007 to increase awareness of research capabilities at ORNL.
The benefit of hindsight in observational science - Retrospective seismologica...Elizabeth Entwistle
This document discusses a new technique called retrospective seismology that allows seismic recordings to be obtained at times before, during, or after a seismometer was physically installed using seismic interferometry theory. As an example, the document constructs seismograms from two past earthquakes using data from a seismometer installed afterwards. This allows novel information to be obtained about both the earth structure and earthquake sources. The key is that ambient seismic noise recordings can be used to synthesize deterministic signals from earthquake sources. This counterintuitive finding provides a new way to retrospectively observe seismic events.
The October 2004 Mw=7.1 Nicaragua earthquake: Rupture process, aftershock loc...Gus Alex Reyes
The subduction zone off the Nicaragua
coastline has been the site of several large
earthquakes in the past decades, including
the 1992 tsunami earthquake that was
anomalous in the size of the tsunami relative
to moment release [Kanamori and
Kikuchi, 1993]. As a focus site for both
the MARGINS-SEIZE and SubFac initiatives,
it is an area of keen interest for
scientists interested in earthquake rupture
and volcanic processes.
Unraveling Earthquake Dynamics Through Extreme-Scale Multi-Physics Simulations
ALICE GABRIEL (LUDWIG MAXIMILIAN UNIVERSITY OF MUNICH, GERMANY)
Earthquakes are highly non-linear multiscale problems, encapsulating geometry and rheology of faults within the Earth’s crust torn apart by propagating shear fracture and emanating seismic wave radiation.
This talk will focus on using physics-based scenarios, modern numerical methods and hardware specific optimizations to shed light on the dynamics, and severity, of earthquake behaviour. It will present the largest-scale dynamic earthquake rupture simulation to date, which models the 2004 Sumatra-Andaman event - an unexpected subduction zone earthquake which generated a rupture of over 1,500 km in length within the ocean floor followed by a series of devastating tsunamis.
The core components of the simulation software will be described, highlighting the benefits of strong collaborations between domain and computational scientists. Lastly, future directions in coupling the short-term elastodynamics phenomena to long-term tectonics and tsunami generation will be discussed.
https://pasc18.pasc-conference.org/program/keynote-presentations/
The document introduces a new method called the Entire Magnitude Range (EMR) method for determining the magnitude of completeness (Mc) of earthquake catalogs and its uncertainty. It compares the EMR method to three existing techniques and finds it performs better when applied to synthetic and real earthquake data. The EMR method models the complete and incomplete portions of the frequency-magnitude distribution to provide a comprehensive seismicity model. It explicitly computes uncertainties in Mc using a bootstrap approach, showing uncertainties in other seismic parameters like b-values have been underestimated, especially for small datasets. Examples assessing temporal variations of Mc for real earthquake sequences find it was on average underestimated by 0.2 units using previous methods.
The mission of GeoCosmo is to establish the scientific understanding of pre-earthquake science necessary for creating a true global earthquake forecast system that could save billions of dollars and thousands of lives each year.
Similar to The Quake-Catcher Network Rapid Aftershock Mobilization! (20)
Gravimetri Dersi için aşağıda ki videoları izleyebilirsiniz.
Link 01: https://www.youtube.com/watch?v=HTyjVaVGx0k
Link 02: https://www.youtube.com/watch?v=fUkfgI8XaOE
The document discusses gravity anomalies and density variations in different regions based on gravity data. It shows how gravity maps reveal details about crustal thickness, tectonic features like faults and volcanic zones, and plate boundaries. Specific examples discussed include the Tibetan Plateau, Central America subduction zone, an area in Chugoku, Japan, and the state of Florida in the US. Regional gravity data can be used to model density changes associated with plate tectonics, crustal evolution, and volcanic and tectonic activity.
The USF team reviewed a geophysical investigation of the Kar Kar region conducted by WesternGeco in 2011. They found that WesternGeco's magnetotelluric (MT) data and models were of high quality. Both the WesternGeco and USF MT models identified a low resistivity zone at 300m depth that correlates with a water-bearing zone found in Borehole 4. USF performed gravity modeling which identified a north-south trending basin reaching 1500m depth, consistent with mapped faults. A preliminary hydrothermal model suggested observed temperatures could result from deep circulation of meteoric waters in the basin without needing a localized heat source. Additional geophysical data is recommended around the Jermaghbyur hot springs to
This document summarizes a study that used gravity data to delineate underground structure in the Beppu geothermal field in Japan. Analysis of Bouguer anomaly maps revealed high anomalies in the southern and northern parts of the study area that correspond to known geological formations. Edge detection filtering of the gravity data helped identify subsurface faults, including the northern edge of the high southern anomaly corresponding to the Asamigawa Fault. Depth modeling of the gravity basement showed differences between the southern and northern hot spring areas, with steep basement slopes along faults in the south and uplifted basement in the north.
This document summarizes the development of a new ultra-high resolution model of Earth's gravity field called GGMplus. Key points:
- GGMplus combines satellite gravity data from GOCE and GRACE with terrestrial gravity data and topography to achieve unprecedented 200m spatial resolution globally.
- It provides gridded estimates of gravity, horizontal and radial field components, and quasi-geoid heights at over 3 billion points covering 80% of the Earth's land.
- GGMplus reveals new details of small-scale gravity variations and identifies locations of minimum and maximum gravity, suggesting peak-to-peak variations are 40% larger than previous estimates. The model will benefit scientific and engineering applications.
Gravity measurements were taken in a region of China covering the south-north earthquake belt in 1998, 2000, 2002, and 2005. Researchers noticed significant gravity changes in the region surrounding Wenchuan and suggested in 2006 that a major earthquake could occur there in 2007 or 2008. While gravity changes were significant at some locations, more research is needed to determine if they could be considered a precursor. Uncertainties exist from measurement errors, hydrologic effects, and crustal movements. Improved data collection and analysis could enhance using gravity monitoring for earthquake research.
The document provides guidelines for implementing the H/V spectral ratio technique using ambient vibration measurements to evaluate site effects. It recommends procedures for experimental design, data processing, and interpretation. The key recommendations include measuring for sufficient duration depending on expected frequency, using multiple measurement points, avoiding disturbances, and interpreting H/V peaks in context with geological and geophysical data. Reliable H/V peaks are defined as having a clear maximum within expected frequency ranges and uncertainties. The guidelines aim to help apply the technique while accounting for its limitations.
Geopsy yaygın olarak kullanılan profesyonel bir program. Özellikle, profesyonel program deneyimi yeni mezunlarda çok aranan bir özellik. Bir öğrencim çalışmasında kullanmayı planlıyor.
Elevate Your Nonprofit's Online Presence_ A Guide to Effective SEO Strategies...TechSoup
Whether you're new to SEO or looking to refine your existing strategies, this webinar will provide you with actionable insights and practical tips to elevate your nonprofit's online presence.
A Visual Guide to 1 Samuel | A Tale of Two HeartsSteve Thomason
These slides walk through the story of 1 Samuel. Samuel is the last judge of Israel. The people reject God and want a king. Saul is anointed as the first king, but he is not a good king. David, the shepherd boy is anointed and Saul is envious of him. David shows honor while Saul continues to self destruct.
A Free 200-Page eBook ~ Brain and Mind Exercise.pptxOH TEIK BIN
(A Free eBook comprising 3 Sets of Presentation of a selection of Puzzles, Brain Teasers and Thinking Problems to exercise both the mind and the Right and Left Brain. To help keep the mind and brain fit and healthy. Good for both the young and old alike.
Answers are given for all the puzzles and problems.)
With Metta,
Bro. Oh Teik Bin 🙏🤓🤔🥰
Gender and Mental Health - Counselling and Family Therapy Applications and In...PsychoTech Services
A proprietary approach developed by bringing together the best of learning theories from Psychology, design principles from the world of visualization, and pedagogical methods from over a decade of training experience, that enables you to: Learn better, faster!
Andreas Schleicher presents PISA 2022 Volume III - Creative Thinking - 18 Jun...EduSkills OECD
Andreas Schleicher, Director of Education and Skills at the OECD presents at the launch of PISA 2022 Volume III - Creative Minds, Creative Schools on 18 June 2024.
Information and Communication Technology in EducationMJDuyan
(𝐓𝐋𝐄 𝟏𝟎𝟎) (𝐋𝐞𝐬𝐬𝐨𝐧 2)-𝐏𝐫𝐞𝐥𝐢𝐦𝐬
𝐄𝐱𝐩𝐥𝐚𝐢𝐧 𝐭𝐡𝐞 𝐈𝐂𝐓 𝐢𝐧 𝐞𝐝𝐮𝐜𝐚𝐭𝐢𝐨𝐧:
Students will be able to explain the role and impact of Information and Communication Technology (ICT) in education. They will understand how ICT tools, such as computers, the internet, and educational software, enhance learning and teaching processes. By exploring various ICT applications, students will recognize how these technologies facilitate access to information, improve communication, support collaboration, and enable personalized learning experiences.
𝐃𝐢𝐬𝐜𝐮𝐬𝐬 𝐭𝐡𝐞 𝐫𝐞𝐥𝐢𝐚𝐛𝐥𝐞 𝐬𝐨𝐮𝐫𝐜𝐞𝐬 𝐨𝐧 𝐭𝐡𝐞 𝐢𝐧𝐭𝐞𝐫𝐧𝐞𝐭:
-Students will be able to discuss what constitutes reliable sources on the internet. They will learn to identify key characteristics of trustworthy information, such as credibility, accuracy, and authority. By examining different types of online sources, students will develop skills to evaluate the reliability of websites and content, ensuring they can distinguish between reputable information and misinformation.
How to Download & Install Module From the Odoo App Store in Odoo 17Celine George
Custom modules offer the flexibility to extend Odoo's capabilities, address unique requirements, and optimize workflows to align seamlessly with your organization's processes. By leveraging custom modules, businesses can unlock greater efficiency, productivity, and innovation, empowering them to stay competitive in today's dynamic market landscape. In this tutorial, we'll guide you step by step on how to easily download and install modules from the Odoo App Store.
How to Download & Install Module From the Odoo App Store in Odoo 17
The Quake-Catcher Network Rapid Aftershock Mobilization!
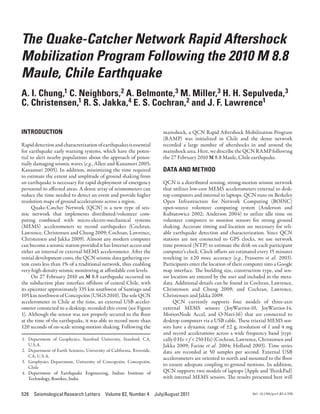
1. the Quake-catcher network rapid aftershock
mobilization program following the 2010 m 8.8
maule, chile earthquake
A. I. Chung, C. Neighbors, A. Belmonte, M. Miller, H. H. Sepulveda, C. Christensen, R. S. Jakka, E. S. Cochran, and J. F. Lawrence
A. I. Chung,1 C. Neighbors, 2 A. Belmonte, 3 M. Miller, 3 H. H. Sepulveda, 3
C. Christensen,1 R. S. Jakka,4 E. S. Cochran, 2 and J. F. Lawrence1
INTRODUCTION mainshock, a QCN Rapid Aftershock Mobilization Program
(RAMP) was initialized in Chile and the dense network
Rapid detection and characterization of earthquakes is essential recorded a large number of aftershocks in and around the
for earthquake early warning systems, which have the poten- mainshock area. Here, we describe the QCN RAMP following
tial to alert nearby populations about the approach of poten- the 27 February 2010 M 8.8 Maule, Chile earthquake.
tially damaging seismic waves (e.g., Allen and Kanamori 2003;
Kanamori 2005). In addition, minimizing the time required DATA AND METHOD
to estimate the extent and amplitude of ground shaking from
an earthquake is necessary for rapid deployment of emergency QCN is a distributed sensing, strong-motion seismic network
personnel to affected areas. A dense array of seismometers can that utilizes low-cost MEMS accelerometers external to desk-
reduce the time needed to detect an event and provide higher top computers and internal to laptops. QCN runs on Berkeley
resolution maps of ground accelerations across a region. Open Infrastructure for Network Computing (BOINC)
Quake-Catcher Network (QCN) is a new type of seis- open-source volunteer computing system (Anderson and
mic network that implements distributed/volunteer com- Kubiatowicz 2002; Anderson 2004) to utilize idle time on
puting combined with micro-electro-mechanical systems volunteer computers to monitor sensors for strong ground
(MEMS) accelerometers to record earthquakes (Cochran, shaking. Accurate timing and location are necessary for reli-
Lawrence, Christensen and Chung 2009; Cochran, Lawrence, able earthquake detection and characterization. Since QCN
Christensen and Jakka 2009). Almost any modern computer stations are not connected to GPS clocks, we use network
can become a seismic station provided it has Internet access and time protocol (NTP) to estimate the drift on each participant
either an internal or external MEMS accelerometer. After the computer’s clock. Clock offsets are estimated every 15 minutes
initial development costs, the QCN seismic data gathering sys- resulting in ±20 msec accuracy (e.g., Frassetto et al. 2003).
tem costs less than 1% of a traditional network, thus enabling Participants enter the location of their computer into a Google
very-high-density seismic monitoring at affordable cost levels. map interface. The building size, construction type, and sen-
On 27 February 2010 an M 8.8 earthquake occurred on sor location are entered by the user and included in the meta-
the subduction plate interface offshore of central Chile, with data. Additional details can be found in Cochran, Lawrence,
its epicenter approximately 335 km southwest of Santiago and Christensen and Chung 2009; and Cochran, Lawrence,
105 km northwest of Concepción (USGS 2010). The sole QCN Christensen and Jakka 2009.
accelerometer in Chile at the time, an external USB acceler- QCN currently supports four models of three-axis
ometer connected to a desktop, recorded this event (see Figure external MEMS sensors (JoyWarrior-10, JoyWarrior-14,
1). Although the sensor was not properly secured to the floor MotionNode Accel, and O-Navi-16) that are connected to
at the time of the earthquake, it was able to record more than desktop computers via a USB cable. These triaxial MEMS sen-
120 seconds of on-scale strong-motion shaking. Following the sors have a dynamic range of ±2 g, resolution of 1 and 4 mg
and record accelerations across a wide frequency band (typi-
1. Department of Geophysics, Stanford University, Stanford, CA, cally 0 Hz < f < 250 Hz) (Cochran, Lawrence, Christensen and
U.S.A. Jakka 2009; Farine et al. 2004; Holland 2003). Time series
2. Department of Earth Sciences, University of California, Riverside, data are recorded at 50 samples per second. External USB
CA, U.S.A. accelerometers are oriented to north and mounted to the floor
3. Geophysics Department, University of Concepción, Concepción,
Chile
to ensure adequate coupling to ground motions. In addition,
4. Department of Earthquake Engineering, Indian Institute of QCN supports two models of laptops (Apple and ThinkPad)
Technology, Roorkee, India with internal MEMS sensors. The results presented here will
526 Seismological Research Letters Volume 82, Number 4 July/August 2011 doi: 10.1785/gssrl .82.4.526
2. 4
X (m/s2)
0
-4
5
Y (m/s2)
0
-5
5
0
-5
Z (m/s2)
-10
-15
-20 0 20 40 60 80 100 120
Time from rst detection (seconds)
▲ Figure 1. Accelerogram of the M 8.8 mainshock recorded by a station located at the University of Concepción. The dashed line
shows when the initial trigger occurred, soon after the P-wave arrival. Note that the sensor was not fixed to the ground and was resting
on a desk at the time of the mainshock. Around 13 seconds the sensor likely falls off the desk onto the ground.
focus primarily on data recorded by floor-mounted USB accel- the sensors that recorded this event are JW-10 sensors (10-bit
erometers. sensors, 4 mg resolution), but two of the stations are newer
On March 8, 2010, the RAMP deployment of 100 USB QCN sensors (JW-14 and ON-16, 14- and 16-bit sensors with
accelerometers was initiated and a small team of volunteers was 0.24 mg and 0.060 mg resolution, respectively). As expected,
trained on the simple installation procedures. Participants were the higher bit sensors show dramatically lower noise levels.
recruited using an online RAMP sign-up page and, follow- Using manually picked arrivals, we located this event and show
ing local media interviews, over 700 requests for sensors were that the location is similar to U.S. Geological Survey (USGS)
received in roughly one week. Sensors were installed in homes, catalog locations (Figure 3A), suggesting station locations and
police stations, health centers, and other institutions in coor- timing control is accurate enough to test automated event char-
dination with the national emergency authority (ONEMI). acterization algorithms.
To date, QCN has 100 USB sensors and 15 laptop sensors The triggering algorithm is based on the traditional short-
in Chile with sensors deployed mainly in the regions directly term average over long-term average (STA/LTA) method (e.g.,
affected by the mainshock, including a dense cluster of stations Vanderkulk et al. 1965). Here, we use a 0.1-second short-term
near Concepción (Figure 2). These sensors recorded continu- window and a 60-second long-term window. No attempt is
ous waveform data to ensure maximum data recovery and so made to distinguish P and S waves in the initial triggering algo-
event triggering and detection algorithms could be improved rithm, so triggers may represent a mix of phase arrivals. Once
through retrospective testing. The abundance of large after- a trigger is detected at a station, minimal information is trans-
shocks provides a unique opportunity to examine the ability of ferred to a central server and includes station ID, station loca-
this low-cost, distributed sensing network to rapidly detect and tion, sensor type, three-component acceleration at the time of
characterize earthquakes. the trigger, significance, trigger time, and clock offset. In Chile,
approximately half of the stations (48 ± 13) connected to the
RESULTS network each day and sensors are monitored for an average of
about 12.3 ± 2.1 hours per day (Figures 4A, 4B). Using trig-
Using retrospective tests on the continuous data recorded dur- ger data collected between March 1 and June 1, we find that
ing the QCN RAMP, we tested the triggering, event discrimi- the average latencies for trigger information to be transferred
nation, and rapid location and magnitude estimate algorithms. to the central server from Chilean stations is five seconds, with
Figure 3 shows an example of an aftershock recorded by a large more than 90% of the trigger information transmitted in less
number of QCN stations located near Concepción. Most of than eight seconds (Figure 4C).
Seismological Research Letters Volume 82, Number 4 July/August 2011 527
3. (A) Because stations are located in high-noise environments,
60 100 an individual event trigger may represent local noise not related
Mw=4+
Mw=5+
to an earthquake; to distinguish regional ground shaking
Mw=6+
90 events we temporally and spatially correlate incoming triggers.
50 Mw=7+
Mw=8+ 80 We evaluate incoming triggers at 0.2 sec intervals, comparing
each trigger with all other triggers that have occurred in the
Cumulative # QCN Stations
70
40 past 100 seconds. Triggers within 200 km are considered cor-
# Events Per Day
60 related if they occur with a time separation (ΔTij) less than or
equal to the station separation (ΔDij) divided by the slowest
30 # Stations 50
seismic velocity, Vmin plus a small error, ε. This takes the form:
40
20
30
ΔTij ≤ ΔDij ∕ Vmin + ε. (1)
10
20 If the average station to event azimuth is orthogonal to the
10 inter-station azimuth, then ∆Tij should be zero. If the azimuths
are parallel, then ∆Tij should equal the distance divided by the
0 0 velocity. The error, ε, may result from possible inaccuracy intro-
0 10 20 30 40 50
# Days Post Mw=8.8 duced by the trigger algorithm. Once at least five triggers are
correlated, we make an estimate of the earthquake location and
(B) −28°
286° 288° 290°
−28°
magnitude.
The event hypocenter is estimated by performing a three-
dimensional grid search and comparing the predicted and
observed relative arrivals at the stations. The initial event
location is set to the station location with the earliest trigger,
−30° −30°
with the assumption that this sensor is closest to the source.
An initial grid is generated that extends 2° × 2° in latitude and
Station Number longitude with a node every 0.02° and a total depth interval of
100 300 km with nodes every 10 km. The location that minimizes
−32° −32° 90 the L2 misfit between observed and predicted relative travel
80 times is identified as the low-resolution earthquake hypocenter.
70 Using this hypocenter location, we then iterate over a second
60 grid with grid extent and node intervals decreased by an order
−34° −34° 50 of magnitude.
40 Once the location has been estimated, the magnitude is
30 computed using an empirical magnitude distance relation-
20 ship with the acceleration vector magnitude, |a|, similar to the
−36° −36° 10 method of Wu et al. (2003) and Cua and Heaton (2007). This
0 relationship was calibrated using three aftershocks recorded
during the Chile RAMP. The equation is:
−38° −38° N
1
N∑
MI = [ a ln ( b a i ) + c ln ( Di ) + d ] (2)
i =1
286° 288° 290°
▲ Figure 2. A) Number of earthquakes that occurred each day where a = 1.25, b = 1.8, c = 0.8, d = 3.25, and N is the number
versus the number of days after the 27 February 2010 M 8.8 of triggers used. As additional triggers are logged at the server,
Maule mainshock for different magnitude ranges: 4+ (black line), the location and magnitude estimates of the event are updated.
5+ (red line), 6+ (green line), 7+ (blue line), and 8+ (magenta line). We ran a retrospective test of the automated event
Also shown is the cumulative number of QCN stations installed detection and characterization algorithms using aftershocks
(dashed red line). The sensors arrived in Chile one week after the recorded on QCN stations around Concepción March 12–
mainshock and deployment of the sensors began soon afterward. April 3, 2010. Figure 5A shows a map of 23 aftershocks iden-
Almost all of the 100 stations were installed within 10 days after tified by QCN during this 20-day period. The events are all
the deployment began. B) Locations of QCN sensors installed located within the mainshock slip region, which serves as a
after the M 8.8 27 February 2010 Maule mainshock, colored by check on the reliability of the locations. For events detected
station number. Many of the sensors are installed in close prox- by QCN stations and also listed in the National Earthquake
imity to one another and so all sensors may not be visible. Information Center (NEIC) catalog (USGS 2010) we find
528 Seismological Research Letters Volume 82, Number 4 July/August 2011
4. (A) San Juan (C)
Quillota
21
Santiago San Lui
s
Rancagua
24
Chimbarongo
-35° 27
area
Talca
Sensor
100 34
slip
Talcahuano
Los angeles
40
Temuco 50
Neuquen
Distance (km)
44
km
Valdivia
-40° 0 75 150
0 44
-75° -70° -65° 47
(B)
−36° 48
60 70 80 90 100
Con dence 52
−36.5° 54
65
−37° 82
−74° −73.5° −73° −72.5° −72° 0 10 20 30
Time (sec)
▲ Figure 3. A) Map showing the distribution of QCN stations (triangles) colored by installation date, the location of the mainshock epi-
center (red star), and the approximate location of the mainshock rupture plane (gray rectangle). The background color is shaking inten-
sity from the M 8.8 mainshock (e.g., Wald et al. 1999) plotted over topography, with red colors indicating Modified Mercalli Intensity
(MMI) X and green indicating MMI II–IV as illustrated in Figure 6. B) Comparison of USGS/NEIC catalog location and QCN estimated
location for an Mw 5.1 aftershock that occurred on 18 March 2010 at 01:57:33.4 UTC. QCN stations that recorded the event are shown as
blue triangles and the 15-min and 7-day USGS locations are shown by black and red stars, respectively. The QCN-estimated location is
shown by the red circle. Chi-squared statistical confidence is plotted as a color map with 95% and 90% confidence highlighted by the
solid black and dashed black contours, respectively. C) East component time series from the stations to locate the Mw 5.1 aftershock.
Note the reduced noise levels on the new 14-bit and 16-bit sensors shown in purple. P- and S-wave manual picks are shown by the red
and green lines, respectively.
that the magnitude estimates are very similar (Figure 5B). The The average time needed to detect and characterize an
uncertainty of each magnitude estimate is determined through earthquake is 27.4 seconds from the event origin time using the
bootstrap resampling of the trigger information. The average automated scheme described above. The fastest detection occurs
bootstrap uncertainty is approximately 0.45. Updated earth- within 9.4 seconds and the longest delay in detection is 59.2 sec-
quake statistics are generated on a second-by-second basis as onds. Sources of latencies include: source to station wave propa-
new trigger data are archived on the server, with uncertainties gation time, on-site trigger detection, time to transfer trigger
generally decreasing by 10–50% between iterations. information to the server, and computation time. The largest
Seismological Research Letters Volume 82, Number 4 July/August 2011 529
5. (A) (B) (C)
16
Average Uptime (Hours)
Trigger Count (x104)
Number of Stations
60 3
12
40 8 2
20 4 1
0 0 0
0 20 40 60 80 0 20 40 60 80 2 4 6 8 10
Time (Days) Time (Days) Transfer Latency (Sec)
▲ Figure 4. Chile RAMP statistics determined for a three-month period from 1 March to 1 June in 2010. A) Number of stations con-
nected to the network each day. B) Average number of hours each station operated. C) Histogram showing the latencies to transfer the
trigger data from the Chilean stations to the QCN central server in California.
delay in event detection for the Chile aftershock data is the time sensors. The largest delays in event detection were the source-
required for the seismic waves to propagate from the source to station wave propagation times; thus, increasing the density
five or more stations, which is 22 seconds on average. Thus, the of stations would dramatically reduce the detection time.
time required for a station to issue a trigger, send the data to the We expect that the latest generation of sensors will further
server, and compute a location and magnitude is 5.4 seconds, on improve event detection capabilities through increased signal-
average. The delay associated with updating the event character- to-noise ratios resulting in more reliable P-wave detections
istics is also determined by equivalent wave propagation times, for lower magnitude (M < 4.5) events. With little additional
on-site trigger detection, data communication, and server-side computation time we are able to generate maps of measured
computation time, but can happen as quickly as 0.2 seconds or and predicted shaking amplitudes for the region around a
as late as 100 seconds after the event. Again the primary delay moderate to large aftershock. Due to the higher station densi-
factor in updated characteristics is the wave propagation time. ties achievable with low-cost MEMS sensors and distributed
The data collected during the QCN RAMP can also be sensing techniques, it is possible to examine spatial variation
used to provide high-resolution maps of shaking intensity and in ground accelerations at much higher resolution than is
predict shaking intensity using the first few seconds of data practical with traditional instrumentation. Detailed maps of
recorded by the network. Figure 6 illustrates the high similar- shaking intensities could provide critical information to direct
ity between an initial attempt at providing a near real-time emergency responders to regions that experienced the greatest
cyber-enabled shaking intensity map and the USGS ShakeMap accelerations.
(Wald et al. 1999). This map was calculated post-facto, but we Installing 100 sensors in less than two weeks was sur-
account for all latencies including travel-time, data transfer, prisingly attainable. RAMP deployments that utilize MEMS
event characterization, and image publishing. These retrospec- sensor technology may soon be able to install 500 or more
tive simulations typically provide stable shake-maps in less sensors in a populated region immediately following a large
than 30 seconds from the aftershock origin time. The shake- earthquake. Furthermore, with the arrival of the more sensi-
maps are also rapidly updated as new trigger data arrive. tive 14-bit, 16-bit, and 24-bit accelerometers, it will be possible
to record more aftershocks at greater resolution. The greatest
DISCUSSION delay in QCN’s RAMP installation was in making appropriate
local contacts for obtaining unrestricted access to the rupture
Due to the portability of the USB MEMS accelerometers and zone. Through the combination of cyber, social, and seismic
simple installation procedure, a dense real-time network of networking, QCN is rapidly overcoming this hurdle.
strong-motion seismic stations was installed rapidly following Having a very dense network of hundreds, or even thou-
the 27 February 2010 M 8.8 Maule, Chile earthquake. Most sands, of low-cost sensors in a region of high seismicity will
of the 100 stations were installed within 10 days of the RAMP provide higher resolution estimates of small-scale lateral varia-
initiation, and we were thus able to record many of the initial, tions in amplification effects than previously possible. This will
significant aftershocks. Rapid event detection and character- enable us to better understand on what scales heterogeneities
ization is very important for directing emergency response and cause amplification, focusing, and defocusing (e.g., Gao et al.
is critical for the future development of earthquake advanced 1996). QCN strong-motion data can also provide dense obser-
alert systems (e.g., Allen et al. 2009; Kanamori 2005). vations around a large earthquake, resulting in higher-resolu-
As shown, we can rapidly estimate aftershock locations tion slip models and enhanced understanding of rupture prop-
and magnitudes using data from the QCN strong-motion erties (e.g., Dreger et al. 2005; Jakka et al. 2010).
530 Seismological Research Letters Volume 82, Number 4 July/August 2011
6. (A) 285 286 287 288 289 290 (B) 7
-35 -35 Mb(QCN)=0.96Mb(NEIC)
6
-36 -36
Mb (NEIC)
5
-37 -37 Co-detected
4
-38 -38
QCN -Only
-39 -39 3
3 4 5 6 7
285 286 287 288 289 290 Mb (QCN)
▲ Figure 5. A) Aftershock locations (red circles) determined by a retrospective, automated event location scheme that uses trigger
information from QCN stations (blue triangles) located near Concepción. Star shows the mainshock epicenter and rectangle repre-
sents the approximate mainshock slip plane. B) Event magnitudes between March 12 and April 30, 2010 for events co-detected by NEIC
and QCN (black squares) and events detected only by QCN (gray diamonds). The black line is a fit to the co-detected events showing
reasonable agreement between QCN-estimated magnitudes compared to NEIC catalog magnitudes.
(A) Curico (B) Curico
–35° –35°
-35°
Talca Talca
–35.5° –35.5°
-35.5°
Linares Linares
–36° Parral
–36° Parral
San Carlos San Carlos
–36.5° –36.5°
Talcahuano Talcahuano
–37° Coronel
–37° Coronel
Arauco Arauco
Los angeles Los angeles
–37.5° km –37.5° km
Lebu Mulchen Lebu Mulchen
0 50 0 50
–74° –73° –72° –74° –73° –72°
PERCEIVED
SHAKING Not felt Weak Light Moderate Strong Very strong Severe Violent Extreme
POTENTIAL none none none Very light Light Moderate Moderate/Heavy Heavy Very Heavy
DAMAGE
PEAK ACC.(%g) <.17 .17–1.
4 1.4–3.
9 3.9–9.
2 9.2–18 18–34 34–65 65–124 >124
PEAK VEL.(cm/s) <0.1 0.1–1. 1.1–3.4
1 3.4–8.
1 8.1–16 16–31 31–60 60–116 >116
INSTRUMENTAL
INTENSITY I II–III IV V VI VII VIII IX X+
▲ Figure 6. Comparison between (A) USGS ShakeMap (from USGS 2010) and (B) QCN cyber-enabled hazard map for the 16 March 2010
Mw 5.5 earthquake located offshore of Concepción.
Seismological Research Letters Volume 82, Number 4 July/August 2011 531
7. ACKNOWLEDGMENTS Frassetto, A., T. J. Owens, and P. Crotwell (2003). Evaluating the net-
work time protocol (NTP) for timing in the South Carolina Earth
Physics Project (SCEPP). Seismological Research Letters 74, 649–
This research was funded by NSF RAPID Award EAR 1035919 652.
and NSF grant EAR-0952376. The authors would also like to Gao, S., H. Liu, P. M. Davis, and L. Knopoff (1996). Localized ampli-
thank geology and geophysics students from the University of fication of seismic waves and correlation with damage due to the
Concepción for their invaluable assistance with deploying the Northridge earthquake: Evidence for focusing in Santa Monica.
sensors. Bulletin of the Seismological Society of America 86, S209–S230.
Holland, J. (2003). Earthquake data recorded by the MEMS accelerom-
eter. Seismological Research Letters 74, 20–26.
REFERENCES Jakka, R. S., E. S. Cochran, and J. F. Lawrence (2010). Earthquake source
characterization by the isochrone back projection method using
Allen, R. M., and H. Kanamori (2003). The potential for earthquake near-source ground motions. Geophysical Journal International
early warning in Southern California. Science 300, 786–789. doi:10.111/j.1365-246X.2010.04670.x.
Allen, R. M., H. Brown, M. Hellweg, O. Khainovski, P. Lombard, D. Kanamori, H. (2005). Real-time seismology and earthquake damage
Neuhauser (2009). Real-time earthquake detection and hazard mitigation. Annual Review of Earth and Planetary Science 33,
assessment by ElarmS across California. Geophysical Research 195–214.
Letters 36, L00B08, doi:10.1029/2008GL036766. USGS (2010). ShakeMap us2010txak: Offshore Bio-Bio, Chile
Anderson, D. P. (2004). BOINC: A system for public-resource comput- ht tp ://ear thquake.usgs.gov/ear thquakes/shakemap/global/
ing and storage. Proceedings of the Fifth IEEE/ACM International shake/2010txai/
Workshop on Grid Computing, November 8, 2004, Pittsburgh, Vanderkulk, W., F. Rosen, and S. Lorenz (1965). Large Aperture Seismic
USA, 4−10: http://www.computer.org/portal/web/csdl/abs/pro- Array Signal Processing Study. IBM Final Report, AROA Contract
ceedings/grid/2004/2256/00/2256toc.htm SD-296.
Anderson, D. P., and J. Kubiatowicz (2002). The world-wide computer. Wald, D. J., V. Quitoriano, T. H. Heaton, H. Kanamori, C. W. Scrivner,
Scientific American 286, 40–47. and C. B. Worden (1999). TriNet “ShakeMaps”: rapid generation of
Cochran, E. S., J. F. Lawrence, C. Christensen, A. I. Chung (2009). A peak ground motion and intensity maps for earthquakes in south-
novel strong-motion seismic network for community participation ern California (1999). TriNet “ShakeMaps”: Rapid generation of
in earthquake monitoring. Institute of Electrical and Electronics peak ground motion and intensity maps for earthquakes in south-
Engineers Instruments and Measures 12, 8–15. ern California. Earthquake Spectra 15, 537–555.
Cochran, E. S., J. F. Lawrence, C. Christensen, and R. Jakka (2009). The Wu, Y.-M., T.-l. Teng, T.-C. Shin, and N.-C. Hsiao (2003). Relationship
Quake-Catcher Network: Citizen science expanding seismic hori- between peak ground acceleration, peak ground velocity, and inten-
zons. Seismological Research Letters 80, 26–30. sity in Taiwan. Bulletin of the Seismological Society of America 93,
Cua, G., and T. H. Heaton (2007). The Virtual Seismologist (VS) 386–396.
method: A Bayesian approach to earthquake early warning. In
Earthquake Early Warning Systems, ed. P. Gasparini, G. Manfredi, Department of Geophysics
and J. Zschau, 97–132. Berlin & New York: Springer.
Dreger, D. S., L. Gee, P. Lombard, M. H. Murray, and Barbara Stanford University
Romanowicz (2005). Rapid finite-source analysis and near-fault 397 Panama Mall
strong ground motions: Application to the 2003 Mw 6.5 San Stanford, California 94305 U.S.A.
Simeon and 2004 Mw 6.0 Parkfield earthquakes. Seismological aichung@stanford.edu
Research Letters 76, 40–48. (A. I. C.)
Farine, M., N. Thorburn, and D. Mougenot (2004). General applica-
tion of MEMS sensors for land seismic acquisition, is it time? The
Leading Edge 23, 246–250.
532 Seismological Research Letters Volume 82, Number 4 July/August 2011