Download to read offline


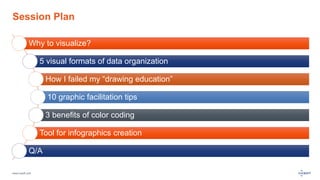

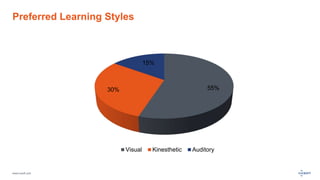


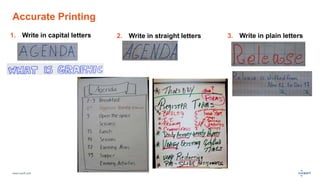
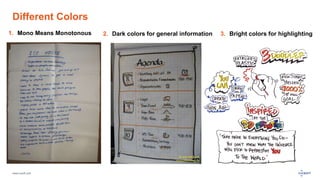
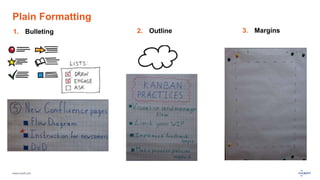
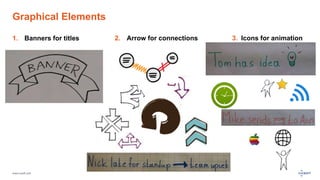

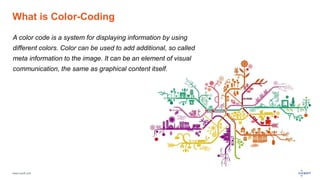
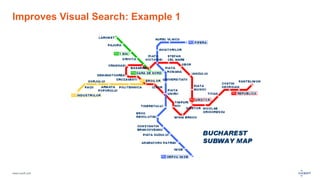
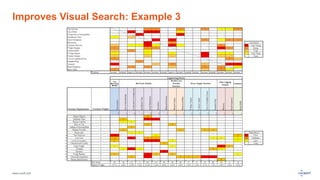
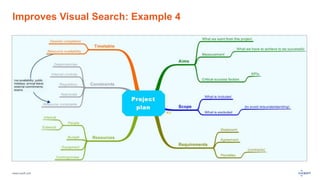
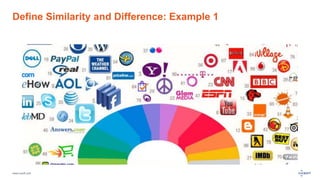
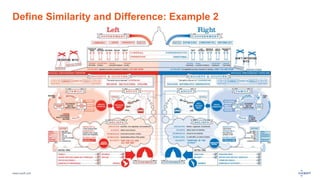
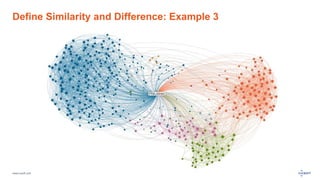
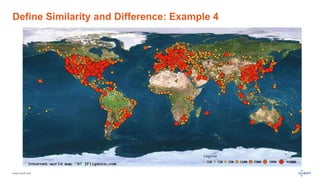

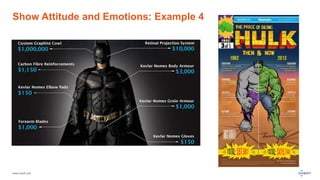

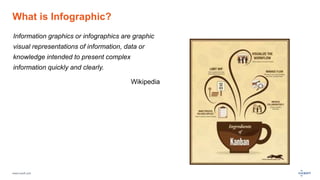
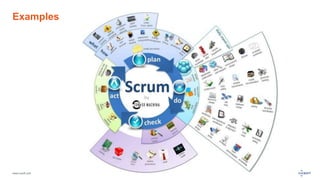
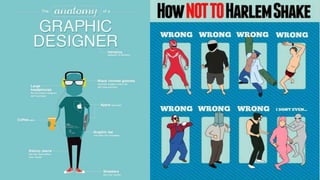

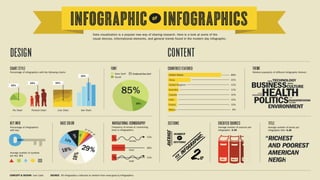


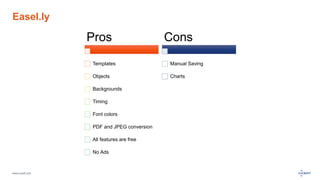


The document discusses visualization and visual communication. It covers topics like preferred learning styles, the bandwidth of senses, data design, graphic facilitation tips, color coding, and tools for creating infographics. Specifically, it provides examples of how color coding can improve visual search, define similarities and differences, and show attitudes and emotions. It also defines infographics as visual representations of information intended to present complex information quickly and clearly.


