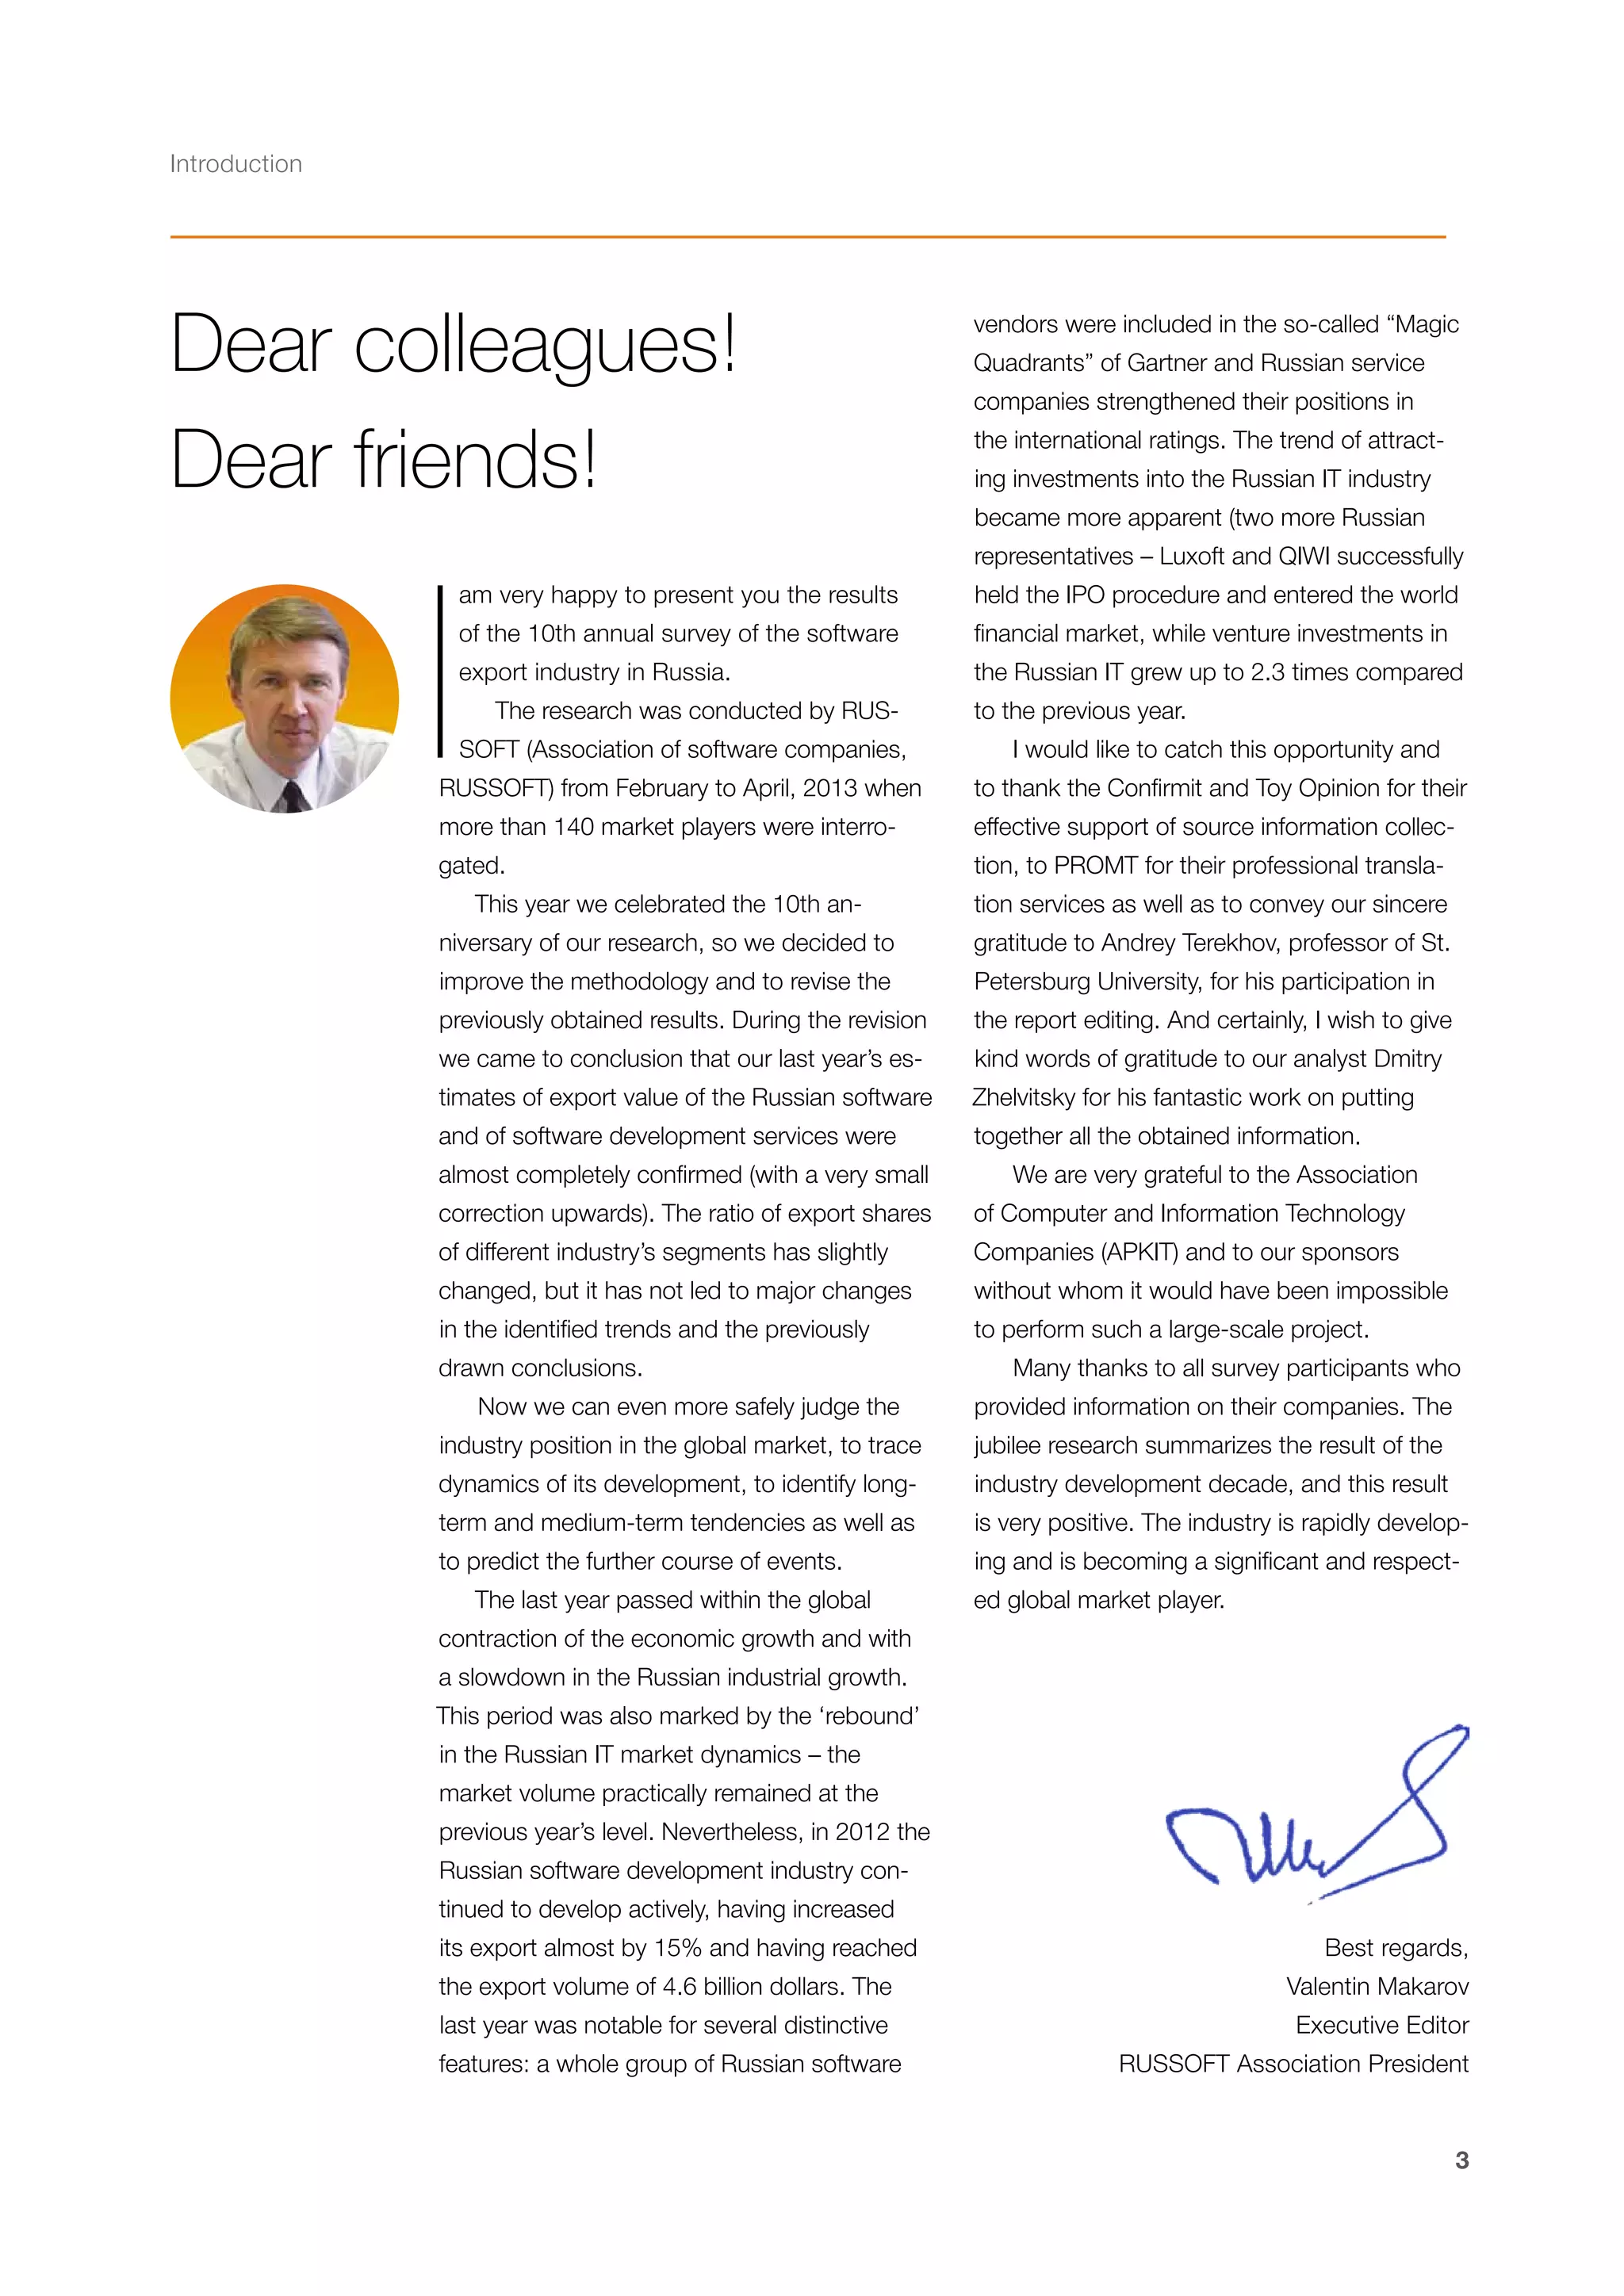
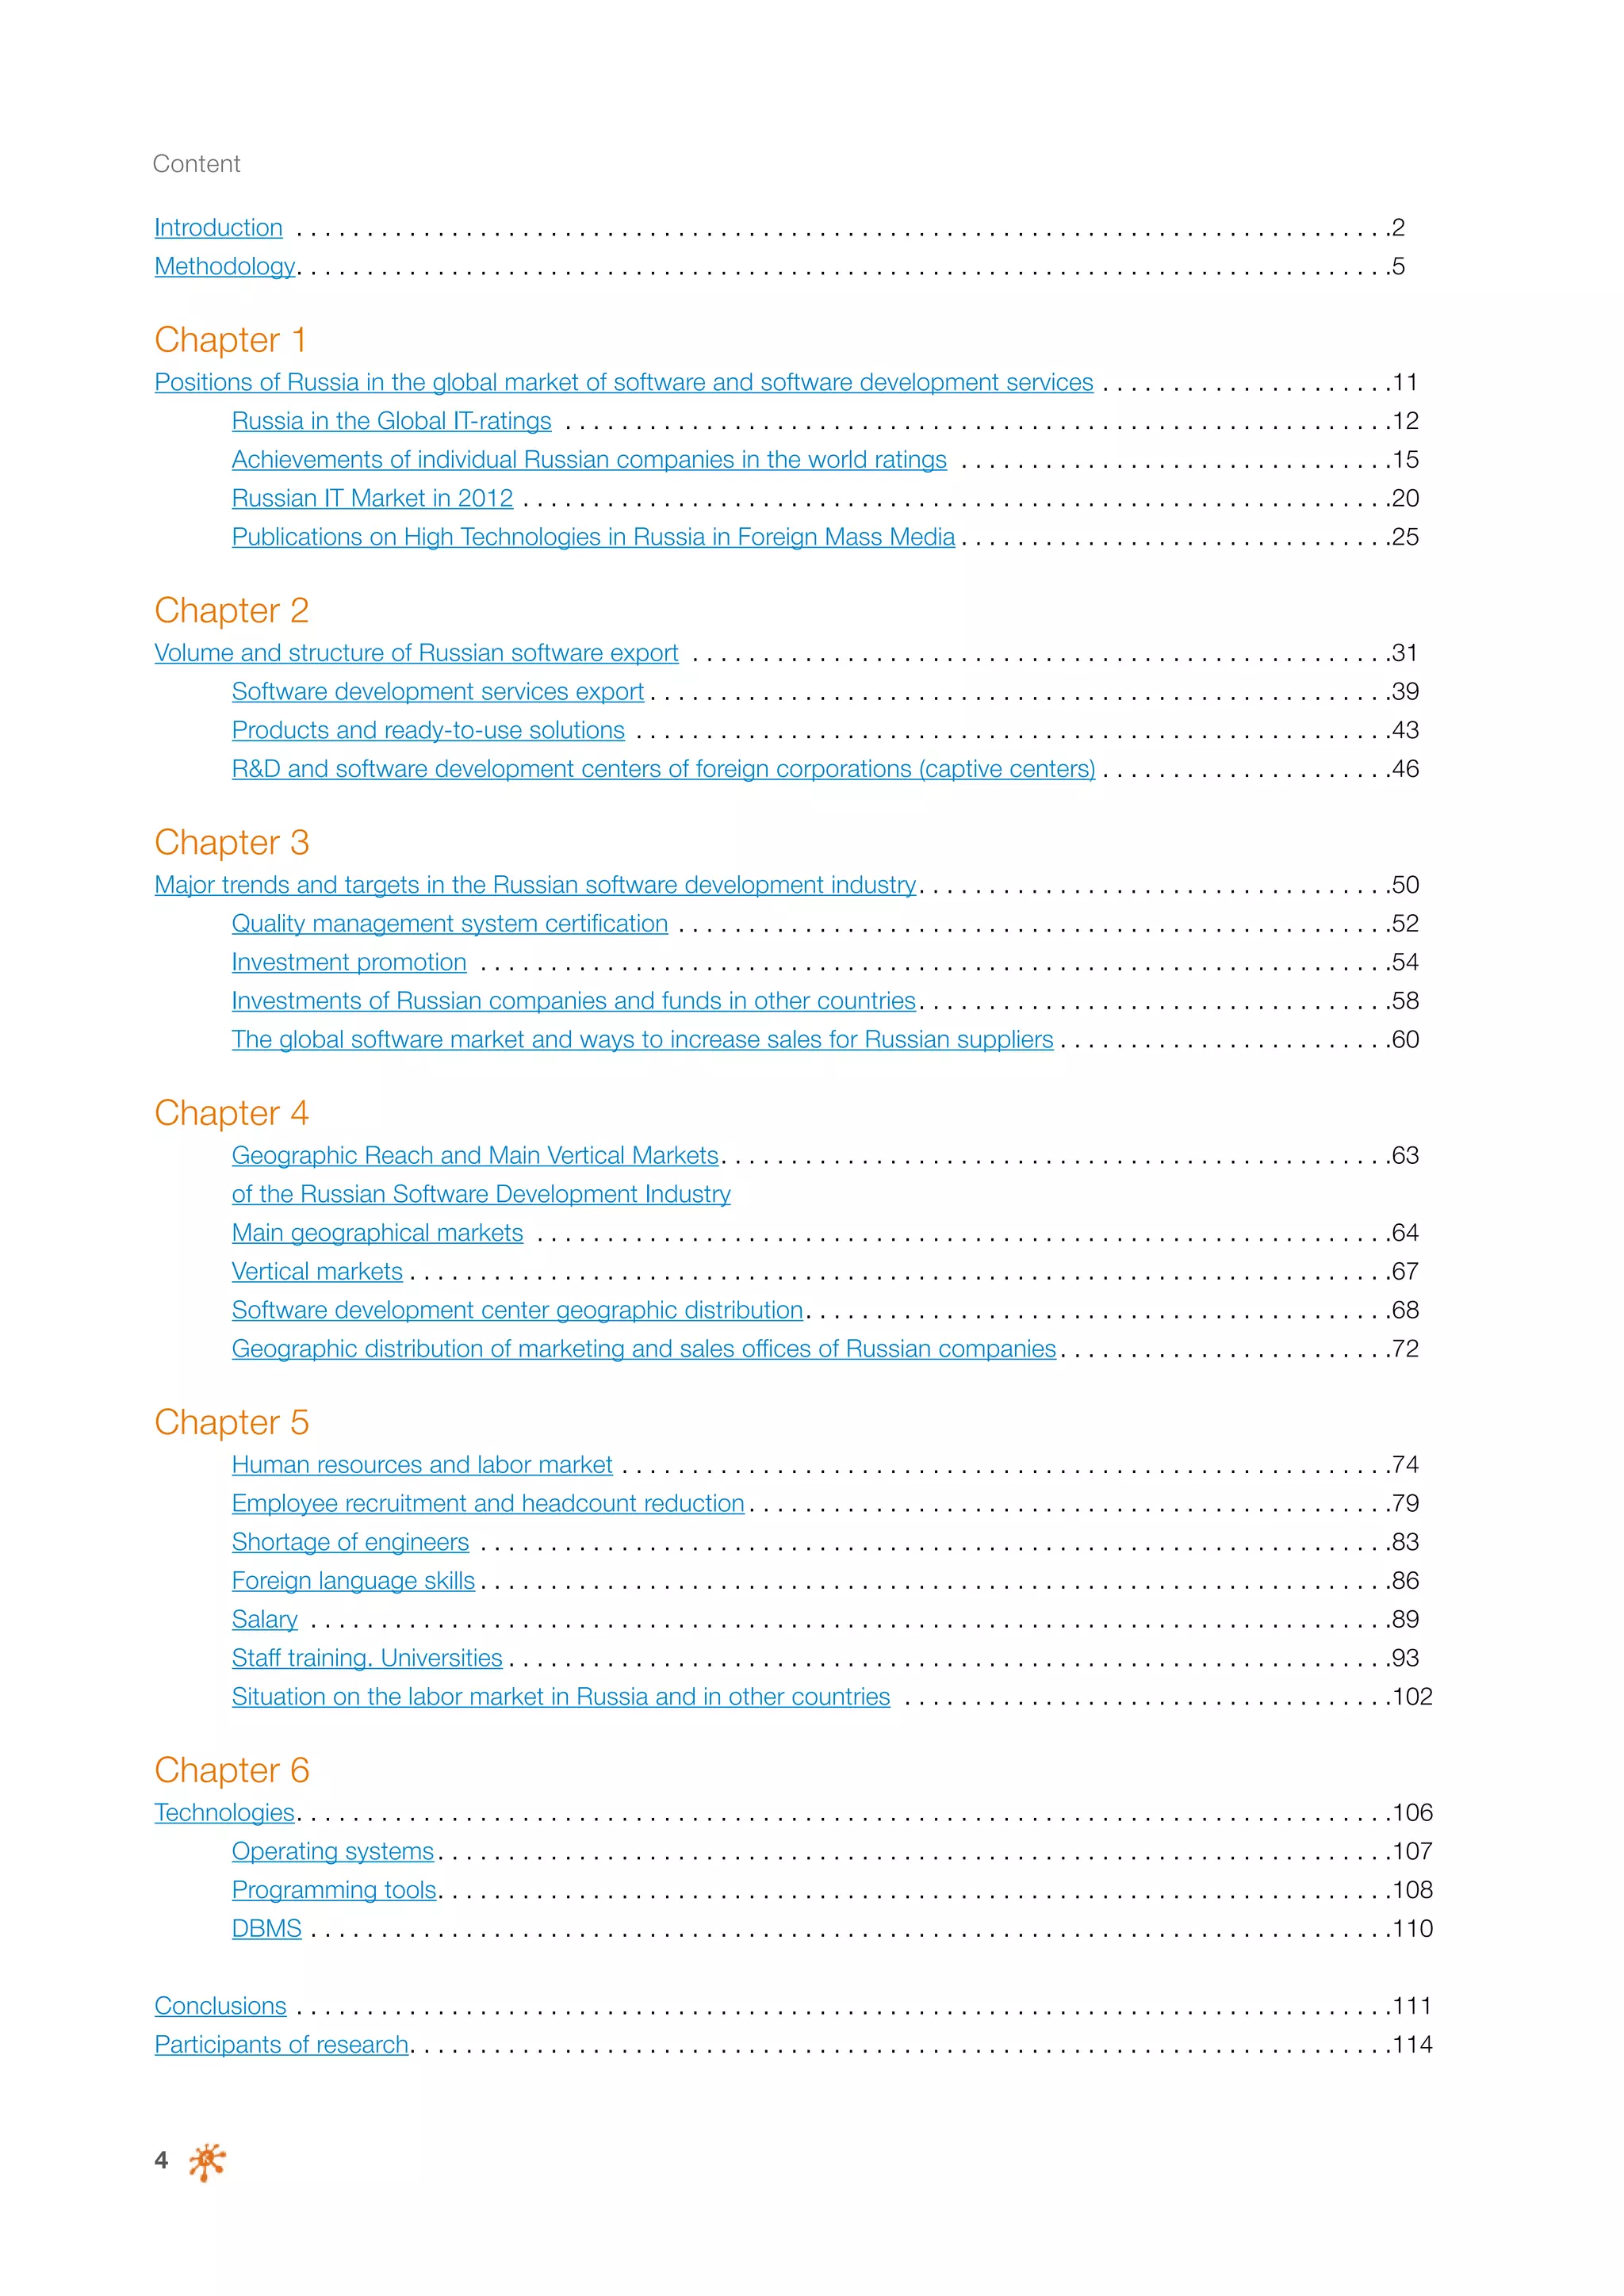
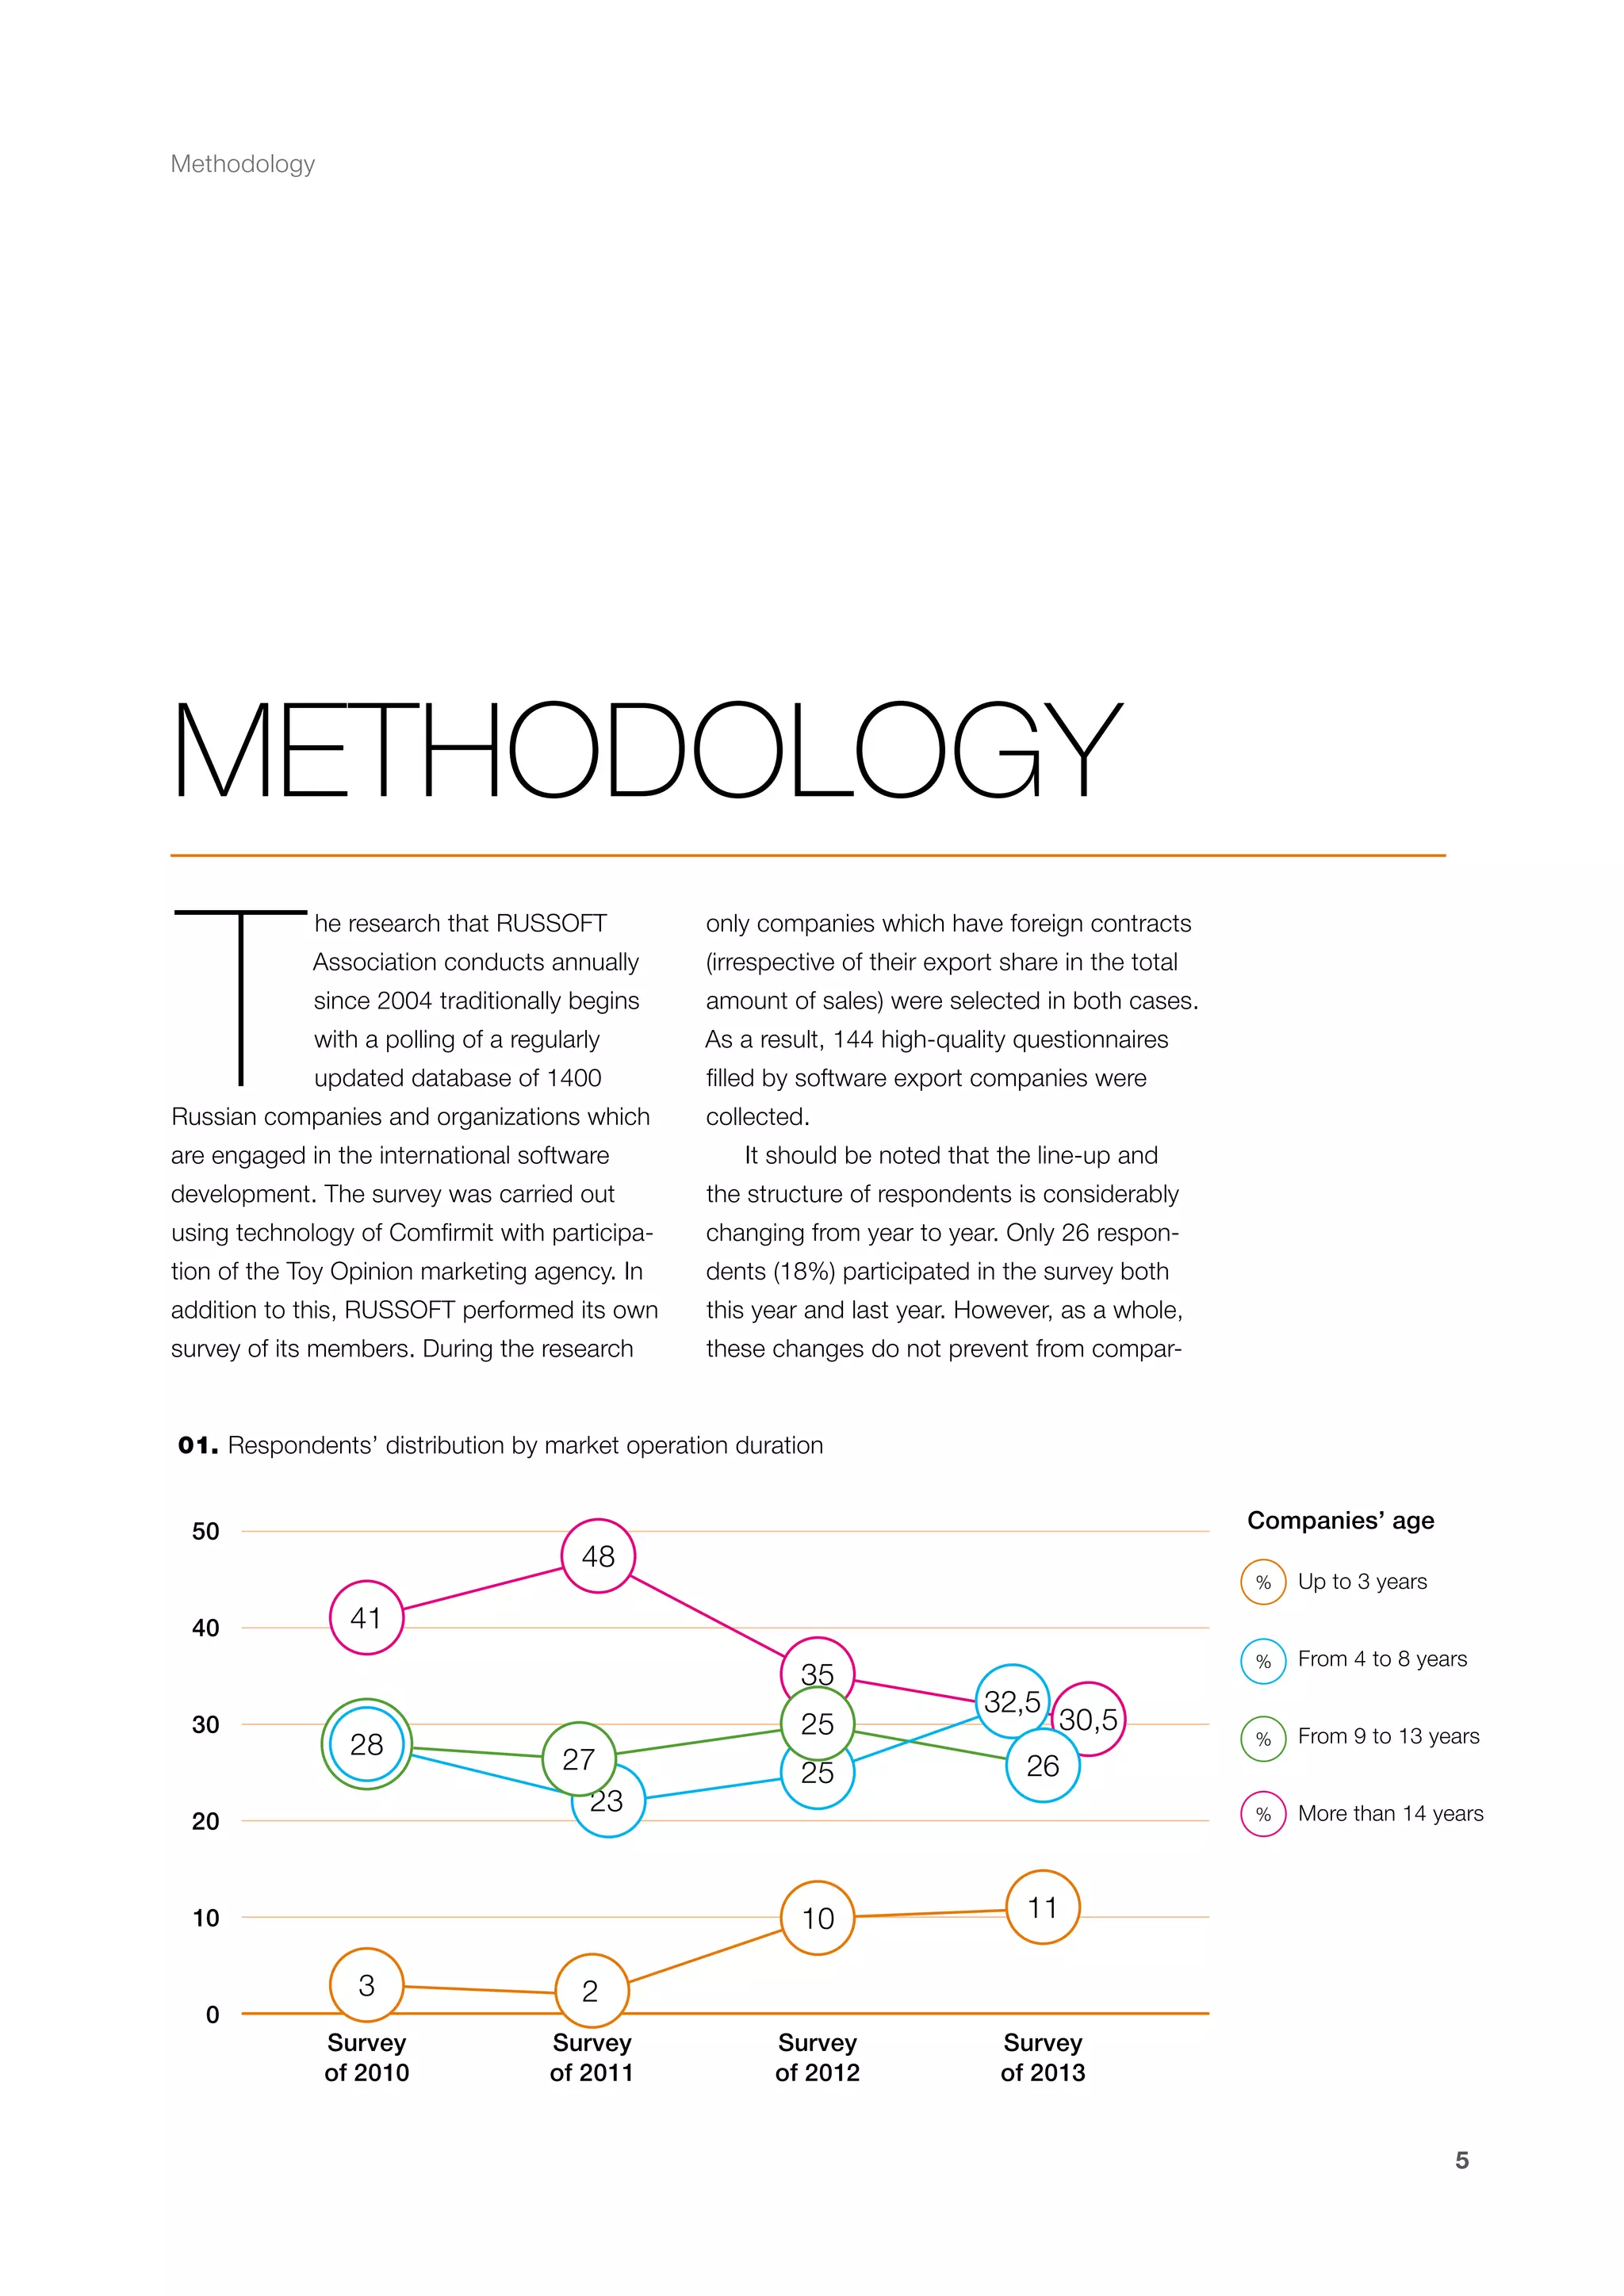
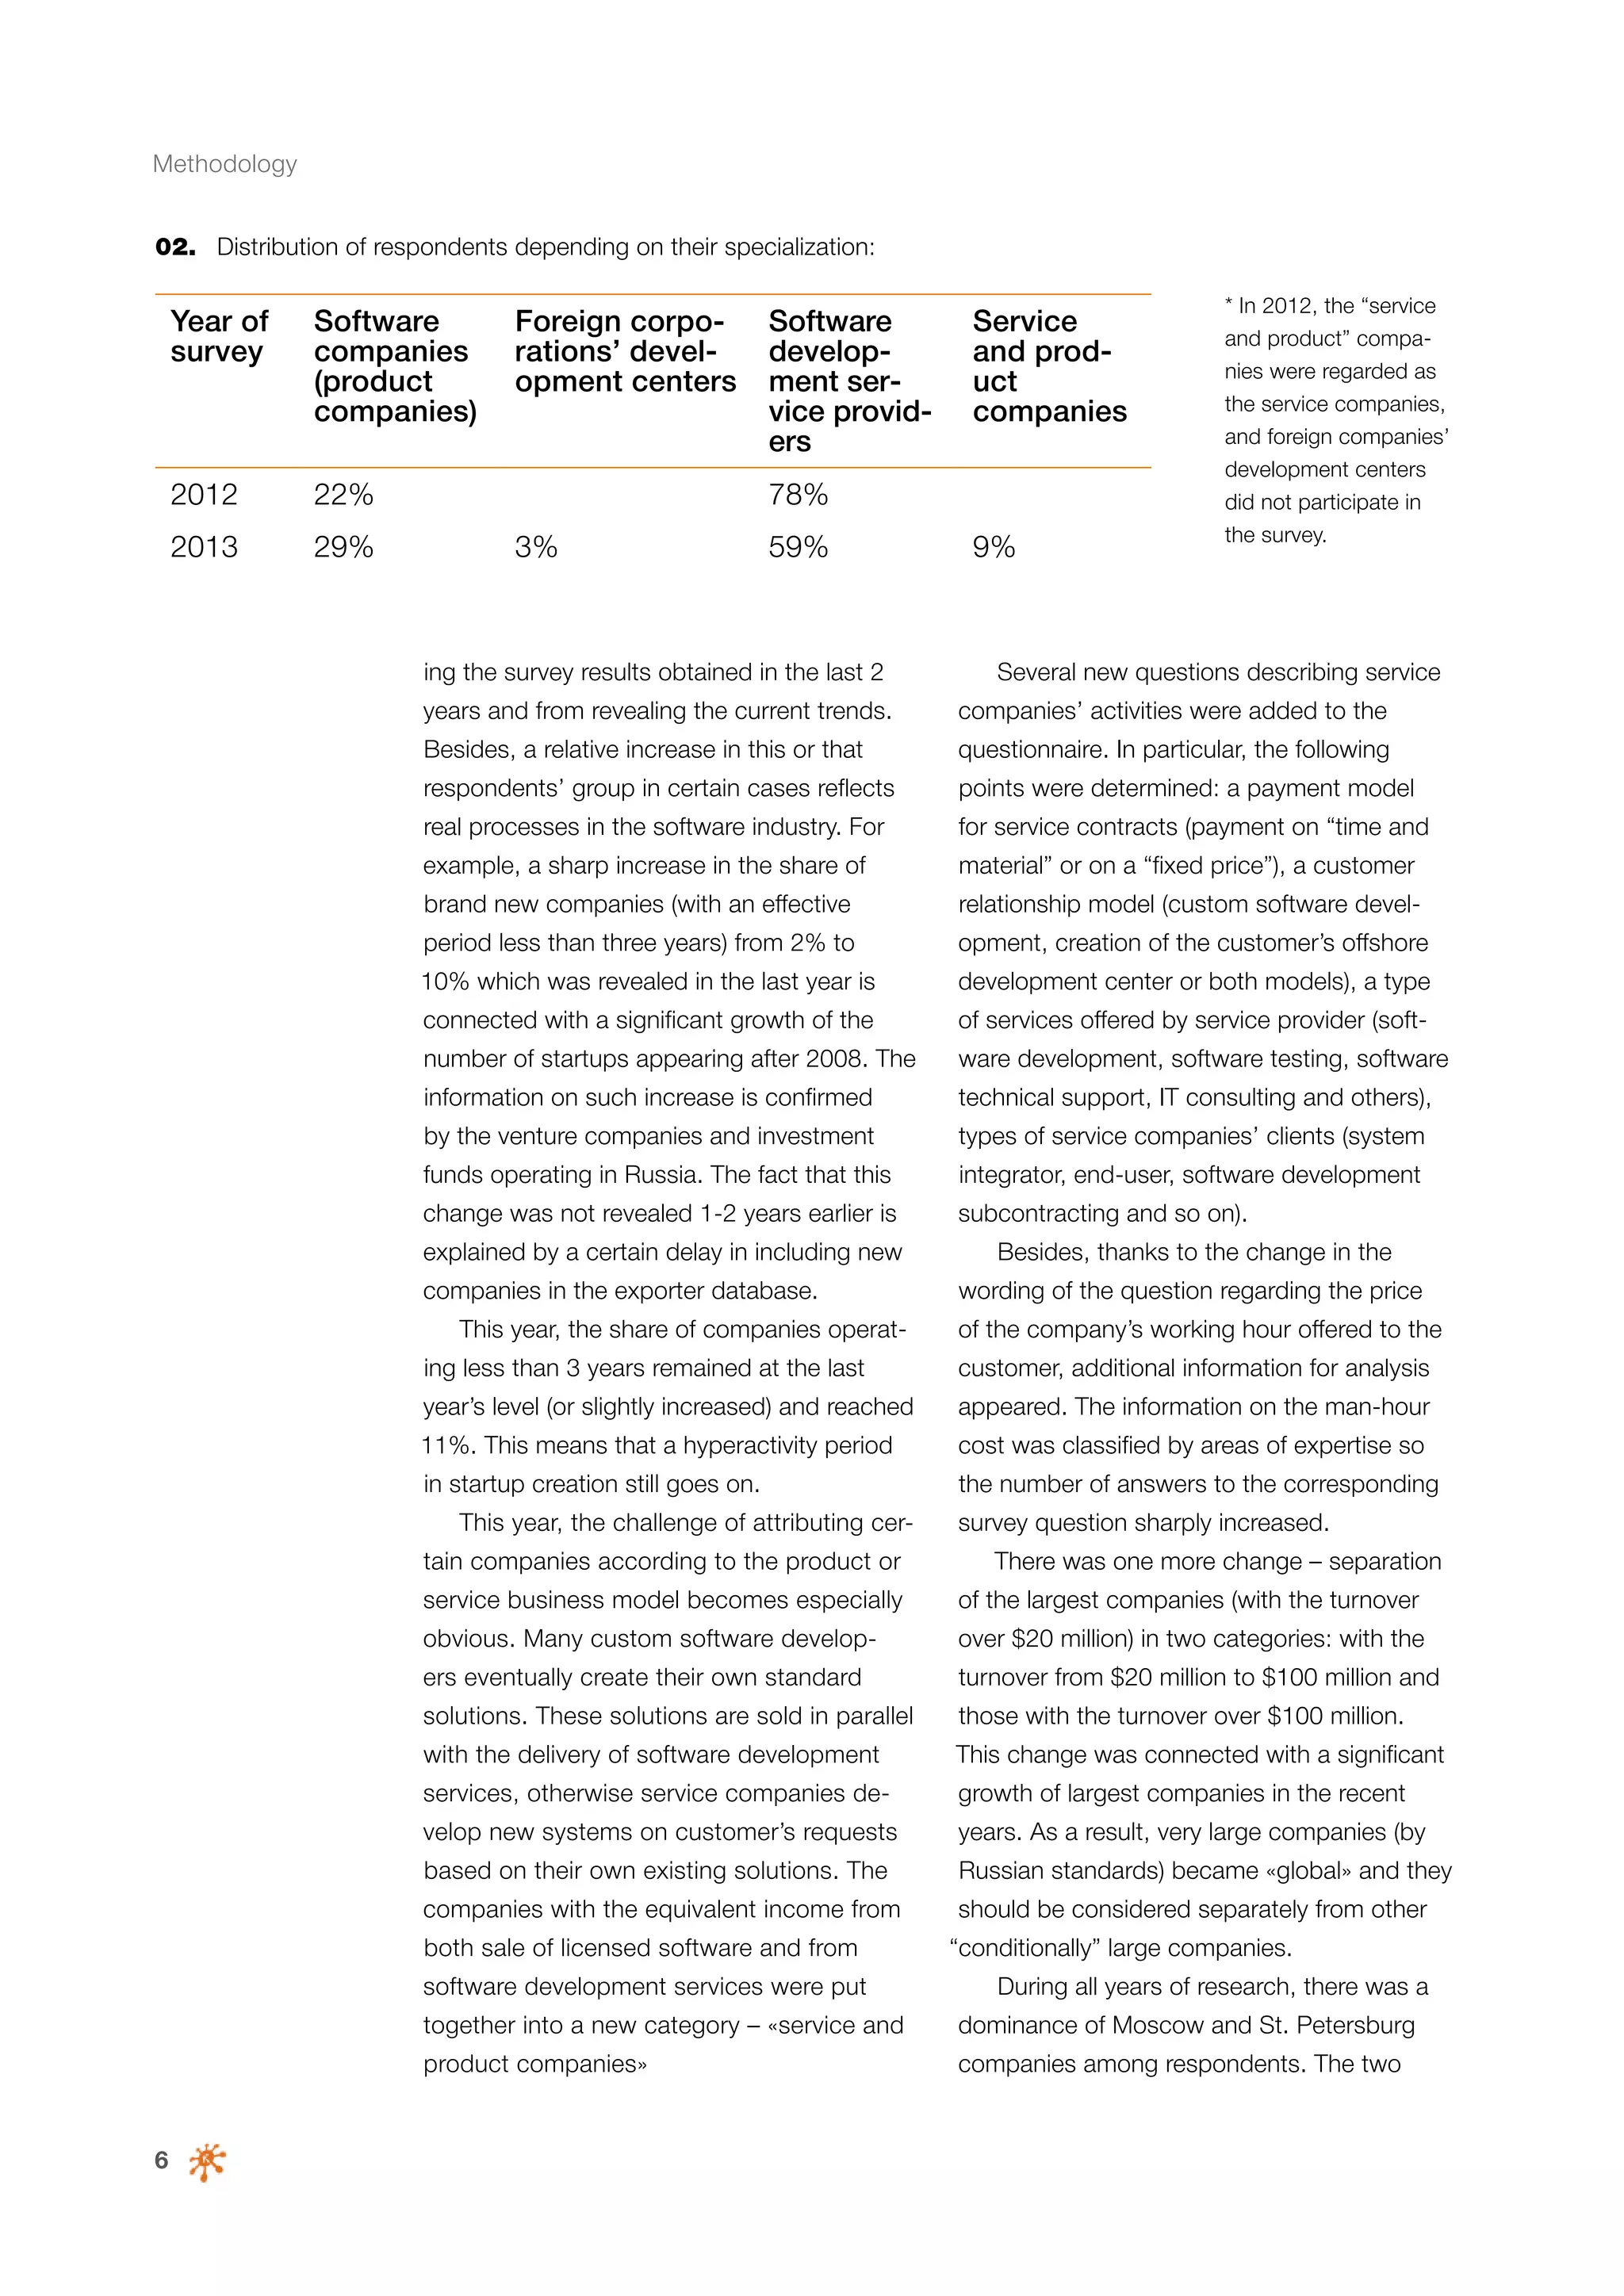
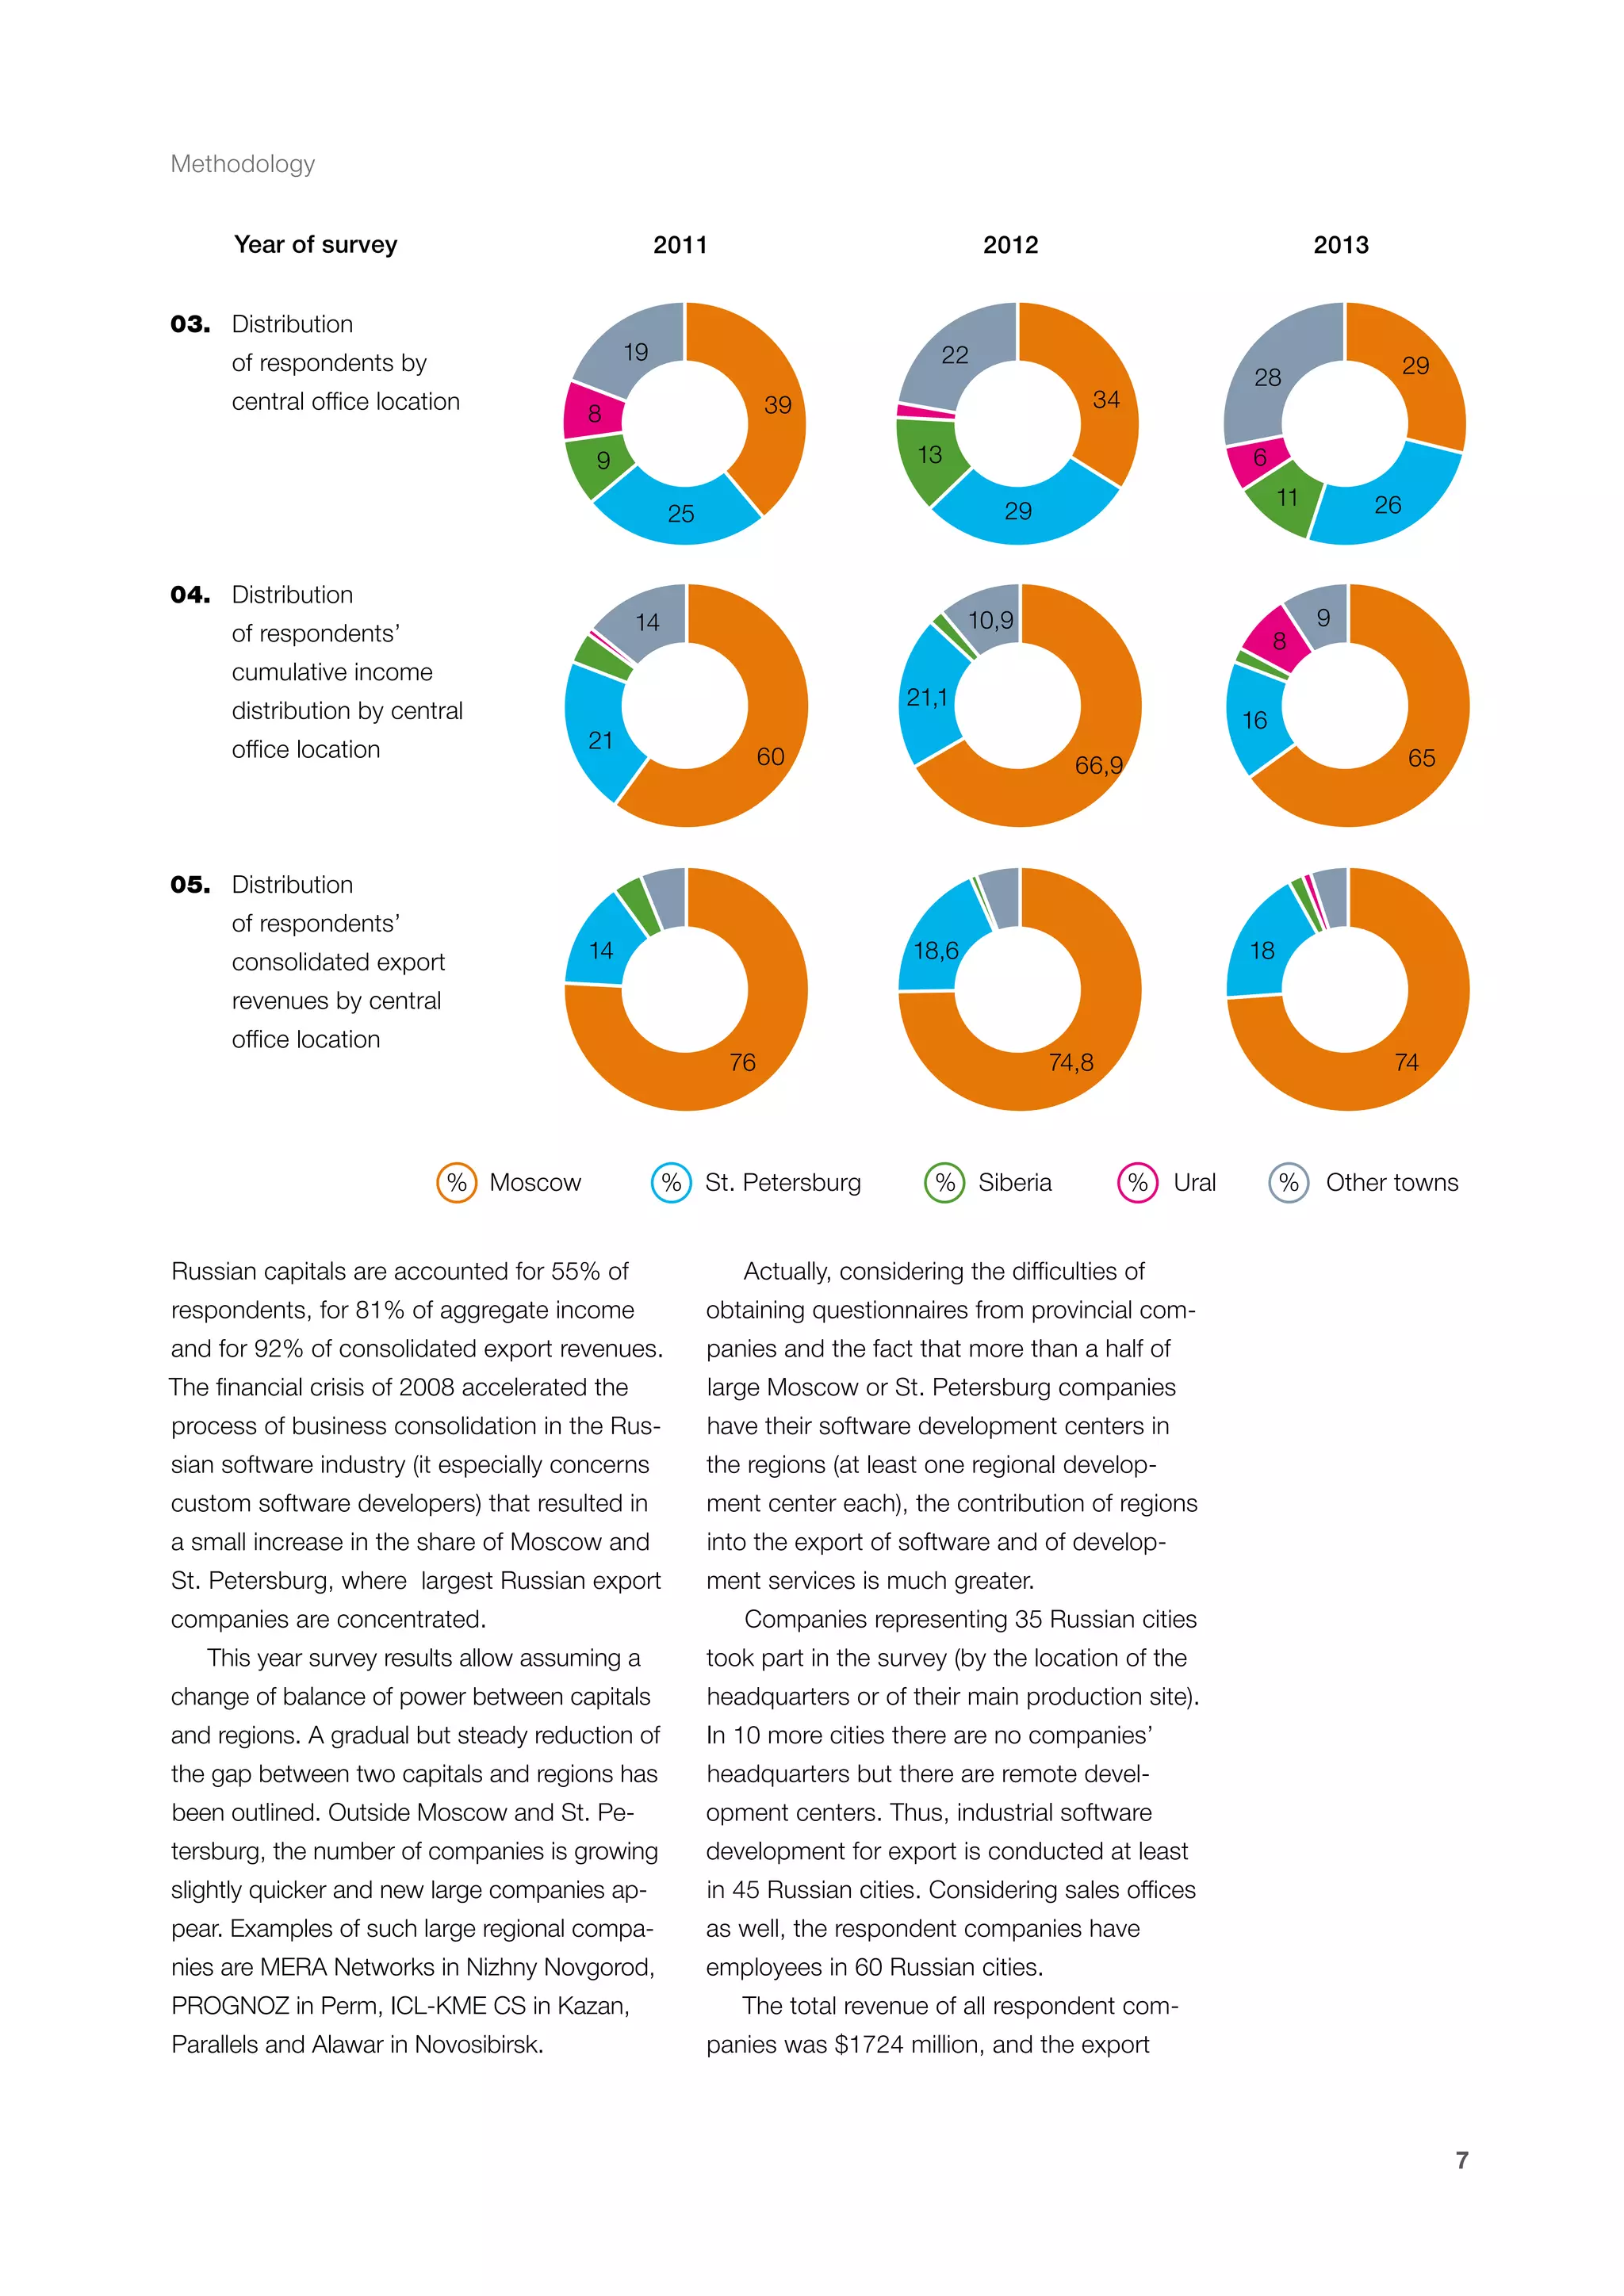
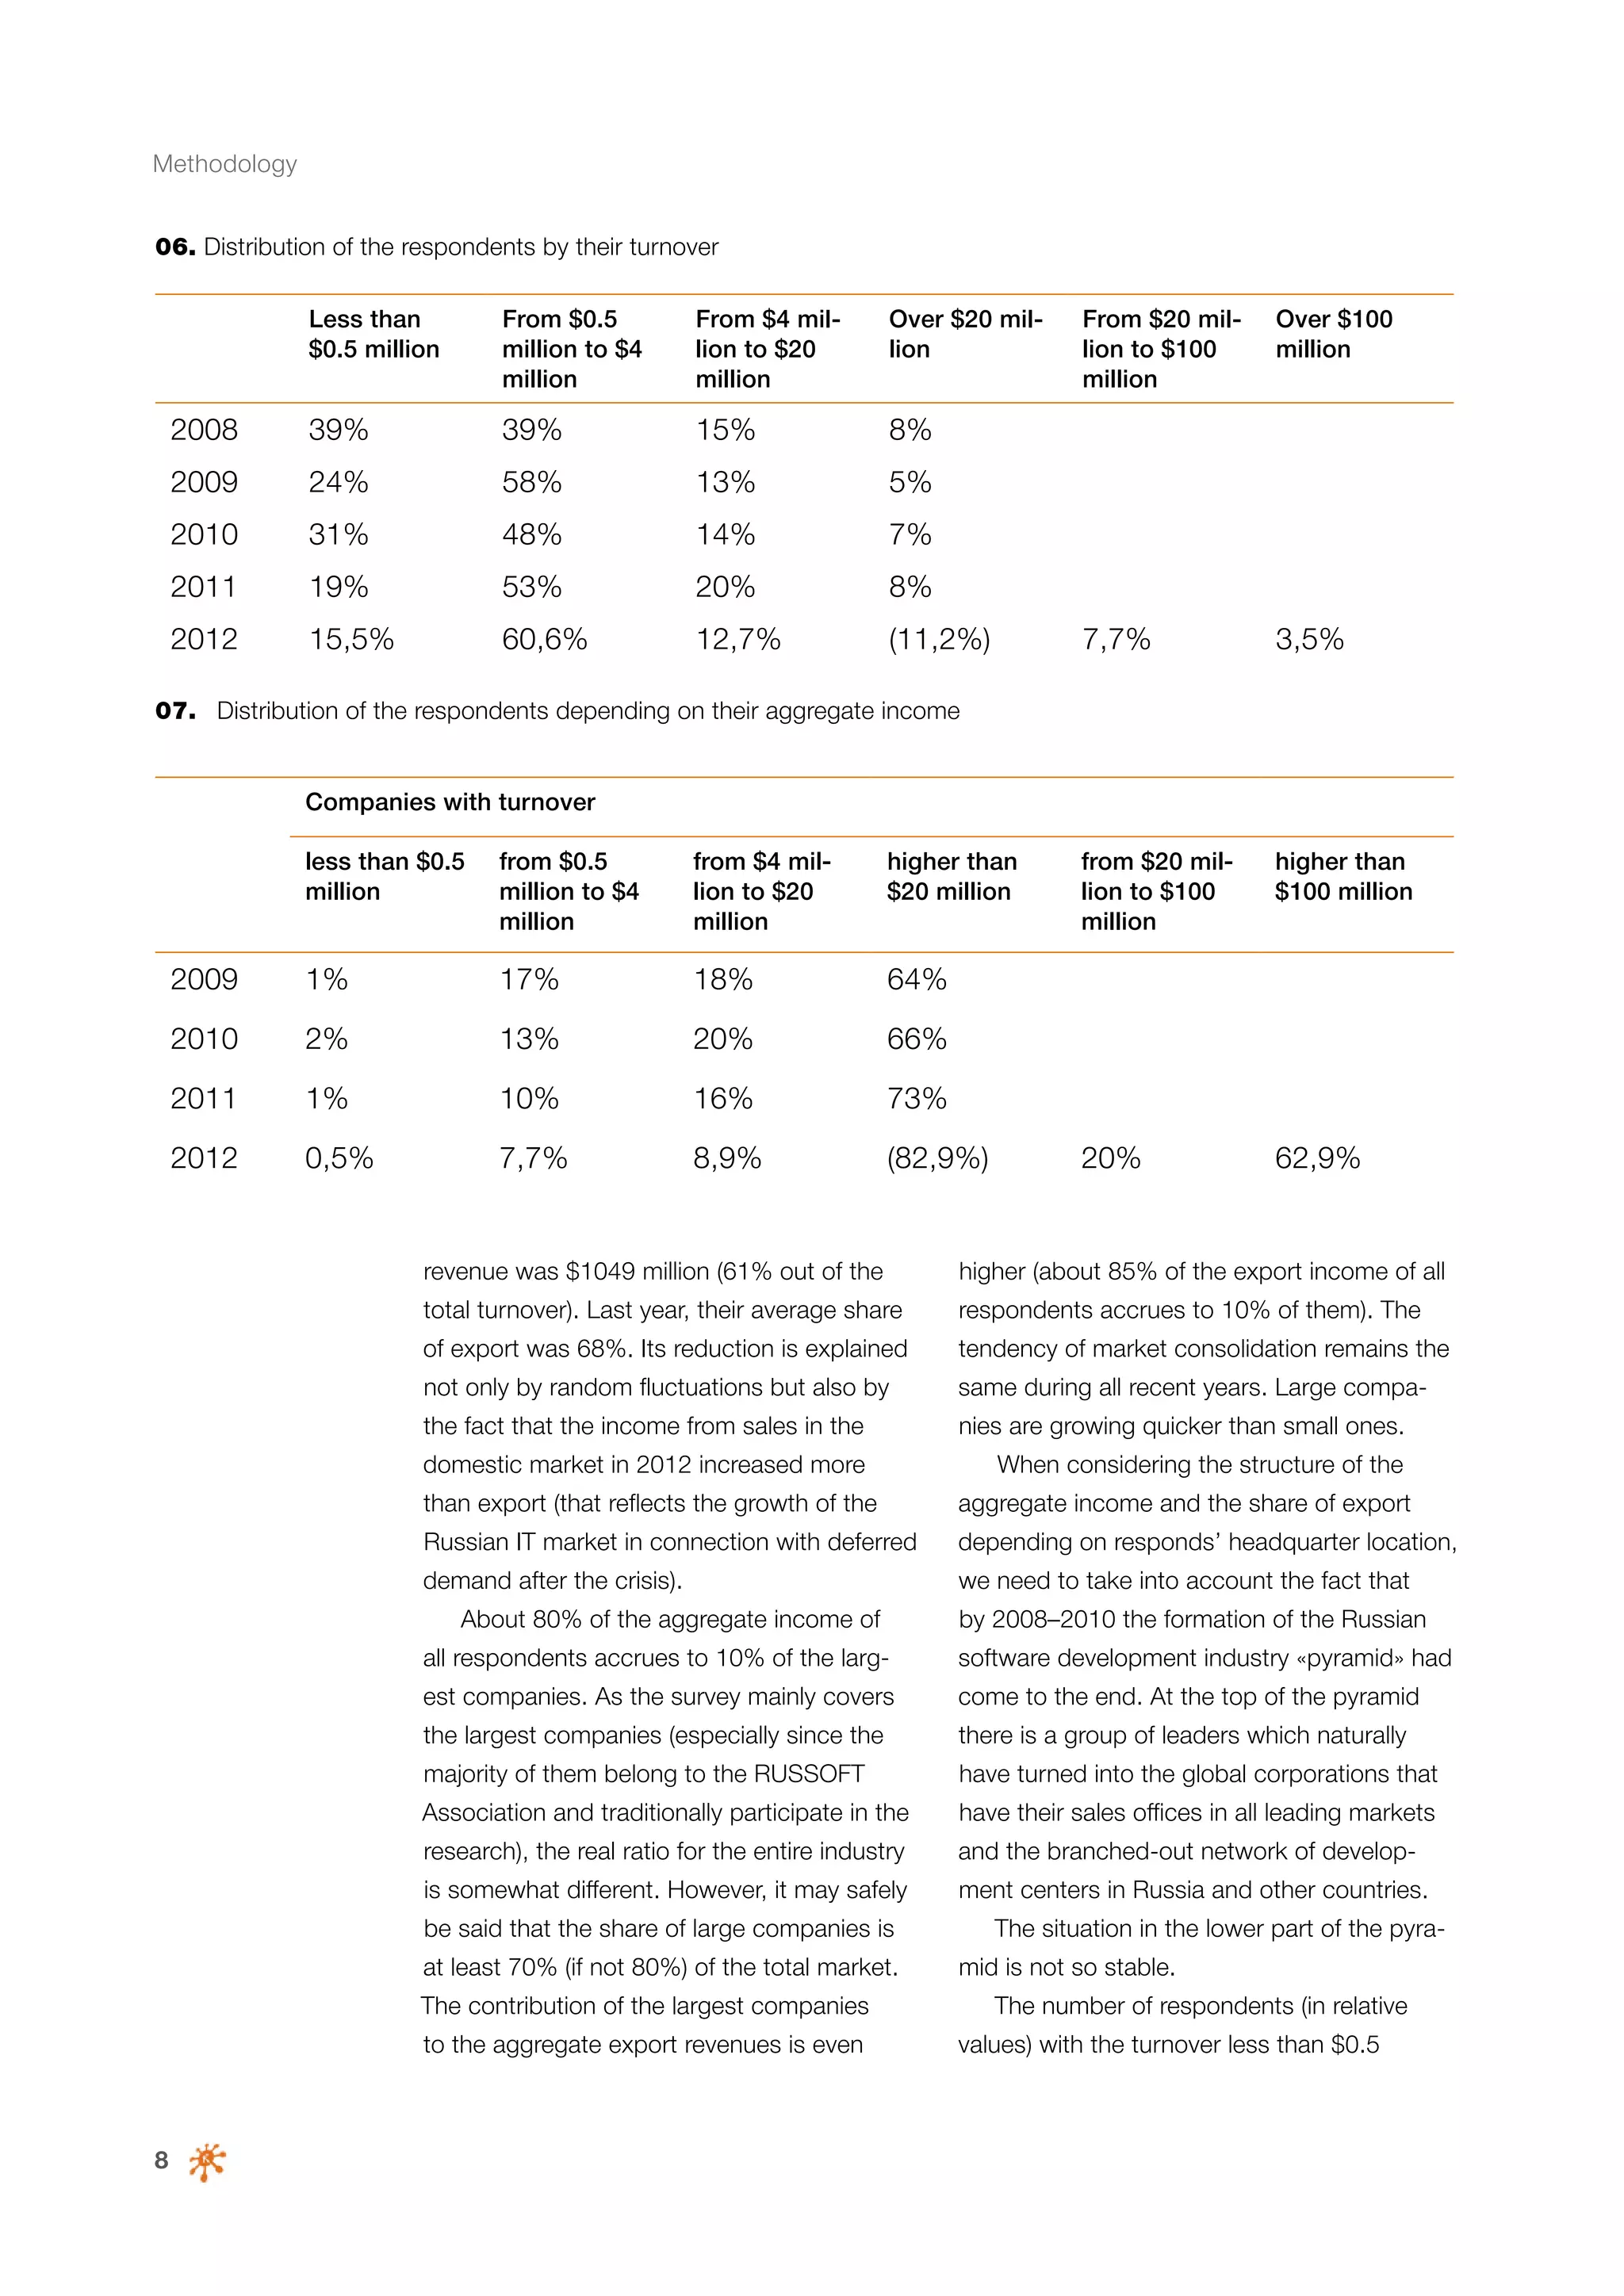
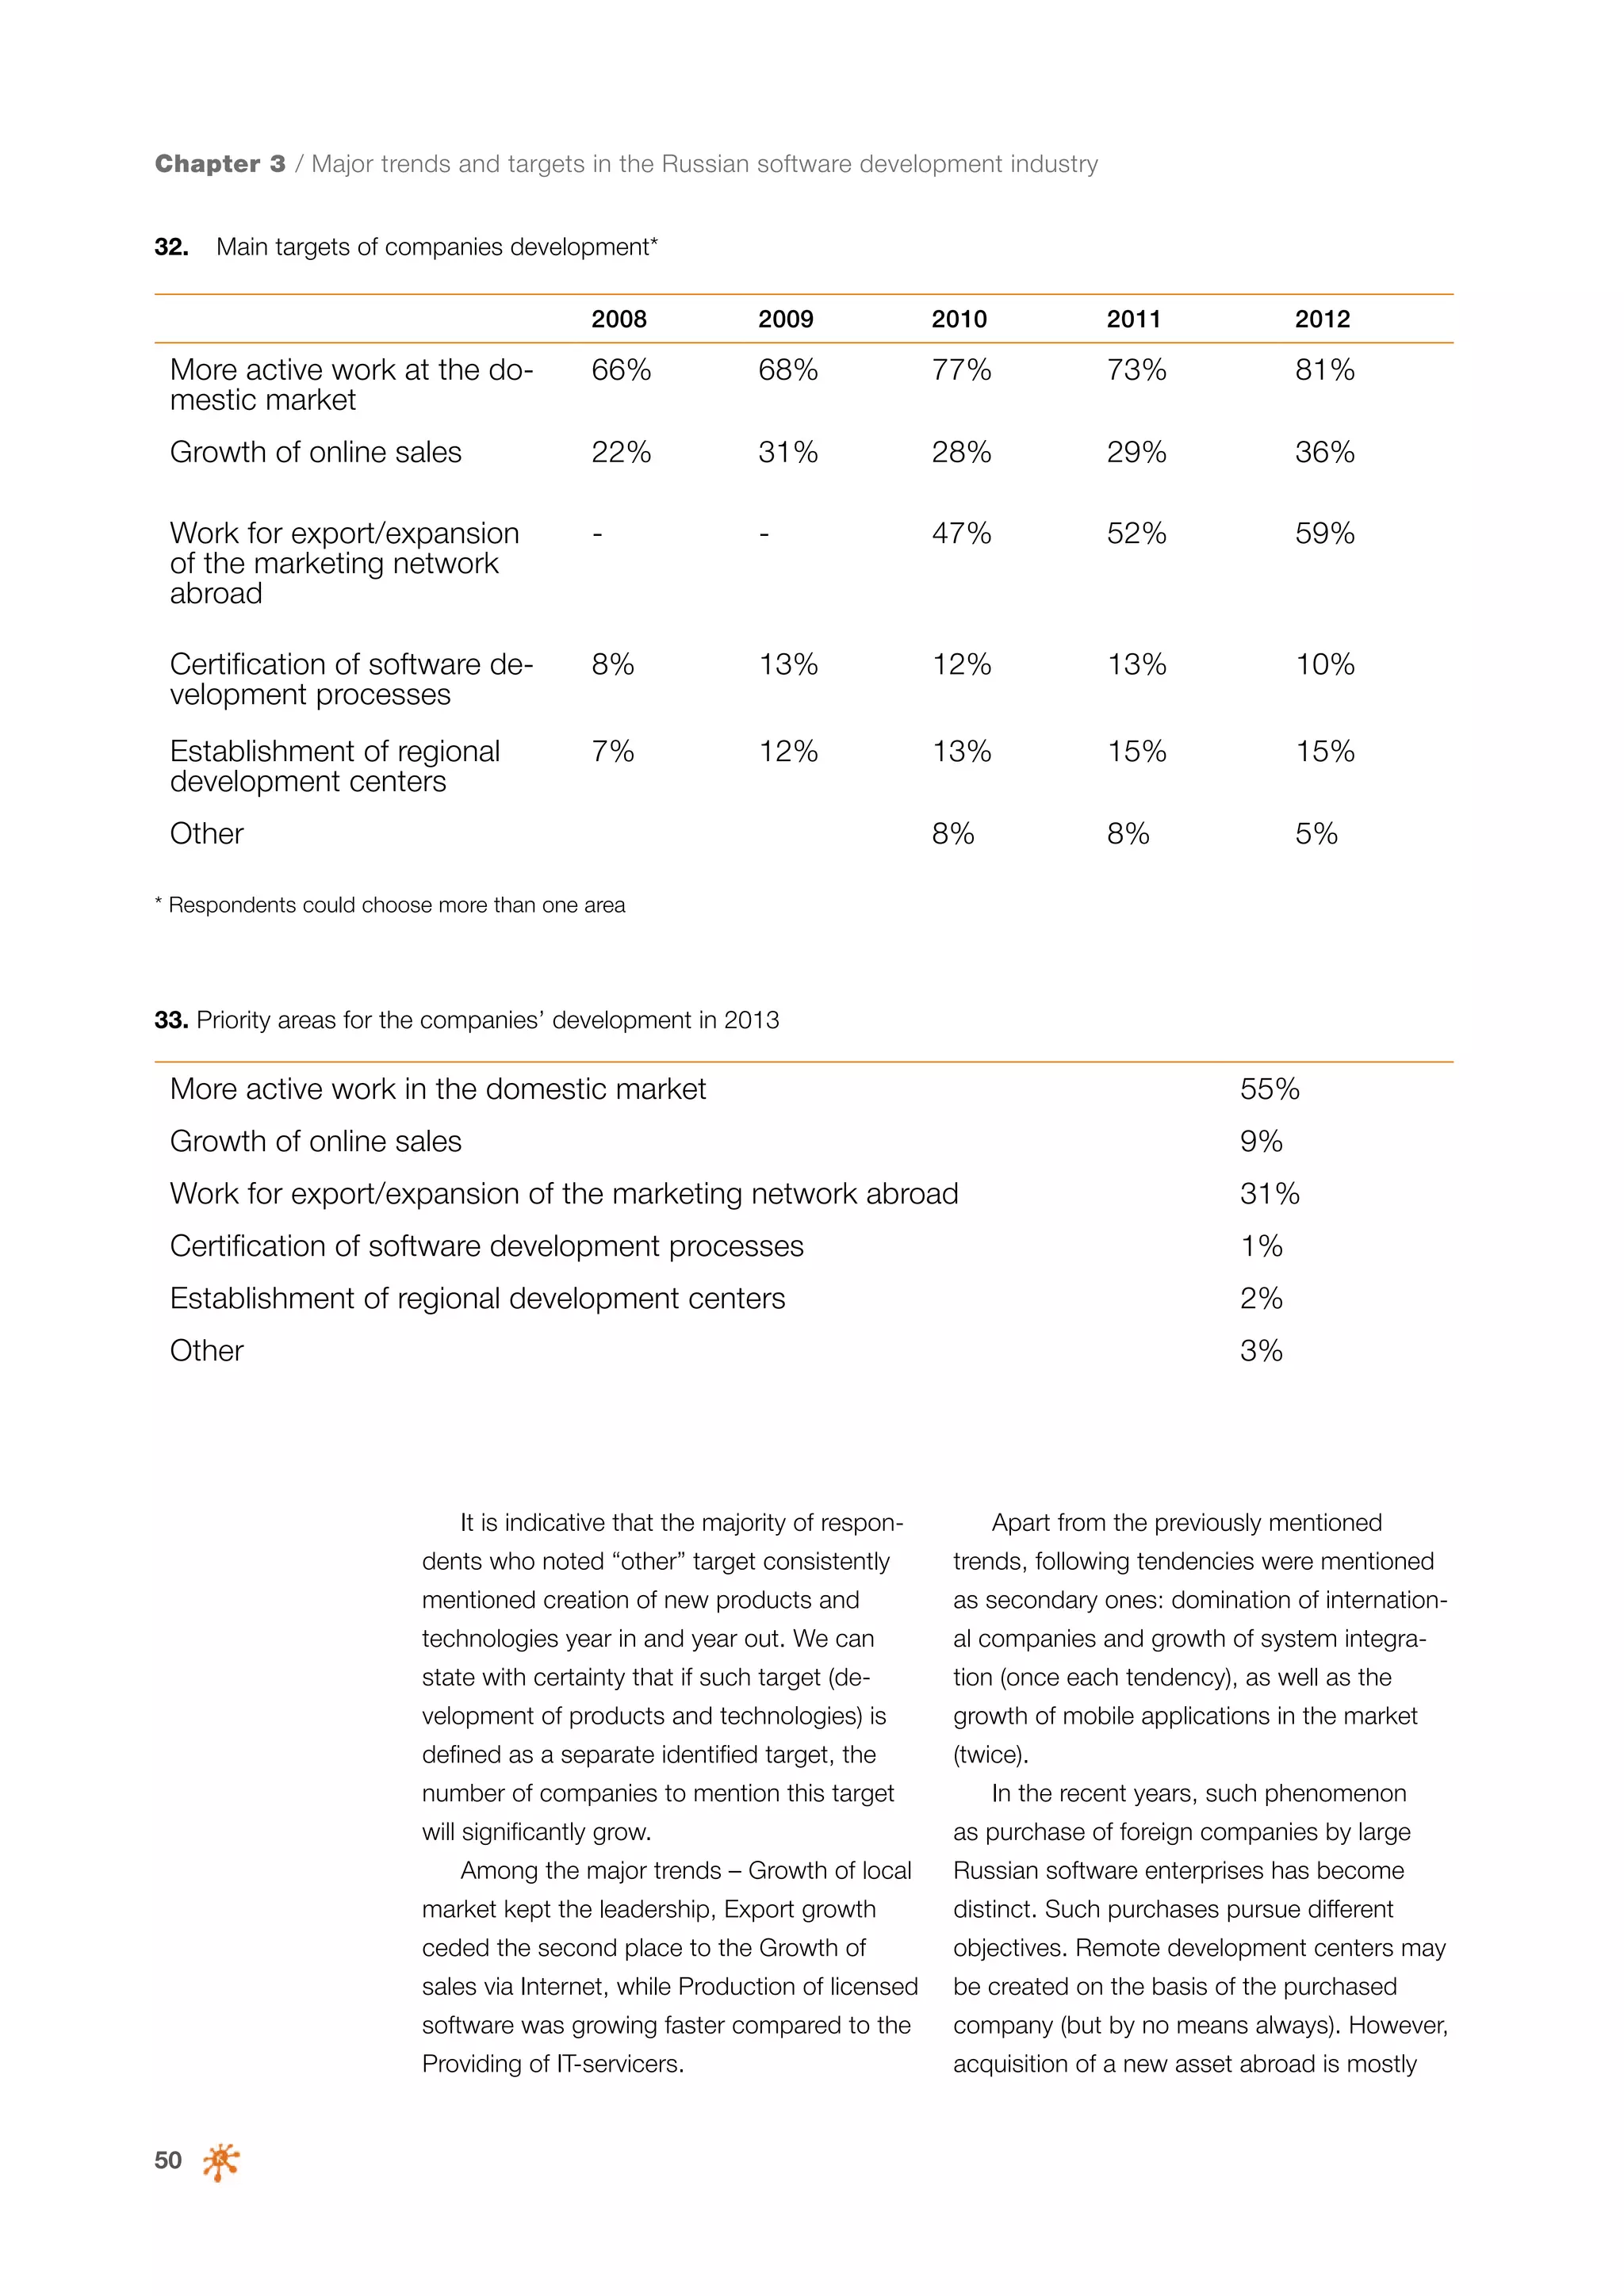
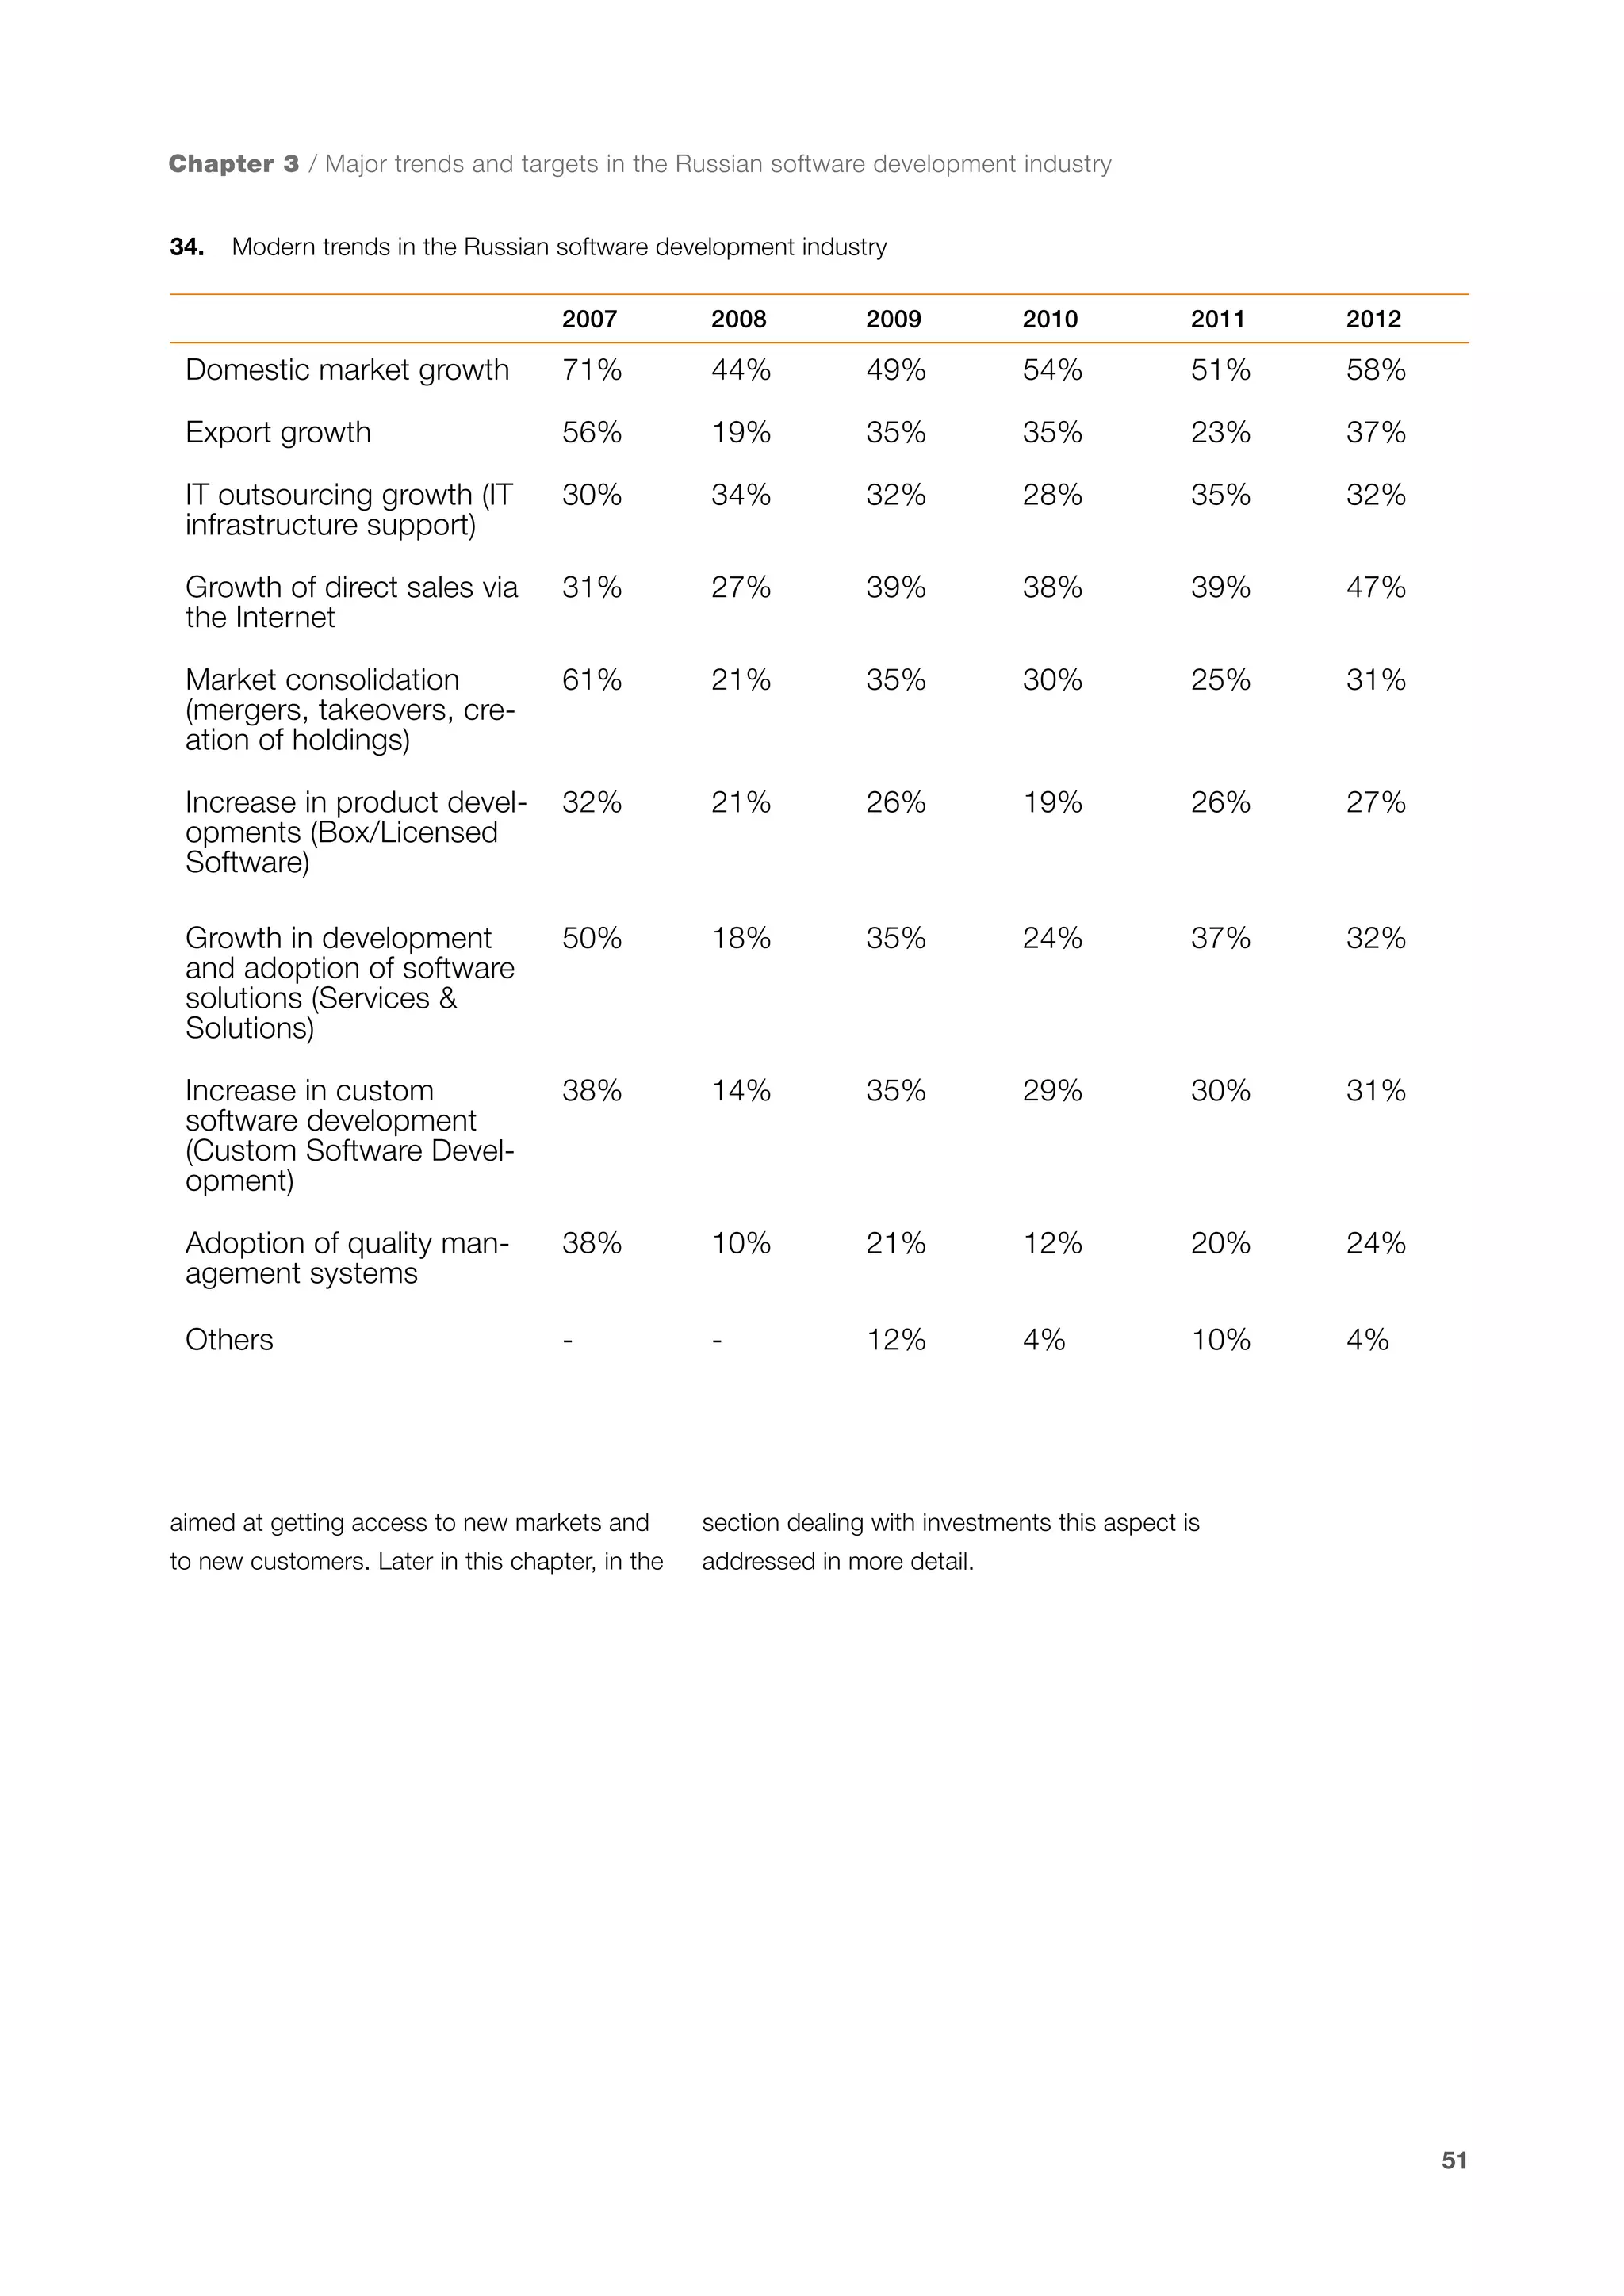
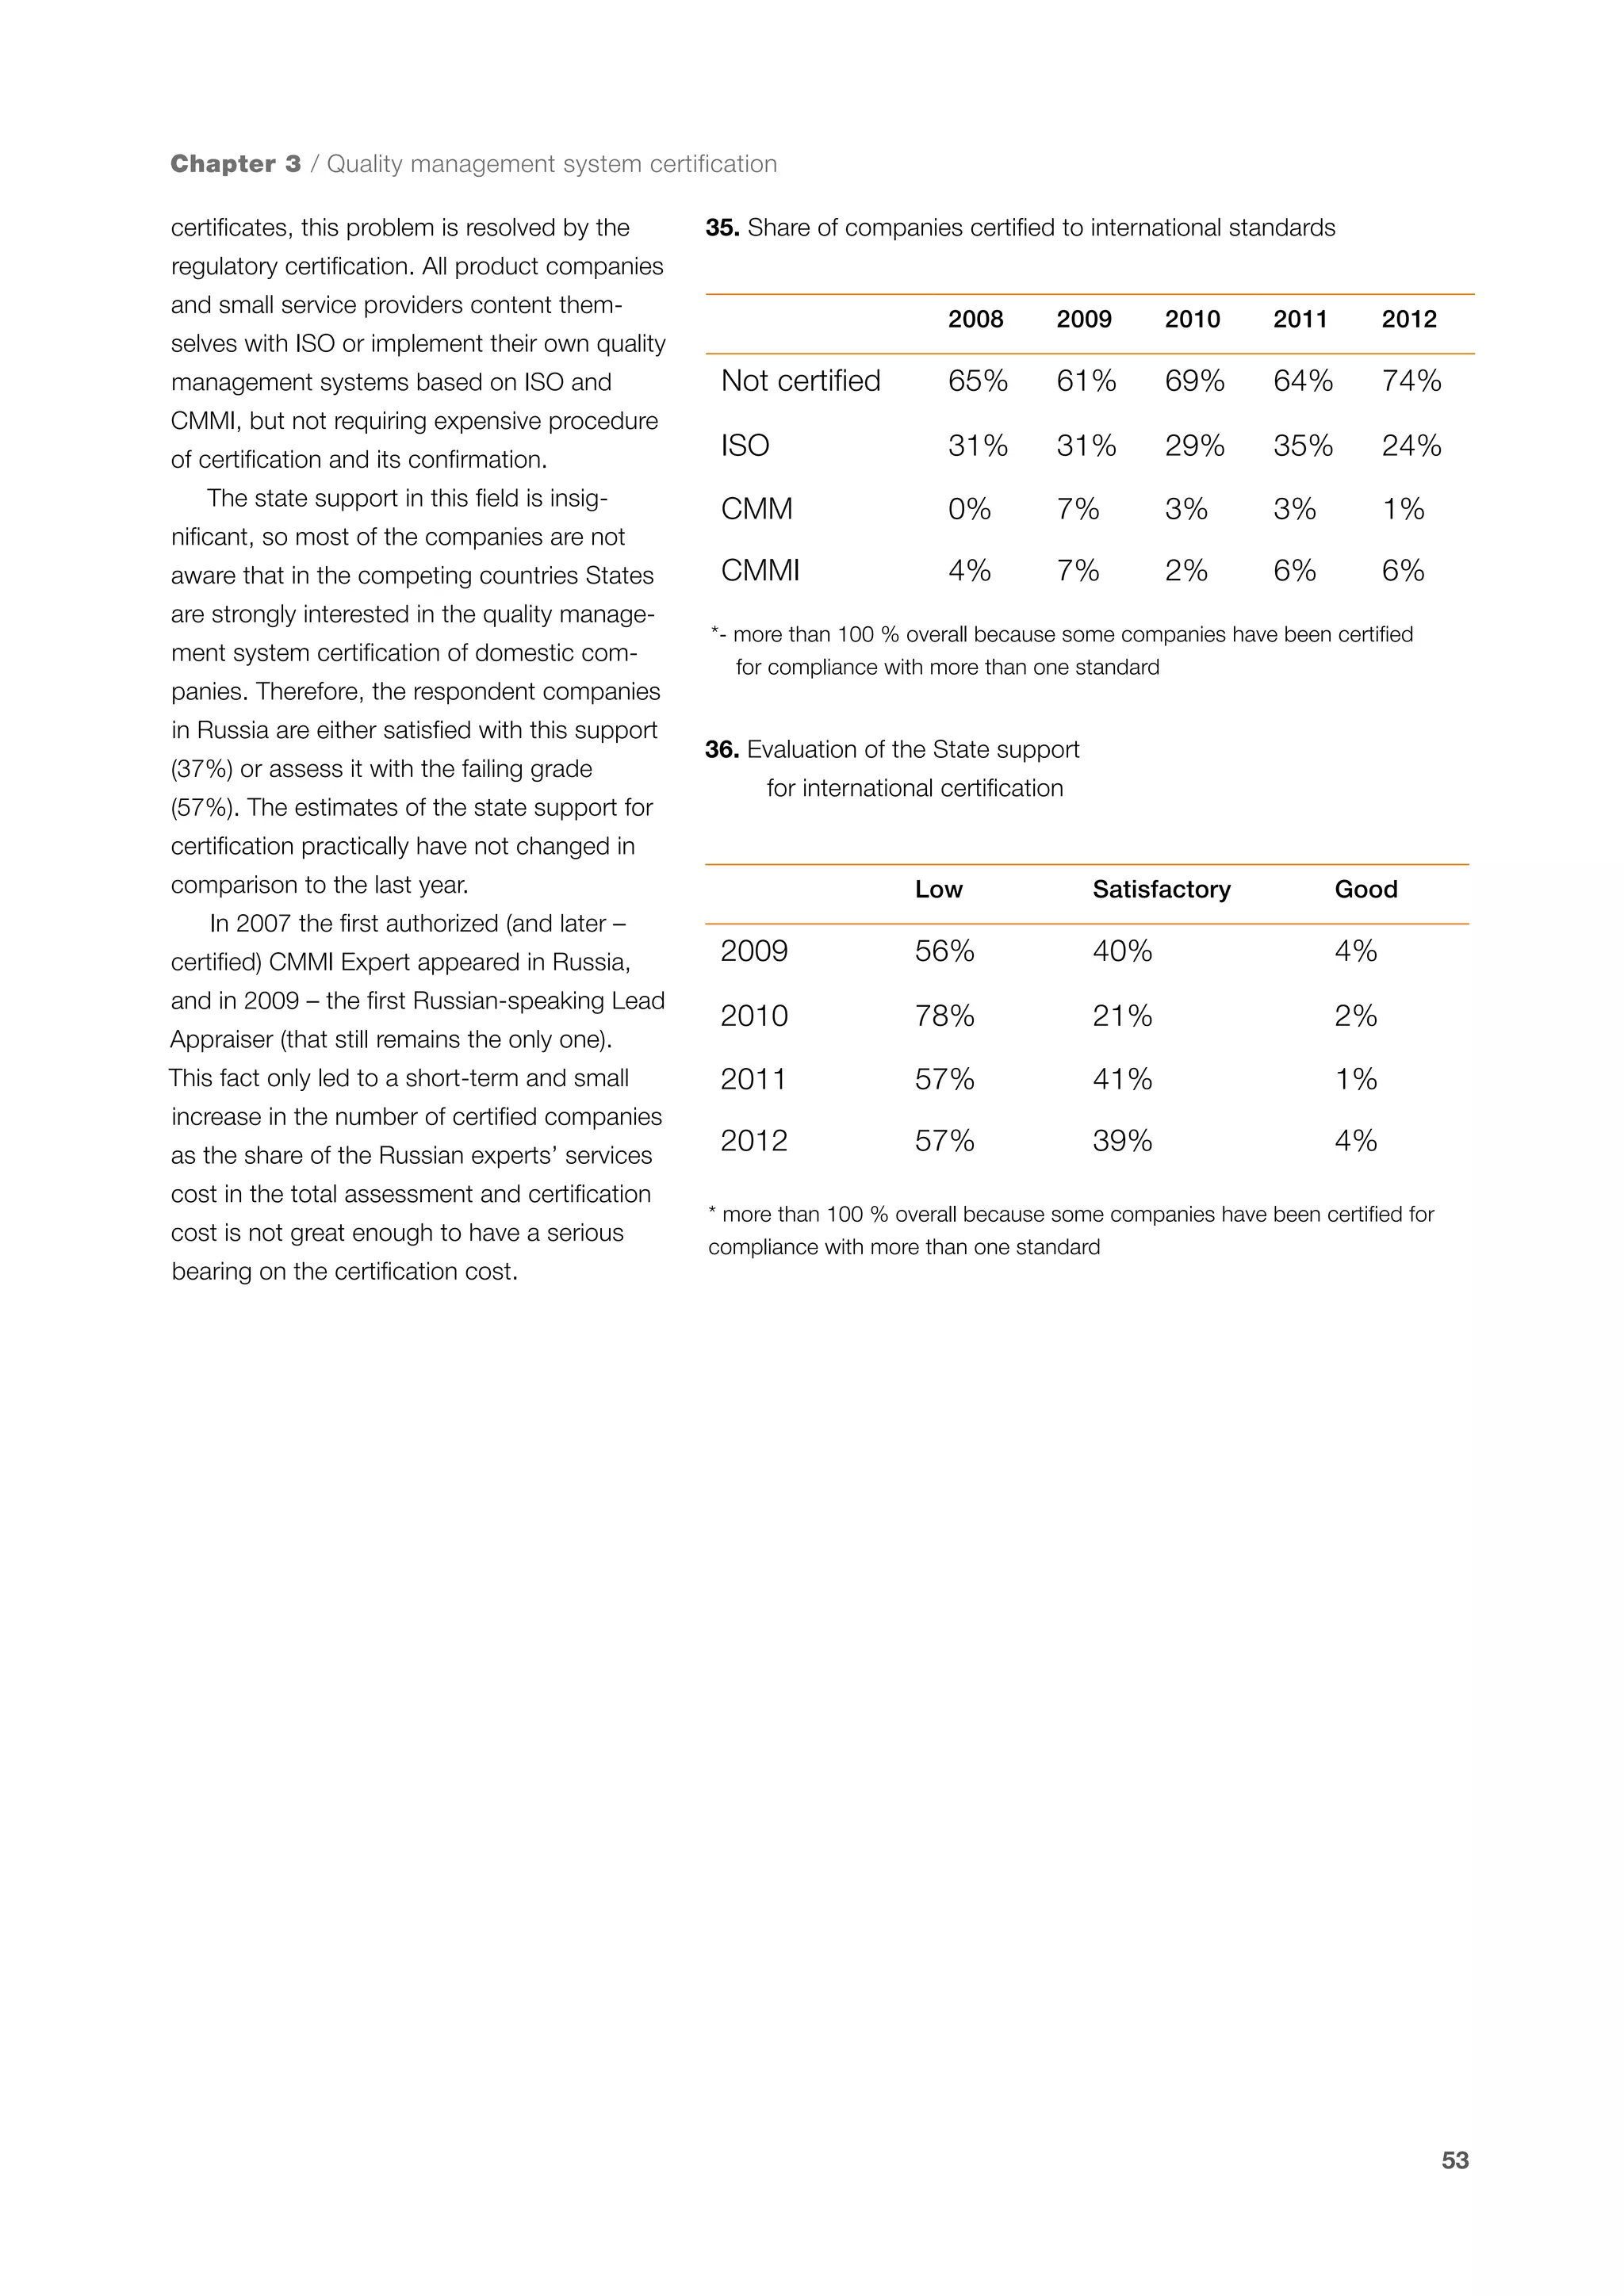
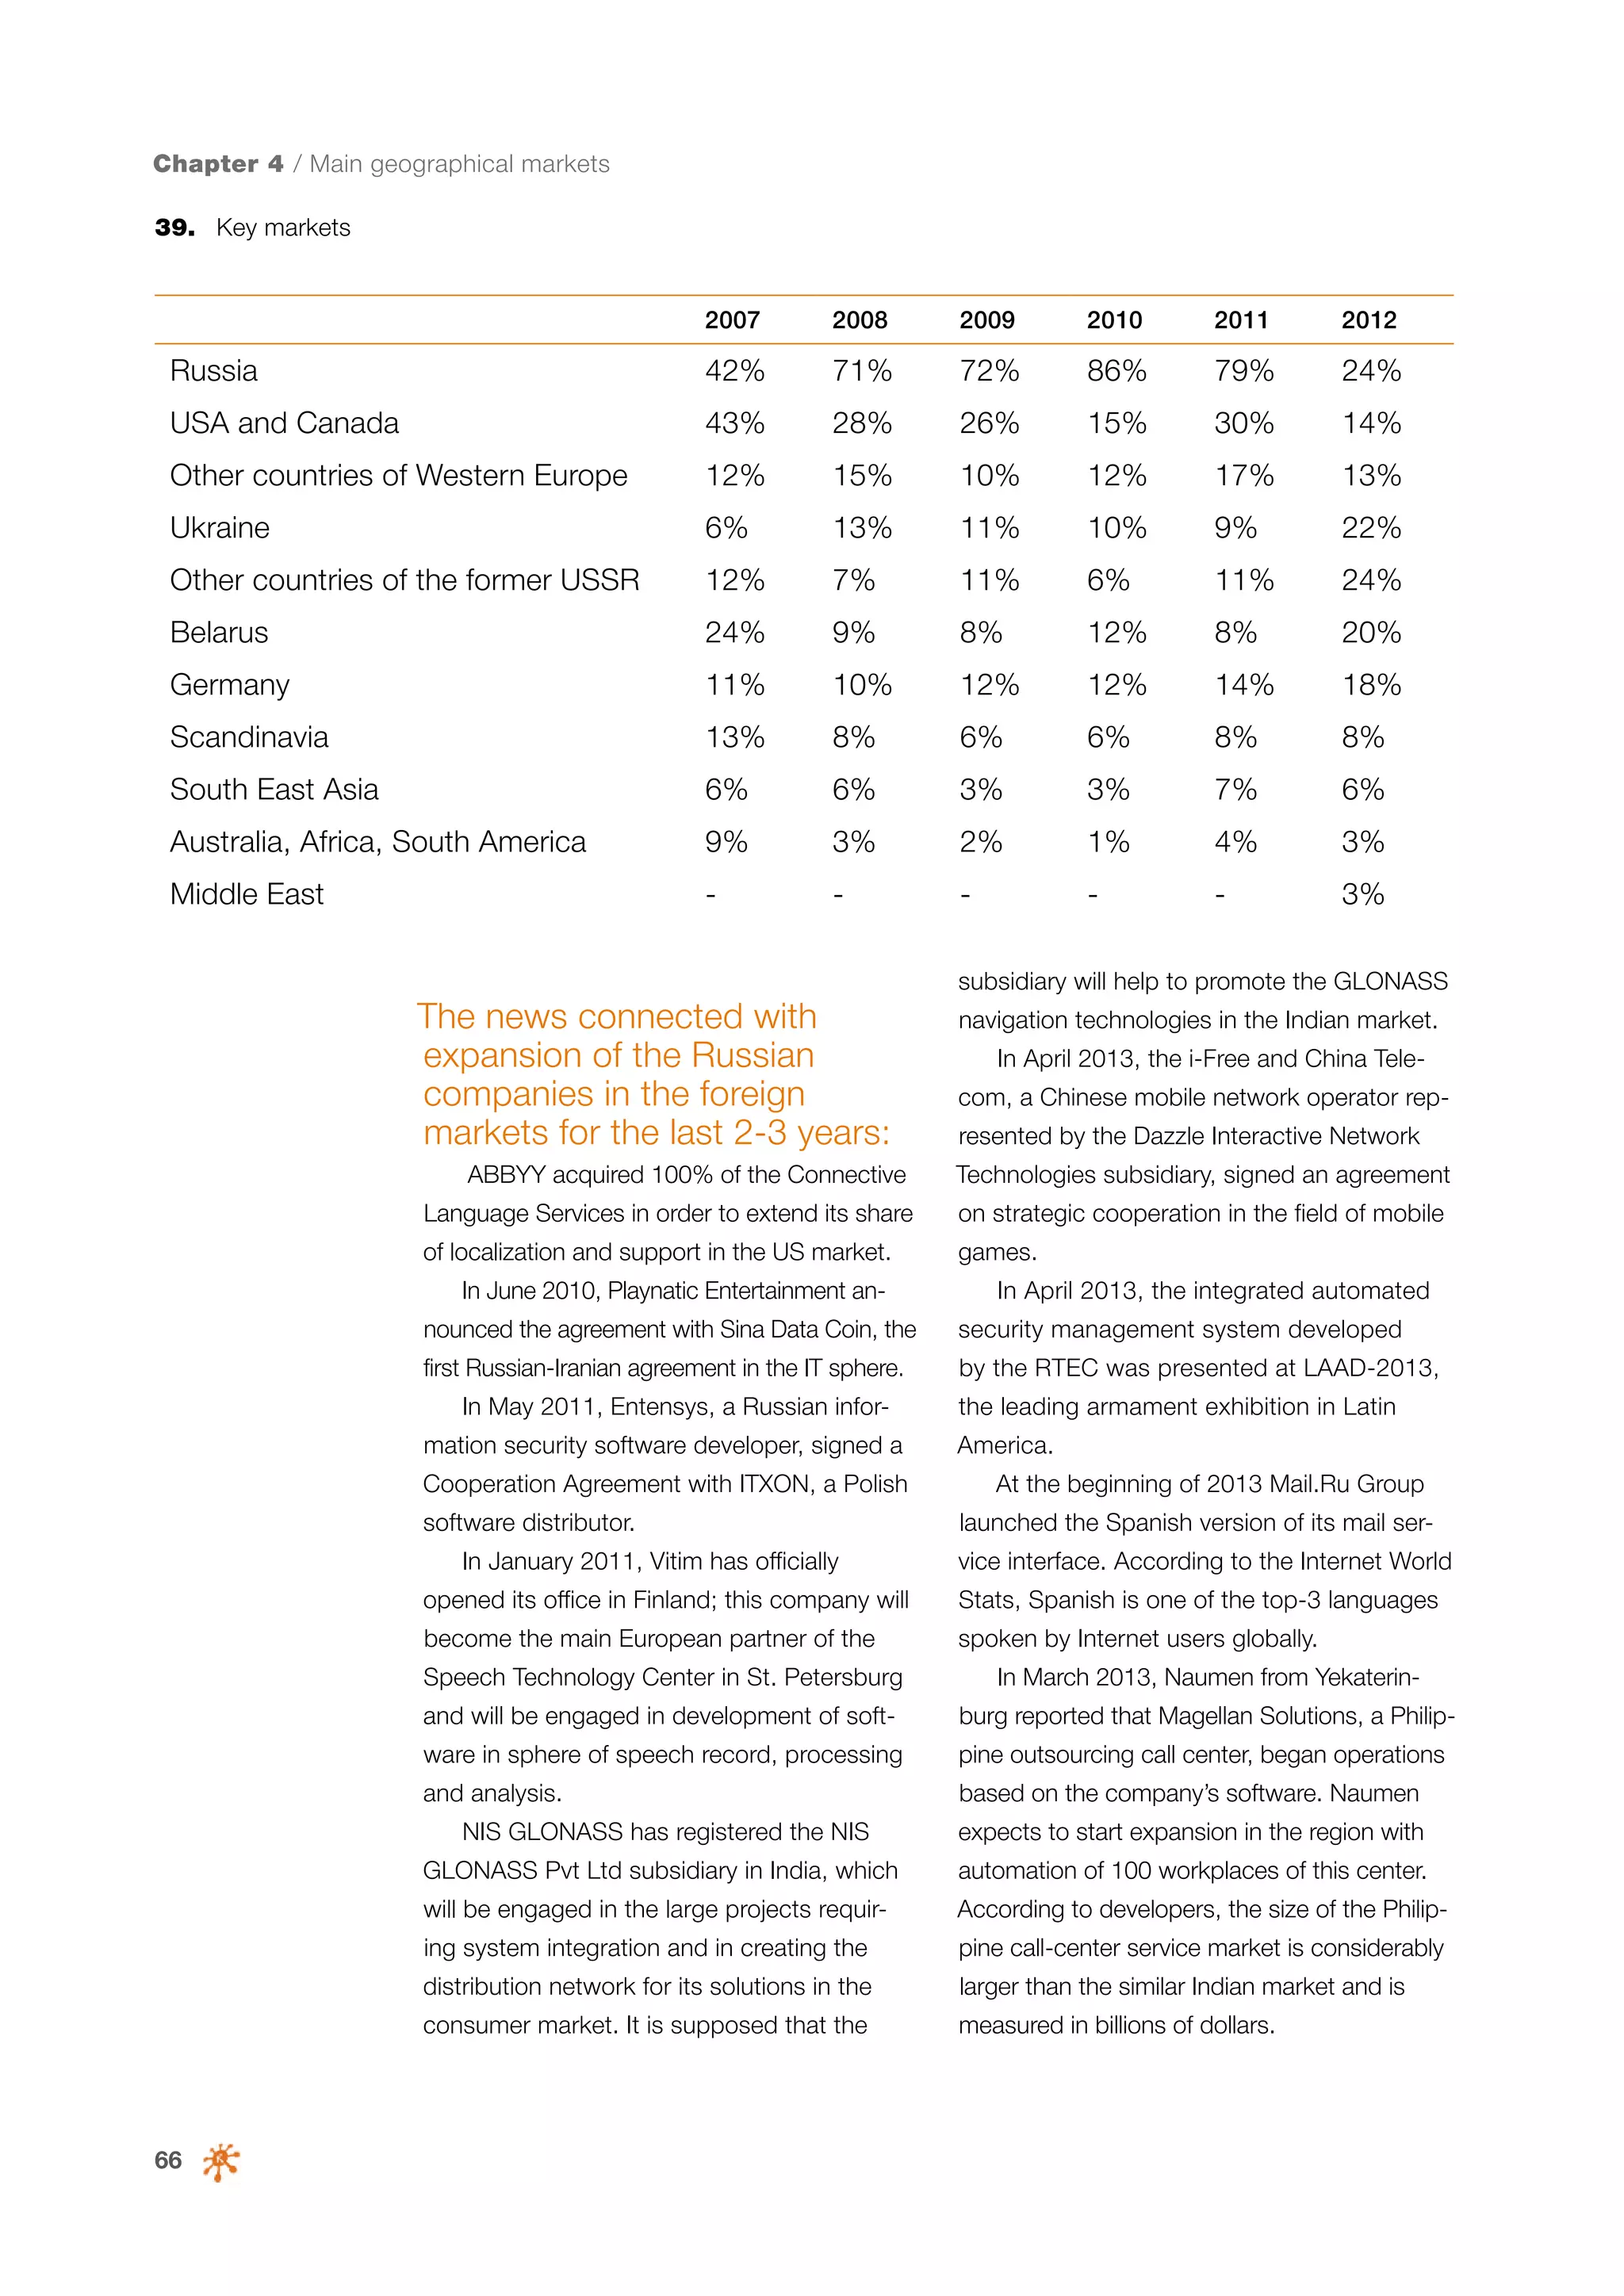
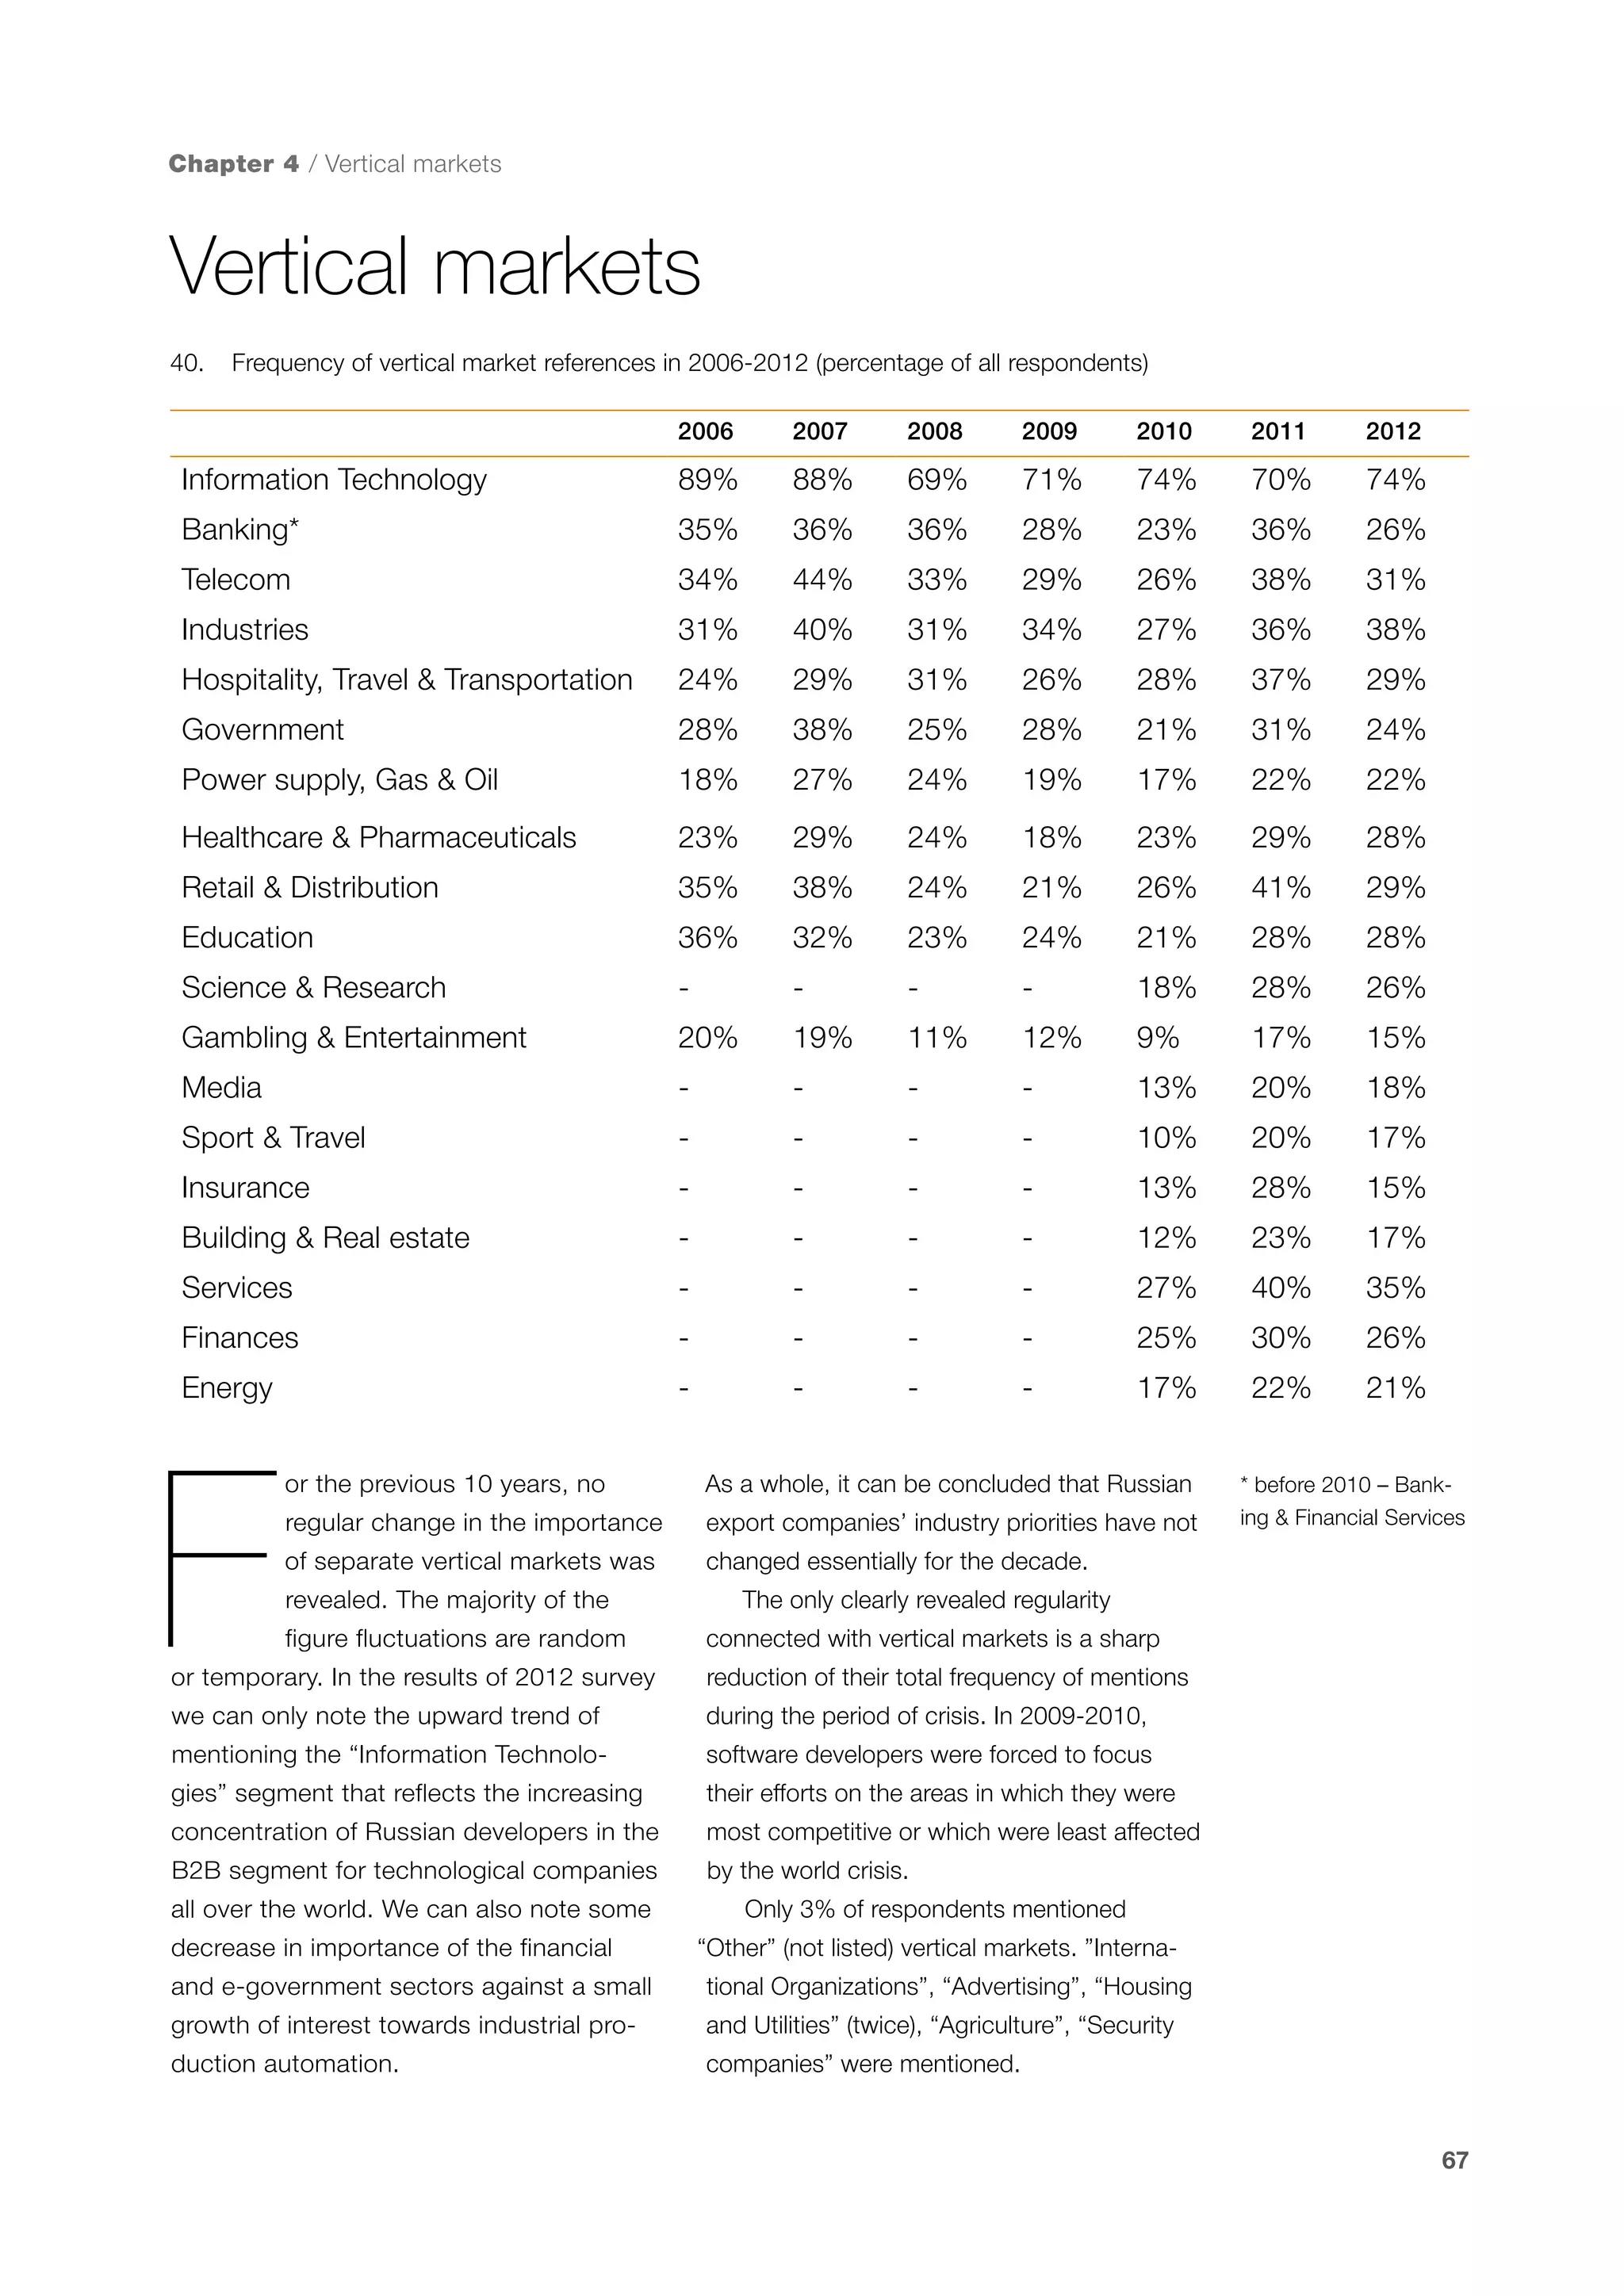
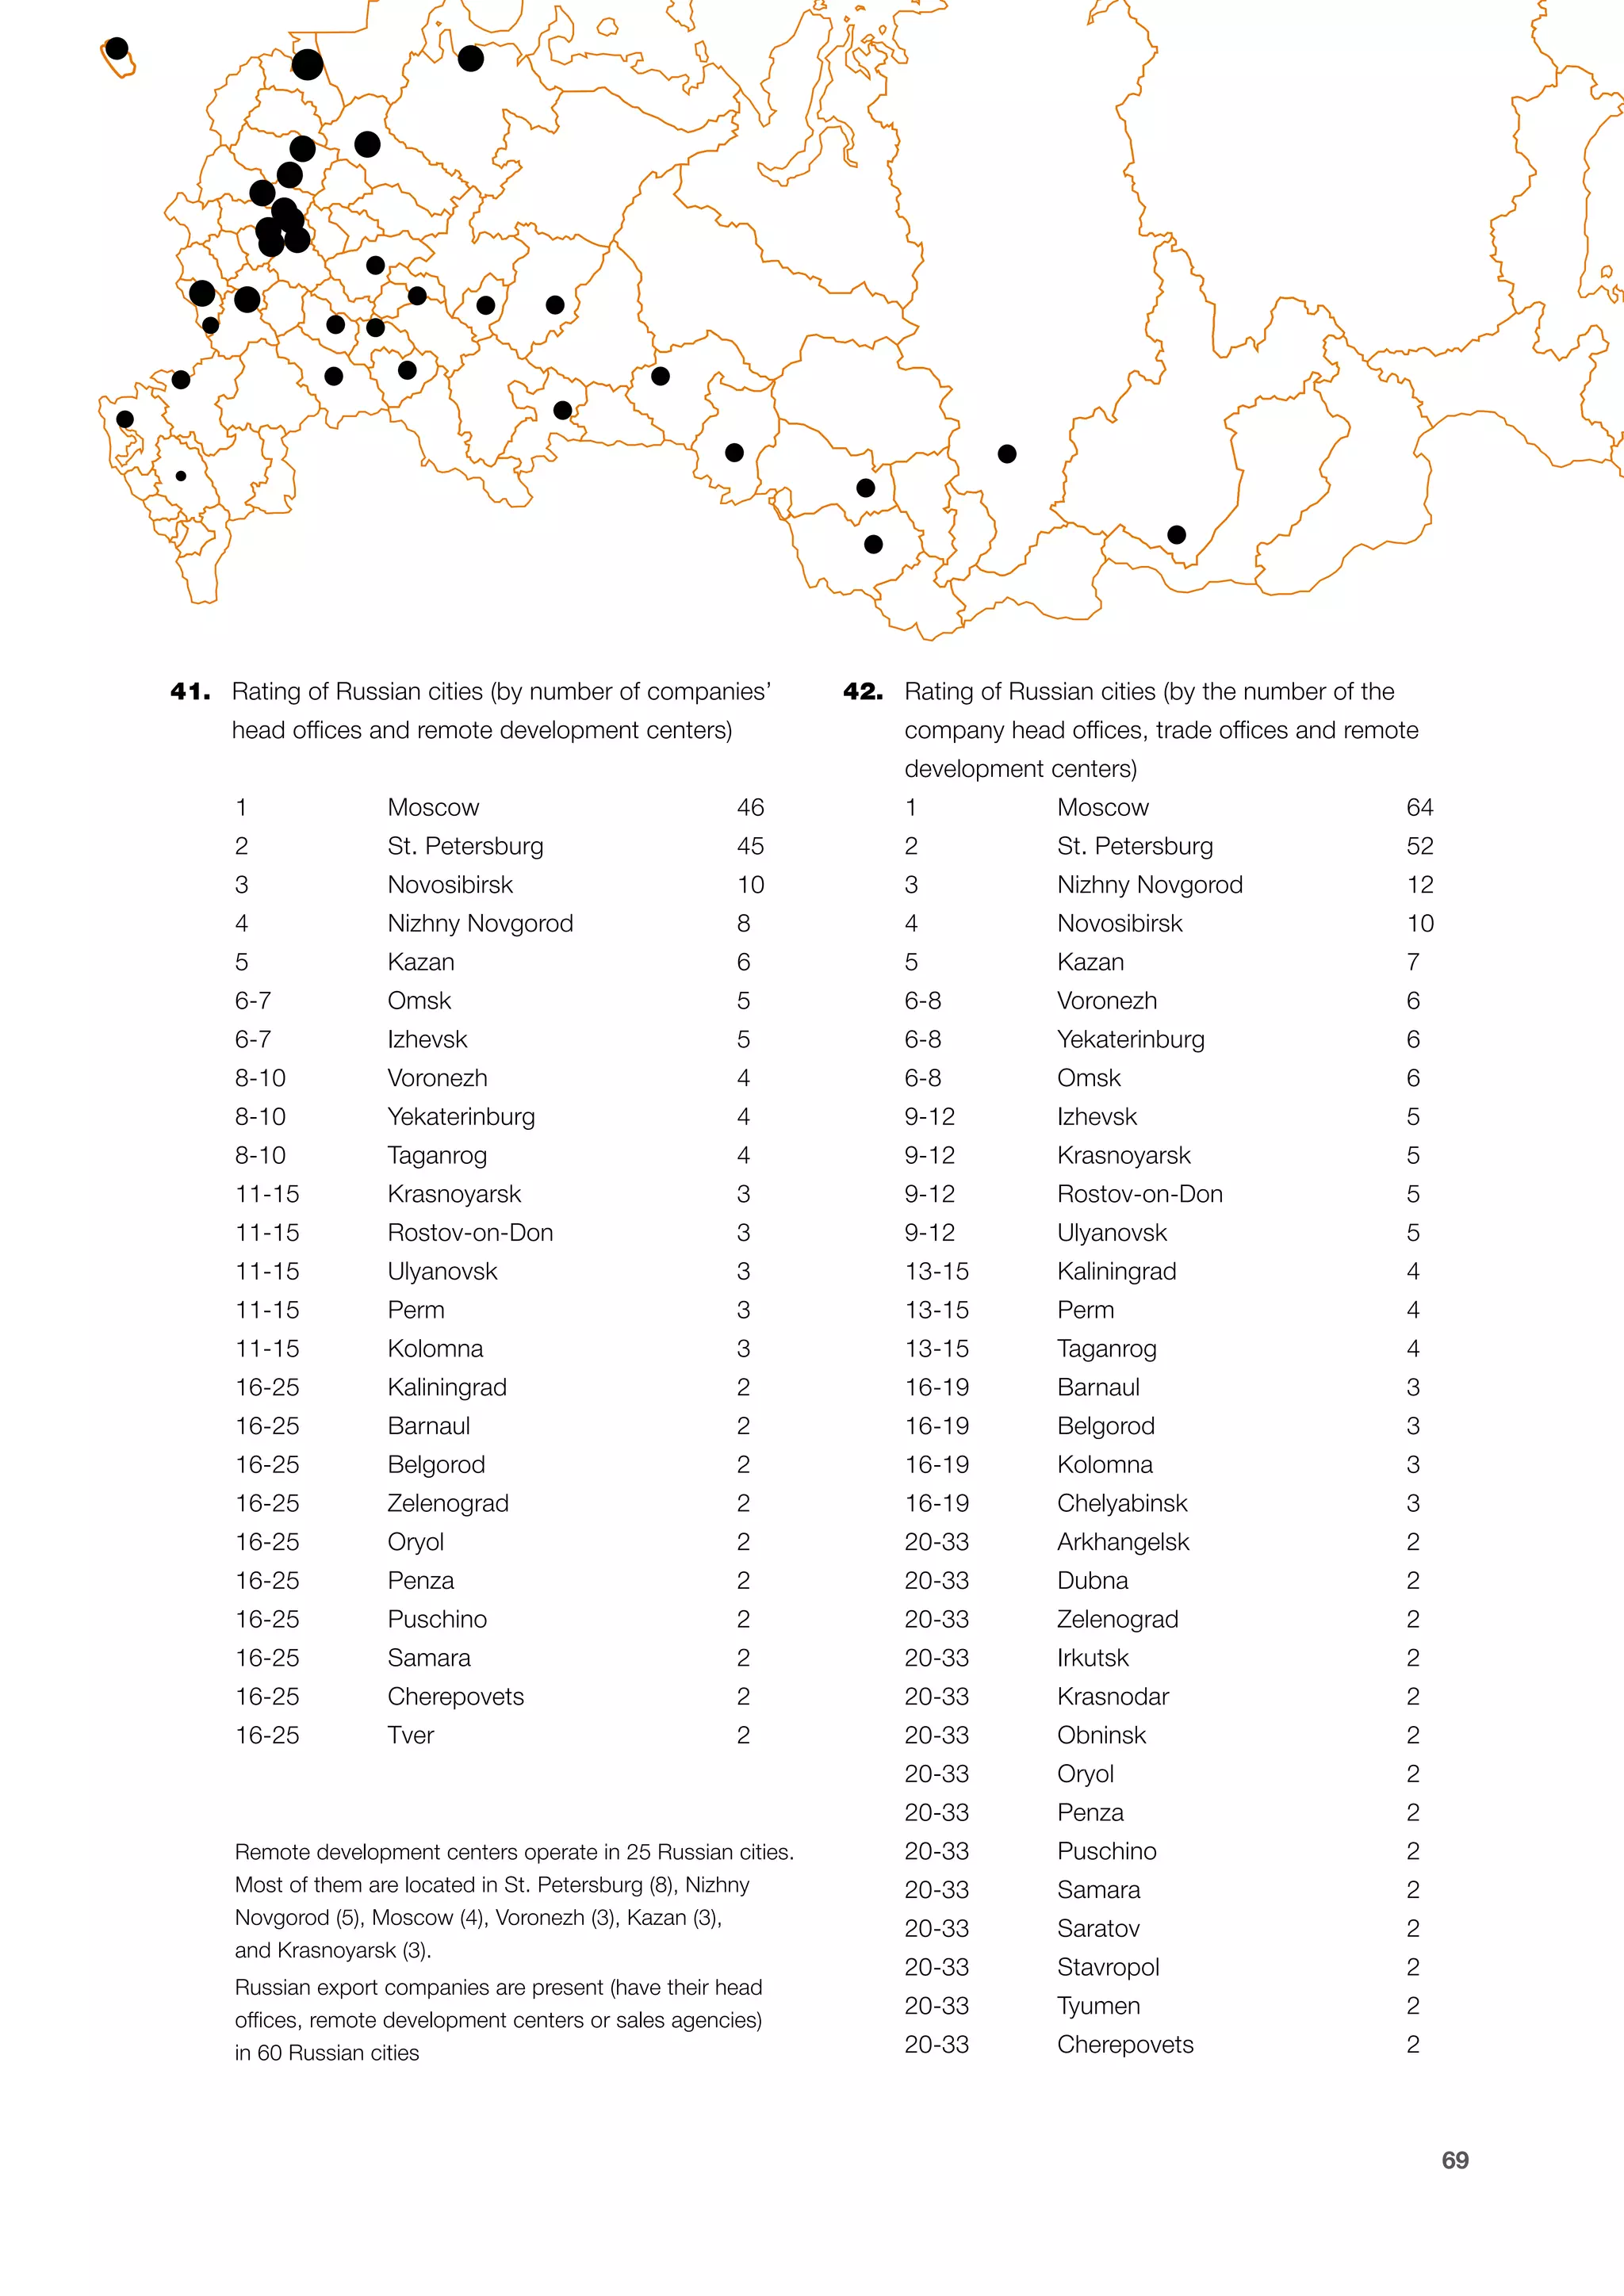
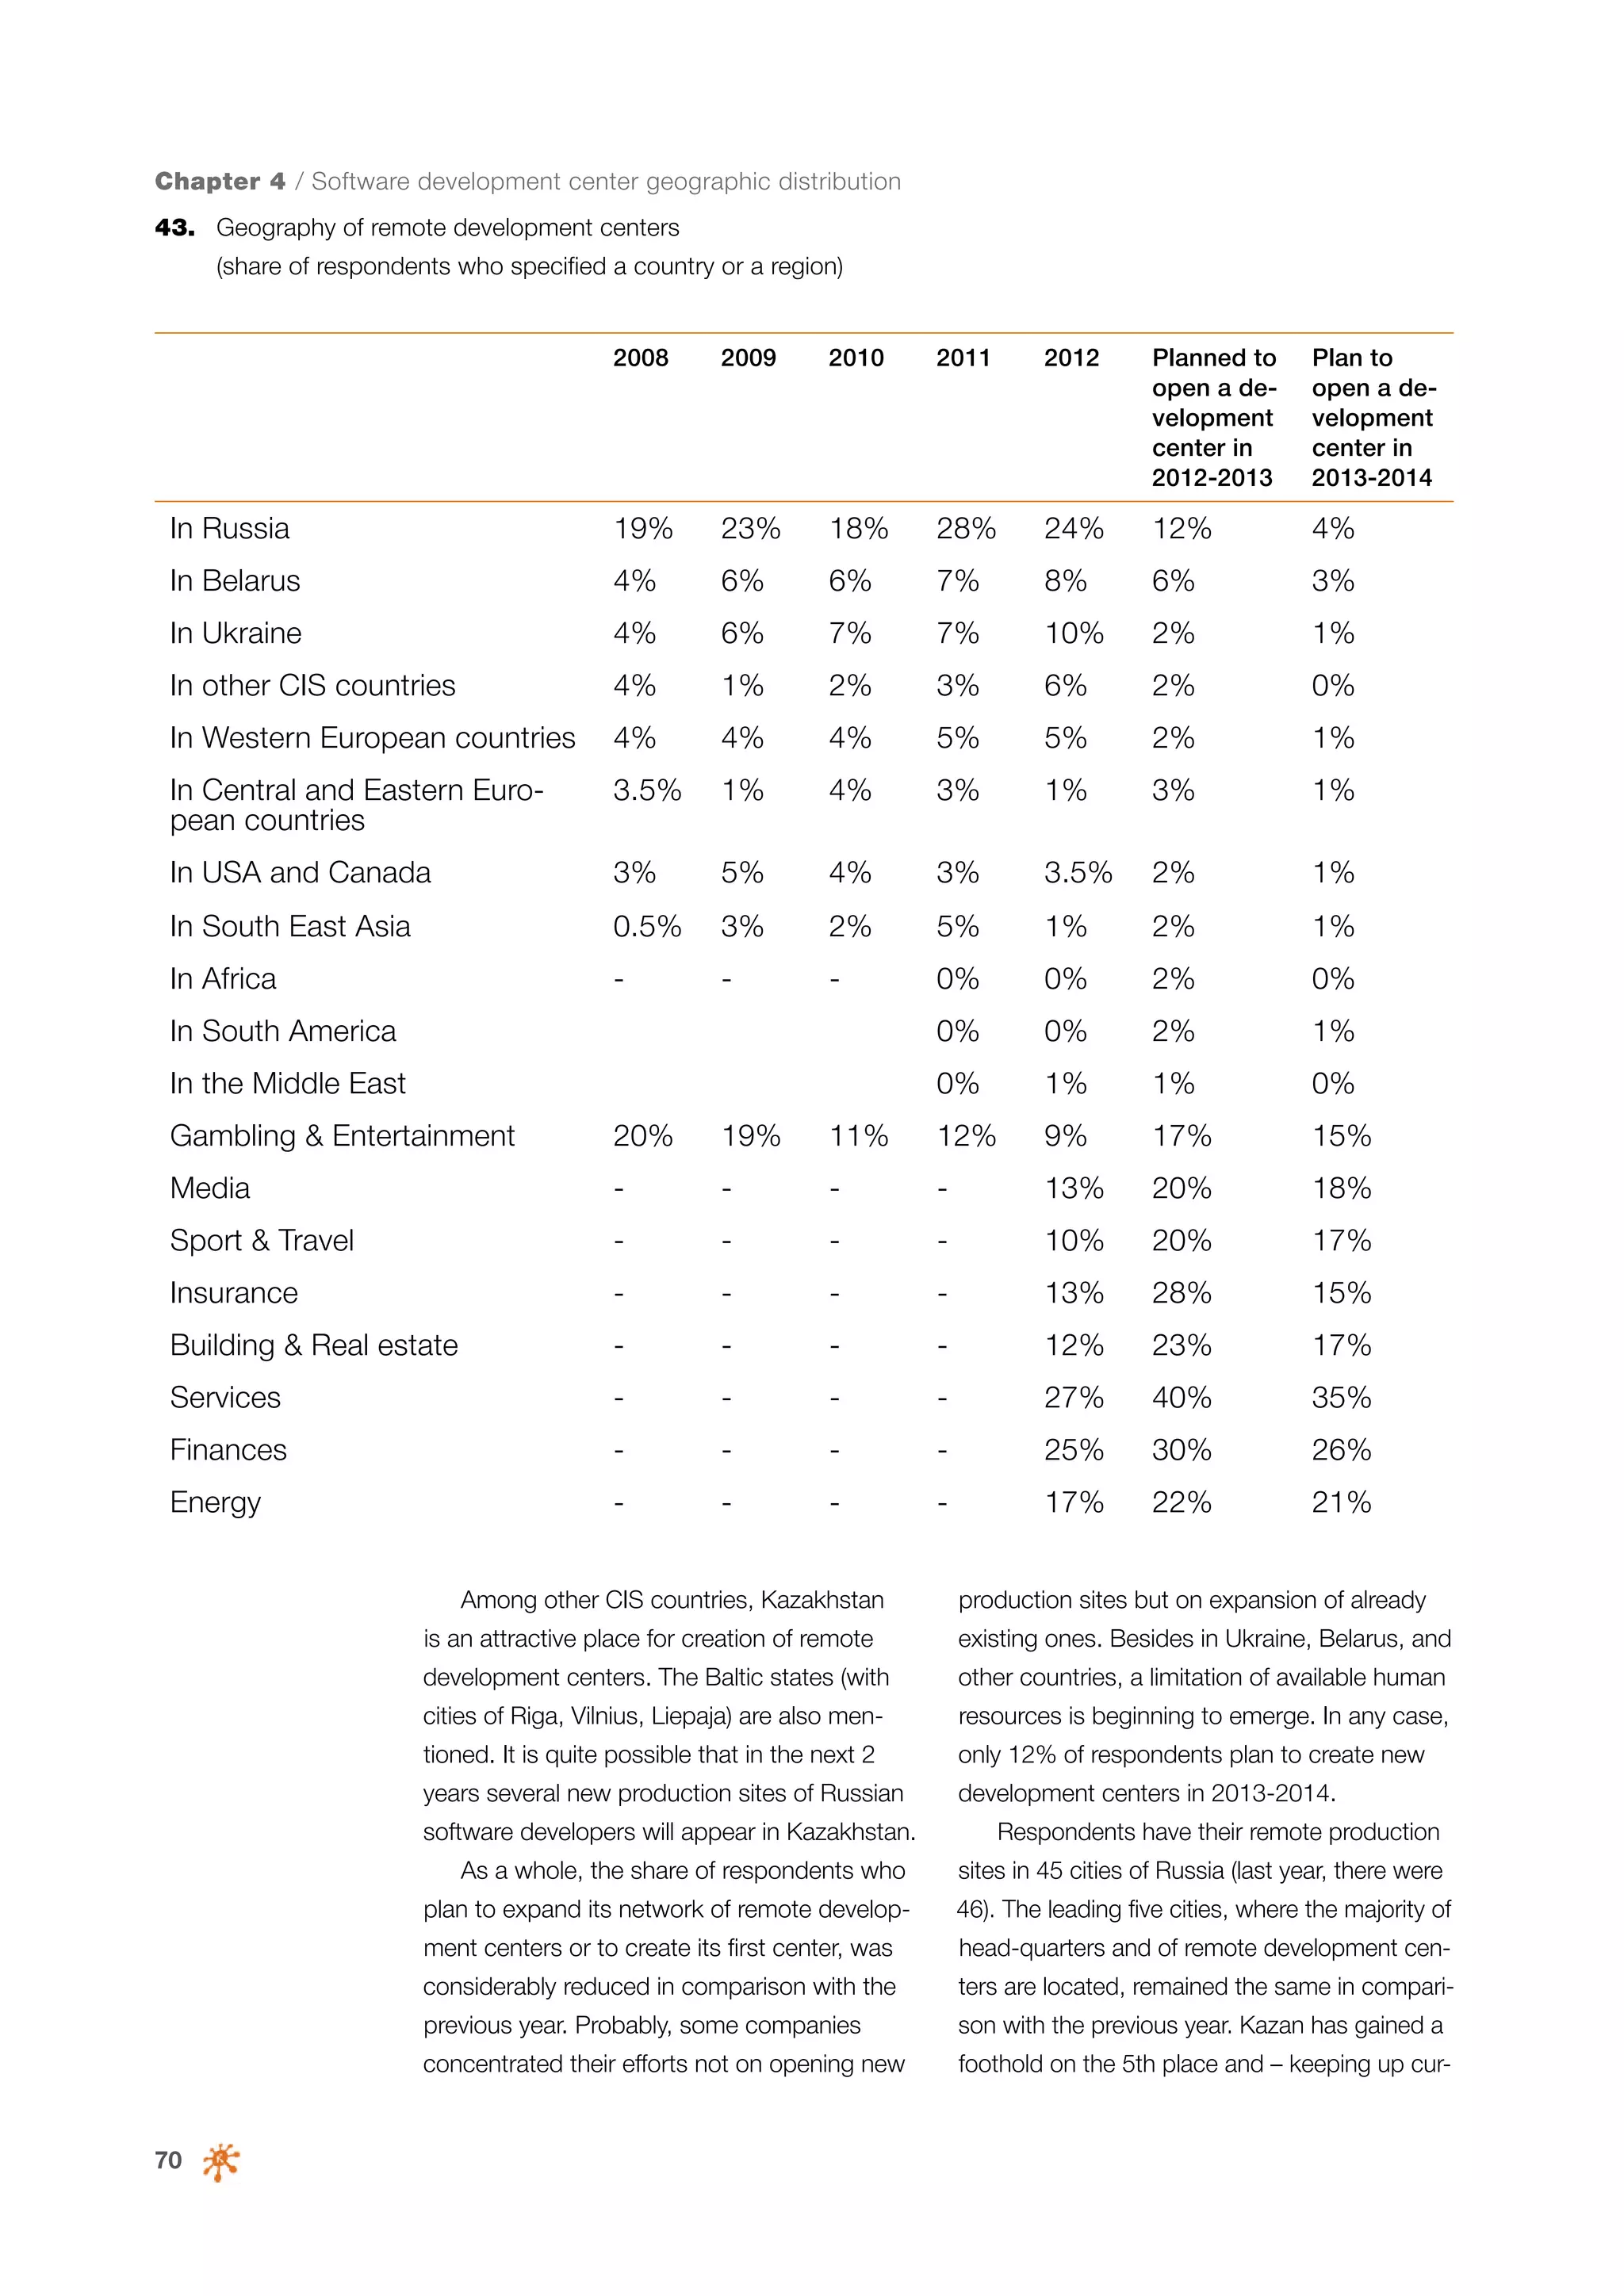
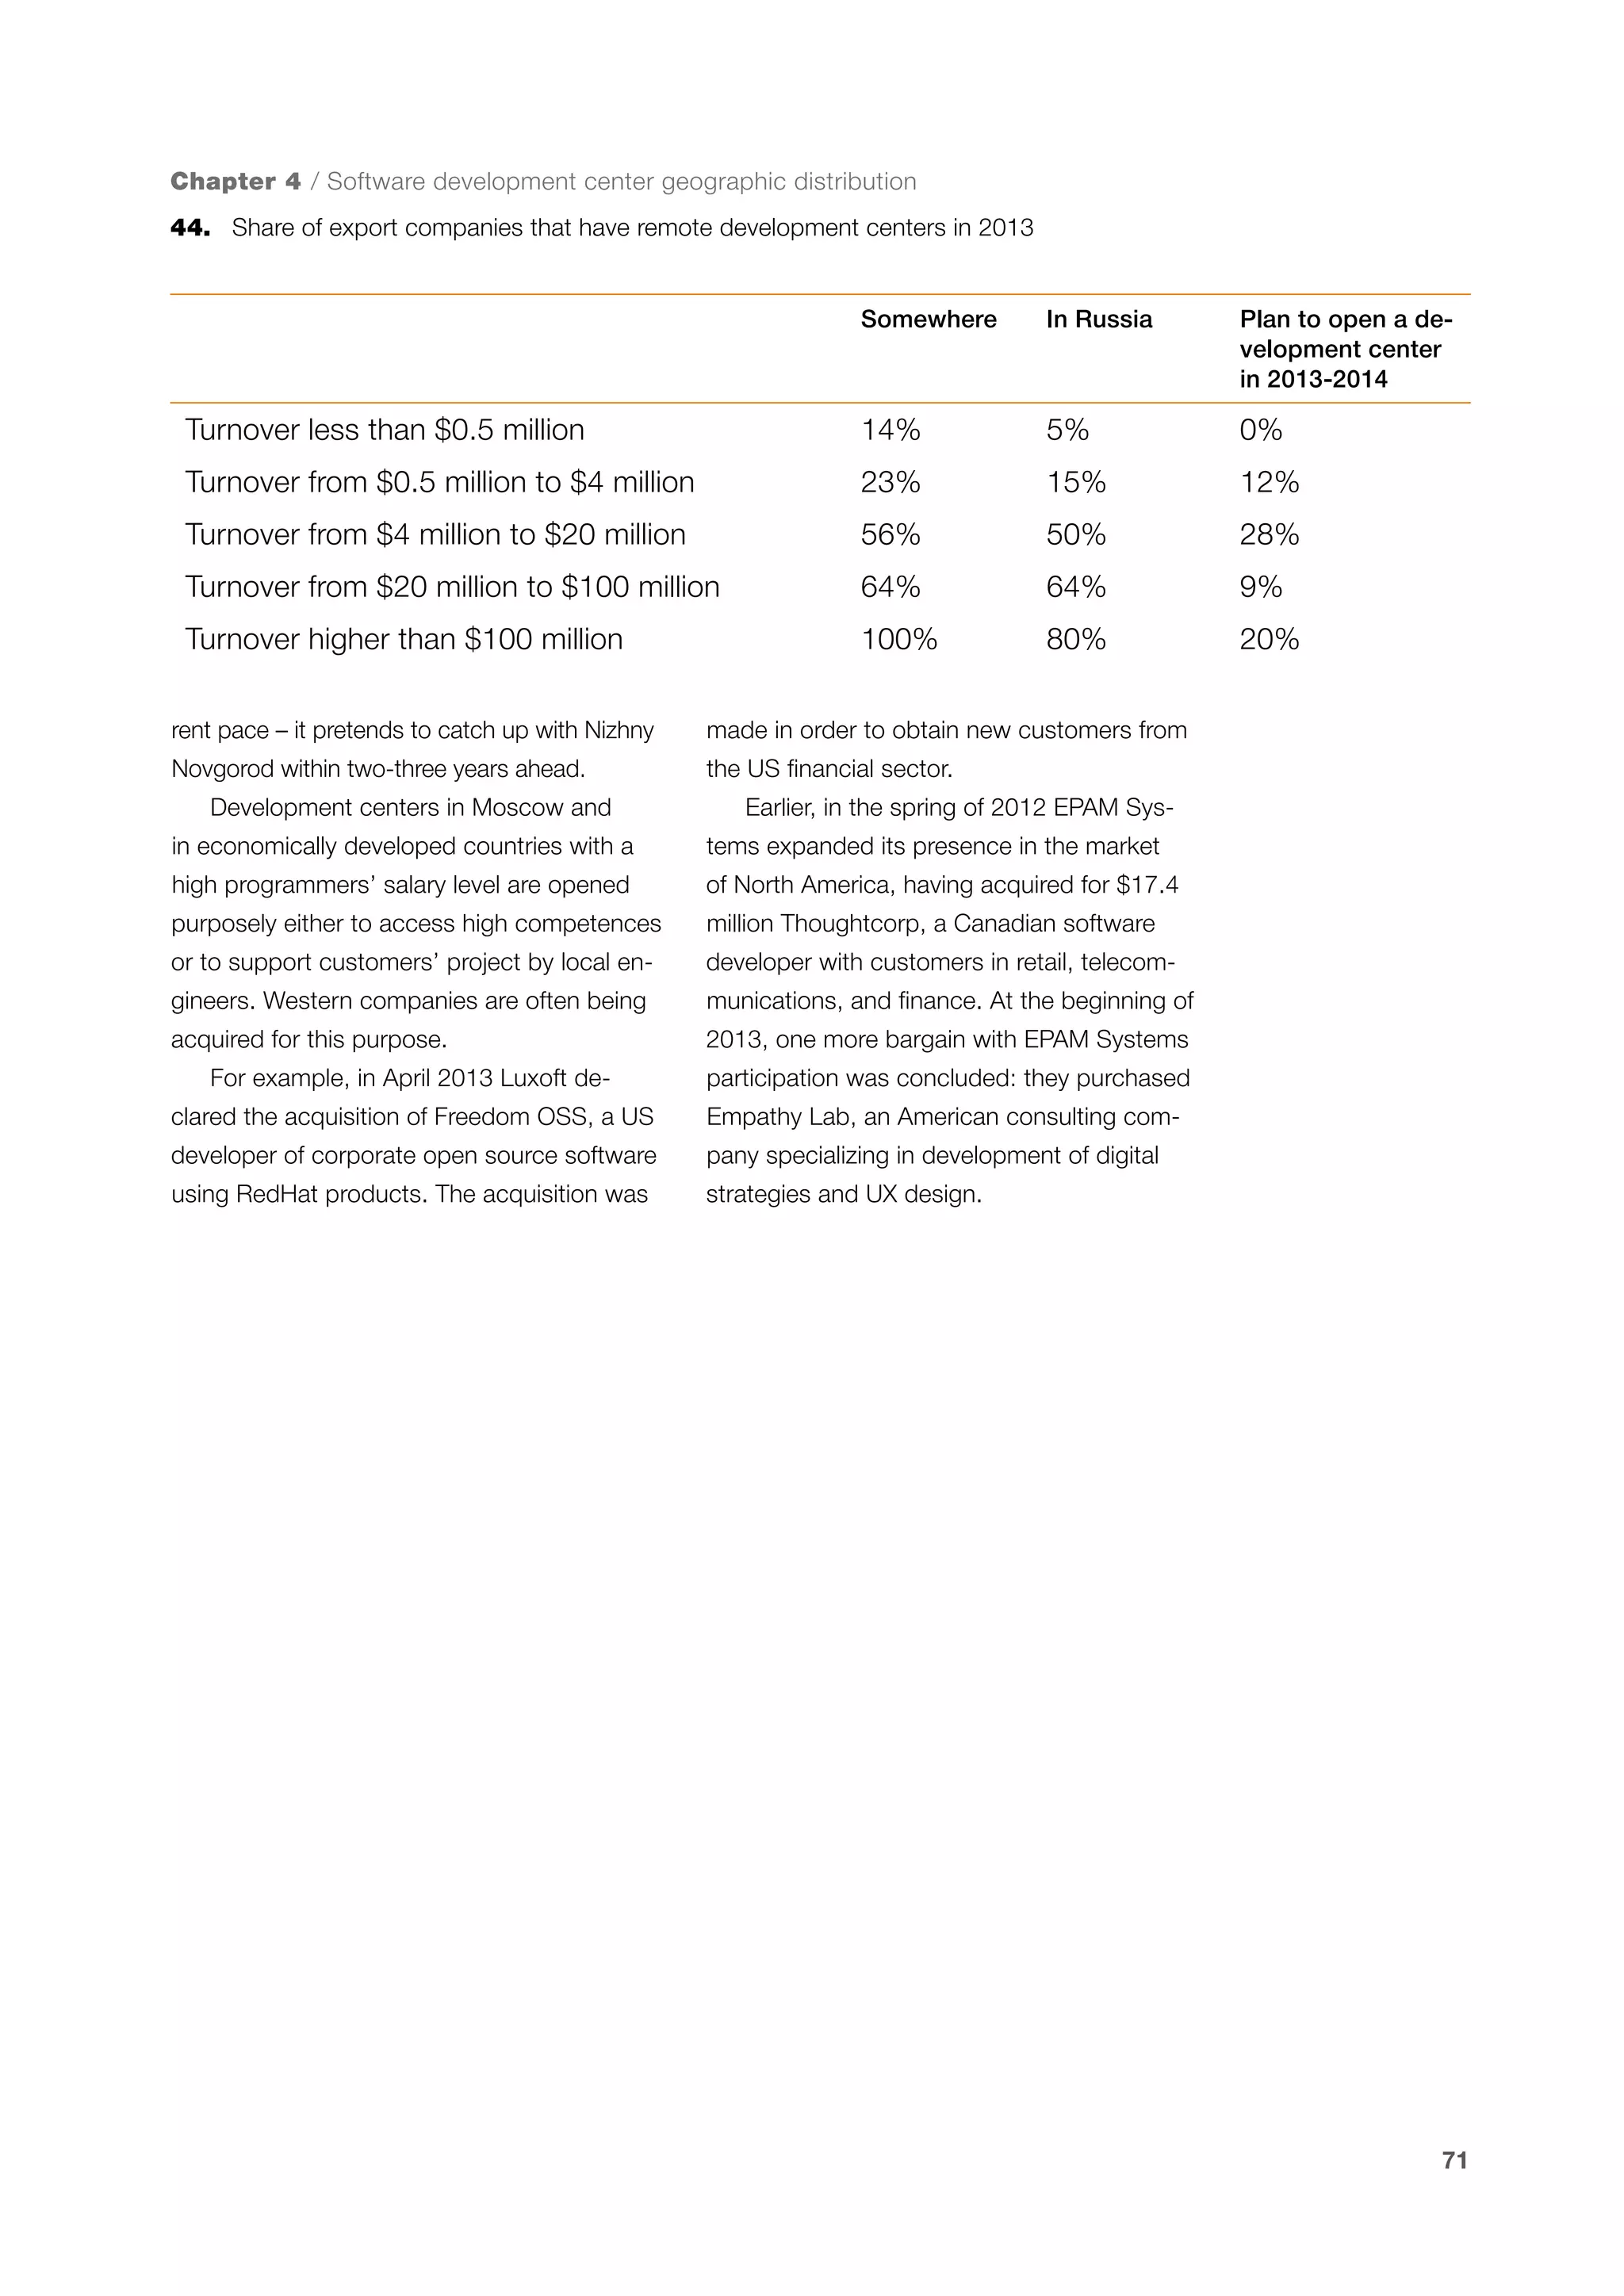
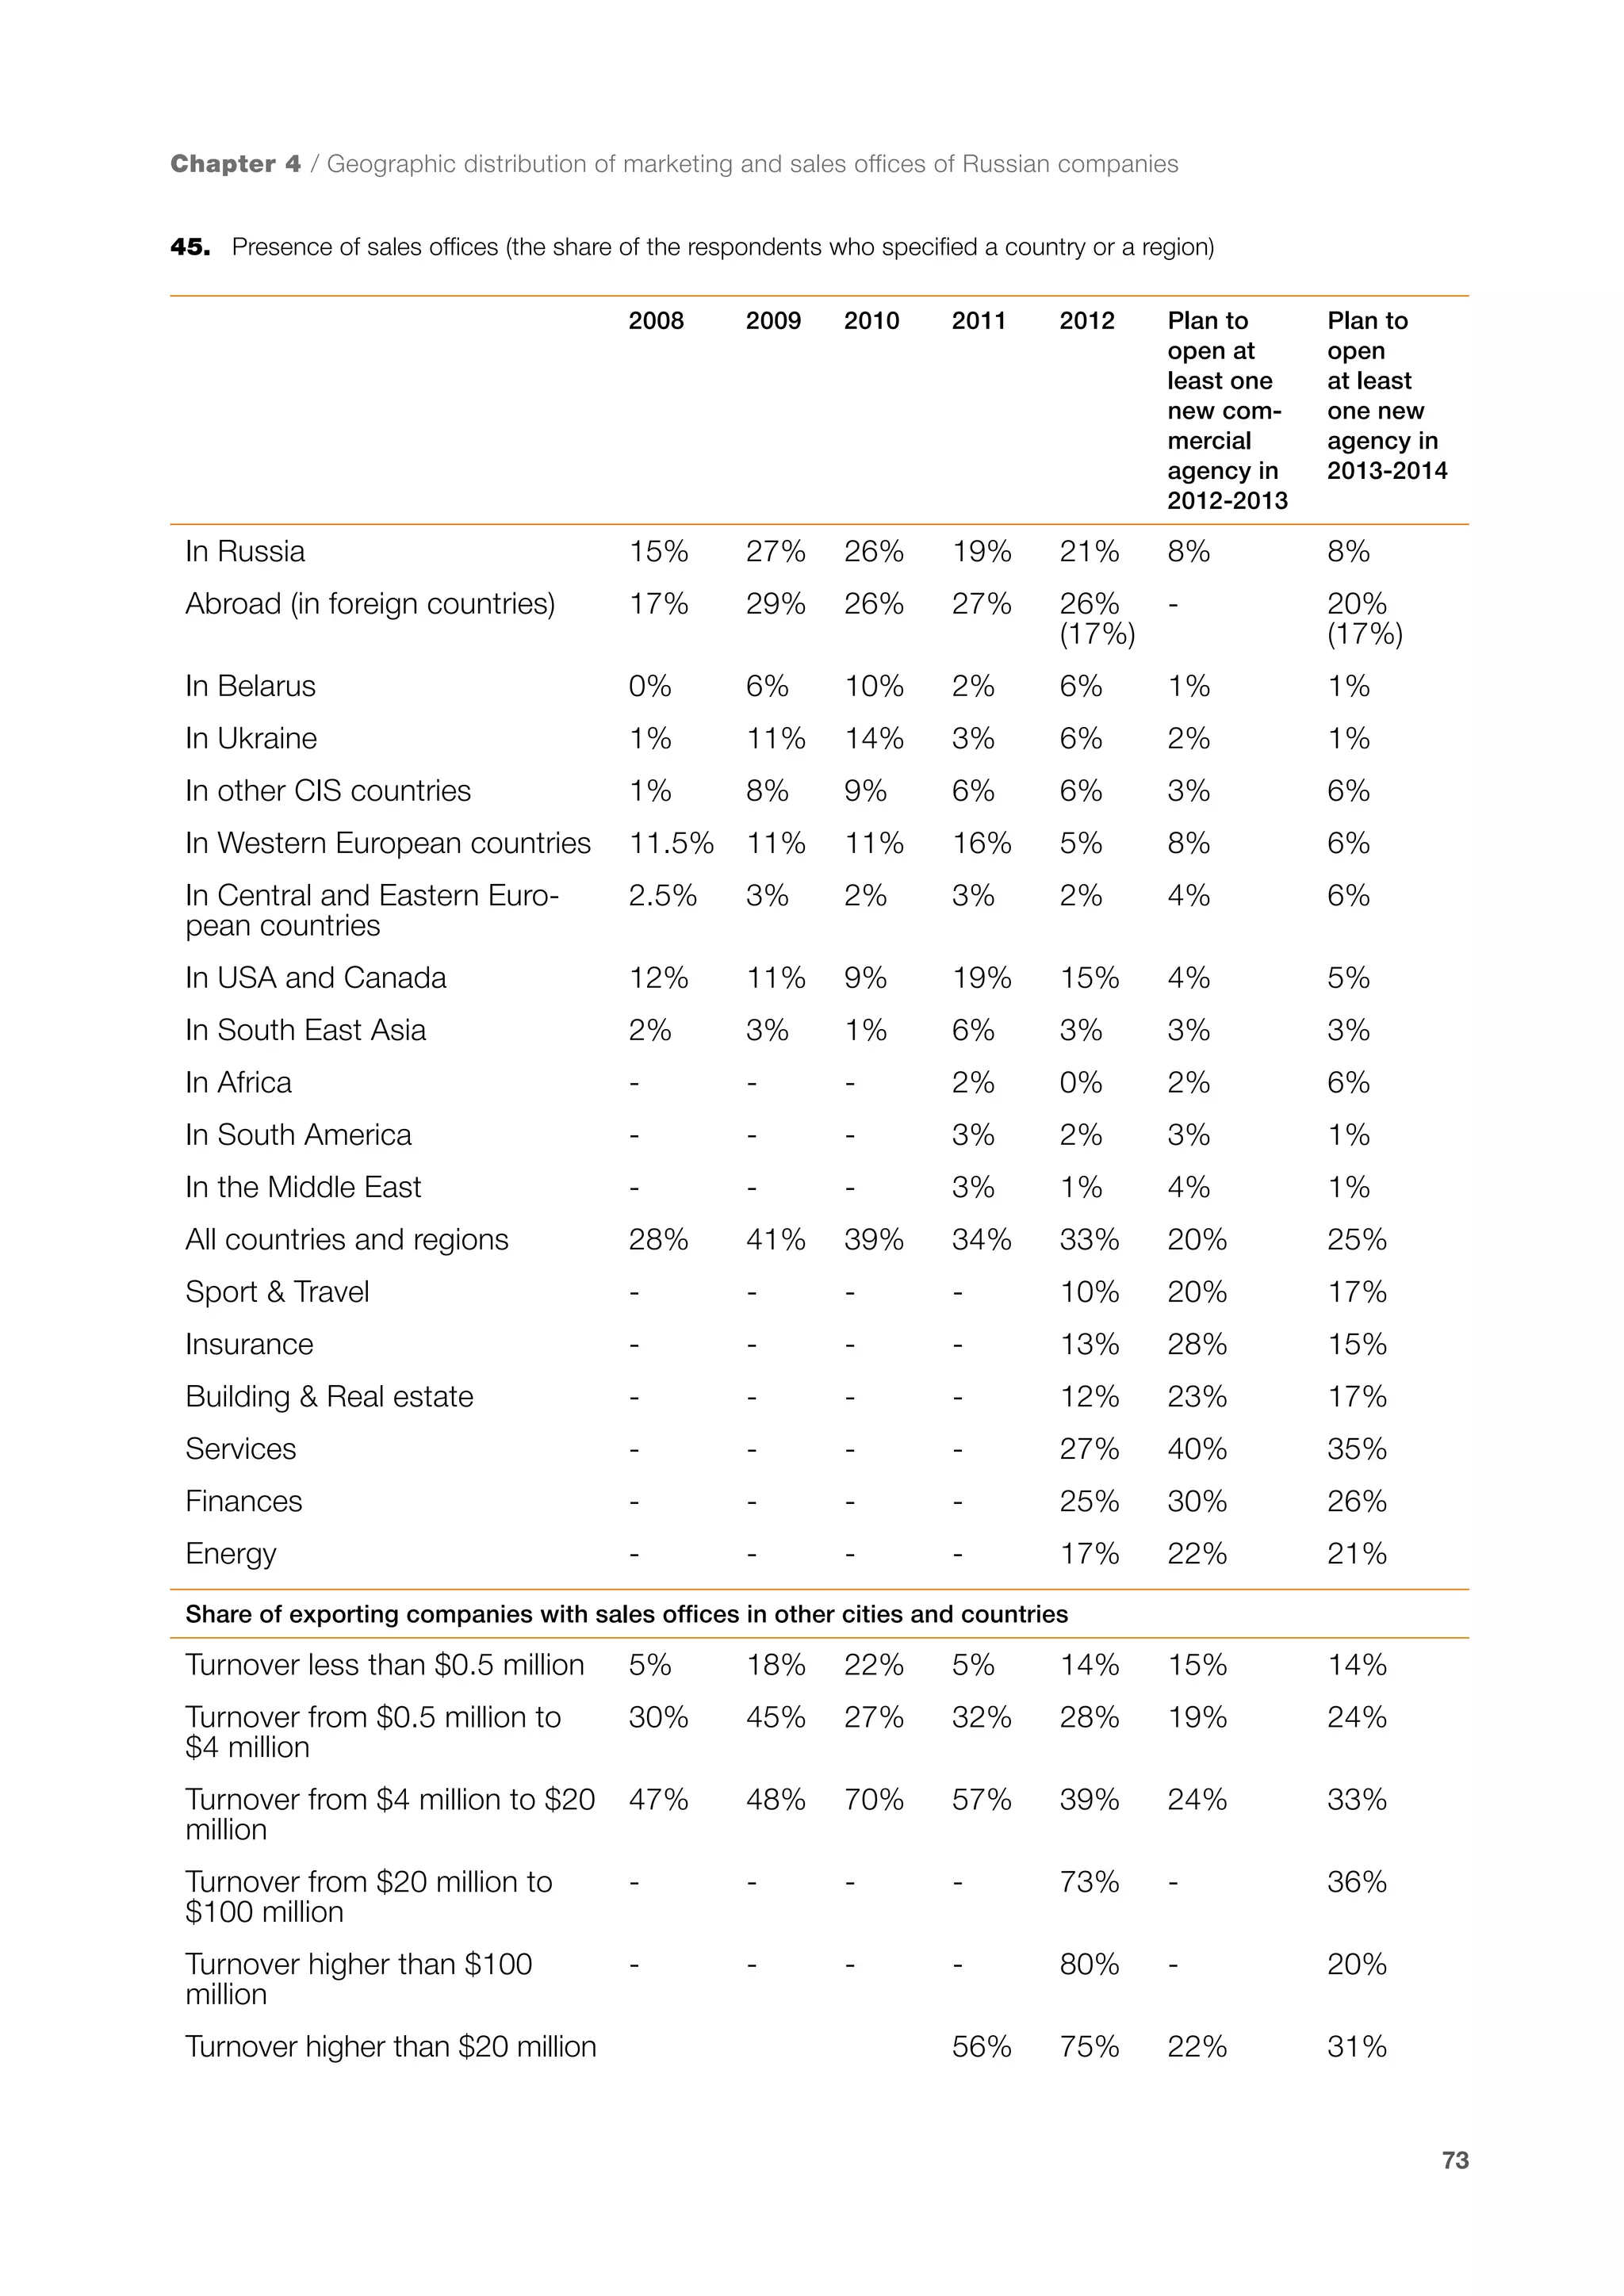
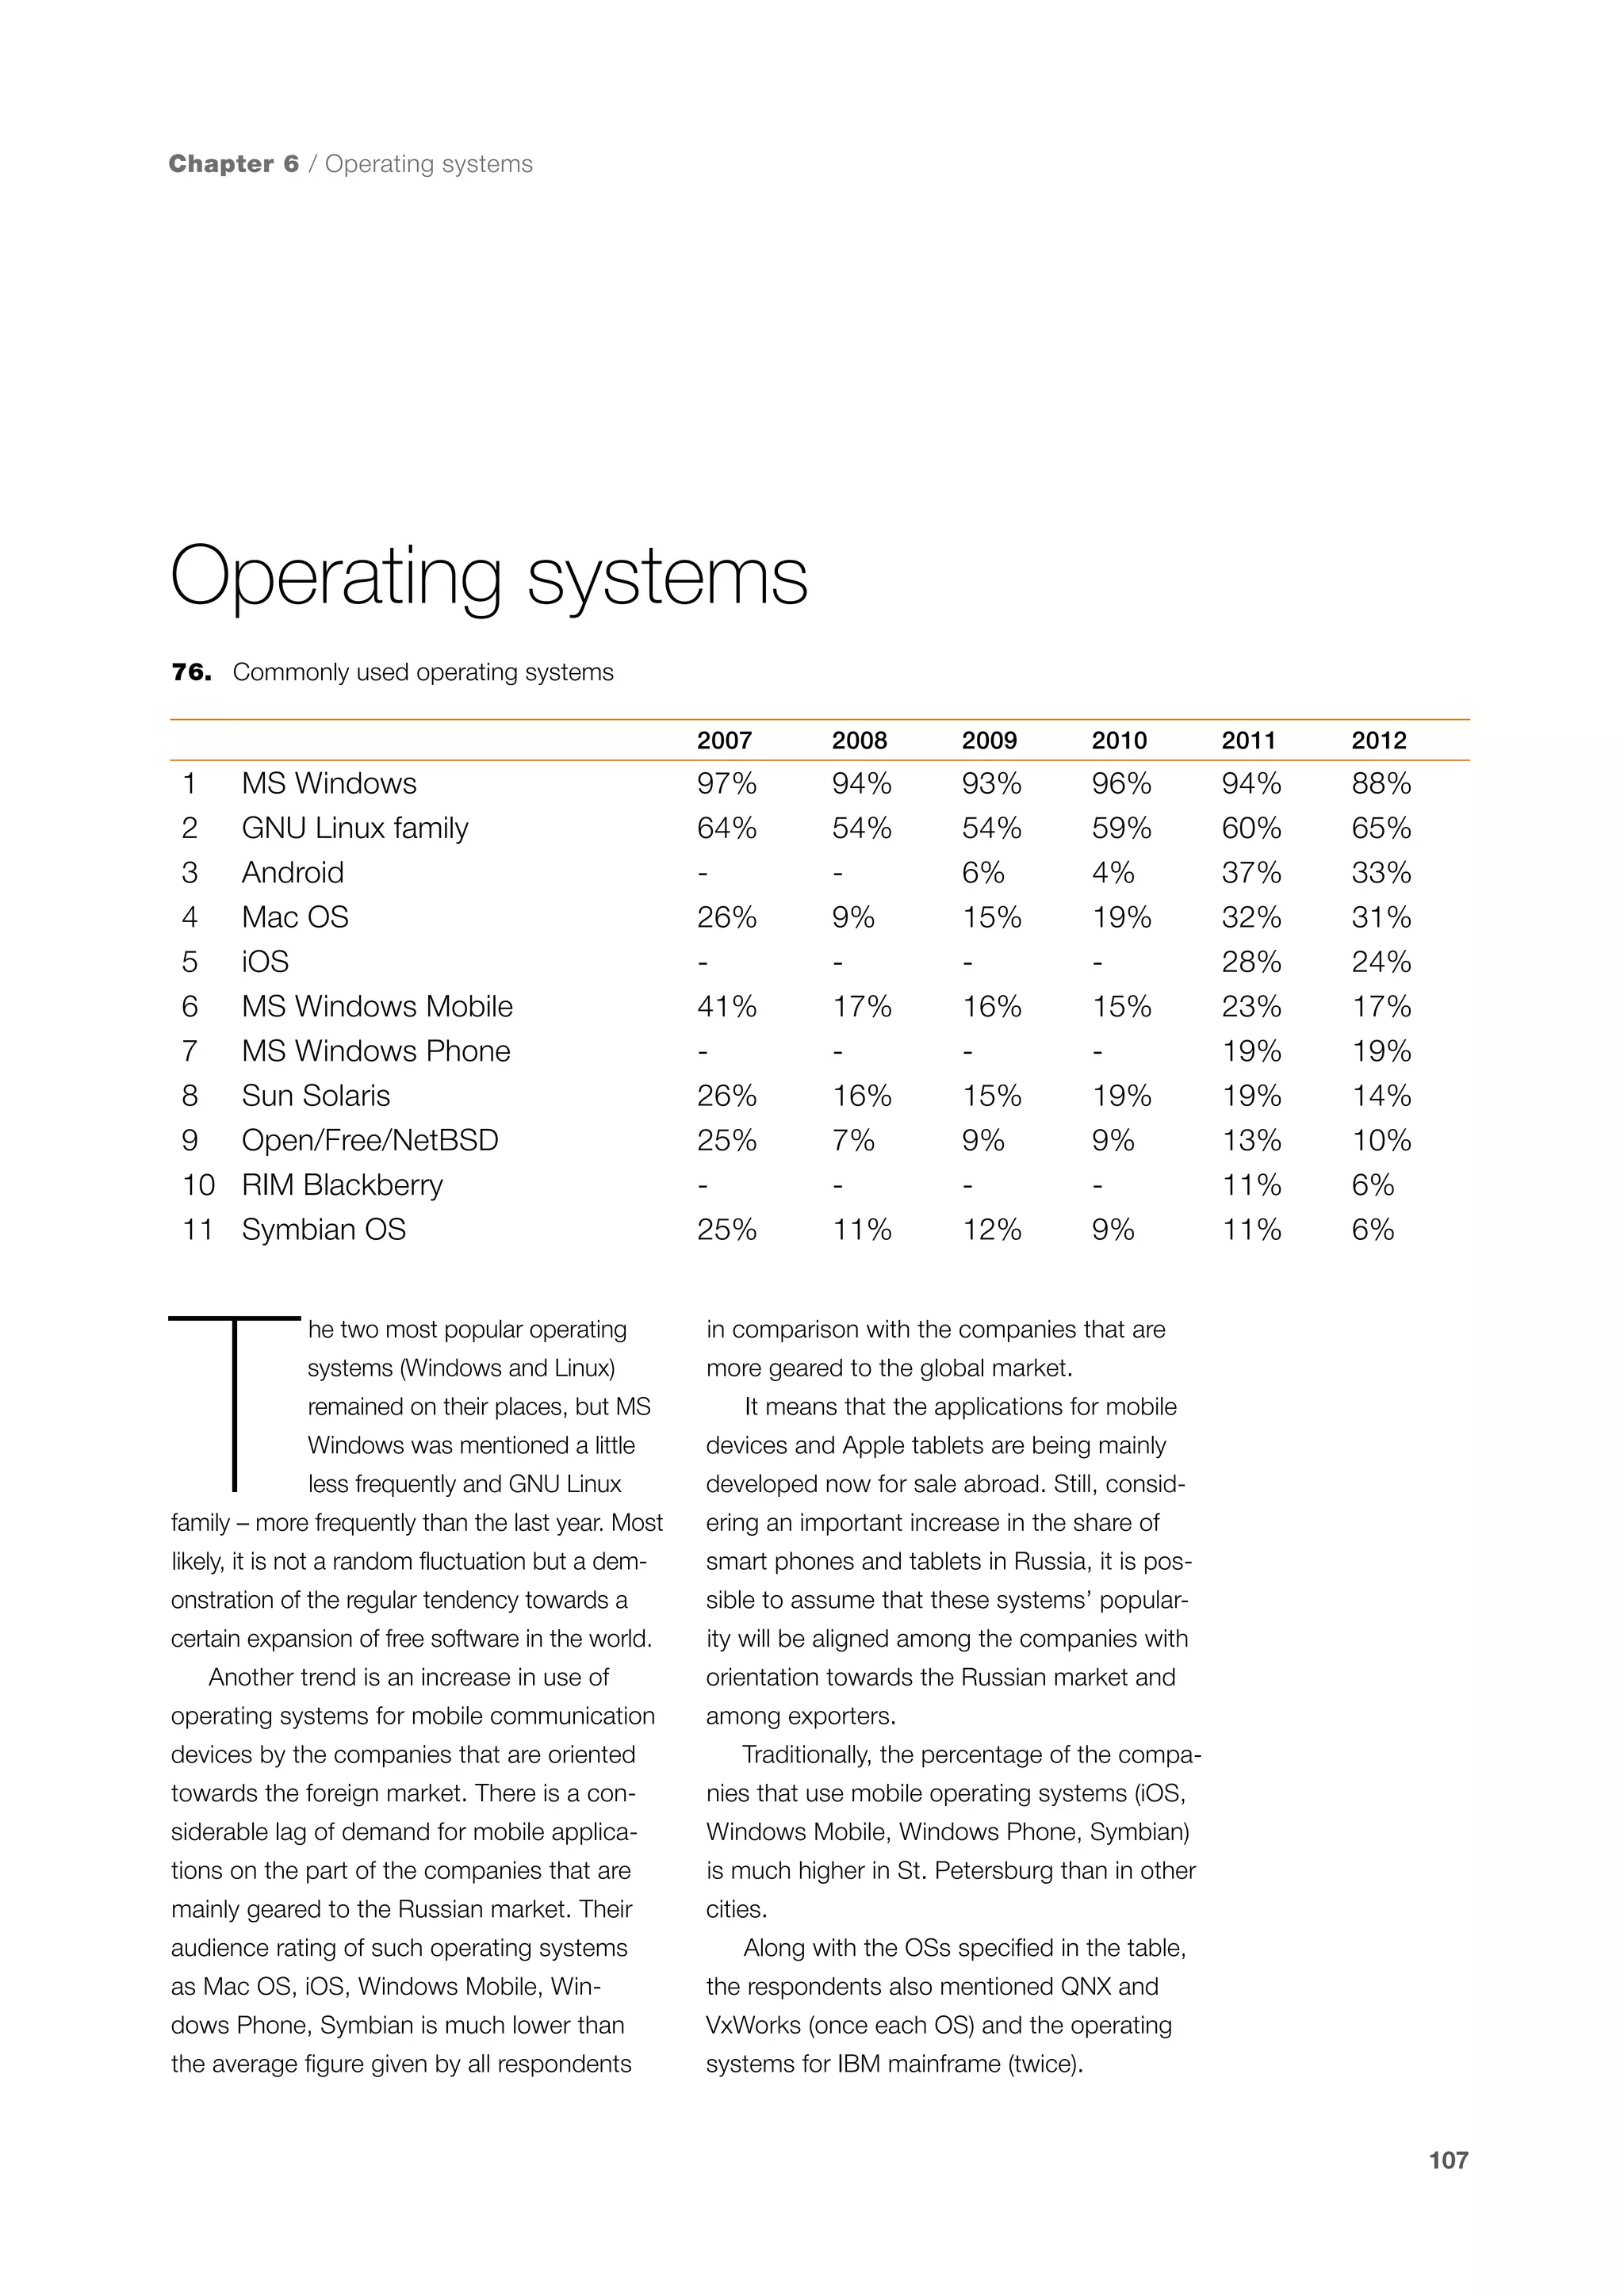
10-TH ANNUAL SURVEY

2013
RUSSIAN SOFTWARE
DEVELOPING INDUSTRY
AND SOFTWARE EXPORTS
With support from
APKIT Association

RUSSOFT Association
2013
Luxoft is one of the leading Central & Eastern European ITO
providers. We offer custom application development services
to world’s largest brands in Finance, Telecom, Energy, Travel
& Aviation, Automotive & Transportation and Technology
industries.
Our deep industry expertise and highest quality of the service
receive regular recognition (’’IT Outsourcing Project of the
Year’’ by EOA, ‘’Outsourcing Provider of the Year’’ by
NOA).
Augment your IT strategy, and select the nearshore partner
that will enable you to expand your horizons.
Introduction

Dear colleagues!
Dear friends!

I

vendors were included in the so-called “Magic
Quadrants” of Gartner and Russian service
companies strengthened their positions in
the international ratings. The trend of attracting investments into the Russian IT industry
became more apparent (two more Russian
representatives – Luxoft and QIWI successfully

am very happy to present you the results

held the IPO procedure and entered the world

of the 10th annual survey of the software

financial market, while venture investments in

export industry in Russia.

the Russian IT grew up to 2.3 times compared

The research was conducted by RUS-

to the previous year.

SOFT (Association of software companies,

I would like to catch this opportunity and

RUSSOFT) from February to April, 2013 when

to thank the Confirmit and Toy Opinion for their

more than 140 market players were interro-

effective support of source information collec-

gated.

tion, to PROMT for their professional transla-

This year we celebrated the 10th an-

tion services as well as to convey our sincere

niversary of our research, so we decided to

gratitude to Andrey Terekhov, professor of St.

improve the methodology and to revise the

Petersburg University, for his participation in

previously obtained results. During the revision

the report editing. And certainly, I wish to give

we came to conclusion that our last year’s es-

kind words of gratitude to our analyst Dmitry

timates of export value of the Russian software

Zhelvitsky for his fantastic work on putting

and of software development services were

together all the obtained information.

almost completely confirmed (with a very small

We are very grateful to the Association

correction upwards). The ratio of export shares

of Computer and Information Technology

of different industry’s segments has slightly

Companies (APKIT) and to our sponsors

changed, but it has not led to major changes

without whom it would have been impossible

in the identified trends and the previously

to perform such a large-scale project.

drawn conclusions.
Now we can even more safely judge the

Many thanks to all survey participants who
provided information on their companies. The

industry position in the global market, to trace

jubilee research summarizes the result of the

dynamics of its development, to identify long-

industry development decade, and this result

term and medium-term tendencies as well as

is very positive. The industry is rapidly develop-

to predict the further course of events.

ing and is becoming a significant and respect-

The last year passed within the global

ed global market player.

contraction of the economic growth and with
a slowdown in the Russian industrial growth.
This period was also marked by the ‘rebound’
in the Russian IT market dynamics – the
market volume practically remained at the
previous year’s level. Nevertheless, in 2012 the
Russian software development industry continued to develop actively, having increased
its export almost by 15% and having reached
the export volume of 4.6 billion dollars. The
last year was notable for several distinctive
features: a whole group of Russian software

Best regards,
Valentin Makarov
Executive Editor
RUSSOFT Association President

3
Content
Introduction . . . . . . . . . . . . . . . . . . . . . . . . . . . . . . . . . . . . . . . . . . . . . . . . . . . . . . . . . . . . . . . . . . . . . . . . . . . . . . 2
Methodology. . . . . . . . . . . . . . . . . . . . . . . . . . . . . . . . . . . . . . . . . . . . . . . . . . . . . . . . . . . . . . . . . . . . . . . . . . . . . . 5

Chapter 1
Positions of Russia in the global market of software and software development services. . . . . . . . . . . . . . . . . . . . . 11
	

Russia in the Global IT-ratings . . . . . . . . . . . . . . . . . . . . . . . . . . . . . . . . . . . . . . . . . . . . . . . . . . . . . . . . . . . 12


Achievements of individual Russian companies in the world ratings . . . . . . . . . . . . . . . . . . . . . . . . . . . . . . . 15


Russian IT Market in 2012. . . . . . . . . . . . . . . . . . . . . . . . . . . . . . . . . . . . . . . . . . . . . . . . . . . . . . . . . . . . . . 20


Publications on High Technologies in Russia in Foreign Mass Media. . . . . . . . . . . . . . . . . . . . . . . . . . . . . . . 25

Chapter 2
Volume and structure of Russian software export . . . . . . . . . . . . . . . . . . . . . . . . . . . . . . . . . . . . . . . . . . . . . . . . . . 31
	

Software development services export. . . . . . . . . . . . . . . . . . . . . . . . . . . . . . . . . . . . . . . . . . . . . . . . . . . . . 39


Products and ready-to-use solutions . . . . . . . . . . . . . . . . . . . . . . . . . . . . . . . . . . . . . . . . . . . . . . . . . . . . . . 43


R&D and software development centers of foreign corporations (captive centers). . . . . . . . . . . . . . . . . . . . . 46

Chapter 3
Major trends and targets in the Russian software development industry. . . . . . . . . . . . . . . . . . . . . . . . . . . . . . . . . . 50
	

Quality management system certification . . . . . . . . . . . . . . . . . . . . . . . . . . . . . . . . . . . . . . . . . . . . . . . . . . . 52


Investment promotion . . . . . . . . . . . . . . . . . . . . . . . . . . . . . . . . . . . . . . . . . . . . . . . . . . . . . . . . . . . . . . . . . 54


Investments of Russian companies and funds in other countries. . . . . . . . . . . . . . . . . . . . . . . . . . . . . . . . . . 58


The global software market and ways to increase sales for Russian suppliers. . . . . . . . . . . . . . . . . . . . . . . . 60

Chapter 4
	

Geographic Reach and Main Vertical Markets. . . . . . . . . . . . . . . . . . . . . . . . . . . . . . . . . . . . . . . . . . . . . . . . 63


of the Russian Software Development Industry


Main geographical markets . . . . . . . . . . . . . . . . . . . . . . . . . . . . . . . . . . . . . . . . . . . . . . . . . . . . . . . . . . . . . 64


Vertical markets. . . . . . . . . . . . . . . . . . . . . . . . . . . . . . . . . . . . . . . . . . . . . . . . . . . . . . . . . . . . . . . . . . . . . . 67


Software development center geographic distribution. . . . . . . . . . . . . . . . . . . . . . . . . . . . . . . . . . . . . . . . . . 68


Geographic distribution of marketing and sales offices of Russian companies. . . . . . . . . . . . . . . . . . . . . . . . 72

Chapter 5
	

Human resources and labor market. . . . . . . . . . . . . . . . . . . . . . . . . . . . . . . . . . . . . . . . . . . . . . . . . . . . . . . 74


Employee recruitment and headcount reduction. . . . . . . . . . . . . . . . . . . . . . . . . . . . . . . . . . . . . . . . . . . . . . 79	


Shortage of engineers . . . . . . . . . . . . . . . . . . . . . . . . . . . . . . . . . . . . . . . . . . . . . . . . . . . . . . . . . . . . . . . . . 83


Foreign language skills. . . . . . . . . . . . . . . . . . . . . . . . . . . . . . . . . . . . . . . . . . . . . . . . . . . . . . . . . . . . . . . . . 86


Salary . . . . . . . . . . . . . . . . . . . . . . . . . . . . . . . . . . . . . . . . . . . . . . . . . . . . . . . . . . . . . . . . . . . . . . . . . . . . . 89


Staff training. Universities. . . . . . . . . . . . . . . . . . . . . . . . . . . . . . . . . . . . . . . . . . . . . . . . . . . . . . . . . . . . . . . 93


Situation on the labor market in Russia and in other countries . . . . . . . . . . . . . . . . . . . . . . . . . . . . . . . . . . . 102

Chapter 6
Technologies. . . . . . . . . . . . . . . . . . . . . . . . . . . . . . . . . . . . . . . . . . . . . . . . . . . . . . . . . . . . . . . . . . . . . . . . . . . . . . 106
	

Operating systems. . . . . . . . . . . . . . . . . . . . . . . . . . . . . . . . . . . . . . . . . . . . . . . . . . . . . . . . . . . . . . . . . . . . 107


Programming tools. . . . . . . . . . . . . . . . . . . . . . . . . . . . . . . . . . . . . . . . . . . . . . . . . . . . . . . . . . . . . . . . . . . . 108


DBMS. . . . . . . . . . . . . . . . . . . . . . . . . . . . . . . . . . . . . . . . . . . . . . . . . . . . . . . . . . . . . . . . . . . . . . . . . . . . . 110

Conclusions. . . . . . . . . . . . . . . . . . . . . . . . . . . . . . . . . . . . . . . . . . . . . . . . . . . . . . . . . . . . . . . . . . . . . . . . . . . . . . 111
Participants of research. . . . . . . . . . . . . . . . . . . . . . . . . . . . . . . . . . . . . . . . . . . . . . . . . . . . . . . . . . . . . . . . . . . . . . 114

4
Methodology

METHODOLOGY

T

he research that RUSSOFT

only companies which have foreign contracts

Association conducts annually

(irrespective of their export share in the total

since 2004 traditionally begins

amount of sales) were selected in both cases.

with a polling of a regularly

As a result, 144 high-quality questionnaires

updated database of 1400

filled by software export companies were

Russian companies and organizations which
are engaged in the international software

collected.
It should be noted that the line-up and

development. The survey was carried out

the structure of respondents is considerably

using technology of Comfirmit with participa-

changing from year to year. Only 26 respon-

tion of the Toy Opinion marketing agency. In

dents (18%) participated in the survey both

addition to this, RUSSOFT performed its own

this year and last year. However, as a whole,

survey of its members. During the research

these changes do not prevent from compar-

01. Respondents’ distribution by market operation duration
Companies’ age

50

40

48

%

28

20

From 4 to 8 years

%

From 9 tо 13 years

%

25
27
23

25

32,5

30,5

26

10

10

0

%

More than 14 years

41
35

30

Up to 3 years

3

Survey
of 2011

Survey
of 2012

Survey
of 2013

2

Survey
of 2010

11

5
Methodology
02.	 Distribution of respondents depending on their specialization:

Year of
survey

Software
companies
(product
companies)

2012

22%

2013

29%

Foreign corporations’ development centers

Software
development service providers

Service
and product
companies

78%
3%

59%

ing the survey results obtained in the last 2

9%

* In 2012, the “service
and product” companies were regarded as
the service companies,
and foreign companies’
development centers
did not participate in
the survey.

Several new questions describing service

years and from revealing the current trends.

companies’ activities were added to the

Besides, a relative increase in this or that

questionnaire. In particular, the following

respondents’ group in certain cases reflects

points were determined: a payment model

real processes in the software industry. For

for service contracts (payment on “time and

example, a sharp increase in the share of

material” or on a “fixed price”), a customer

brand new companies (with an effective

relationship model (custom software devel-

period less than three years) from 2% to

opment, creation of the customer’s offshore

10% which was revealed in the last year is

development center or both models), a type

connected with a significant growth of the

of services offered by service provider (soft-

number of startups appearing after 2008. The

ware development, software testing, software

information on such increase is confirmed

technical support, IT consulting and others),

by the venture companies and investment

types of service companies’ clients (system

funds operating in Russia. The fact that this

integrator, end-user, software development

change was not revealed 1-2 years earlier is

subcontracting and so on).

explained by a certain delay in including new
companies in the exporter database.
This year, the share of companies operat-

Besides, thanks to the change in the
wording of the question regarding the price
of the company’s working hour offered to the

ing less than 3 years remained at the last

customer, additional information for analysis

year’s level (or slightly increased) and reached

appeared. The information on the man-hour

11%. This means that a hyperactivity period

cost was classified by areas of expertise so

in startup creation still goes on.

the number of answers to the corresponding

This year, the challenge of attributing certain companies according to the product or

survey question sharply increased.
There was one more change – separation

service business model becomes especially

of the largest companies (with the turnover

obvious. Many custom software develop-

over $20 million) in two categories: with the

ers eventually create their own standard

turnover from $20 million to $100 million and

solutions. These solutions are sold in parallel

those with the turnover over $100 million.

with the delivery of software development

This change was connected with a significant

services, otherwise service companies de-

growth of largest companies in the recent

velop new systems on customer’s requests

years. As a result, very large companies (by

based on their own existing solutions. The

Russian standards) became «global» and they

companies with the equivalent income from

should be considered separately from other

both sale of licensed software and from
software development services were put

“conditionally” large companies.
During all years of research, there was a

together into a new category – «service and

6

dominance of Moscow and St. Petersburg

product companies»

companies among respondents. The two
Methodology
Year of survey

2011

2012

2013

03.	 Distribution
19

of respondents by
central office location

22

8

13

9

04.	Distribution
cumulative income

8

21,1

distribution by central
21

office location

11

10,9

14

of respondents’

6
29

25

29

28

34

39

26

9

16

60

65

66,9

05.	Distribution
of respondents’

14

consolidated export

18,6

18

revenues by central
office location

76

% Moscow

% St. Petersburg

74,8

% Siberia

74

%

Ural

Russian capitals are accounted for 55% of

Other towns

Actually, considering the difficulties of

respondents, for 81% of aggregate income

%

obtaining questionnaires from provincial com-

and for 92% of consolidated export revenues.

panies and the fact that more than a half of

The financial crisis of 2008 accelerated the

large Moscow or St. Petersburg companies

process of business consolidation in the Rus-

have their software development centers in

sian software industry (it especially concerns

the regions (at least one regional develop-

custom software developers) that resulted in

ment center each), the contribution of regions

a small increase in the share of Moscow and

into the export of software and of develop-

St. Petersburg, where largest Russian export

ment services is much greater.

companies are concentrated.
This year survey results allow assuming a

Companies representing 35 Russian cities
took part in the survey (by the location of the

change of balance of power between capitals

headquarters or of their main production site).

and regions. A gradual but steady reduction of

In 10 more cities there are no companies’

the gap between two capitals and regions has

headquarters but there are remote devel-

been outlined. Outside Moscow and St. Pe-

opment centers. Thus, industrial software

tersburg, the number of companies is growing

development for export is conducted at least

slightly quicker and new large companies ap-

in 45 Russian cities. Considering sales offices

pear. Examples of such large regional compa-

as well, the respondent companies have

nies are MERA Networks in Nizhny Novgorod,

employees in 60 Russian cities.

PROGNOZ in Perm, ICL-KME CS in Kazan,
Parallels and Alawar in Novosibirsk.

The total revenue of all respondent companies was $1724 million, and the export

7
Methodology
06. Distribution of the respondents by their turnover
Less than
$0.5 million

From $0.5
million to $4
million

From $4 million to $20
million

Over $20 million

2008

39%

39%

15%

8%

2009

24%

58%

13%

5%

2010

31%

48%

14%

7%

2011

19%

53%

20%

8%

2012

15,5%

60,6%

12,7%

(11,2%)

From $20 million to $100
million

Over $100
million

7,7%

3,5%

from $20 million to $100
million

higher than
$100 million

20%

62,9%

07.	 Distribution of the respondents depending on their aggregate income

Companies with turnover
less than $0.5
million

from $0.5
million to $4
million

from $4 million to $20
million

higher than
$20 million

2009

1%

17%

18%

64%

2010

2%

13%

20%

66%

2011

1%

10%

16%

73%

2012

0,5%

7,7%

8,9%

(82,9%)

revenue was $1049 million (61% out of the

higher (about 85% of the export income of all

total turnover). Last year, their average share

respondents accrues to 10% of them). The

of export was 68%. Its reduction is explained

tendency of market consolidation remains the

not only by random fluctuations but also by

same during all recent years. Large compa-

the fact that the income from sales in the

nies are growing quicker than small ones.

domestic market in 2012 increased more

When considering the structure of the

than export (that reflects the growth of the

aggregate income and the share of export

Russian IT market in connection with deferred

depending on responds’ headquarter location,

demand after the crisis).

we need to take into account the fact that

About 80% of the aggregate income of

by 2008–2010 the formation of the Russian

all respondents accrues to 10% of the larg-

software development industry «pyramid» had

est companies. As the survey mainly covers

come to the end. At the top of the pyramid

the largest companies (especially since the

there is a group of leaders which naturally

majority of them belong to the RUSSOFT

have turned into the global corporations that

Association and traditionally participate in the

have their sales offices in all leading markets

research), the real ratio for the entire industry

and the branched-out network of develop-

is somewhat different. However, it may safely

ment centers in Russia and other countries.

be said that the share of large companies is
at least 70% (if not 80%) of the total market.
The contribution of the largest companies
to the aggregate export revenues is even

8

The situation in the lower part of the pyramid is not so stable.
The number of respondents (in relative
values) with the turnover less than $0.5
Methodology
08.	 Distribution of the respondent companies depending on their export income

Companies with turnover
less than $0.5
million

By the results
of 2012

from $0.5
million to $4
million

from $4 million
to $20 million

from $20 million to $100
million

than $100
million

0,3%

4,2%

8,2%

16%

71,4%

million and turnover from $4 to $20 million

or decrease in the number of personnel of

considerably reduced. It cannot be explained

such centers. Nevertheless, this year several

by random factors only. The decrease of the

software development centers of large foreign

smallest companies share is connected with

corporations provided information for our

the fact that startups began to overcome the

research, although the data was limited.

turnover level of half a million dollars quicker.

The results of the survey conducted by

Also, there is every indication that a part of

RUSSOFT in February-April 2013 constitute

the smallest companies does not sustain

the basic information for this research. At

competition both in the service and software

the same time, a considerable part of the

product market and in the labor market. It

information about the situation in the industry

is understandable as they can not use tax

and in the various markets was received from

incentives in social payments. This factor

other sources. First of all, we can mention the

is one of the most powerful reasons for the

ratings of authoritative analytical agencies, re-

decrease in the share of small companies

search companies’ reports, information from

among the survey participants.
The largest Russian software vendors, as

foreign and international software developers
associations, publications in Russian and

is usual with them, did not participate in the

foreign mass media (the news were mainly

survey directly. Information on their financial

monitored on the following media resources:

performance was collected from different

CNews, Computerworld Russia, ITRN portal).

sources: mass media publications, compa-

In this research, we also used opinions of ex-

nies’ press releases and their web sites. We

perts, results of the express polls of recruiting

also used estimations of external industry

agencies and the statistics of training centers,

experts and the data received when commu-

as well as the information received by experts

nicating with company managers (all data on

directly during communication with managers

companies’ financial performance collected

of companies (and many of these companies

within this research is used for calculation

did not take part in the survey). Especially, we

of cumulative revenue only and cannot be

should mention the ANCHOR High Technolo-

divulged).

gies and SuperJob recruiting agencies which

Foreign corporations’ research centers
which provide cross-border software development services for their parent companies

provided the most complete and detailed
information on the labor market situation.
After research completion and report

are not willing to disclose information on their

preparation, the text of the report and the

turnover. The assessment of turnover and of

drawn conclusions were revised by experts

aggregate income of such development cen-

(the heads of companies that play an active

ters was performed based on the expert esti-

role in the RUSSOFT Association). Besides,

mations taking into account the available data

the experts commented on some discovered

on the their staff, the results of interviews with

changes and tendencies.

corporation representatives and information
of recruiting agencies which fix mass increase

As the questionnaire sent to respondents
changes insignificantly and includes the same

9
Methodologies
key parameters for comparing companies’ indi-

engaging into the whole process those experts

cators for several years, it allows revealing the

companies and have been moral authorities for

ment process continuity. This is facilitated by

10

who are in charge of the leading RUSSOFT

industry tendencies and maintaining measure-

the entire industry for many years.
CHAPTER 1
POSITIONS OF RUSSIA
IN THE GLOBAL
MARKET OF SOFTWARE
AND SOFTWARE
DEVELOPMENT SERVICES
Chapter 1 / Russia in the Global IT-ratings

Russia in the Global IT-ratings
business IT solutions which might be also in
Arkadiy Dobkin
CEO and President,
EPAM Systems

high demand at those markets.
We also see a positive tendency coming
up, when many more IT events are happening annually in the region, more talented software engineers are recognized in their native
countries, more domestic organizations are

For EPAM, our delivery centers in the region

eager to benefit from advanced software

play a strategic role. It is not only about

solutions and best IT practices locally. In its

the geographic proximity to our clients in

turn, EPAM invests into helping young IT

Western Europe. It is also about an excep-

specialists through multiple educational ini-

tional engineering talent we have access

tiatives and setting training labs together with

to in this geography; it is about developing

the leading local universities. We do believe

and serving local and international clients in

all that helps push the market forward, and

Russia, Ukraine, Belarus, and Kazakhstan,

that is what we have been trying to do for

which are looking to benefit from our strong

20 years of EPAM’s active presence in the

international expertise in many industry and

region.

F

or the last year, Russia improved

ment and about the carried-out reforms,

its positions in the various global

but also by growing information openness

IT related ratings which reflect the

of the Russian government bodies and of

level of IT development and usage,

commercial structures. For example, just in

as well as conditions for conduct-

a year Russia flew up 32 positions higher in

ing business. Similar processes are observed

the world rating of the Electronic government

in the majority of IT-ratings for several last

development (E-Government Survey 2012:

years, however for the first time there has not

E-Government for the People), having risen

been noted any exception connected with

from the 59th to the 27th place. This rat-

deterioration of any of them.

ing was published by the United Nations. It

In some cases negative publications in the

reflects the readiness and the feasibility of the

mass media have been producing their impact

state agencies from 193 countries to use ICT

on experts who created these ratings. Then

to provide the state services.

they were partly guided by political stereo-

Certainly, Russian government made

types, maintaining political games and creating

some decisions that contributed to the

of Russia an image of the enemy. This orienta-

increased use of IT and of the Global network

tion was partially enforced because Russian

in the interaction of various departments and

companies, universities and state structures

the government institutions with the citizens.

were not always aspiring to provide all informa-

Particularly to be noted that a unified portal

tion that is necessary for analysts.

for the state services was created. However it

At the same time, movement up of Russia

is hard to say that it is already operating with

in world IT-ratings was not only caused by

12

the full functionality support. Many services

available real information about its develop-

are not transformed to the electronic form yet.
Chapter 1 / Russia in the Global IT-ratings

but that progress could not be so great in

World Competitiveness
Yearbook (by IMD)

such a short term.

In the World Competitiveness Yearbook 2013

The work is underway and there is a progress

In reality Russia jumped from one category of countries of the rating to another –

published annually by IMD (International Institute for Management Development, Switzer-

from countries with emerging economics to

land) Russia took the 42nd place among 60

the economically developed countries – just

countries, after having risen by six positions

in a year. Moreover, countries in this rating

for the year. The researchers have noted the

are ranged based on the weighed index of

substantial achievements in the state of the

estimates on three main components (scale

economy. The rating is compiled based on

and quality of online services, level of ICT-

statistics and on surveys of corporate leaders

infrastructure development and human capi-

(4,200 people interrogated, including about

tal) and it is hard to change them in a year to

100 in Russia).

overtake about thirty countries. Apparently,

The main reason for the increase in the

this breakthrough was caused by efforts

Russia’s rating position is the data on the

on the e-government programs that were

employment – the country moved up by this

undertaken in Russia within several years,

parameter from the 27th to the 13th place. Ex-

but analysts got information about them and

perts also acknowledged the following strong

estimated results no earlier than a year ago.

or improving Russia’s indicators: low level of

In e-Government Survey 2012, Russia

public debt, low personal income tax, stable

took the 37th place in the online services de-

interest rate, high level of employees’ educa-

velopment, the 30th place in the level of the

tion and qualifications. They also marked as

ICT-infrastructure development and the 44th

weak or worsening indicators the following:

place in the human capital development. All

imbalanced export, weak pension system,

three indexes were improved for Russia.

underdeveloped capital market, bureaucracy,
low need of innovations. A number of demog-

Doing business

raphy and health care indicators were also

Apparently Russia takes worst positions in the

mentioned (Russia is at the bottom by the ratio

Doing Business rating which is compiled by

of elderly and of employable population, by the

the World Bank experts occupying the 112th

quality of life and by the level of health care).

place among 185 countries. However there
was a step up by 8 places compared to the

Global Innovation Index

last year that testifies to a certain progress. It

In the rating of the world’s most innovative

should be noted that the World Bank tradition-

states (which is compiled by the Bloomberg)

ally estimates the situation in Russia worse than

Russia took the 14th place, having outstripped

other international organizations and some-

Canada, the UK, Australia and many other

times predicted decline in the Russian GDP that

states. Totally 50 countries were included in

was not confirmed by subsequent events. The

the Global Innovation Index where information

Ministry of Economic Development of the Rus-

on 200 states and sovereign territories was

sian Federation considers that Russia should

analyzed. Analysts considered the follow-

already take the 44th place in this rating. It may

ing seven factors: R&D intensity, productivity,

be realistically assumed that Russia’s position in

high-tech density, researcher concentration,

the rating may be somewhere within 40th-60th

manufacturing capability, tertiary efficiency and

places. Vladimir Putin, the incumbent president

patent activity. The information was provided

of Russia, demanded at the end of 2011 (then

by the World Bank, the World Intellectual

he held the position of the prime minister) that

Property Organization, the Conference Board

by 2020 Russia should move up in the Doing

organization, the Organization for Economic

Business rating to the 20th place.

Cooperation and Development and UNESCO.

13
Chapter 1 / Russia in the Global IT-ratings

comScore

National Cloud Computing Policy

According to the comScore report, Rus-

Following the results of the analytical research on

sia possesses the largest Internet audience

changes of different countries’ national policy in

among the European states and takes the

the sphere of cloud computing which was con-

third place by indicator of web page viewing

ducted by the Business Software Alliance (BSA)

from mobile phones (by the share of page

Russia took the 14th place among 24 world’s

views from all types of mobile devices).

leading IT economies (a year ago Russia was on

IDI («ICT Development Index»)

Japan thanks to adoption of the complex legisla-

Following the results of 2011, Russia moved

tive initiatives to support e-commerce. Australia

up by 2 places in the ICT Development Index

is on the second place, and the third place this

the 16th place). The global rating is headed by

and took the 38th place, having closely ap-

year belongs to the USA which have moved

proached to Portugal that occupies the row

Germany to the fourth position. BSA made an

above.

assessment of the national legislation and regulatory acts by seven different parameters that are

The Web Index

critically important for development of globally

According to The Web Index report 2012

integrated market of cloud computing.

(compiled by the World Wide Web Foundation organization), Russia took the 31st place
by the level of the Internet development and

Innovation Cities Global Index
2012-2013

usage. Every year Russia steadily improves

In the rating of the world’s most innovative

its positions in this rating. Following factors

cities Moscow took the 74th place and St.

prevent Russia from making a greater prog-

Petersburg – the 84th place. Only 133 cities

ress: low level of use of social networks and

have been ranked there among 445 cities

of the global network for health care informa-

which participated in the rating. Except two

tion availability, low level of e-learning services,

Russian capitals the following Russian cities

high level of cyber-crime and quite a low level

also participated there: Yekaterinburg, Kazan,

of e-commerce development.

Novosibirsk, Samara, Krasnoyarsk, Kaliningrad, Rostov-on-Don, Nizhny Novgorod, Perm,

Networked Readiness Index

Saratov, Tomsk, Vladivostok, Omsk, Volgograd,

According to the annual report published

Izhevsk, Barnaul, Orenburg, and Togliatti.

by the World Economic Forum and INSEAD
business school, Russia moved up by two

The Top 100 Outsourcing Cities

places in the Networked Readiness Index

The ranking of cities pretending to be the best

2013 (having overtaken China and other

destinations for the software development

BRICS countries) and took the 54th place.

outsourcing (organized by Global Services)

To be noted that in 2010 Russia was on the

included four Russian cities. All of them were

80th place only. This year the improvement

present in this listing a year ago. Only Moscow

of the Russia’ position is mainly explained

conceded its position and dropped from the

by an increase in the number of Internet

46th to the 56th place. St. Petersburg moved

users and especially by an exponential

Novgorod – from the 63rd to the 62nd place,

in the world).

14

up from the 33rd to the 32nd place, Nizhny

growth of 3G-connections (the 20th place

Novosibirsk – from the 97th to the 92nd place.
Chapter 1 / Achievements of individual Russian companies in the world ratings

Achievements of individual
Russian companies in the world
ratings

M

any large Russian software

The Russian service companies have a

vendors still do not aspire

very different attitude towards the participa-

to appear in various ratings

tion in the international ratings. Among the

created by the globally

most well-known ratings, we can note two

authoritative analyst teams.

versions of the Top-100 world’s outsourcing

The main reason is unwillingness to disclose

providers: Global Services and IAOP (Interna-

their turnover and profit data so that it would

tional Association of Outsourcing Profession-

not become widely known in their country.

als). In these ratings (which are mainly based

Besides, software vendors sometimes do not

on the quality of rendered services rather than

wish to demonstrate their Russian origin as

on the company size) a significant number of

they position themselves at the corresponding

companies represent Russia (only India and

markets as local residents (in order to use the

the USA have more companies in the ratings).

status of these countries’ national manufactur-

Currently, the number of Russian software

ers). There are also some fears that the Rus-

development service providers in the Global

sian affiliation may prevent from their success-

Services and IAOP ratings looks very close to

ful operations in some foreign markets due

the maximum extent possible, still it may be

to the politically prejudiced attitude towards

even more increased due to the progress in

Russia (mostly, in Europe and the USA).

other Russian companies’ transparency and

Due to these reasons, the representa-

PR activity. Totally 10 Russian service provid-

tion of Russian companies in a number of

ers have been included at least once in the

software vendor ratings is much lower than

Top-100 outsourcing companies according to

it can be expected in the present context.

Global Services and IAOP for last five years.

However, Russian vendors are gradually be-

This year, the IAOP rating did not in-

coming more open, and their representation

clude such provider as MERA from Nizhny

is growing even in those ratings for which the

Novgorod, which decided not to participate

turnover data has to be disclosed

in the 2012 rating in order to be included

15
Chapter 1 / Achievements of individual Russian companies in the world ratings
into a higher category (“global”) next year. It

it is noted that they are growing very quickly.

would be also logical to see in this rating next

Another candidate for a place among the

year ICL-KME CS (based in Kazan) which is

global providers is MERA. The growth of

rapidly developing and has the staff number

the company’ staff size to 2000 employees

over 1200 people.

allows it to anticipate the achievement of this

In recent years, the share of Russian com-

purpose following the results of 2013.

panies in these ratings has kept at the level
of 5-8%. We need to keep in mind that apart

The 2012 Global Services 100

from the IT-service providers both ratings

The last published rating of the top-100

also include leading BPO service providers.

outsourcing companies according to the

Excluding such companies from the ratings

Global Services appeared in the summer of

above, the proportion of Russian IT-compa-

2012. The new version (following the results

nies will be higher than 10%. And summing

of 2012) was not ready by the time of this

up all achievements of Russian, Ukrainian,

research report preparation. A year ago,

and Belorussian IT-service providers in these

the 2012 Global Services 100 list included

ratings, the total share of service companies

7 companies from Russia: Auriga, DataArt,

from the Russian-speaking industry of the for-

EPAM Systems, First Line Software, Luxoft,

mer USSR among the top world’s IT service

MERA, and Reksoft.

providers will be over 15%.
The Global Services and IAOP analysts

In the Global Services 100 rating, there
were five companies from Ukraine and

not only identify the global top-100 leading

Belarus as well: IBA Group, SaM Solutions,

outsourcing companies but also define the

SoftServe, Intetics, and Itransition. All three

best ones in various nominations, which al-

countries are culturally and economically

lows for judging the most important strengths

close, so we can quite reasonably mention

of the Russian software developers. The

the so-called «Russian-speaking community»

companies with their main development cen-

of the IT-service providers. The strengths of

ters in Russia are considered to be among

the companies from these three States are

the leaders in the following areas: Product

approximately identical. First of all, they have

Engineering, Software/Hardware, Information

high quality education in the field of physical

and Communication Technology Services,

and mathematical sciences, exclusive creativ-

Entertainment & Media, Automotive, Finan-

ity of personnel and experience in performing

cial Services, Health Care, Government and

complex projects.

Industry-Specific Services.
determine the best service providers by

The 2013 Global
Outsourcing 100

Global Services and IAOP separately
figures that reflect their size (staff number,

The IAOP experts, among whom there are

consolidated revenues, number of develop-

representatives of General Electric, Sprint,

ment centers). A few Russian companies are

Thomson Reuters, WMS Gaming and of

included into the corresponding additional

leading US business schools, selected the

ratings. They are also on the first positions

winners by a number of criteria, such as the

among IT service providers from the Eastern

turnover growth and the company staff size,

and Central Europe (almost all largest East

the positive customers’ feedback, company’s

European companies are concentrated in

top management experience, and others.

Russia, Belarus, and Ukraine).
Only Luxoft and EPAM Systems are noted
by analysts as the “global” companies, but

Like in 2012, IAOP included 6 companies
representing Russia in the Top-100 in 2013.
They are: Artezio, Auriga, EPAM Systems,

they are still considered to be medium-sized

16

First Line Software, Luxoft, Reksoft. Two

enterprises by the global standards. Although

years ago there were 5 such companies and
Chapter 1 / Achievements of individual Russian companies in the world ratings
three years ago there were only 3. According to experts, the increase in the number

09.	 Representation of Russian companies among the best ones in
various sub-nominations of IAOP

of companies in this rating confirms that
Russian service providers successfully added

Nomination

understanding of market and their ability to

Top ten

do business to existing highest technological
level of Russian engineers.
This year there is one more Russian
company (MERA) among the best in one of
the separate nominations of IAOP. Thus, 7
representatives of Russia were included into
The 2013 Global Outsourcing 100. Telecontact
may be considered as the eighth, but it was
only noted as a «rising star» of Russia. Besides,
this company is oriented towards the Russian
market and to the market of the nearing countries – Ukraine, Belarus, and Kazakhstan.
It is to note that there are less Russian
companies in The Global Outsourcing 100
than in The Global Services 100. It is explained by the fact that IAOP covers with its
rating a larger range of outsourcing application areas (including BPO sector, where Russian export companies are not represented
abroad).
Except Russia, neighboring Ukraine and
Belarus (with IBA Group, Intetics, Itransition, Oxagile, TEAM International, Miratech,

Company name

Leaders in Revenue
Growth

EPAM Systems

Rising Stars in Revenue
Growth

First Line Software

Rising Stars in Employee
Growth

Artezio, First Line Software

Rising Stars in No. of
Centers Worldwide

Artezio

Leaders – Entertainment
& Media

EPAM Systems, MERA

Rising Stars – Retail &
Consumer Goods

Artezio

Rising Stars – Financial
Services (Banking, Markets)

Artezio, Reksoft

Rising Stars – Health Care

Auriga

Rising Stars – Telecommunications

Reksoft

Rising Stars – Information/Comm. Technology
Services

Reksoft, Artezio

as well as with SaM Solutions, Softjourn
and SoftServe which were listed in separate
nominations) are also represented in the IAOP
global rating. Some of mentioned companies
have their headquarters in other countries but
their main development centers are located in
Belarus or Ukraine.

PwC Global 100 Software
Leaders
According to PwC, Kaspersky Lab with its
turnover of $615 million took the 57th place
in the top-100 software companies (following
the results of 2011). This company takes the
12th place in the EMEA region and the second place in the emerging markets (Emerging
Markets 100), being slightly behind the Brazilian TOTVS.
In the EMEA region, 1C was also included
in the top-100 (it took the 30th place with

Top twenty
Leaders – Technology
(Hardware & Software)

EPAM Systems, Luxoft

Leaders – Telecommunications

Luxoft

Rising Stars – Technology
(Hardware & Software)

Auriga

Companies – Government
(all levels)

First Line Software, Reksoft

Companies – Financial
Services (Insurance)

Exigen Services

Leaders – Industry-Specific Services

Luxoft

Leaders – Information/
Comm. Technology Services

EPAM Systems, Luxoft

Companies– Research &
Development Services

Artezio, Auriga, First Line
Software, Luxoft
17
Chapter 1 / Achievements of individual Russian companies in the world ratings
the turnover of $360 million). In the Emerg-

of technologies and services for the financial

ing Markets 100, there appeared three more

industry). This year it took the 68th place,

Russian companies apart from Kaspersky

and Diasoft appeared in this rating on the

Lab and 1C (8th place) – Dr. Web (42nd

88th place.

place, $38 million), ABBYY (51st place, $31
million), and Positive Technologies (68th

Magic Quadrants of Gartner

place, $25 million).

The Gartner Group analytical agency ratings
are among the most prestigious ratings for

Deloitte Technology Fast
500 EMEA

software vendors. This agency year over year

According to Deloitte, among 500 most fast-

ner, which include products and companies

publishes so-called Magic Quadrants of Gart-

growing high-technology companies in the

that are among the leaders in certain software

EMEA region we can usually see companies

segments. Since 2012, three new players

that are not the largest software exporters.

were unexpectedly added to the Russian

An exception is Kaspersky Lab, which a year

software leaders who are traditionally present

ago took the 185th place by revenue growth

in their «quadrants» (Kaspersky Lab, ABBYY

indicator for the last 5 years. Many other Rus-

and some others). These companies are

sian software exporters promptly increased

PROGNOZ from Perm (in the Business Intelli-

their income for the last 5 years, but they did

gence), Diasoft (in the Core Banking Software),

not try to enter the Deloitte rating.

and InfoWatch (in the new Data Loss Preven-

In the last version of this rating, there are
three Russian companies: ER-Telecom (136th

tion quadrant), both from Moscow.
In the Summer of 2013, Gartner included

place), Service Plus (239th place), and STEC.

Kaspersky Lab in the «magic quadrant»

COM (462nd place).

which comprises global vendors of mobile
device management solutions (Mobile Device

Software 500
In the recent years, only two Russian soft-

Management – MDM).
Besides, according to Gartner experts, a

ware developers were present in this rating:

small Moscow company IntelTech with their

following the results of 2011 Luxoft took

products in the field of Big Data analysis took

the 188th place with the turnover of $206.2

the lead in the 2012 Cool Vendors list.

million, and Artezio – the 462nd place. EPAM

ment centers there), took the 181st place in

Other Achievements
of Russian Software
Developers

the Software 500.

The European Outsourcing Association rec-

Systems, which also represents Russia
(based on the location of its largest develop-

This year, Luxoft and EPAM Systems im-

ognized Luxoft as the Outsourcing Company

proved their positions in the Software 500 rat-

of 2011, and also gave it the IT Outsourcing

ing (they occupied the 186th and the 160th

Project of the Year award.

place, respectively). Artezio slightly fell back

In 2013, Forbes business magazine put

(466th place). In addition to them, this year

EPAM Systems at the 6th position among the

other Russian companies were also included

most quickly growing American technological

in the rating: PROGNOZ (292nd place) and

companies (the EPAM Systems headquarters

DataArt (403rd place).

is located in the USA).
Business Week called DataArt one of the

FinTech 100

best developing outsourcing companies in

In 2010 and in 2011, only one Russian

the world.

company (Luxoft) was included in the FinTech
100 (the rating of the global leading providers

18

At the end of 2012, the Russian developer
of speech technologies (Speech Technology
Chapter 1 / Achievements of individual Russian companies in the world ratings
Center) was first awarded with the Speech

internet security space and the first in the US

Industry Award, which are annually conferred

antivirus software retail market.

to the main players of the global speech tech-

In April 2013, two Russian compa-

nology market for their achievements. Earlier,

nies – Softkey and Next Media Group – were

Speech Technology Center (STC) became the

included in the top-100 innovative and tech-

first Russian company to be honored with an

nological Internet projects according to Red

award for their technological achievements by

Herring, one of the largest media holdings.

the Technology Marketing Corporation (TMC),

In September 2012, a Russian company

one of the largest media North American

first appeared in the IDC Security & Vulner-

holdings oriented towards the market of tele-

ability Management rating among the top-10

communications and CRM.
According to the American INTERNET

by revenue size. It was Positive Technologies,
which occupied 2% of the segment of IT sys-

TELEPHONY periodical, VideoMost (video-

tem vulnerability assessment software with

conferencing tools produced by SPIRIT

the income from operation in this segment of

Group) became the Product of 2012. SPIRIT

over $16 million.

software products are integrated in various

A team of developers (from a small city

telecommunication devices and systems.

called Ulyanovsk) who developed Ecwid, a

Over 1 billion people in more than 100

shop for social networks, forced out of Face-

countries use their software globally on a

book its US competitor, Payvment. Payvment

daily basis.

will transfer to Ecwid its user base – then Ec-

By Gartner estimates, Kaspersky Lab
comes the third in the world in the consumer

wid will become the absolute leader among
the Facebook shop designers.

19
Chapter 1 / Russian IT Market in 2012

Russian IT Market in 2012

L

ast year, the volume of the Russian

capacities without purchasing new servers,

information and communication

and the IP telephony ousted more expensive

technology market (ICT market)

traditional voice communication.

increased by only 1.2%. The
information technology market

Considering the entire ICT market, the
main reason for the slowdown of its growth

grew slightly more – approximately by 4%

is the saturation in a number of its significant

according to IDC and by 7% according to the

segments. Now, it is no longer possible to

Ministry of Telecom and Mass Communica-

increase the volume of cellular communication

tions of the Russian Federation.

operators’ services and mobile phone sales

Against a rapid (by tens of percent)

at the expense of new subscribers as almost

increase in the ICT market during the period

all Russians (over 91% of the entire popula-

after the crisis of 2009, the market actually

tion, including children) already use mobile

showed a zero growth in 2012.

communications. Last year, mobile phones

A year ago, experts expected the growth

were generally purchased to replace existing

of the Russian ICT market to reduce, but not in

old devices. Replacement of traditional mobile

such degree. The IDC analysts see two main

phones (mainly used for voice communication)

reasons for the deceleration: the decrease in

by smart phones was underway. The aver-

the Russian economy growth rates and the

age price of a sold mobile phone significantly

reduction of IT costs caused by the fact that

increased, which means that in this case

companies, coming through trials of that crisis,

Russian economy deceleration had no great

tend to spend money for various projects more

impact on the market growth indicators.

reasonably demanding sound justifications of

The same holds true for the market of

all costs. The ICT Russian market saturation

personal computers, which now can be seen

in some of its separate large segments should

almost in each house and on each workplace.

be added to these two factors.

The relatively small growth that still remains

Another factor that is worth mentioning is

in this segment is supported by replacement

development and expansion of modern cloud

of desktops with laptops. Apparently, the

and telecom technologies which provide

desktop computer market in Russia, as well as

new instruments to cut communication and

around the world, will be steadily reduced.

IT costs. The services of commercial data
centers allow to upgrade available computing

20

Considering the level of economically
developed countries, the Russian ICT market
Chapter 1 / Russian IT Market in 2012
is not mature yet, although some signs of its
maturation are already visible and the gap

10.	 Basic figures characterizing
the Russian ICT market in 2012

is quickly closing. In the sphere of telecommunication services the only lags behind the

Indicator

2012

Drop (-)/
Growth (+)
following the
results of
2012

Source

Russian ICT
market

$69 billion*

+1,2%

IDC

Russian IT
market

$33 billion*

+3.9%

IDC

700
billion
rubles

+7%

Ministry of
Telecom
and Mass
Communications

Income from
communication
services

1.53
trillion
rubles

+5.2%

Rosstat

Mobile communication
market

679.2
billion
rubles

+5.6%

Rosstat

Western World exist for the share of smart
phones in the total number of mobile communication devices, and also for the share of
mobile Internet users in the total number of
Internet users.
Due to the size of the country and to the
rapid growth in recent years, the Russian
Internet sector became one of the largest in
Europe and will probably become the largest
soon. About a year ago, Russia took the
first place by the number of Internet users in
Europe (according to comScore) and by the
number of imported PCs in the EMEA region
(IDC). In Russia there are 3.6% of all Internet
users in the world, but herein less than 2%
of all globe population lives in the country. By
the number of broadband Internet users our
position is not much worse – 6th and 7th
place in the world (according to J’son & Partners Consulting and to Broadband-Forum.org,
respectively).
By the average data downloading speed,
which does not depend on country size, in
2011 Russia took 16th place among 224
countries of the world (according to Pando
Networks). The Internet access rate in the
Russian regions grew 4.4 times over the past
year (according to a number of tariff plans).

some other European countries. In the previ-

* preliminary data

ous similar rating it took 59th place only.
It can be assumed that the increase in the
Russian IT market in 2013 should be a little
greater than in 2012. IDC predicts its increase on
the average by 8% per year in the next five years.
Various companies’ experts anticipate more important growth rates in the following segments:

By Internet connectivity, Moscow and
St. Petersburg already match the level of the
cutting-edge countries (over 80% of house-

11.	 Structure of the Russian IT market (results of 2012)

holds are covered by the Internet) while other
regions will reach this level in several years.
According to the Ipsos analytical company
survey (which was conducted on demand
of Reuters) – Russians are the world leaders
among the VoIP technology users (36% of
respondents used it at least once over the

IT services

19%

Software

14%

PCs

24%

Mobile phones

16%

Telecommunication and network equipment

11%

Other equipment

16%

last three months).
Following results of 2011, Russia moved
up to a rather high 27th place among 193
countries in the UN rating by the level of
eGovernment development, having overtaken
Ireland, Italy, Greece, Lithuania, Poland and

Source: IDC

21
Chapter 1 / Russian IT Market in 2012
12.	 Major segments of the Russian IT market
Indicator

2012

Drop (-)/Growth (+)
following the results of 2012

Source

Russian motor vehicle navigation market (systems, solutions, equipment, services)

15 billion rubles

+25%

NP
GLONASS

Russian mobile application
market

$160 million

+256%

J’son &
Partners
Consulting

Smart phones

11.2 million pieces

+29%

IDC

+256.7%

Euroset
Company

+289.5%

IDC

+344% (+278%)

ITResearch

-17%

ITResearch

+16.7% (+20.5%)

Euroset
Company

Mobile computers

- 5%
(in monetary terms)

Euroset
Company

Smart phones

+69% in pieces
(+60% in monetary terms)

Euroset
Company

+41.3%

IDC

+ over 100%

Euroset
Company

Tablet computers

3.89 million pieces
($1.77 billion)
Netbooks
Portable electronics

88.6 million devices
(484.8 billion rubles)

E-book devices
Professional data panels

$125.5 million
(33.3 thousand units)

+15%

ITResearch

Video conferencing

$96 million

+20%

TrueConf

Laptop computers

9.5 million units

+13%

IDC

9.37 million units
Desktop computers

ITResearch
-7.5%

ITResearch

4.16 million units
Total revenue of the external
DSS vendors

4.66 million units

+1.7%

Gartner

$152 million

+22.9%

IDC

+13%

IDC

Infrastructure software
Printers, copiers, and multifunctional devices

4.2 million units ($1
billion)

+0.1%
(9.2% in monetary terms)

IDC

Monitors

5.07 million units
($870 million)

-10% (-15.5%)

ITResearch

+9.2%

IDC

Servers
IT services (system integration,
consulting, etc.)

$6.3 billion

+8.4%

IDC

Software

$3.4 billion

+10%*

IDC

* preliminary data

22
Chapter 1 / Russian IT Market in 2012
13.	 Use of Internet technologies in Russia in 2012
Indicator

Time

Absolute value

Indicator
change

Runet mobile
audience

SeptemberOctober,
2012

35 million subscribers

+51%

Wireless Internet connectivity

End of 2012

40 million active
subscribers (65.5
million subscribers by number of
SIM cards)

Active mobile
Internet connection subscriber
base of smart
phone users

End of 2012

22.5 million subscribers

+88%

J'son & Partners Consulting

Average mobile
data transmission traffic per
smart phone
owner

2012

303 MB/month

+150%

J'son & Partners Consulting

Internet audience scope

End of 2012

61.3 million subscribers

+15%

comScore

Broadband
Internet access
services

End of 2012

+13.5-14%

AC&M-Consulting

Monthly Internet audience in
Russia

Autumn 2012

61.2 million people 18+ (about
47 million people
daily)

Penetration
indicator

WapStart
and Openstat
83% (of
all Internet
users)

+12%

Source

52%

smart phones, mobile applications, mobile

the world market exceeded 50%. However,

navigation equipment and navigation services.

According
to the Obshchestvennoye Mneniye Fund

first three months of this year this indicator in

Internet access, software, cloud technologies,

J'son & Partners Consulting

in Russia, the smart phone sales volume is

The Russian software market grew by 10%

growing faster. Therefore, it can be assumed

in 2012 (the sales of information security solu-

that this year this ratio for the world and for

tions increased even more). In the next years,

Russian markets will be identical. According

the cumulative sales of software companies

to the Euroset the sales of smart phones in

will most likely grow at least by 10% per year.

Russia in the first quarter of 2013 increased

In particular J’son & Partners Consulting

by 34%, and the sales of traditional mobile

experts expect a rapid growth of the mobile

phones reduced by 24% (in comparison with

application market. By 2016, it will increase 8

the same period of the previous year).

fold and will reach $1.3 billion.
The ratio between smart phones and
traditional mobile phones sold in Russia is

The sales of smart phones will be promoted by
the launch of 4G networks (LTE). In this sphere,

still not in favor of smart phones. In the first

Russia’s lag behind the economically devel-

quarter of 2013 their share was 40%. For the

oped countries is not really great. According to

23
Chapter 1 / Russian IT Market in 2012
14.	 Russian market of cellular communication and of mobile phones
Indicator

Time

Absolute value

Share of sales of
the LTE technology
supporting subscriber devices

By the results
of 2012

0.6%

Mobile video market

By the results
of 2012

$65 million

By the results
of 2012
By the results
of 2012

Market of mobile
phones (including
smart phones)

Source

Source

J'son &
Partners
Consulting

WapStart
and Openstat

+160%

J'son &
Partners
Consulting

J'son & Partners Consulting

42 million
units (199.1
billion rubles)

+5.8%
(+14.4%)

Euroset
Company

J'son & Partners Consulting

40 million
units (95 billion rubles)

+5%
(+18%)

Svyaznoy
company

J'son & Partners Consulting

+5% (1517%)

MTS retail
network

comScore

By the results
of 2012

Change

Mobile phone availability

March, 2012

91% of population

+13.514%

Public Opinion Foundation

AC&M-Consulting

Netbook or laptop
availability

March, 2012

28% of population

+12%

Public Opinion Foundation

According
to the Obshchestvennoye Mneniye Fund

Smart phone availability

March, 2012

11% of population

Public Opinion Foundation

Tablet computer
availability

March, 2012

7% of population

Public Opinion Foundation

J’son & Partners Consulting, in 2012 the share

lutions, equipment, and services in the trans-

of sales of the subscriber devices that support

port segment) was 15 billion rubles (about

the LTE technology in Russia comparing with

0.5 billion US dollars) that is 25% more than

the global sales was only 0.6%, but by 2015 it

the year before. GLONASS predicts its qua-

will increase up to 2%.

druple increase – up to 60 billion rubles ($2

The volume of the Russian mobile video
market in 2012 was $65 million (according to

billion) in 2013.
By IDC estimates, the Russian market of

J’son & Partners Consulting). Expectedly, it will

cloud services is growing approximately by

reach the level of $344.8 million by 2015.

50% per year.

J’son & Partners Consulting predicts that

The ICT market share in Russia’s GDP did

within the next three years, the sales of tablet-

not change considerably and has remained at

computes in Russia will grow 2.3 times and in

the level of 4% in recent years.

2015 it will reach 5.8 million devices.
Last year, the volume of the Russian
navigation market (the sales of systems, so-

24
Chapter 1 / Publications on High Technologies in Russia in Foreign Mass Media

Publications on High Technologies
in Russia in Foreign Mass Media

W

hen it does not come to

By 2012-2013 such secrecy faded in

political things, foreign

importance. Usage of the «Made in Russia»

journalists usually look

slogan in marketing is not unambiguously de-

with favor on Russia here

sirable yet (especially in the leading Western

and now and perceive it

countries, i.e. in the markets on which Rus-

as a country where globally competitive solu-

sian software companies are mainly focused)

tions and technologies may appear. However,

but it is not as risky as it used to be a few

only a few years ago the situation was abso-

years ago.

lutely different. The analysis of leading mass

That drastic change of mood happened

media publications was suggesting that the ar-

two years ago. Then, the share of scientific

ticle writers often thought of Russia as a huge

and technical publications that provided

territory with oil derricks, vodka making facto-

relatively positive information about Russia

ries, and missile pits. Even the availability of the

exceeded the level of 50% and reached 66%

frightening military industrial complex, which

with a significant increase in the foreign mass

seemed to testify the Russians’ capability to

media interest towards the Russian hi-tech

solve the most challenging technological tasks,

economy sector. For all the previous years

hardly influenced the extremely show-me at-

(until 2011) there were approximately one and

titude of ordinary people towards the «Made

a half times more negative publications than

in Russia» text on a shrink-wrapped software

positive ones. Last year we made a tentative

product. Because of this, Russian software

prognosis that this turn was most likely natu-

companies who wished to sell software to a

ral and irreversible despite some decrease in

wide audience of foreign consumers, avoided –

the foreign press loyalty index (from 66% to

by all means and whenever possible – drawing

59%). The results of mass media monitoring

attention to the country where solutions were

for the last 12 months showed that this con-

originated. They often operated at a foreign

clusion was correct: the number of publica-

market on behalf of their local subsidiaries,

tions that positively influenced the image of

who were selling their alleged own product

Russia considerably increased in comparison

without reference to Russian developers.

with the previous year.

25
Chapter 1 / Publications on High Technologies in Russia in Foreign Mass Media
15.	 Character of publications in foreign mass media (analysis results
for two periods: from April 1, 2011 to March 31, 2012 and from
April 1, 2012 to March 31, 2013)
Impact on Russia's image

Out of all publications

01.04.201131.03.2012

01.04.201231.03.2013

Positive

57%

70%

Negative

43%

30%

The analysis was only performed based

but this year we changed timeframes and

on publications describing the hi-tech

selected publications from April to March. In

economy sector and, first of all, the soft-

this regard, comparison with the last year’s

ware development industry. The search was

research results is not so absolutely correct.

performed within a number of specialized

Therefore, this year we have done job twice –

editions and in the media resources which are

we recalculated the number of articles within

the most popular in the world and in separate

two periods: from April 1, 2011 to March

continents. And we were hunting for two key-

31, 2012 and from April 1, 2012 to March

words only – Russia and Software. Messages

31, 2013. That is, 2011-2012 publications

and reviews not directly related to the high

were analyzed repeatedly but with different

technologies were peeled apart. The list of

search parameters. It is worthy of note that

monitored mass media included the following

the discrepancy between the received loyalty

25 resources: Asia Times, BВC, Business-

indexes for closely resembling time periods is

Week, CIO Magazine, CNET, Computerworld,

insignificant – 2% only (57% instead of 59%).

The Independent, eWeek (PC Week), Finan-

The result of publication content analy-

cial Times, Forbes, Global Services magazine,

sis for the last two years testifies that the

The Hindu, IT Europa, InfoWorld, Information-

share of articles that positively influence

Week, Linux Magazine, MacWorld, Network

the image of Russia increased from 57% to

World, The New York Times, PC World,

70%. Most likely, such significant increase is

REUTERS, TechNewsWorld, The Washington

explained by two main reasons. The first is

Post, The Wall Street Journal, and ZDnet.

connected to the recently observed fact that

Due to a huge increase in the number of
publications under consideration, we had

our companies and officials finally began to
provide information to foreign mass media

to significantly reduce the search range.

more actively. This credit is due to the Rus-

Moreover, there was a time offset. Ear-

sian export companies, government officials,

lier, we selected publications from June to

sub-governmental structures, and industry

July of the next year (or from May to June),

associations. The second main reason is a

16. Distribution of publications negatively influencing the image of Russia, by edition type
From April, 2011 to
March, 2012

From April, 2012
to March, 2013

For two years (from April, 2011 to March, 2013)

Specialized publications

Business and
general political publications

Specialized
publications

Business
and general political
publications

Specialized
publications

Business
and general political
publications

49%

51%

60%

40%

54%

46%

26
Chapter 1 / Publications on High Technologies in Russia in Foreign Mass Media
decrease in the number of events connected

17.	 Rating of editions by number of publications for the period from
April 1, 2012 to March 31, 2013

to technical failures, which negatively affect
the country’s image.
It is important to note that the total num-

1

ZDnet

25

increased by 8%. The growth did not turn out

2

eWeek (PC Week)

21

to be as great as a year before (then, it was

3

PC World

21

4

TechNewsWorld

19

5

InfoWorld

18

6

InformationWeek

18

7

Forbes

13

were far from participation in political games.

8

MacWorld

11

It was also the case for the mass media of

9

BusinessWeek

10

attitude in to Russia. Now this rule does not

10-11

Computerworld

8

work any longer. Moreover, when analyz-

10-11

Financial Times

8

ber of publications about high-tech Russia

93%) but considerable enough to be mentioned.
A few years ago there was a consistent
pattern: positive publications favorable for
Russian software companies’ export appeared mainly in the specialized editions that

countries that assumed, at least, a neutral

ing publications over the past 12 months, it
became clear that for the first time negative
publications appeared more often in special-

18.	 Rating of editions by number of publications for the last two years
(from April 1, 2011 to March 31, 2013)

ized high-tech editions than in business and
general political editions (60% versus 40%).
Such ratio will hardly remain in the future.

1

ZDnet

44

Nevertheless, at present it is fair to say that

2

PC World

44

between specialized editions and business

3

eWeek (PC Week)

37

ones have been blurred out. The two mass

4

InfoWorld

37

indicators – by number of editions included

5

Forbes

36

in our analysis, by number of publications,

6

TechNewsWorld

26

by share of articles with a negative attitude

7

The Hindu

18

8

BBC

18

9

Financial Times

17

10-11

Computerworld

15

10-11

BusinessWeek

14

the distinctions that were earlier observed

media types show approximate parity by all

towards Russia. The deviations are accidental
or temporary.
All conclusions drawn above only concern
those articles and reviews that refer high
technologies. Publications on other subjects
(for example, about political events) contain
much more negative than positive that is

and in the European markets. Some Russian

certainly not favorable for promotion Russian

companies also take the leading positions in

software products and software development

these markets irrespective of the content of

services in foreign markets. However, it is not

western mass media publications about Rus-

worth overestimating the importance of nega-

sia. Kaspersky Lab manages to dominate not

tive articles. For example, China is presented

only in the US corporate’ but even in the retail

in western mass media as an even more non-

market. In Germany, the Russian antivirus

democratic state but it does not disturb suc-

developer steadily heads the list, after having

cessful promotion of Chinese goods in the US

beaten the local G-Data to the second place.

27
Chapter 1 / Publications on High Technologies in Russia in Foreign Mass Media
19.	 Top-10 most loyal editions for the last 12 months (01.04.2012-31.03.2013)
Share of positive publications about Russia

Total number of publications

1

BusinessWeek

100%

10

2

The Hindu

100%

6

4

REUTERS

100%

5

5

Financial Times

88%

8

6

Forbes

85%

13

7

MacWorld

82%

11

8

Asia Times

80%

5

9

Computerworld

75%

8

10

ZDnet

72%

25

* Only editions with at least 5 publications per year are included in the table

20.	 Top-4 most disloyal editions for the last 12 months (01.04.2012-31.03.2013)
Share of negative publications about Russia

Total number of publications

1

InformationWeek

56%

18

2

PC World

48%

21

3

InfoWorld

44%

18

4

TechNewsWorld

42%

19

* Only editions with no less than 5 publications per year are included in the table

21.	 Top-5 most disloyal editions for the last two years (from April 1, 2011 to March 31, 2013)
Share of negative publications about Russia

Total number of publications

1

InformationWeek

61%

28

2

InfoWorld

51%

37

3

Network World

50%

10

4

TechNewsWorld

50%

26

5

PC World

48%

44

* Only editions with no less than 8 publications for the last two years are included in the table.

In Spring 2013 IDC awarded Kaspersky Lab
with the title “leader” in the Endpoint Security

Apparently, western consumers are pragmatic and mostly evaluate quality and price

protection solutions for large business, fol-

instead of an exporting country’s «democratic

lowing results of the comparative analysis of

character» and «friendliness» in the mass me-

vendors in the West European market.

dia coverage. In the USA, after the one more
exacerbation of relations with China, attempts

28
Chapter 1 / Publications on High Technologies in Russia in Foreign Mass Media
22.	 Top-10 most loyal editions for the last two years (from April 1, 2011 to March 31, 2013)

Share of negative publications about Russia

Total number of publications

1

The Hindu

89%

18

2

REUTERS

89%

9

3

MacWorld

85%

13

4

Forbes

83%

36

5

BusinessWeek

79%

14

6

Financial Times

76%

17

7

Computerworld

67%

15

8

eWeek (PC Week)

65%

37

9

ZDnet

61%

44

10

BBC

61%

18

* Only editions with no less than 8 publications for the last two years are included in the table.

to launch Chinese goods boycott campaigns

InformationWeek, PC World, and InfoWorld

are periodically made but, as a rule, they

were the most disloyal ones. It is remarkable

turn out to be unsuccessful. Thus articles

that editions that publish the most negative

that show possibilities of creating quality hi-

materials about technological Russia have a

tech solutions in Russia are more important

very small number of publications. Most likely,

for promotion of the Russian products and

it reflects the fact that their warped concep-

services than negative publications about the

tions are connected to a lack of information

political situation.

about Russia. More active work with such edi-

At the end of 2012 Wired (US edition) put

tions may considerably improve the situation

Evgeny Kaspersky on the eighth place in the

with their negative publications. Such work

list of the most dangerous people in the world.

can be carried out, for example, in lending the

The resource explained its choice by partici-

state support to the international marketing

pation of Kaspersky Lab (Evgeny Kaspersky

activity of Russian hi-tech companies. How-

is the founder and the head of the company)

ever, individual companies can also improve

in neutralization of virus attacks against the

the situation by working more closely with the

Middle Eastern countries. It is unlikely that

most disloyal editions.

even such invective may negatively affect the

The majority of publications about Rus-

Kaspersky Lab positions in the US market.

sian high-tech in foreign mass media were

Moreover other US mass media did not sup-

connected to the information security. At the

port Wired.

same time, the share of this subject contin-

Editions whose content we have analyzed
in this research considerably differ from each

ues to increase in the last three years. Thus
foreign readers may begin to think that other

other by their attitude towards Russia. The

IT directions are neglected in Russia – al-

greatest attention to the Russian hi-tech

though it is not true. However, similar distor-

sector was paid by ZDnet, eWeek, and PC

tion is natural. Firstly, it is explained by the fact

World. Following results of the last 12 months

that the mass media pay special attention to

BusinessWeek, The Hindu, and REUTERS

information security (to threats and revealed

can be considered as the most loyal editions.

vulnerabilities). Secondly, Russian companies

29
Chapter 1 / Publications on High Technologies in Russia in Foreign Mass Media
23. Publications by subject area

that are engaged in information security matters more actively communicate with foreign
Share for the
period from
April 1, 2012 to
March 31, 2013

Investment attraction,
merges and takeovers,
cooperation

Growth (+)/reduction (-) of
the number of
publications

4%

-44%

mass media still consider Russia (along with
China) to be the largest source of cyber
threats (which reflects an artificially created
enemy image rather than the real situation).
However the share of publications about the

Space

4%

-65%

Conditions for hi-tech
business in Russia

2%

-69%

Activities of Russian
developers and
scientists

16%

+21%

Information security

70%

+35%

GLONASS

1%

+50%

Other

journalists than others. Thirdly, the western

Russian cyber threat significantly reduced
over the last 12 months. From now foreign
mass media are frightening their citizens with
the Russian bugbear far less frequently.
Dr. Web was most mentioned in the foreign mass media for the last 12 months. Most
likely this company’s leadership is temporary.
The leadership is connected to the fact that
Dr. Web experts managed to identify vulnerabilities in the globally popular software, and

3%

this fact raised the interest of the world mass

24. Russian companies most mentioned in foreign mass media
publications for the period from April 1, 2012 to March 31, 2013
(the number of publications with reference)

media to the company and to its experts. Almost all articles that mentioned Dr Web were
published within 2-3 months.
The second place of Kaspersky Lab (the
largest Russian software product exporter) is

1

Dr. Web

52

2

Kaspersky Lab

35

was caused by several events – as well as

3

Yandex

12

journalists’ resort to its expert estimations.

4

Group-IB

6

5

Positive Technologies

4

surely look forward to new publications about

6

Parallels

4

it in the future.

7

ElcomSoft

3

8

i-Free

2

media interest towards this company. Other
Internet companies are mentioned much

more natural as the reference to the company

This company was among the leaders in
this rating in prior years as well, and we can

The third place of Yandex is connected to
their recent IPO that increased foreign mass

9

Pirate Pay

2

10

Yota

2

Odnoklassniki – just once each). Totally for-

11

Elbrus Technologies

2

eign journalists noted 20 Russian companies,

12

Luxoft

2

some of which are mainly oriented towards

13

VKontakte

2

30

less often (f.ex. Mail.Ru, X-Cart, OZON, and

the Russian market.
CHAPTER 2
VOLUME AND STRUCTURE
OF RUSSIAN SOFTWARE
EXPORT

31
Chapter 2 / Volume and structure of Russian software export

T

his year, we verified our previ-

development services export. As a quite

ous estimations on the Russian

representative sample (100-150 companies)

software export and made some

was used we could objectively assume that

adjustments. The matter is that

the results of measurements and calculations

when we started our research

were quite realistic.

in 2004 there were no reliable data on the
sales volumes of both software and software

However, after 10 years of surveys such
technique could lead to essential deviations

development services (within Russia and

because of the existing error. This error is

for export). We selected groups of known

not critical as the main research objective

companies which represented different seg-

is the identification of trends (in particular,

ments of the industry (providing IT services,

export growth acceleration or deceleration,

selling proprietary software, offering services

in general and by separate types) as well as

for creating and managing R&D centers) and

assessment of the total amount of Russian

extrapolated data which was obtained by

software export). There is a strong possibility

the polling of these companies to the whole

that the real value deviation was less than

industry. The extrapolation was made for

10-15%. However, it is necessary to revise

each segment depending on the assessment

the calculation procedure periodically so that

of share sizes which was prepared by known

this deviation would not exceed the allow-

experts from companies in each segment.

able value.

Further we verified the input against the

Another important stimulus for adjusting

previous year’s export volume multiplied by

the last 10 years the pyramid of the software

ceived based on respondents’ answers). In

development industry was completely con-

case of marginal differences (less than 10%)

structed and by now it precisely reflects the

we took the extrapolation result as this year’s

80:20 law (when 20% of the total number of

official volume of software and software

32

the estimation technique was the fact that for

the estimated value of export growth (re-

market players produce 80% of sales volume).
Chapter 2 / Volume and structure of Russian software export
Considering these two factors, this year’s

sia. It is supposed that about one and a half

calculation of the total export volume was

thousand Russian companies are software

verified through comparing it to the direct ad-

exporters (i.e. the companies that have at

dition of the export volume data of all largest

least 1% of their income from sales outside

Russian software developers that sale their

Russia, for example, in Belarus or Ukraine).

services and products abroad. Performing

In the RUSSOFT database there are about

of such an addition is a nontrivial task as the

1400 companies that are mainly exporters.

majority of the software export companies

However, this database requires regular re-

(especially software vendors and foreign cor-

plenishment taking into account a big number

porations’ R&D centers in Russia) historically

of newly born startups for the last 2-3 years

do not tend to disclose their financial data. A

(over 100 apart from Internet companies).

lot of companies even made a secret out of

According to our assessment, at least

their consolidated revenues, not to mention

2300 software companies actually operate in

the income related to sales in foreign markets.

Russia. Very probably there are considerably

However, Russian software companies

more such companies (by several hundreds)

and foreign corporations’ software develop-

in reality. In this case (as well as in other

ment centers eventually disclose some data on

cases when we did not have enough actual

their sales volumes or on the number of staff

information) the most conservative estimates

(sometimes, under the nondisclosure condi-

were used in our calculations. Therefore, any

tion) that allows correcting the previous cal-

overestimation of cumulative software export

culations. For example, some of them provide

which is following the results of our research

information to Russian and foreign compilers

is improbable. Most likely there is a small

of software and hi-tech company ratings that

underestimation.

allows us to obtain source information, which
is vital for validation of our calculations.
If a company conceals its turnover, it can

As a revision of the estimation procedure
was done this year, we should remind the
content of the basic concepts used in the

be assessed based on the information on

research:

the number of the company’s employees. By

• under the volume export we consider all

this indicator and considering the company’s

Russian software companies’ cumulative

unique features (its specialization, state and

income that is gained in foreign markets

size of office premises, types of solutions and

(including the markets of the near-abroad

services, contracts signed and investments

countries, even if many software develop-

made) the company’s approximate consoli-

ers do not consider sales in the CIS as

dated revenues can be determined. On the
official websites (including those in English),

export);
• Russian companies with the main develop-

some companies place enough data to get

ment centers situated in Russia which

an idea of their turnover and export income,

gain the major portion of added value

as well as to estimate their dynamics within

thanks to their own software develop-

the year. Thus, we obtained information

ment are considered as Russian software

(additional or basic one) about 50-60 largest

companies;

Russian software exporters which provided
about 80% of export.
Small developers’ export was calculated

• final products of some companies can
also be hardware (terminals, simulators,
special recorders, etc.) but their basis

by extrapolation according to available data

functionality is being assured up by their

from the respondent companies (there were

own software.

more than 100 small companies in the total

Collection of information on the turnover

sample) taking into account their share in the

and the export volume of 60 leading software

total number of such companies in Rus-

companies was made by the results of 2012,

33
Chapter 2 / Volume and structure of Russian software export
most likely at the level of 2012. According to

25. Software export volume in 2002–2014, $ billion
2002

345

2003

2004

2005

2006

forecasts, the share of software products and
2007

0,53

0,74

0,95

1,41

2,15

+55%

+39%

+28%

+49%

+52%

of foreign corporations’ development centers’
services will be still growing, while the export
of licensed software will grow the fastest.
In the current conditions the return to
the growth rates of 40–50%, which were
observed earlier at the low initial base, is
improbable. Nevertheless, the industry still

2008

2009

2010

2011

2012

2013*

2014*

has a potential for growth in the next several

2,6

2,75

3,3

4,0

4,6

5,4

6,2

small acceleration up to 30% in some years)

+21%

+5%

+20%

+22%

+15%

+16%

+16%

years at the level of 20–25% (with a possible

* forecast

and comparison with the previous research
results – according to the information of 2011,
which was calculated based on the data of
2012 and the index of export volume growth
in 2012.
The revision of the calculation procedure
did not lead to any essential correction of the
indicators of aggregate software and software
development services export. It became clear
that in 2011 software development services
export was slightly overestimated. It was not
$2 billion but $1.9 billion. The corresponding
indicators for software products were revised
upwards – from $1.6 billion to $1.7 billion.
The volume of exported services of foreign
corporations’ R&D centers seems to be the
same or a little bit higher. Cumulatively there
was an increase in the total amount of Russian software export by $30-$50 million that
is comparable with the error of measurement.
Following the results of 2012, Russian
software sales reached $4.6 billion that is
nearly 15% more than the year before. The
level of $5 billion was not exceeded, while according to the last year’s forecasts the export
index would have expected to reach $5.1
billion with 26% growth. The calculations
were performed on the basis of respondent
companies’ expectations at the beginning
of 2012, but the world market recession affected implementation of the export income
growth forecasts.
The growth rate of the software development services export in 2013-2014 remains

34

in case the world economy will recover. Thus,
an increase may be predicted by all export
segments: software products, software development services and R&D services of foreign
companies’ development centers.
However, it should be noted that the
current achievements were gained without
significant state support. This support came
into being in recent years (first of all, in form
of State grants to startups and of financing
to prospective R&D). It may seriously affect
the export growth rates if the support to the
international marketing of software companies is added.
Another important reserve of the industry’s export growth is the state support in the
form of elimination of administrative barriers,
first, in the customs’ and currency regulation,
as well as in financial accounting.
The effect of this support shall not be
only considered from the point of view of tax
payment receipt and employment growth.
The increase in the software export allows to
diversify the Russian economy and to reduce
its dependence on fluctuations of the world
prices for raw materials. Software exporters gain the competences and knowledge
abroad that will be used by them to work in
the Russian market. Upgrade of outdated
sectors of traditional economy in Russia is
impossible without Information Technology. It
is also necessary to consider that all modern
hi-tech economy sectors depend on software.
More high quality developers with experience
of successful global competition are in Russia, the higher are chances to create globally
Chapter 2 / Volume and structure of Russian software export
26.	 Software export distribution according to export revenue sources

55
51

50

50,5

48

45,5

41

40

43,5

40

37
30

30

20

15
12

10

11

2009

2010

11

9,5

0
2008
%

Software development services provided by Development Centers of foreign companies, universities, and research institutes

competitive solutions in any area of innovative
economy.

2011
%

Sale of software products
and ready-to-use solutions

2012
%

Software development services

There is an obvious effect gained as a
result of granting social tax incentives to

In the previous years we witnessed a

software companies (under the Federal law

rule – more companies were focused on for-

No. 212 FZ). Companies that take advantage

eign markets, the higher the turnover growth

of this incentive have increased their turnover

indicators were. This year the indicators of

by 26% and their export volume – by 16%.

companies with different export share in their

For companies that did not use the incentive,

consolidated revenues equalized. The turn-

the corresponding indicators were 10.5% and

over of companies mainly oriented towards

7% (i.e., the growth rates were approximately

the Russian market increased slightly more.

twice lower).

An opportunity to carry out sales in
various countries ensures stable company

It should be noted that the export companies’ turnover growth was 21.2% with

development during economic crises. When

an increase in their export revenue by 15%.

stagnation of Russian economy is overcome,

Thus, according to IDC in 2012 the Russian

an increase in sales in the fast-growing

software market grew only by 10%. It means

domestic software market may be even more

that either the market growth was more

considerable than an increase in export.

than 10% (that is quite probable) or Russian
companies were increasing their share in the

27.	 Income growth of companies with different export shares
Export share

Less than 10%

Less than 50%

Over 50%

Over 75%

Income Growth in 2011

11%

17%

34%

36%

Income Growth in 2012

28.5%

22.1%

20.6%

24.5%

35
Chapter 2 / Volume and structure of Russian software export
28.	 Basic figures characterizing the Russian software industry

Cumulative turnover of Russian software companies (the share in the
Russian GDP)

at least $9.5 billion.

Software export

$4.61 billion

Total size of Russian software companies' staff

at least 120 thousand
people

Staff size of Russian companies' software development centers in
foreign countries

20 thousand people

Total number of software developers

at least 400 thousand
people

Size of the Russian software market

about $5 billion.

Number of Russian software companies

at least 2,300

Number of companies operating for export

about 1,500

domestic market at the expense of foreign

Russian export, that of chemical industry –

competitors. Besides, the difference between

5.6%, that of machinery and equipment is

the IDC and RUSSOFT estimations may be

3.6%, that of aircraft – 0.8%, the share of

caused by the difference of techniques they

cars and trucks is 0.3%, that of arms – 2.9%.

apply. If IDC only considers software sales

The next and quite achievable target for the

(possibly, license sales) we consider the cu-

Russian software industry can be the volume

mulative income of software companies. The

of arms export which reached $15.2 billion by

difference is essential. It is quite possible that

the results of 2012. However, last year there

some mismatch of indicators is explained by

was no essential reduction of the gap to this

the combination of all above factors.

export segment as the growth of armament

Following the results of 2012, the share
of Russian software foreign sales is 0.88%
of all Russian export (a year ago, there was
0.8%) which increased by 1.2% and reached

export and software export was approximately the same (by 12% and 15% respectively).
It is important to note that when the
software export volume is determined we do

$524.7 billion. The share of Russian software

not include here the income of the Internet

is not great yet, but this indicator already

companies, the commercial success of which

comes into view of the Russian government.

is mainly assured by software developers.

Most likely, this share will be growing in years

Earlier, they were mostly oriented towards the

to come. In Moscow and St. Petersburg, the

Russian market and – on a second priority

software export share in the volume of region-

basis – towards the former Soviet Union mar-

al export is higher than the average Russia-

ket. However, for the last 2 years (particularly

wide value – about 2% and 5%, respectively.

after the successful IPO) Yandex and Mail.Ru

Here it is necessary to keep in mind that the

Group began their expansion in the foreign

exporters of petrol and gas, of wood and of

markets. These two companies are the largest

other natural resources are often registered in

Internet companies in Russia, but there is a

the Russian capitals while resource extrac-

great number of others that are also oriented

tion and processing is generally conducted in

towards the foreign audience. If, following the

other regions.
Now, the software industry is quite impor-

results of 2012, the cumulative turnover of
Yandex and of Mail.Ru Group is nearly $1.6

tant for the Russian economy. For compari-

36

billion (by 40-50% more than a year before),

son: the share of foodstuff is 3.1% of the total

the size of the entire Russian Internet econo-
Chapter 2 / Volume and structure of Russian software export
my is $16 billion (according to the data of the

speaking Internet users are citizens of other

Russian Association for Electronic Communi-

states. Based on the available data we can

cations) with the annual growth of about 30%.

assume, that the export volume of the Inter-

In addition, we should take into consideration

net companies that use their own software,

that the boom of Internet companies’ startups

exceeds $1 billion.

began in Russia and many of these companies are initially oriented towards the global

This year, we calculated not only the Russian

market. Therefore, the export income from

software export but also the entire turnover of

Internet services will grow.

the Russian software companies as well as

It is not groundless to consider Internet
companies as software ones, as their suc-

the total number of their personnel.
The cumulative turnover reached at least

cessful promotion in the global market is

$9.5 billion (it is about 0.45% of the nominal

firmly connected to their own new software

GDP of Russia). If we subtract from this vol-

solutions. Therefore, their export income

ume the export income ($4.6 billion) and the

shall be considered as another segment of IT

Russian market income of foreign software

export in the future.

vendors (such as Microsoft, SAP, Oracle,

As these companies can be considered
neither as standard software vendors nor as

IBM and many others – with the total product volume of $3 billion or over a half of the

software development service providers, their

Russian market size), it does not mean that

export revenue shall be accounted sepa-

we will obtain the Russian software indus-

rately. There are serious problems concerning

try’s sales volume.

determination of this value. First of all, it is

A considerable data mismatch is

difficult to identify the export revenue in the

explained by the fact that the cumulative

cumulative income if an Internet company

revenue of the software companies (Russian

mainly earns from the advertizing. Such

and foreign ones) from sales in Russia –

advertizing may be oriented towards both

from one side – and the Russian software

the Russian audience and the audience of

market value determined by the analysts of

Internet users in the near- and far-abroad

IDC and of other similar companies – from

countries. Besides, it is incorrect to sum up

the other side – are not the same. As a rule,

the revenues (such as the export ones) from

analysts generally consider sales of licenses.

advertizing and e-commerce. It is more cor-

However, the software companies’ income

rect to identify it as an online store income

may be gained not only due to sales of

not an entire turnover but only the margin

licenses but also due to sales of hardware

which is not as great for e-commerce as for

that is produced on the basis of the com-

offline commerce. It is essential to decide

panies’ own software and of their software

whether we can consider the revenues that

development services.

were gained by Mail.Ru Group from purchase

Besides, Russian companies’ sales

and sale of foreign hi-tech companies’ shares

predominantly include – in addition to sales

as the export revenue. Last year, according to

of their own software – sales of licenses of

the experts, these revenues were on the level

foreign vendors that provide platforms for

of hundreds of millions of dollars.

development of the Russian companies’

There are a lot of methodical difficulties

software. However, the value of this double

but some estimates still can be done if more

count is not so great in comparison with the

complete information about Internet com-

software companies’ cumulative turnover

panies is available. For example, the export

(most likely it does not exceed $200-300

share can be calculated taking into account

million). The price of using the platform

the proportion of the Russian and foreign

makes one third – one fifth of the cost of the

audience. Presently, about a half of Russian-

system that is delivered to end users.

37
Chapter 2 / Volume and structure of Russian software export
According to our calculation, the number of

more than 400 thousand software developers

personnel of all Russian software companies

work in Russia. It corresponds to the Microsoft

is at least 120 thousand employees including

data, according to which there were about

about 20 thousand people that work in the

350 thousand software developers in Russia in

development centers of Russian companies

2010. For the last 3 years, their number could

abroad. To add, that according to the AN-

increase at least by 15-20 thousand people

CHOR High Technologies recruiting agency,

per year. It is interesting that according to Mi-

only about a quarter of Russian software de-

crosoft, at least 850 thousand of the Russians

velopers are employed in software companies.

have programming skills.

Other developers work in various economy

Figures characterizing the Russian

sectors (in Internet companies, in system
integrators, in banks, in the public sector and

adjusted, but they are quite accurate to

in enterprises of all economy sectors). Totally,

38

software industry most likely need to be
provide a general coverage.
Chapter 2 / Software development services export

Software development services export

I

f in 2010-2011 software development ser-

the turnover in 2011 that contributed an ad-

vices export was quickly growing in order to

ditional hundred million dollars into the service

Export volume: $2100
million.

satisfy deferred demand for services during

industry’s total export volume. Last year,

Growth: about 10%.

the crisis (the growth by 14% in 2010, and

the company’s foreign revenue growth rate

then by 22% in 2011, according to adjust-

remained at the previous year’s level. At the

ed estimations)the growth rates were reduced

beginning of 2012, EPAM Systems capitaliza-

approximately to 10%.The main reason is ob-

tion during IPO at NYSE was $490 million. In

vious – staff shortage and the growth of labor

August 2013, EPAM Systems was already

cost connected with it as service companies

evaluated at $1.22 billion.

are especially dependent on these problems

In June 2013, Luxoft held a successful

in comparison with software vendors. Com-

IPO at the New York stock exchange. For a

panies that could recruit employees in other

long time, Luxoft and EPAM Systems have

countries grew quicker. These are large com-

been at the top of the ratings of leading Cen-

panies with development centers not only in

tral and Eastern European service companies.

various Russian cities but also abroad.
More the company size is, the higher the

During the last years Luxoft’s growth rates
exceeded 20% that alongside with its top

export growth rate is. The largest custom

international ratings was quite sufficient for

software developers have the growth rate at

initial capitalization up to $555 million (that is

the level of 20-30%. Individual companies (for

even greater than the EPAM Systems capital-

example, ICL KME CS from Kazan) managed

ization during its IPO in 2012).

to increase their export by 50% but they still

By the time of IPO holding, Luxoft already

gain over a half of income from sales in the

had the extended geography of its develop-

domestic market, and only in the recent years

ment resources worldwide with the main

they began to operate in foreign markets

development centers in Ukraine (3,000 em-

much more actively.

ployees), in Russia (1,000 people in Moscow

The success of EPAM Systems should be

and Omsk) as well as in Bulgaria, Romania,

particularly noted. The company, following

Vietnam, and even in the UK (18 centers

in steps of Mail.Ru and Yandex, successfully

worldwide).

held the initial public offering at the New-York
stock exchange. EPAM Systems’ preparation

Almost all largest service companies were

for the IPO forced the company to increase

formed before Y2000 and their number

39
Chapter 2 / Software development services export
29.	 Structure of service companies’ export in 2008-2012
Development and support of software
solutions and products

Custom software
development

IT outsourcing

Other

2008

9%

75.5%

4.5%

6%

2009

11%

72%

12%

3%

2010

30%

49%

15%

5%

2011

29%

64%

5%

2,00%

2012

26%

63%

10%

1%

almost did not change during the last decade.

banking sectors. The entry into TechnoServ

Among new market players that recently

Group allowed Reksoft to get access to Rus-

came into the world elite (in the Global

sian projects of national scale that gives the

Services and IAOP ratings) we can mention

company a chance to use its experience and

few players: Artezio from Moscow which

the financial leverage in Russia for participa-

showed persistently high growth rates over

tion in challenging foreign tenders. A serious

the years, specializing mainly in such vertical

candidate for coming into the rating of the

market segments as telecommunications and

world’s leading outsourcing companies is the

health care; and First Line Software from St.

ICL-KME CS from Kazan, which essentially

Petersburg with its president Nikolay Puntikov

surged in terms of promotion of its services in

who should be noted separately as for the

the market and raised its staff size up to 1200

last 7 years he consistently led three compa-

people for the last 3 years. DataArt and Lanit-

nies to thetop-100 world’s leading providers

Tercom are close to entry into the rating of

of IT services (first Star Software, then Exigen

100 world’s leading outsourcing companies.

Services and now – First Line Software). We

Earlier, they were included in various world

should also mention Auriga, which regularly

ratings and successfully developed their

appears in the global rating of the leading ser-

business (software development services for

vice companies for about 10 years. In 2011

banks and for science-driven developments,

Auriga was recognized as the world best en-

respectively).

gineering company in the field of IT (according to the Data Monitor) having outstripped

The foreign sales of relatively small and
the smallest service companies (with the

such giants as IBM, Dell, HP, HCL, Wipro and

turnover less than $4 million) did not grow at

Siemens.

all in 2012 (their export decreased by 0.4%).

As was noted above, MERA from Nizhny

Several years ago large service companies

Novgorod did not come into the 2012 IOAP

mainly grew due to involvement of employees

rating for tactical reasons. It is one of the

from smaller ones. In the last 2-3 years it be-

largest Russian service providers that still

came noticeable that this source ran low, and

place its labor forces (about 2,000 people)

a staff growth is generally provided by univer-

in its hometown only. In 2013, this company

sity graduates and recruitment of employees

expects to move from the “quickly developing”

in their off-shore development centers. The

category to the category of “leaders”. Reksoft

recruitment was especially active in Belarus

gained a foothold in the rating of 100 world’s

and Ukraine where the cost is lower and the

leading service companies; it is focused on

state support of software companies is better

development of large e-government projects

than in Russia.

and on providing export software development services to customers in telecom and in

40

As a rule new companies appeared as a
result of a demerger of formerly well estab-
Chapter 2 / Software development services export
lished exporters. Judging by the fact that small

enced and reliable provider of services that

companies almost do not grow, we do not

add value to the client’s business.

expect any significant increase in the number
of such companies in the next 5 years.
According to the expectations of respon-

This year, thanks to three new questions
added in the survey, we managed to estimate

dents, the growth rates of export in 2013-

the popularity of various customer relations

2014 will remain at the last year’s level (by

models and various types of contracts, as well

2-3 percentage points higher).However, it will
be difficult to stay at this level as there are no
prerequisites for a considerable increase in

30.	 Contract types used, % of respondent companies

supply in the labor market.

Payment
on time
consumed

The service companies’ export structure
almost did not change in comparison with
2011.After an increase in the share of R&D
and software product development services

40%

three years ago there was stabilization, and
now the share of application development is
fixed at the level of 63-64%.

54%

Russian service companies have a strong
lead in the listing of the IT outsourcing service
providers in Eastern and Central Europe,
and together with companies of Belarus and

6%

Payment
on fixed
price

Both types

Ukraine they form a so-called IT outsourcing
Russian-speaking cluster which is the largest
cumulative provider of IT services (software
development services mostly) in Europe.

31.	 Major customers, % of respondent companies
100

Service companies still have a potential for a
further increase in the export revenue, despite

90

88

the current staff problems.
In the both leading IT outsourcing world

80

ratings (Global Services and IAOP) Russian
companies reinforced their standing in 2012
(names of eight Russian companies – Artezio,
Auriga, DataArt, EPAM Systems, First Line
Software, Luxoft, MERA and Reksoft – were
mentioned in different ratings).
As the listed ratings estimate service companies by a number of criteria(including clients’

70
60
50
40
30

assessment of the quality of the delivered IT
services) rather than by their absolute data of

36
29

20

turnover, we can safely state that the Russian IT outsourcing industry has gained a

10

significant world recognition both as a hi-tech
resource for effective development of state-ofthe-art technical solutions and as an experi-

1

0
System
integrator

End customer

Software
developer

Others

41
Chapter 2 / Software development services export
as to determine the major customers that are

The popularity of certain business models and

offered the respondent companies’ services.

contract types is approximately identical for

All these three questions were only meant

large and small companies. End users are the

for service enterprises. As a result it became

major customers of Russian service compa-

clear that services for creation of remote

nies (88% of respondents work with the end

development centers are provided by 10%

users of services). 36% of companies work

of the respondent companies. Other 90% of

on subcontracting, while 29% of respon-

respondents offer their services to external

dents are engaged in provision of services to

customers under the contracts of both types

system integrators. Important to notice that

(Time&material and Fixed price) with some ad-

service companies apply different business

vantage of the fixed price contract model (54%

42

models, showing flexibility and providing their

against 40% for the Time&material model).

customers with the required services.
Chapter 2 / Products and ready-to-use solutions

Products and ready-to-use solutions

T

he growth of software and

Development of separate software ven-

of standard solution export

dors also has certain cycles. For a few first

continued in 2012 with 17%

years (probably, decades) they can increase

growth rate (still in 2010 it was

export by 30-50% per year. In occasional

30%, then – 20%, and last year –

Volume – $2 Billion.

years the growth even may exceed 50%.

17%). Deceleration in growth is also typical for

However, deceleration inevitably takes place

software development services. However, it

when product companies reach a certain size

only revealed itself in 2012. Thus, the reasons

and their market segment saturation. In the

are absolutely different.

Export growth – about
17%.

last 2-3 years all leading Russian software

Staff shortage is the main roadblock for

vendors reached this size, while fast-growing

service companies. Labor force shortage

younger companies still have not achieved

also affects software vendors, but to a lesser

such large turnovers to compensate the

extent because in many cases they can

reduction of leaders’ growth rates.

increase export by means of active marketing

The state support of international market-

and creation of an extended sales infrastruc-

ing activity could significantly facilitate faster

ture abroad.

promotion of young companies’ development

The main reason of the deceleration in

at offshore markets, but this support is so

software export growth is a cyclical pattern of

insignificant that cannot exert noticeable influ-

the startup creation and of their development

ence on the volume of software product export.

process in Russia. New software companies
were most actively created in certain time

There are all preconditions for an increase
in software product export growth rate (or

periods (for 3-4 years each period) during

at least for retention at a rather high level

economic crises or just after them. A number

of 15-20%). All recent years the Russian

of successful software vendors first appeared

development of mobile applications (including

during the Soviet economy collapse. The next

computer games for mobile devices) is rapidly

startup boom took place in the late 1990th

growing. Companies that specialize in such

and early 2000th (in 1998 there was a default

development are still very young and, as a

and economic crisis in Russia). The third

rule, do not enjoy wide visibility. Nevertheless,

wave is connected with the world crisis of

their quantity is already so great that it makes

2008, which also heavily affected the Russian

possible holding of large-scale conferences

economy.

on mobile applications and games in Russia.

43
Chapter 2 / Products and ready-to-use solutions
Such companies are practically not cov-

as the one capable to pay back the huge

ered by the surveys that are carried out by

investments and to bring a notable economic

the RUSSOFT Association. This may be due

effect. However, the failures to launch rockets

to the fact that many of them are startups

with communication satellites that would

which are being included in the Association’s

have allowed the system’s full use in the near

database of software companies with a delay

future, created some uncertainty concerning

of several years. Besides, the developers of

the perspectives of the system commercial

Internet computer games and applications

use. Most likely, an increase in the volume of

often do not position themselves as software

services involving traffic and cargo tracking

companies and, therefore, are not included in

based on the GLONASS system will remain,

the above base, as well.

but it will be not as high as it could have been

The sphere of mobile application devel-

on condition of planned implementation of the

opment is still under-explored. We can only

global project on GLONASS satellite group in

assume that export of such applications most

the redundant operation mode.

likely exceeds $200 million. According to the

An additional gain of export may be

J’son & Partners Consulting experts’ forecast,

ensured by sufficiently large Russian software

the Russian market of mobile applications

companies that were previously oriented

will reach $1.3 Billion in 2016 that is 8 times

towards the Russian and CIS market. Many

greater than the similar figure of 2012. As

of them plan to work more actively in the

the developers of such solutions are mostly

developed and it the developing countries.

oriented towards the global market we can

Among them, there is a need to mention 1C

assume that their export growth rates will

with the turnover of about $1 billion (including

remain approximately the same (the average

income from software distribution and from

figure is 60-70% per year) and probably will

merchandising). Such turnover may allow for

even speed up. Thus, mobile applications can

investing not only in localization of existing

ensure the annual gain of software export in

solutions in other countries, but also in effec-

the amount of at least $100-200 million. Now

tive and massive marketing and sales of new

their share is 5-10% of the entire product ex-

products in various countries. Besides, 1C

port but it can increase considerably depend-

has extremely successful experience of sales

ing on the global demand.

organization involving partners (franchising)

Certain hopes are pinned on development
of the Global Navigation Satellite System –
GLONASS – applications (it is worth mention-

that can help it to move ahead successfully at
foreign markets.
There are a few mid-sized companies

ing that the similar system in operation is only

that hold promises of promotion in foreign

available in the USA). Thanks to the National

countries of their solutions successfully ap-

system, Russian companies exporting termi-

proved in the Russian market. This promotion

nals and applications (for ensuring monitoring

is, in particular, supported by their inclusion

of moving targets on Earth and processing of

in so-called Magic Quadrants of Gartner. The

relevant information) have gained certain ad-

following software vendors appeared in the

vantage over foreign competitors. For example,

Quadrants in 2012: Diasoft (“Core Banking

NIS GLONASS plans to get about 20% of

Software” Quadrant), PROGNOZ (“Business

the Indian professional navigation equipment

Intelligence”) and InfoWatch (“Data Loss

market within 5 years; and in the long term,

Prevention”). In 2012 IntelTech from Moscow

the company intends to capture 20–30% of

headed the Gartner’s “Cool Vendors list” of

the global market in this segment with the esti-

the most prospective companies.

mated current capacity of $60–$90 Billion.

Diasoft, which until recently mainly pro-

In 2013 the GLONASS navigation satellite

44

duced solutions for Russian banks, has good

system has for the first time been considered

prospects thanks to the agreement for global
Chapter 2 / Products and ready-to-use solutions
cooperation with IBM (Global Alliance Attach-

The Qiwi processing company began its

ment) signed in 2011. This agreement provides

operation in the USA with delivery of a pilot

joint development and promotion in the global

batch of 100 payment terminals with a pur-

markets of the Russian company’s bank-

pose to define its specific development plans

ing solutions based on the Service Oriented

in the US market.

Architecture (SOA). As part of this agreement,

In the autumn of 2011, Rosoboronexport

IBM will provide its partner with technologi-

and Russian Telecom Equipment (which are

cal expertise, with support of Diasoft projects

a part of the Russian Technologies State Cor-

on optimization and introduction to banking

poration) announced the beginning of their

systems, will assist with implementation of

cooperation in the field of international market

marketing initiatives and worldwide promotion

promotion of integrated automated security

of the Diasoft products. The Russian company

management systems. The most promising

management expects that by 2015, about

regions for the system promotion are thought

30% of the company’s income will be connect-

to be Latin American countries (Argentina,

ed with the operation at international markets.

Brazil, Venezuela, Peru, Ecuador, etc.) and

PROGNOZ is mainly engaged in developing analytical tools and decision making

South-East Asia.
In the spring of 2012 Naumen announced

support systems, which derives the most part

its entry into the call-center market of the

of its income from sales in Russia. In Summer

Asia-Pacific region.

of 2012 they opened its new office in Zambia.

If a few years ago Russian software

The company plans to be engaged into devel-

exporters were mainly oriented towards the

opment of a statistical portal and applications

markets of the western countries, in recent

for the African Development Bank, to create

years they began active promotion of their

statistical portals for Mozambique, Rwanda,

solutions in developing countries where the

and Nigeria. PROGNOZ offices already oper-

IT market is growing very quickly and in many

ate in Beijing, Washington, Brussels, Kiev,

cases is already sufficiently large. Activation

Astana, Dubai, and Minsk.

of operations in these countries ensures one

ASCON, which dominates in the Russian
market of CAD/CAM/CAPP/PDM systems
tries to gain a foothold in the markets of

more source of Russian software product
export growth.
The largest exporters also have opportuni-

developed countries. At the end of 2011 it

ties to strongly increase foreign sales by in-

opened the first representation office outside

troducing new solutions in the global market.

the former Soviet Union. It was established in

For example, Kaspersky Lab is creating its

Munich and is oriented towards the German-

own operating system, which is expected to

speaking countries – Germany, Austria, and

be much safer than the existing analogs. This

Switzerland. The company’s management set

project details are not revealed but it is quite

a task to open the similar offices in all conti-

probable that such system will be in demand

nents in the next 10 years.

in many markets.

45
Chapter 2 / R&D and software development centers of foreign corporations (captive centers)

R&D and software development
centers of foreign corporations
(captive centers)
Volume – $500 million.
Export volume growth –
12%.

I

n 2012 some more international companies

broadcasting. Microsoft’s Russian develop-

started implementing the earlier declared

ment center staff size is expected to reach

plans for creation of new R&D centers in

150 people by 2015.

Russia. Generally, these centers appeared
thanks to the Skolkovo Foundation and

The R&D centers of EMC and Samsung
have been operating for a long time in St. Pe-

to the self-named innovation center being

tersburg and Moscow respectively, but both

built near Moscow. Residents of this center

companies established additional centers at

already receive certain tax incentives. A pos-

Skolkovo in 2012.

sibility of obtaining incentives (first of all, in

T-Systems (Deutsche Telekom’ subsidiary)

taxation ones) supported an increase in the

while expanding the number of developers

volume of foreign corporations’ investment

in its St. Petersburg office, entered the labor

into R&D services in the territory of the Rus-

market of Voronezh, where they already

sian Federation. In comparison to 2011 the

began to recruit programmers and to cooper-

amount of these services increased at least

ate with Voronezh State University within the

by 12% and reached $500 billion.

staff training program. The T-Systems office in

Such powerful corporations as IBM,
Cisco Systems, Microsoft, and SAP were

Voronezh was opened in the autumn of 2012.
Chinese Huawei Technologies declared its

among the active investors in implementa-

plans to increase investments into R&D in the

tion of R&D in the territory of Russia in the

territory of the Russian Federation. Qualcomm,

last 2 years. SAP plans to bring its research

a US mobile microelectronics vendor, started

division staff up to 250 people by 2015, and

sourcing a team that can form the basis of

its R&D investment volume – up to 45 million

creation of its Russian development center

euro. Microsoft plans to develop software in

experts who have experience in application

video, as well as software for multimedia data

46

last year. The company is interested in the

Skolkovo for face and speech recognition in

programming and digital signal processing.
Chapter 2 / R&D and software development centers of foreign corporations (captive centers)
Facebook is also considering a possibility
to establish its R&D in Skolkovo.
The primary and unsolved issue for inter-

ing. Thus, customs duties are applied when
importing equipment. The problem of hi-tech
equipment import could be generally resolved

national R&D centers is serious administrative

by Russia’s accession to the IT Agreement

barriers for import to Russia of hi-tech equip-

within Russia’s accession to the World Trade

ment for software development and test-

Organization.

Examples of foreign corporations which have their own R&D
centers in Russia
Alcatel-Lucent, Allied Testing, AVIcode, Cadence, Design Systems, Chrysler, Cisco Systems,
Columbus IT, Dell, Deutsche Bank, Digia, EGAR Technology, EMC, EMS, Ericsson, Google,
Hewlett-Packard, Huawei, IBM, Intel, InterSystems, Jensen Technologies, LG Softlab, Motorola,
NEC, NetCracker, Nival Interactive, Microsoft, Nokia, Nokia Siemens, Quest Software, RDSoftware, Samsung Research Center, SAP, Scala CIS, SmartPhoneLabs, Oracle (Sun Microsystems), Tagrem Studio, Teleca, T-Systems.

47
CHAPTER 3
MAJOR TRENDS AND
TARGETS IN THE RUSSIAN
SOFTWARE DEVELOPMENT
INDUSTRY

48
Chapter 3 / Major trends and targets in the Russian software development industry

demanded completely different skills and
Andrey Terekhov

financial structures to custom development

Lanit-Tercom, CEO

or classic outsourcing. But now, it seems
to me that a trend of new product development can be clearly observed in practically all
companies. Perhaps somebody realized that,

Many years ago now, I was talking about how

while the creation of new products is a risky

service companies should be performing

business, it is a beneficial one, somebody

research and using this as a basis to develop

had a product that came about without any

new software products. Product development

effort – on the basis of other work, or maybe

is also possible on the basis of the experience

the widespread startup and innovation rage

obtained from custom development, espe-

has also served its purpose. An example at

cially development for international clients. At

Lanit-Tercom is computer stereo vision and

that time, however, young colleagues, even

the creation of a gesture recognition system

in my team, refused to accept this idea,

for the advertising business on the basis of

saying that these were completely different

this, which is already on sale in Europe. I

kinds of business, that product development

believe that this is the right direction.

U

pon considering respondents’

ket are Moscow and Ural region (83% and

answers to questions about

88% correspondingly). St. Petersburg is well

assessment of primary trends

known for the primer aspiration of its compa-

of the software development

nies towards the Global market (65%).

industry for a number of years,

The increase of the companies’ share

we should note a stable increase in the share

which note “Growth of sales via Internet” as

of companies that construe domestic mar-

a priority tendency and main target – is quite

ket growth and export growth as guidelines.

natural and explicable. As in the previous years

Similarly, since 2008 “More active work at the

the greatest focus on growth of online sales is

domestic market” and “Work for export/expan-

peculiar to the Siberian companies (50%).

sion of the marketing network abroad” have

Creation of remote development centers

been most often mentioned as the industry de-

is considered to be the priority target by 60%

velopment tendencies and the business priority

of companies with turnover over $100 million,

targets for a next year. The only exception was

by 29% of companies with turnover from $20

a reduction of the corresponding indicators

million to $100 million, and by 15% of compa-

in 2009 that was connected with uncertainty

nies with turnover from $0.5 million to $4 mil-

caused by the world financial crisis.

lion. There is no company with turnover less

In 2012 a small decrease in the number of
domestic market-oriented companies against
some growth of export-oriented companies

than $0.5 million that is aiming at creation of a
remote development center.
Among business targets that have been

was observed, which is explained by the

identified as additional (“other targets”),

“rebound” (a decrease) of the Russian internal

respondents indicated the following: improve-

IT market in 2012 after a rapid growth in 2011

ment and development or creation of new

which was caused by a deferred demand

technologies (4 respondents) and also launch-

during and after the crisis.

ing of new projects, change of business line,

Regions where companies intend the
most to play actively at the domestic mar-

distribution network establishment (each area
was mentioned by one respondent).

49
Chapter 3 / Major trends and targets in the Russian software development industry
32.	 Main targets of companies development*
2008

2009

2010

2011

2012

More active work at the domestic market

66%

68%

77%

73%

81%

Growth of online sales

22%

31%

28%

29%

36%

Work for export/expansion
of the marketing network
abroad

-

-

47%

52%

59%

Certification of software development processes

8%

13%

12%

13%

10%

Establishment of regional
development centers

7%

12%

13%

15%

15%

8%

8%

5%

Other
* Respondents could choose more than one area

33. Priority areas for the companies’ development in 2013

More active work in the domestic market

55%

Growth of online sales

9%

Work for export/expansion of the marketing network abroad

31%

Certification of software development processes

1%

Establishment of regional development centers

2%

Other

3%

It is indicative that the majority of respon-

Apart from the previously mentioned

dents who noted “other” target consistently

trends, following tendencies were mentioned

mentioned creation of new products and

as secondary ones: domination of internation-

technologies year in and year out. We can

al companies and growth of system integra-

state with certainty that if such target (de-

tion (once each tendency), as well as the

velopment of products and technologies) is

growth of mobile applications in the market

defined as a separate identified target, the

(twice).

number of companies to mention this target
will significantly grow.
Among the major trends – Growth of local

In the recent years, such phenomenon
as purchase of foreign companies by large
Russian software enterprises has become

market kept the leadership, Export growth
ceded the second place to the Growth of

objectives. Remote development centers may

sales via Internet, while Production of licensed

be created on the basis of the purchased

software was growing faster compared to the

company (but by no means always). However,

Providing of IT-servicers.

50

distinct. Such purchases pursue different

acquisition of a new asset abroad is mostly
Chapter 3 / Major trends and targets in the Russian software development industry
34.	 Modern trends in the Russian software development industry
2007

2008

2009

2010

2011

2012

Domestic market growth

71%

44%

49%

54%

51%

58%

Export growth

56%

19%

35%

35%

23%

37%

IT outsourcing growth (IT
infrastructure support)

30%

34%

32%

28%

35%

32%

Growth of direct sales via
the Internet

31%

27%

39%

38%

39%

47%

Market consolidation
(mergers, takeovers, creation of holdings)

61%

21%

35%

30%

25%

31%

Increase in product developments (Box/Licensed
Software)

32%

21%

26%

19%

26%

27%

Growth in development
and adoption of software
solutions (Services &
Solutions)

50%

18%

35%

24%

37%

32%

Increase in custom
software development
(Custom Software Development)

38%

14%

35%

29%

30%

31%

Adoption of quality management systems

38%

10%

21%

12%

20%

24%

Others

-

-

12%

4%

10%

4%

aimed at getting access to new markets and

section dealing with investments this aspect is

to new customers. Later in this chapter, in the

addressed in more detail.

51
Chapter 3 / Quality management system certification

Quality management
system certification

T

he survey attributed particular

reduction in the share of companies having

place for studying the issue of

valid certificates is most likely caused by the

quality management system certi-

accelerated growth of the number of software

fication. It slightly decreased over

vendors resulting in an increase in the share

the past year. The share of companies that

of product companies which do not have

mentioned obtaining the Certificate of Com-

special requirements for quality management

pliance with the international standards (ISO,

system certification.

CMM, and CMMI) among their main objec-

The share of the companies that plan to

tives declined from 13% to 10%. The share

obtain certificates in the next two years has

of companies that possess at least one such

considerably reduced. If there were 46% such

certificate decreased from 36% to 26%. The

companies among the respondents that did

survey results for several years showed that

not possess the certificates a year ago, this

this indicator fluctuation within 5% can be

year there are 27%. Considering this share

explained by the error of estimate. However,

of all respondent companies, the figure was

proper allowance must be made for the fact

reduced from 29% to 27%.

that the share of service companies among

It is obvious that companies (especially

the respondents was considerably reduced

small ones) are more realistically estimating

in this year while software vendors need the

their chances to go through expensive certifi-

ISO, CMM or CMMI certificates to a lesser

cation and the benefits of certificate issuance.

extent than the enterprises that specialize in
custom software development.
One of explanations of the decrease in

According to the interviewed experts, the
issue of establishing a quality management
system in the software development com-

interest in certification is the fact that all large

panies in Russia lost its urgency 5-7 years

service companies had been certified in the

ago. Practically all companies have their own

years 2000+ (Russia takes the leading place

quality management systems to a varying

in Europe by the number of certificates on

participate in the international tenders with

est levels (4 and 5)). At the same time, the

52

degree. For those service companies, which

compliance with the CMMI standard high-

formal requirements for availability of CMMI
Chapter 3 / Quality management system certification
certificates, this problem is resolved by the

35. Share of companies certified to international standards

regulatory certification. All product companies
and small service providers content them-

2008

2009

2010

2011

2012

Not certified

65%

61%

69%

64%

74%

ISO

31%

31%

29%

35%

24%

CMM

0%

7%

3%

3%

1%

CMMI

4%

7%

2%

6%

6%

selves with ISO or implement their own quality
management systems based on ISO and
CMMI, but not requiring expensive procedure
of certification and its confirmation.
The state support in this field is insignificant, so most of the companies are not
aware that in the competing countries States
are strongly interested in the quality management system certification of domestic companies. Therefore, the respondent companies
in Russia are either satisfied with this support
(37%) or assess it with the failing grade
(57%). The estimates of the state support for

*- more than 100 % overall because some companies have been certified
for compliance with more than one standard

36. Evaluation of the State support
for international certification

certification practically have not changed in
comparison to the last year.
In 2007 the first authorized (and later –
certified) CMMI Expert appeared in Russia,
and in 2009 – the first Russian-speaking Lead
Appraiser (that still remains the only one).
This fact only led to a short-term and small
increase in the number of certified companies
as the share of the Russian experts’ services
cost in the total assessment and certification
cost is not great enough to have a serious
bearing on the certification cost.

Low

Satisfactory

Good

2009

56%

40%

4%

2010

78%

21%

2%

2011

57%

41%

1%

2012

57%

39%

4%

* more than 100 % overall because some companies have been certified for
compliance with more than one standard

53
Chapter 3 / Investment promotion

Investment promotion

T

he share of companies that
attracted investments in 2009-

This year, as well as a year ago, about a
quarter of respondents plan to attract invest-

2011 almost was not changing

ments in the following 2 years. According to

from year to year. Following

the Russian Venture Company (RVC), more

results of 2012 we need to

and more investment funds appear in Rus-

notice that for the first time after the corre-

sia every year and the volume of available

sponding questions appeared in the survey

investment resources grows respectively. For

the indicator has increased (from 9% to 12%).

the last two years, the volume of bond funds

Such increase looks natural considering the

doubled annually and by the beginning of

fact that last year the share of respondents

2013 it reached about $6.8 billion. The num-

that planned to attract investments in 2012

ber of funds has exceeded 150. According

and 2013 increased (from 16% to 24% and

to RVC, considering the venture market as a

from 18% to 24%, correspondingly). It is also

whole, 70% of transactions of these funds fall

natural that not all companies managed to ef-

on the IT industry. The total amount of trans-

fectuate their intents. However, as the number

actions in 2012 was about $1 billion.

of companies planning to attract investments

For the last two years, investments were

had grown, the number of those that man-

most often attracted by relatively small com-

aged to do that has also increased.

panies with the turnover from $0.5 million to

37. Share of companies that attracted (or plan to attract) investments
30

26
24
20

10

18

25

12
9

9

2010

2011

0

54

2012

Last year

%

16

%

This year

%

Next year
Chapter 3 / Investment promotion
$4 million. Last year, 15% of such companies

9%, respectively). However companies that

managed to get external financing. Among

are equally specialized in both – development

the software development companies with

of custom software and in development of

the turnover over $100 million there are even

standard solutions – were most successful in

more such respondents – 40% (but this

attraction of investments in 2012 (31%).

category only included five companies, and

Although some business owners com-

significance of random factors with such

plain that they cannot find financing for their

quantity is great). Besides, a year before,

projects or ideas, the majority of venture

only one tenth of companies with turnover

investment experts consider that in Russia

over $20 million attracted investments (then,

there is more money than high-quality proj-

companies with turnover over $100 million

ects. For example, according to the Russian

were not selected in a separate group). Thus,

Venture Company (RVC) the relation between

the largest companies do not plan to attract

the volume of available funds and the annual

external financing in 2013-2014. As a rule,

volume of investment in Russia is calculated

they do need investments and the amounts

as 7:1. However, experience of investment

in question are interesting for serious venture

fund operations has proven that the optimum

and investment funds (tens of millions US

ratio is 4(5):1.

dollars). Most likely large companies either do

The reason is that there are still many

not want to declare publicly their activities for

projects that are good from the standpoint

attraction of investments considering this to

of technology development but are poorly

be a private matter or they expect to reach
the initial public offering (IPO) by their own
efforts.
Venture funds begin their operations in

“packed” from the viewpoint of business plan
and marketing. It is understandable considering that the opportunity to attract investments
with the wide range of startups appeared

the Russian market mainly in Moscow and St.

actually 2-3 years ago. The Russian market of

Petersburg. Therefore, it is logical to assume

venture investments has sprung up recently

that most of companies that managed to

(in many respects thanks to such State devel-

attract investments are located in these cities.

opment institutions as the Skolkovo Founda-

This assumption is fair concerning Moscow

tion and RVC) and it is natural that not all but

(last year almost one fifth of respondents

just a few first-time entrepreneurs know how

from the capital had external financing). St.

to attract these investments. Therewith, there

Petersburg has shown the lowest result the

are not enough those who can share their

second year in a row – only 3% of companies

successful experience.

from this city attracted investments. There are

The ability to prepare high-quality projects

12% of such companies in the regions which

is changing but not as quickly as the volume

have just started being interesting for inves-

of venture investments is growing. According

tors. At the same time St. Petersburg compa-

to the MoneyTree (Venture Market Navigator

nies plan to attract investments in 2013 and

research carried out by the PwC Technology

2014 more often than others (32% and 30%,

and Innovation Center and RVC) the total

respectively). One could say they transfer IP

amount of venture investments in the Russian

to and find investments in other jurisdictions.
Companies that are mainly oriented

market in 2012 was $910.6 million, which
was obtained as a result of 201 transac-

to the Russian market manage to attract

tions (taking into account transactions only

investments more often than those that gain

with undisclosed cost). The majority of the

the most part of their income from export

attracted venture investments still – like a year

(13% and 10%, respectively). Besides the

ago – fall on the IT sector. Companies from

software vendors have a small advantage in

this sector attracted $792.1 million in 2012

comparison to service companies (12% and

which is twice more than in 2011.

55
Chapter 3 / Investment promotion
The double growth of venture investments

RVC and PwC predict that in 2013 the

has been reached even though the share of

growth rates of venture investments will

the software exporters that obtained invest-

decrease. However, the market is still far from

ments has only increased by one third. This

saturation. So, an increase in the volume of in-

implies a growth of the volume of invest-

vestment by tens percent per year is still pos-

ment per company. According to MoneyTree

sible even if the double growth would not be

Venture Market Navigator, the venture deal

retained. Following the results of 2012, Russia

average cost in the IT sector increased from

has taken the fourth place in Europe by the

$2.8 million in 2011 to $5.1 million in 2012.

absolute volume of investments in technologi-

At the same time, there showed up

cal projects and the first place by growth rates.

consequences of the fact that some first-time

It will be possible to speak about some signs

entrepreneurs who obtained investments 2-3

of saturation when Russia becomes the abso-

years ago did not manage to fit the market.

lute European leader by the volume of venture

As a result, funds and organizers of various

investments as other European countries are

competitions with prize money adopted then

considerably behind Russia by population.

a more rigid approach to selection of prize
contenders.
The RVС and PwC research showed that

According to a study produced by the
RVC and All-Russian Public Opinion Research Center, there are about one thousand

the wave of “emotional” startups and unfairly

active business angels in Russia. However,

overestimated investment expectations

there is not enough information on their

came to the end in 2012. Last year investors

work. As a rule, they do not desire to provide

began to employ a more careful approach

publicly available information on transactions

to the selection of portfolio projects giving

made. In this regard RVC suggests continu-

preference to those who could prove their

ing systematic work directed at increasing the

own success and perspectives not only by

number of practicing business angels as well

word of mouth but also with actual business

as at increasing transparency of this venture

key figures. It concerns both private and

investment market segment.

state funds.
Following the MoneyTree Venture Market

Over the past year, after the issuing of
our previous report, one more Russian high-

Navigator report, the year 2012 was also

tech company came through the IPO. As we

marked with the hyperactivity of venture

already reported the EPAM Systems held the

funds at later stages of company develop-

IPO at the New York Exchange in the begin-

ment. For example, the number of concluded

ning of 2012 and attracted $72 million. After

transactions at the seed stage in 2012 was

some time of trading the price of company

by 22% less (60) than in 2011 (77), while at

shares grew several times that showed

the “startup” stage almost double increase

investment capacity of software development

was registered in the number of transactions

industry service segment. The EPAM Sys-

(65 transactions in 2012 against 34 transac-

tems achievements were especially significant

tions in 2011).

against a relative failure of the most expected

Last year, there were 12 investors’ exits
from projects to the total amount of $372 million (including transactions with undisclosed

IPO of the year – that of Facebook.
In June 2013 Luxoft successfully placed
4.1 million shares on the American financial

cost). Besides, three large transactions were

market. The flotation value was 12% of the

concluded with the amount over $100 million

total number of shares, and the company

each. Occurrence of such transactions is an

was valued at over $700 million.

important market development factor demon-

Now Qiwi which has created the self-

strating that investors are ready for consider-

56

named payment system for settlement via e-

able investments in attractive projects.

wallets, plans to hold IPO at foreign exchang-
Chapter 3 / Investment promotion
es. Company publicly declared its intention to
hold the IPO in March, 2013.
Most likely, other large Russian compa-

In October 2012, the OppenheimerFunds
(American investment fund) became one of
the largest Yandex shareholders after hav-

nies also plan to hold IPO but they still have

ing purchased 5% of the total number of its

not made their final decision which could be

shares. The market cost of this holding of

reported publicly in the context of unstable

shares is $390 million.

world economic environment.

57
Chapter 3 / Investments of Russian companies and funds in other countries

Investments of Russian companies
and funds in other countries

W

ith important increase in

viewpoint of Russian economy integration

the amount of venture

into the world economy. Acquisition of large

investment in Rus-

shares in successful foreign companies is a

sia, recent years also

way to adopt managerial experience and to

witnessed a growth of

find opportunities for cooperation between

investments of Russian citizens, of Russian

these enterprises and Russian IT companies,

companies and funds in the high-tech sector

as well as to provide Russian companies with

of foreign economies. We do not have precise

entrance into new markets. In certain cases,

information about the amount of investments

Russians obtain ready-to-use technologies

and the growth indicators due to lack of rel-

that may be elaborated and used in their own

evant researches. Nevertheless, such conclu-

business in Russia. Besides, money earned

sion can be drawn on a basis of transactions

from purchase and sale of shares may return

reported by mass media.

to the Russian IT sector. Judging by a num-

Russian investors can pursue different
purposes when investing abroad. This may
be acquisition of companies as resources for

ber of successful transactions, this process is
already well in progress.
First, it should be mentioned that after the

establishing their remote development cen-

Facebook’s IPO their Russian shareholders

ters. Besides, purchase of foreign enterprises

(Mail.Ru Group, Alisher Usmanov, Yury Milner,

provides software developers with access

Mikhail Frolkin, and others) became owners

to new significant clients in the markets

of shares worth a total of several billion dol-

concerned. Finally, shares are also acquired

lars. Had they sold their shares, they would

in order to make profit from their resale or

have received several times more money than

to get opportunities to exert influence upon

they recently invested. For example, Mail.

decision-making process as the company’s

Ru Group acquired 2.4 % of the Facebook

shareholder.

shares for $200 million in 2009. After the IPO,

Foreign investments allow particular

the price of this shares exceeded $2 billion.

individuals or companies to enjoy their profit.
However, they are also important from the

58

Although the Facebook stock value then fell
down, Mail.Ru Group remains in the green.
Chapter 3 / Investments of Russian companies and funds in other countries
At the end of 2012, one more invest-

participation was made: the company pur-

ment with participation of Yuri Milner was

chased Empathy Lab, an American consult-

announced. Together with Sergey Brin (the

ing company specializing in development of

founder of Google), his wife Anne Wojcicki

digital strategies and UX design.

and several investment funds they invested

In the autumn of 2011, the DST Global

$50 million in the 23andMe in the US which

fund headed a new round of investments

operates in the field of bioinformatics. It was

into the Swedish developer of the Klarna

declared that Milner is the leading investor at

payment system where $155 million were in-

this round of investments.

vested. Yandex declared the beginning of the

Russians show their interest in many

new Challenges program for startup search

other American high-tech companies. Mail.Ru

around the world (Yandex is already one of

Group, Alisher Usmanov’s DST Global fund,

investors of the Face.com Israeli startup). In

and Mikhail Frolkin own shares of Zynga, a

the spring of 2012 Transas acquired Revue

US vendor of online games. In the summer of

Thommen Swiss, manufacturer of aircraft

2011 the DST Global fund acquired about 5%

instruments. In the summer of 2012 a small

of Twitter shares for $400 million. At the end

Russian antivirus developer acquired a Hun-

of 2011 Runa Capital venture fund became

garian company, VirusBuster. In the autumn

an investor of the BigTime Software produc-

of 2011 a group of investors that includes

ing software for clouds.
Leonid Boguslavsky, one of the most

the DST Global Russian investment fund
declared its intention to buy out the shares of

well-known Russian investors, launched a

the Chinese Alibaba Group from its employ-

venture fund priced at $100 million in the

ees and shareholders to the total amount of

USA. The new fund will invest into startups

$1.6 billion (the transaction completion has

in the software industry, in cloud computing –

not been reported yet).

and eventually – in e-commerce and Internet
services.
EPAM Systems expanded its presence

In October 2012, InfoWatch (Natalya
Kaspersky’s company) declared acquisition of
a 16.3% stake in G Data, a German antivirus

at the North American market in the spring

programs developer that ranks No.2 at the

of 2012, after having purchased for $17.4

antivirus market in Germany, yielding leader-

million Thoughtcorp, a Canadian software de-

ship to the Russian Kaspersky Lab. Acquisi-

veloper that has customers in retail, telecom-

tion of a stake in G Data is fully compliant

munications, and finance. At the beginning of

with InfoWatch’s plans to promote their own

2013, one more bargain with EPAM Systems

corporate products in the European markets.

59
Chapter 3 / The global software market and ways to increase sales for Russian suppliers

The global software market and ways
to increase sales for Russian suppliers

T

he world IT market is grow-

purchased corporate software was $278 bil-

ing by only several percent per

lion and the cost of IT services – $881 billion.

year. Thus, in the spring of 2013

According to the CompTIA International

the IDC analysts reviewed their

IT Association forecast, the growth of the

forecasts concerning the world

global IT industry will be 3% in 2013. Thus,

IT-market growth from increase to decrease.

the decisive contribution to this growth will

According to their findings based on results

be made by the USA, where the growth will

of 2013, the total world investments into IT in

reach 2.9%.

2014 will be $3.7 trillion and will increase not

Nevertheless, according to the analysts

by 5.5% but by 4.6% only (Gartner predicts

the situation in the American market (which

almost the same figures – $3.8 trillion and

is important for the Russian software export-

3.8%, respectively).
The review of the forecast is explained by

ers) is jittery. In 2013, the USA is going to cut
down the expenditures on information support

budget cuts in the USA, by ongoing problems

of governmental authorities by 0.7% (that will

with debentures in Europe, and by a relatively

be as much as $79 billion). This reduction

low GDP growth ratio of China. According to

is insignificant by Russian standards. Thus,

the IDC analysts, the greatest gain of invest-

the US market still remains the world’s No.1.

ments into IT can be expected in the develop-

However, considering its combination with the

ing countries such as Brazil and India. They

protectionist measures, such small reduction

may become the powerhouse of the entire

can mainly affect foreign companies that oper-

global IT market in 2013.
According to the Gartner analytics, a slight-

ate at the American market. As the importance
of the US market has considerably decreased

ly bigger growth is expected in the Corporate

in recent years (see Chapter 5), this already

Software and IT Services segments than in the

manifests itself. In any case, it affects Russian

global IT market as a whole (6.4% and 5.2%,

exporter companies which start redirecting

respectively). In 2014, the growth rates are

to other markets. Possibly, thing that matters

predicted to be at the same level. Following

60

is not only the budget cutting on information

the results of 2012, the worldwide volume of

support of governmental authorities but a
Chapter 3 / The global software market and ways to increase sales for Russian suppliers
reduction of the growth rate of the entire US

operation is beginning in 2013) creates new

IT market (particularly, in its segments that

promises for developers from Russia.

are especially important for Russian software
exporters) and protectionism.
The Everest Group analysts also report

Russian companies and programmers
are good at developing and selling abroad
mobile applications, and this segment is

about alarming situation at the US market. In

one of the backbone directions of the global

their opinion, the economic problems of the

IT industry development. According to the

USA (as well as of Europe and of some other

analysts, “cloud services”, social networks,

key markets) caused a considerable reduction

and systems for “large data” analysis belong

of a number and of a total cost of contracts in

to the same line. Mobile applications can be

the global market of ITOBPO in the second

developed and successfully sold abroad by

and in the third quarters of 2012. According to

even very small Russian companies as well

Everest Group, 381 new outsourcing contracts

as individuals.

were concluded worldwide in Q3 that is 19%

According to J’son & Partners Consulting,

less than a year before. The total value of

the volume of the global mobile applications

these contracts fell down even more – from

market reached $7.83 billion in 2012 and by

$2.7 billion to $1.5 billion (by 44%) as the aver-

2016 it will reach $65.79 billion.

age cost of transactions reduced. In Q2, the

Last year the sales value of business ap-

number of contracts decreased by 20%. Such

plications for mobile devices reached $250

reduction is partly connected with some disap-

million. According to the J’son & Partners

pointment in outsourcing as well. According to

Consulting analysts, the market of mobile

the Deloitte research, some companies termi-

business applications has good growth per-

nated their outsourcing contracts and returned

spectives in the next four years. If the share

to insourcing in 2012. This trend is mostly con-

of business applications in the total mobile

nected with the deterioration in the business

applications’ global market in monetary terms

environment in the developed countries and

was a little more than 3% in 2012, it will reach

with a decrease in the IT experts’ pay grade

5.4% in 2016.

level that made their services competitive as
compared to IT outsourcing services to the

Business Intelligence (BI – large data bulks
analysis and interpretation) should be also

third countries. Thus, Deloitte experts revealed

noted as a dynamically developing segment.

an “insignificant but developing” trend.

In addition, an increase in the number of busi-

Although the macroeconomic environment

ness applications operating with unstructured

in such large markets as the USA and Europe

information and using semantic methods to

is not the most favorable for strengthening

find relevant data is expected. In these areas,

IT service sales, in the number of IT market

Russian developers either have already made

segments there is a quite notable growth that

significant progress or have potential to ap-

can positively affect the Russian software

prove themselves in the next years.

export figures. It is particularly topical for the

According to Gartner, e-business intel-

global expenses on information security ser-

ligence (BI) global market increased by 6.8%

vices. They grow by more than 10% per year.

and reached $12.3 billion. In the previous

Russian companies are traditionally strong in

years the growth was higher (for example, in

this sphere and have a very good worldwide

2011 it was 17%) but this segment is growing

reputation.

faster than the global IT market as a whole.

There is also a rapid growth of the global

Besides, higher growth rates are noted in de-

telematic services market where the Russian

veloping countries where Russian companies

navigation and traffic monitoring applications

have good opportunities to increase sales

are expected to take a rightful place. Avail-

owing to higher loyalty to Russian solutions

ability of GLONASS system (its commercial

than in the Western markets.

61
Chapter 3 / The global software market and ways to increase sales for Russian suppliers
According to the Russian IT industry development strategy, which
was produced jointly
by Russian Association of Computer and
Information Technology
Companies – APKIT)
and by McKinsey, Russian software export
revenues are expected
to reach $27 billion in
2020. In order to reach
such level of export it
is enough to increase it
approximately by 20%
per year. Such export
growth rates have been
already observed on
the average for the last
three years (before the
crisis, the growth rates
were 40%-50% per
year). With a certain
State support, the
export growth may be
even higher.

62

A growing trend toward an increase of

development services. This gap will probably

the project-based software development is

remain in the next years, although there is

favorable for Russian companies in compari-

still a potential for an increase in sales of the

son with the process outsourcing as Russian

software development services’ sector.

developers are stronger than others in hightech projects.

No more than 2.5% of total production
falls on the share of Russian software compa-

An increase in developers’ labor cost

nies in the global software market (including

slightly slowed down in Russia in 2012. Nev-

customized development services). However,

ertheless, this growth was noticeable. Russian

for many years this share has been increasing

providers of software development services

by approximately 0.1% per year irrespective

lost the low labor cost advantage before the

of the global market growth deceleration or

world economic crisis in 2008. The exception

acceleration.

to this is the case when in addition to Russian companies West European and American

Russia is far behind India (more than 10
times) by software export volumes in mone-

service companies participate in the tender. At

tary terms. However, the gap is gradually nar-

the same time, the man-hour cost is often a

rowing (10 years ago, the gap was 20 times).

less important criterion for a customer when

Russian developers should not look up to the

selecting a project contractor. Customers pay

Indian IT export volume figures. The differ-

more and more attention to the developer

ence in population and in living standards is

skills (technical, communication and cultural).

too great. At the same time, the Russian in-

Nevertheless, the deficit of developers

dustry is on firm ground in the most profitable

and increase in labor cost led to the fact

high-tech development segments, where it is

that the growth of software export in Rus-

worth increasing Russian developers’ compe-

sia in 2012 was higher than that of software

tences for enhancing their competitiveness.
CHAPTER 4
GEOGRAPHIC REACH
AND MAIN VERTICAL
MARKETS OF THE
RUSSIAN SOFTWARE
DEVELOPMENT INDUSTRY
Chapter 4 / Main geographical markets

Main geographical markets

I

n comparison with the last year’s survey

decreased — from 79% to 24%. The Russian

results, the average number of mentioned

market has never had such low figure for the

key markets per one company consider-

entire research period. Possibly, this figure

ably reduced (from 1.87 to 1.56). The

was affected by the reduction of the market

same applies to the markets in which

growth rates in 2012, as well as by extending

respondents are present with just single proj-

ects (from 3.9 to 3.3). The decrease appears

opportunities of access to foreign markets.
The interest in the «USA and Canada»

to be even more significant considering that

market, which increased after the crisis,

this year one more region — the Middle East –

was replaced with a sharp de-emphasis for

was added in the appropriate questionnaire.

the respondents in 2011.Last year, 31% of

It turned out that 10% of the respondent

respondent companies were present at this

companies already operate in this market that

market (a year before, there were 45%), and

adds 0.1 per one company when considering

only 14% of respondents consider it as the

all mentions together.

key one (in 2011, there were 30%). The index

Now, the respondents less often men-

of American market importance for Russian

tion almost all markets as the key ones. The

software exporters turned out to be the low-

exceptions are Russia, Ukraine, Belarus, and

est for the last 10 years.

the «Australia, Africa, South America» region.
The vast majority of respondent companies (89%) still operate in the Russian

The next year’s survey results may allow
stating a decrease in Russian developers’

market. However, the share of the compa-

64

interest in the Russian and US markets more

nies considering it as the key market sharply

definitely as such sharp change of attitude
Chapter 4 / Main geographical markets
38.	 Presence of Russian companies in the world markets*

2007

2008

2009

2010

2011

2012

Russia

55%

87%

89%

99%

93%

89%

USA and Canada

55%

52%

38%

40%

45%

31%

Ukraine

17%

35%

41%

57%

35%

34%

Other countries of Western Europe

35%

30%

33%

35%

40%

25%

Other countries of the former USSR

39%

26%

34%

51%

50%

36%

Belarus

32%

23%

31%

45%

29%

31%

Germany

25%

24%

28%

33%

34%

26%

Scandinavia (with Finland)

28%

18%

18%

20%

27%

19%

South East Asia

19%

14%

19%

19%

23%

15%

Australia, Africa, South America

25%

7%

12%

19%

15%

15%

Middle East

-

-

-

-

-

10%

* the markets which are key ones or the marketplaces where separate projects are implemented

towards these markets in 2012 can be partly

dents with the turnover more than $4 million

explained by the considerable change of the

operated at this market (a year ago there

respondent structure in comparison with the

were 70%). In the previous years the situation

previous survey.

here was different. A reduction of mentioning

Ukraine and Belarus, «Other countries

American market was generally taking place at

of the former USSR», and Germany are

the expense of small companies that had an

mentioned as the key market more often

insignificant total export.

than a year ago. Software exporters not only
focused on a smaller number of markets, but

As in the previous years, St. Petersburg
leads with the highest number of companies

reoriented towards the near-shore countries

that operate in the foreign markets (except

and to Germany.

Asia and the Middle East). Moscow is in the

A few years ago, Russia and the USA were

lead by the share of exporters that are mainly

way ahead by the frequency of mentions as

oriented towards the markets of the former

the key markets. However, for the last years,

USSR republics.

the USA backslided from the second place to

In the last three years, opening of sales

the 6th-7th spot, and Russia shared the first

and of local customer technical support

place with the countries of the former USSR.

offices was declared by several Russian com-

According to respondents, the near-abroad

panies: Group-IB in the USA, Softline in Peru,

countries are considered to be the most

ABBYY in Kazakhstan, Yandex in Switzerland

prospective market for the next two years,

and Belarus, Kaspersky Lab in the Republic

although a small growth of interest is expected

of South Africa.

in regard to the Western Europe (except Ger-

At the end of 2012, the InfoWatch re-

many and the Nordic Countries), the USA, the

ported that they were thinking of opening its

South East Asia, the «Australia, Africa, South

office in the United Arab Emirates or Saudi

America» region, and the Middle East.

Arabia.The share of this region in the compa-

The change of attitude towards the «USA

ny’s revenue is quickly growing. InfoWatch al-

and Canada» market concerns both small and

ready runs projects in Bahrain, Kuwait, Saudi

large companies. In 2012, 36% of respon-

Arabia, and other Middle Eastern countries.

65
Chapter 4 / Main geographical markets
39.	 Key markets

2007

2008

2009

2010

2011

2012

Russia

42%

71%

72%

86%

79%

24%

USA and Canada

43%

28%

26%

15%

30%

14%

Other countries of Western Europe

12%

15%

10%

12%

17%

13%

Ukraine

6%

13%

11%

10%

9%

22%

Other countries of the former USSR

12%

7%

11%

6%

11%

24%

Belarus

24%

9%

8%

12%

8%

20%

Germany

11%

10%

12%

12%

14%

18%

Scandinavia

13%

8%

6%

6%

8%

8%

South East Asia

6%

6%

3%

3%

7%

6%

Australia, Africa, South America

9%

3%

2%

1%

4%

3%

Middle East

-

-

-

-

-

3%

subsidiary will help to promote the GLONASS

The news connected with
expansion of the Russian
companies in the foreign
markets for the last 2-3 years:

navigation technologies in the Indian market.
In April 2013, the i-Free and China Telecom, a Chinese mobile network operator represented by the Dazzle Interactive Network

ABBYY acquired 100% of the Connective

Technologies subsidiary, signed an agreement

Language Services in order to extend its share

on strategic cooperation in the field of mobile

of localization and support in the US market.

games.

In June 2010, Playnatic Entertainment announced the agreement with Sina Data Coin, the
first Russian-Iranian agreement in the IT sphere.
In May 2011, Entensys, a Russian information security software developer, signed a
Cooperation Agreement with ITXON, a Polish
software distributor.
In January 2011, Vitim has officially

In April 2013, the integrated automated
security management system developed
by the RTEC was presented at LAAD-2013,
the leading armament exhibition in Latin
America.
At the beginning of 2013 Mail.Ru Group
launched the Spanish version of its mail service interface. According to the Internet World

opened its office in Finland; this company will

Stats, Spanish is one of the top-3 languages

become the main European partner of the

spoken by Internet users globally.

Speech Technology Center in St. Petersburg

In March 2013, Naumen from Yekaterin-

and will be engaged in development of soft-

burg reported that Magellan Solutions, a Philip-

ware in sphere of speech record, processing

pine outsourcing call center, began operations

and analysis.
NIS GLONASS has registered the NIS

based on the company’s software. Naumen
expects to start expansion in the region with

GLONASS Pvt Ltd subsidiary in India, which

automation of 100 workplaces of this center.

will be engaged in the large projects requir-

According to developers, the size of the Philip-

ing system integration and in creating the

larger than the similar Indian market and is

consumer market. It is supposed that the

66

pine call-center service market is considerably

distribution network for its solutions in the

measured in billions of dollars.
Chapter 4 / Vertical markets

Vertical markets
40.	 Frequency of vertical market references in 2006-2012 (percentage of all respondents)
2006

2007

2008

2009

2010

2011

2012

Information Technology

89%

88%

69%

71%

74%

70%

74%

Banking*

35%

36%

36%

28%

23%

36%

26%

Telecom

34%

44%

33%

29%

26%

38%

31%

Industries

31%

40%

31%

34%

27%

36%

38%

Hospitality, Travel & Transportation

24%

29%

31%

26%

28%

37%

29%

Government

28%

38%

25%

28%

21%

31%

24%

Power supply, Gas & Oil

18%

27%

24%

19%

17%

22%

22%

Healthcare & Pharmaceuticals

23%

29%

24%

18%

23%

29%

28%

Retail & Distribution

35%

38%

24%

21%

26%

41%

29%

Education

36%

32%

23%

24%

21%

28%

28%

Science & Research

-

-

-

-

18%

28%

26%

Gambling & Entertainment

20%

19%

11%

12%

9%

17%

15%

Media

-

-

-

-

13%

20%

18%

Sport & Travel

-

-

-

-

10%

20%

17%

Insurance

-

-

-

-

13%

28%

15%

Building & Real estate

-

-

-

-

12%

23%

17%

Services

-

-

-

-

27%

40%

35%

Finances

-

-

-

-

25%

30%

26%

Energy

-

-

-

-

17%

22%

21%

F

or the previous 10 years, no

As a whole, it can be concluded that Russian

regular change in the importance

export companies’ industry priorities have not

of separate vertical markets was

* before 2010 – Banking & Financial Services

changed essentially for the decade.

revealed. The majority of the
figure fluctuations are random

The only clearly revealed regularity
connected with vertical markets is a sharp

or temporary. In the results of 2012 survey

reduction of their total frequency of mentions

we can only note the upward trend of

during the period of crisis. In 2009-2010,

mentioning the “Information Technolo-

software developers were forced to focus

gies” segment that reflects the increasing

their efforts on the areas in which they were

concentration of Russian developers in the

most competitive or which were least affected

B2B segment for technological companies

by the world crisis.

all over the world. We can also note some
decrease in importance of the financial
and e-government sectors against a small

Only 3% of respondents mentioned
“Other” (not listed) vertical markets. ”International Organizations”, “Advertising”, “Housing

growth of interest towards industrial pro-

and Utilities” (twice), “Agriculture”, “Security

duction automation.

companies” were mentioned.

67
Chapter 4 / Software development center geographic distribution

Software development center
geographic distribution

31%

of

DataArt also have their large development

respon-

center networks in Ukraine.

dents (a

Many Russian companies’ remote devel-

year ago,

opment centers also operate in Belarus and

there

in other CIS countries. However, Ukraine has

were 35%) reported existence of one own re-

a special place as it is the second largest

mote software development center. The share

post-Soviet state (after Russia) by its popula-

of these companies varied within 25–40%

tion. According to Luxoft, there are about 38

during the recent years.16% of respondents

thousand qualified programmers in Ukraine.

(there were 17% last year) reported two and

Every year, the Ukrainian higher education

more remote development centers while 7%

institutions produce 18 thousand IT gradu-

of companies (last year, there were 10%)

ates who know English generally better than

have at least three such centers.

Russians.

Most of Russian companies’ foreign

The majority of the Ukrainian software de-

development centers are located in Ukraine.

velopment centers of Russian companies are

It can be surely assumed that this country

located in Kiev (this year, there are offices of

is significantly ahead of other countries and

5% of respondent companies). There are 2-3

regions by the total number of the employ-

times less development centers in Kharkov,

ees working for Russian companies outside

Dnepropetrovsk and Odessa. The following

Russia. In Ukraine there have been created

Ukrainian cities are also mentioned there:

favorable conditions for software companies

Sevastopol, Kherson, Lvov, Vinnytsa, Cher-

(many experts consider that these conditions

kassy and Anthracite (Lugansk region).

are better than in Russia) and the labor cost
is much lower there than in Russian capitals.
Luxoft has more staff in its production

In Belarus, the majority of software development centers are also located in the capital

divisions in Ukraine than in Russia (about

centers in Gomel, Vitebsk, Mogilev, Alek-

In addition to Luxoft, EPAM Systems and

68

city of Minsk. There are also development

2600 employees of nearly 6000 worldwide).

seyevka and Brest.
41.	 Rating of Russian cities (by number of companies’
head offices and remote development centers)

42.	 Rating of Russian cities (by the number of the
company head offices, trade offices and remote
development centers)

1	Moscow	

46

1	Moscow	

64

2	

45

2	

St. Petersburg	

52

3	Novosibirsk	

St. Petersburg	

10

3	

Nizhny Novgorod	

12

4	

8

4	Novosibirsk	

10

5	Kazan	

Nizhny Novgorod	

6

5	Kazan	

7

6-7	Omsk	

5

6-8	Voronezh	

6

6-7	Izhevsk	

5

6-8	Yekaterinburg	

6

8-10	Voronezh	

4

6-8	Omsk	

6

8-10	Yekaterinburg	

4

9-12	Izhevsk	

5

8-10	Taganrog	

4

9-12	Krasnoyarsk	

5

11-15	Krasnoyarsk	

3

9-12	Rostov-on-Don	

5

11-15	Rostov-on-Don	

3

9-12	Ulyanovsk	

5

11-15	Ulyanovsk	

3

13-15	Kaliningrad	

4

11-15	Perm	

3

13-15	Perm	

4

11-15	Kolomna	

3

13-15	Taganrog	

4

16-25	Kaliningrad	

2

16-19	Barnaul	

3

16-25	Barnaul	

2

16-19	Belgorod	

3

16-25	Belgorod	

2

16-19	Kolomna	

3

16-25	Zelenograd	

2

16-19	Chelyabinsk	

3

16-25	Oryol	

2

20-33	Arkhangelsk	

2

16-25	Penza	

2

20-33	Dubna	

2

16-25	Puschino	

2

20-33	Zelenograd	

2

16-25	Samara	

2

20-33	Irkutsk	

2

16-25	Cherepovets	

2

20-33	Krasnodar	

2

16-25	Tver	

2

20-33	Obninsk	

2

20-33	Oryol	

2

20-33	Penza	

2

20-33	Puschino	

2

20-33	Samara	

2

20-33	Saratov	

2

20-33	Stavropol	

2

20-33	Tyumen	

2

20-33	Cherepovets	

2

Remote development centers operate in 25 Russian cities.
Most of them are located in St. Petersburg (8), Nizhny
Novgorod (5), Moscow (4), Voronezh (3), Kazan (3),
and Krasnoyarsk (3).
Russian export companies are present (have their head
offices, remote development centers or sales agencies)
in 60 Russian cities

69
Chapter 4 / Software development center geographic distribution
43.	 Geography of remote development centers
(share of respondents who specified a country or a region)

2008

2009

2010

2011

2012

Planned to
open a development
center in
2012-2013

Plan to
open a development
center in
2013-2014

In Russia

19%

23%

18%

28%

24%

12%

4%

In Belarus

4%

6%

6%

7%

8%

6%

3%

In Ukraine

4%

6%

7%

7%

10%

2%

1%

In other CIS countries

4%

1%

2%

3%

6%

2%

0%

In Western European countries

4%

4%

4%

5%

5%

2%

1%

In Central and Eastern European countries

3.5%

1%

4%

3%

1%

3%

1%

In USA and Canada

3%

5%

4%

3%

3.5%

2%

1%

In South East Asia

0.5%

3%

2%

5%

1%

2%

1%

In Africa

-

-

-

0%

0%

2%

0%

In South America

0%

0%

2%

1%

In the Middle East

0%

1%

1%

0%

Gambling & Entertainment

20%

19%

11%

12%

9%

17%

15%

Media

-

-

-

-

13%

20%

18%

Sport & Travel

-

-

-

-

10%

20%

17%

Insurance

-

-

-

-

13%

28%

15%

Building & Real estate

-

-

-

-

12%

23%

17%

Services

-

-

-

-

27%

40%

35%

Finances

-

-

-

-

25%

30%

26%

Energy

-

-

-

-

17%

22%

21%

Among other CIS countries, Kazakhstan

production sites but on expansion of already

is an attractive place for creation of remote

existing ones. Besides in Ukraine, Belarus, and

development centers. The Baltic states (with

other countries, a limitation of available human

cities of Riga, Vilnius, Liepaja) are also men-

resources is beginning to emerge. In any case,

tioned. It is quite possible that in the next 2

only 12% of respondents plan to create new

years several new production sites of Russian

development centers in 2013-2014.

software developers will appear in Kazakhstan.
As a whole, the share of respondents who
plan to expand its network of remote develop-

Respondents have their remote production
sites in 45 cities of Russia (last year, there were
46). The leading five cities, where the majority of

ment centers or to create its first center, was

ters are located, remained the same in compari-

previous year. Probably, some companies

son with the previous year. Kazan has gained a

concentrated their efforts not on opening new

70

head-quarters and of remote development cen-

considerably reduced in comparison with the

foothold on the 5th place and – keeping up cur-
Chapter 4 / Software development center geographic distribution
44.	 Share of export companies that have remote development centers in 2013

Somewhere

In Russia

Plan to open a development center
in 2013-2014

Turnover less than $0.5 million

14%

5%

0%

Turnover from $0.5 million to $4 million

23%

15%

12%

Turnover from $4 million to $20 million

56%

50%

28%

Turnover from $20 million to $100 million

64%

64%

9%

Turnover higher than $100 million

100%

80%

20%

rent pace – it pretends to catch up with Nizhny

made in order to obtain new customers from

Novgorod within two-three years ahead.

the US financial sector.

Development centers in Moscow and

Earlier, in the spring of 2012 EPAM Sys-

in economically developed countries with a

tems expanded its presence in the market

high programmers’ salary level are opened

of North America, having acquired for $17.4

purposely either to access high competences

million Thoughtcorp, a Canadian software

or to support customers’ project by local en-

developer with customers in retail, telecom-

gineers. Western companies are often being

munications, and finance. At the beginning of

acquired for this purpose.

2013, one more bargain with EPAM Systems

For example, in April 2013 Luxoft de-

participation was concluded: they purchased

clared the acquisition of Freedom OSS, a US

Empathy Lab, an American consulting com-

developer of corporate open source software

pany specializing in development of digital

using RedHat products. The acquisition was

strategies and UX design.

71
Chapter 4 / Geographic distribution of marketing and sales offices of Russian companies

Geographic distribution of marketing
and sales offices of Russian
companies

O

ne third of respondents have

State development institutes (first of all Rus-

their sales offices abroad

sian Venture Company – RVC), are unwilling

or in other cities of Rus-

to participate in the research; they create

sia.12.5% of companies

their offices abroad but try not to display

have only one sales office,

their Russian origin.

21% – at least two, and

We should note a very small percent-

12.5% of respondents have at least three

age of companies that have sales offices in

sales offices.

Belarus and Ukraine, although these markets

According to the last year’s research
forecasts, about 20% of respondents

are mentioned as the most significant for
respondents. Apparently, they are specified

planned to open new sales offices. However,

as important, first of all, from the viewpoint of

the total quantity of companies that have

developer resource availability.

sales offices almost did not change. The

There is a considerable increase in interest

situation has remained stable for 5 years. It

in the African market which was exotic for

is generally explained by the fact that major

the Russian companies for a long time.6% of

service companies take part in the survey

respondents plan to open their sales offices

in a regular way. The leaders among them

in the African countries in the next two years.

established long ago, they create almost all

Last year, the corresponding figure was equal

new sales and support centers while small-

to 2%.Some companies really demonstrated

and medium-sized service companies are

years, but such big growth (three times) may

vendors who are promptly developing in the

be caused by random factors (for example,

last 3-5 years thanks to the efforts of the

72

their interest in the African market in recent

developing far less rapidly. New software

by change of the respondent structure).
Chapter 4 / Geographic distribution of marketing and sales offices of Russian companies
45.	 Presence of sales offices (the share of the respondents who specified a country or a region)
2008

2009

2010

2011

2012

Plan to
open at
least one
new commercial
agency in
2012-2013

Plan to
open
at least
one new
agency in
2013-2014

In Russia

15%

27%

26%

19%

21%

8%

8%

Abroad (in foreign countries)

17%

29%

26%

27%

26%
(17%)

-

20%
(17%)

In Belarus

0%

6%

10%

2%

6%

1%

1%

In Ukraine

1%

11%

14%

3%

6%

2%

1%

In other CIS countries

1%

8%

9%

6%

6%

3%

6%

In Western European countries

11.5%

11%

11%

16%

5%

8%

6%

In Central and Eastern European countries

2.5%

3%

2%

3%

2%

4%

6%

In USA and Canada

12%

11%

9%

19%

15%

4%

5%

In South East Asia

2%

3%

1%

6%

3%

3%

3%

In Africa

-

-

-

2%

0%

2%

6%

In South America

-

-

-

3%

2%

3%

1%

In the Middle East

-

-

-

3%

1%

4%

1%

All countries and regions

28%

41%

39%

34%

33%

20%

25%

Sport & Travel

-

-

-

-

10%

20%

17%

Insurance

-

-

-

-

13%

28%

15%

Building & Real estate

-

-

-

-

12%

23%

17%

Services

-

-

-

-

27%

40%

35%

Finances

-

-

-

-

25%

30%

26%

Energy

-

-

-

-

17%

22%

21%

Share of exporting companies with sales offices in other cities and countries

Turnover less than $0.5 million

5%

18%

22%

5%

14%

15%

14%

Turnover from $0.5 million to
$4 million

30%

45%

27%

32%

28%

19%

24%

Turnover from $4 million to $20
million

47%

48%

70%

57%

39%

24%

33%

Turnover from $20 million to
$100 million

-

-

-

-

73%

-

36%

Turnover higher than $100
million

-

-

-

-

80%

-

20%

56%

75%

22%

31%

Turnover higher than $20 million

73
CHAPTER 5
HUMAN RESOURCES
AND LABOR MARKET

74
Chapter 5 / Human resources and labor market

This market segment in Russia, accordIvan Orekhov

ing to various sources, makes approximately

ISS Art, LLC,Owner,
CEO

$500 million annually, around 300 000
people.
To arrange work with freelancers effectively it is necessary to have universally available

According to our experience, the main reason

instruments providing system work quality

why software developers leave is for freelance.

and transparency. Such instruments have al-

The main characteristic feature of freelancers

ready been developed and several companies

is that they do not care about their reputation

are using them.

and may stop working at any time for any rea-

To solve the issue on a global scale, dras-

son. This makes a bad impact on the overall

tic measures of government support need to

Russian developers’ reputation. Most freelanc-

be taken.

ers do not pay taxes, work at home and have

I call all IT companies to unite and create

nearly no organization expenses. No-one is

regional and federal associations with the

scared of being held liable for their illegal busi-

purpose of mutually profitable partnership

ness activities.

and the protection of common interest.

F

ollowing the conclusions of this

ing the fact that the survey covered almost all

research we can assume that a

largest service companies (while the staff of

total of 120 thousand professional

SMEs did not grow) the overall staff growth

software developers work in the

for all Russian companies was much lower –

Russian software companies

within 8-10% whereas about 2-3% university

(including those who work in their dedicated

graduates were engaged in the companies’

development centers in other countries).

staff. According to the ANCHOR High Tech-

It is necessary to explain that the num-

nologies recruiting company, the number of

ber of personnel in the software companies

software developers in Russia increased by

includes not only those employees who

9% in 2012 (by 11% in 2011) but their analysts

are directly engaged in coding but also

considered all kind of staff (not only working

architects, team/project/quality manag-

for software companies) excluding only staff in

ers and others who are actually involved in

the offshore development centers of Russian

software development process. Linguists

companies.

are also subject of professional staff in some

Thus, an additional engineers’ acces-

software companies. Besides, software

sion to Russian software companies in 2012

developers sometimes produce and sell

reached 9.5-11.5 thousand people. University

their own electronic equipment (hardware)

graduates provided an addition equal to 2-3

that is based on their own software. Most

thousand people. This data do not consider

likely, those who are engaged in develop-

the staff of startups that had been created

ment and assembly of hardware can be also

in the last 2-3 years and thus – were not in-

considered as a part of the original staff of a

cluded in the RUSSOFT database. This figure

software company.

is expected to be comparable to data on the

The number of staff in the responding compa-

fact that the number of new startups increased

larger companies’ recruitment, considering the
nies increased by 14% in 2012 and 4.6% of

several times from 2010 to 2012 (see Chapter

their staff was university graduates. Consider-

3, the Investment Attraction section).

75
Chapter 5 / Human resources and labor market
46.	 Approximate distribution of software developers by the largest
cities of Russia

are employed in Russian software companies.
Others work in the IT divisions of government
institutions, banks, large industrial companies,

Moscow

35%

Internet companies, and so on. Thus, slightly

St. Petersburg

15%

less than 400 thousand software developers

Yekaterinburg

5.2%

Novosibirsk

5%

on the domestic sales of licenses for develop-

Nizhny Novgorod

2.5%

ment tools, DBMS and other software used

Kazan

2.4%

in Russia reached 350 thousand people in

Voronezh

1.2%

2010. Taking into account the recruitment

are engaged in the IT-industry.
According to Microsoft estimations (based

by programmers), the number of developers

that took place for 3 years, at least 400 thou47.	 Number of CVs in the Software Development section on the
Superjob website (for the year)

sand software developers are supposed to
work in Russia in 2012. Taking into account
the complexity of calculations and a great

Moscow

18.5 thousand

31%

Petersburg

8 thousand

13.3%

Throughout Russia

60 thousand

100%

degree of uncertainty, these two estimations
of number of software developers which were
received in absolutely different ways are in
agreement with each other.
According to the Microsoft estimations,

Source: Superjob
research center

Russian companies’ offshore develop-

about 20 thousand new professional software

ment centers employ 18-20 thousand people.

developers (generally, university graduates)

Thus, in the territory of Russia there are at

appeared in Russia every year before 2010.

least 100 thousand software developers in

The data published by the Russian govern-

the software companies. The number of peo-

ment are approximately the same. Unfortu-

ple employed in the software industry (taking

nately, government authorities hardly have

into account secretaries, marketing and sales

their own data from official statistics. The

managers, and others) is much higher.

available state statistics still does not meet
requirements of the market economy, which

In addition to universities, another main source

is even more true for statistical information

of Russian companies’ staff size grow this

(including data on the employment of popula-

the segment of offshore development centers,

tion) that characterizes development of the

which actively recruited developers in 2012.

hi-tech economy sector.

According to experts (largest employers and
representatives of recruiting agencies), the

In addition to software companies, banks are

inflow of developers to Russia has no consid-

also actively engaging software developers

erable influence on the labor market demand

who appear in the labor market. According

and supply. The same applies to the person-

to HeadHunter, banks were the most active

nel outflow abroad, which still takes place but

employers of IT engineers (not only program-

is not as massive as it used to be about 10

mers) in 2012.

years ago. According to surveys produced by

Data on the total number of IT profession-

recruiting agencies, there are a lot of people

als working in Russia varies greatly depending

desiring to work abroad – at least 25%. How-

on the information source. Dmitry Medvedev,

ever, the vast majority of these people do not

Russian Prime Minister, reported in December

leave Russia for various reasons.

2012 that 0.6% of working-age population

According to the ANCHOR High Technologies, 26% of Russian software developers

76

(about 520 thousand people) was employed
in the IT industry of Russia, while in economi-
Chapter 5 / Human resources and labor market
cally developed countries – a usual figure is

Similar support measures are to be taken and

4-5%. Mark Shmulevich, Deputy Minister of

being prepared on the regional level.

Telecom and Mass Communications, consid-

Unfortunately, the proposed program is

ers that nearly 1 million people are engaged

intended for staff retraining based on the exist-

in the IT industry (the industry’s staff figures

ing chairs of universities and does not foresee

are higher because they include IT engineers

involvement of capacities of training centers

working for IT companies as well as those in

that have been created by medium and large

the IT divisions of enterprises in all economy

Russian companies as well as foreign corpora-

sectors, in government bodies and in the

tions’ training centers in Russia. Experience

social sphere). This data is quite realistic, but

shows that in terms of professional develop-

nevertheless, it requires regular verification,

ment and retraining the efficiency of higher

clarification and explanation in regards to the

education institutions is lower than that of

estimation methodology and meaning.

companies’ training centers as the majority of

According to the Association of Computer
and Information Technology Companies
(APKIT) three years ago at least 60 thousand

university professors are not involved in specific development projects on a regular basis.
Considering all aforesaid, it can be stated

IT professionals graduated annually from uni-

that the existing educational system is only

versities, one third of whom started to work

capable to partially reduce the deficit of IT

for the IT industry while the demand for such

engineers and, in particular, of software devel-

professionals is 1.5 times higher.

opers. It is especially fair taking into account

The government has already been trying to

observed until 2018. Besides, changes in the

change the situation in the IT education. At

education system will give effect at best in 2-3

the end of 2011, Vladimir Putin, then the

years.

the “demographic hole” in Russia which will be

Prime Minister of Russia, approved the list of

Another way of reducing staff deficit

specialties in higher educational institutions

may be seen in involvement of trained and

and the list of scientist areas that correspond

experienced professionals from abroad.

to priority directions of the Russian economy

Rather favorable conditions for mass recruit-

modernization and technological develop-

ment of foreign qualified personnel to Russia

ment. The list included about 100 posi-

have arisen during few recent years. Thus, in

tions, approximately one third of which dealt

search of staff our companies can be orient-

with the ICT sphere. Since 2012, students

ed not only towards the neighboring countries

and scientists who have chosen prioritized

but towards the far-abroad countries as well.

directions will apply for presidential and for

By the level of programmers’ salaries, Russia

governmental grants which will be rather big

is more attractive than many other countries.

by Russian standards.

Even in once-affluent countries of Western

Besides, the Ministry of Education ap-

Europe, business recruits fewer engineers

proved the three-year retraining course

or reduces the headcount due to the eco-

program for technical staff where at least 15

nomic recession. The programmers’ salaries

thousand people are supposed to be trained.

in Southern Europe are already lower than

This program will be implemented based on

those in St. Petersburg and Moscow. It could

the public and private partnership. Ministry of

be assumed that West Europeans who are

Education is ready to finance up to 50% of the

used to have a certain level of comfort would

employers’ expenses on engineer retraining.

not want to go to Russia. However, it is not

Up to $10 million are supposed to be annually

the case any longer. Not only citizens of East

allocated for these purposes in the Minis-

European states but also those of Western

try’s budget. This program provides profes-

Europe willingly hold positions of top manag-

sional training in Russia as well stages abroad.

ers and supervisors in Russian companies.

77
Chapter 5 / Human resources and labor market
Nikolay Nikiforov, the Minister of Telecom

in Russia, although the visas were requested

and Mass Communications of the Russian

a month before the planned trip). Participants

Federation suggested in Autumn 2012 that

of the Contest should have been persuaded

Russian companies should engage profes-

to come to Russia, having in view that in the

sionals from abroad. He was supported by

future some of them may want to come to

the senior management of the largest Rus-

work for Russian companies. Instead, the

sian software companies. However, within six

existing visa policy de facto hindered their

months of that no decisions on simplification

participation in the Contest in St. Petersburg.

of the migration regulations were adopted at

Russia needs to be involved in the global

the government level, although the discussion

staff competition but such visa and migra-

is under way.

tion policy will prevent from doing this. While
the USA are making decision on the number

Participants of the ACM International Pro-

of employment visas provided to foreign IT

gramming Collegiate Contest’ Final which

professionals (100 thousand or 300 thou-

was held at the beginning of July 2013 in St.

sand), Russia is only beginning discussing on

Petersburg, had difficulties when obtaining

theoretical possibilities of recruiting staff from

Russian visas (a number of foreign journalists

abroad.

invited by sponsors did not manage to arrive

78
Chapter 5 / Employee recruitment and headcount reduction

Employee recruitment
and headcount reduction

T

he total staff of the respondent

companies is not so big to affect the average

companies increased by 14%

staff turnover of all respondent companies.

from the end of 2011 to the end

Nevertheless, it can be assumed that the

of 2012. This happened largely

fight for manpower in regions became more

thanks to the offshore devel-

desperate.

opment centers that have been opened or

In the last several years, the labor market

extended by the largest Russian companies

of St. Petersburg was the most adverse

abroad. 82% of staff size gain was provided

(judging by the staff turnover and by the

by the companies with the turnover over $20

share of companies that did not recruit any

million (69% of staff size gain fall on the com-

employees). This market keeps the same po-

panies with the turnover over $100 million).

sition in 2012 but it did not stand out against

In 2012, 16% of companies employed

other regions (except for Ural).

nobody, almost as many as in 2011 (15%).
In 2010 there were much more such companies – 28%, and before the crisis – 5-10%.
The staff turnover rate practically did not

St. Petersburg also lost its unambiguous
leadership by the number of employed university graduates. Now this figure is approxi-

change neither. It was 6% in 2011 and follow-

mately identical for St. Petersburg, Siberia

ing the results of 2012 it was about the same

region and “Other cities”. It is much higher

(6.1%).This figure remains at a rather low level

than the Ural figure and twice lower than the

in comparison to other countries that is one

Moscow one. The respondent companies’

of competitive strengths of Russian software

staff size increased by 4.6% thanks to engag-

industry.

ing recent students.

The steadiness of these two figures

The smallest companies (with the turnover

means stabilization of the situation in the

less than $0.5 million) considerably reduced

Russian labor market. However, companies

their activity in the labor market and recently

with the head offices outside of Moscow and

found themselves in the most difficult situa-

St. Petersburg had considerably increased

tion in comparison to other companies. The

staff turnover rates. The total number of these

non-competitive status of small companies is

79
Chapter 5 / Employee recruitment and headcount reduction
48.	 Respondent companies’ activity in the labor market depending on their location
Moscow

St. Petersburg

Siberia

Ural

Other towns

Zero recruitment

29%

11%

13%

0%

12%

Staff turnover indicator

4.4%

9.7%

11.9%

6.4%

9.3%

49.	 Share of the companies that did not recruit new employees in 2008-2012,
depending on the company turnover
Over $100
million

From $20
million to
$100 million

Over $20
million

From $4
million to $20
million

from $0.5
million to $4
million

Less than
$0.5 million

2008

-

-

0%

0%

10%

14%

2009

-

-

0%

14%

18%

46%

2010

-

-

18%

13%

26%

42%

2011

-

-

0%

5%

19%

45%

2012

0%

9%

-

11%

8%

59%

50.	 Annual figure of the employee turnover, depending on company size
Over $100
million

From $20
million to
$100 million

Over $20
million

From $4
million to $20
million

from $0.5
million to $4
million

Less than
$0.5 million

2008

-

-

10%

11%

6%

7%

2009

-

-

6%

9%

3%

12%

2010

-

-

4.3%

4.8%

4.4%

3.2%

2011

-

-

4.4%

10.3%

5.4%

6.6%

2012

4.56%

8.29%

-

9.02%

8.41%

4.76%

primarily caused by the fact that they cannot

tive in the labor market the company was. Fol-

enjoy the incentives in the social taxation,

lowing the results of 2012 this rule was broken.

which are being currently used by the com-

There were no dependencies between the

panies with the staff size over 30 employees.

shares of companies that did not employ new

If the decision on a decrease in the staff size

staff and their preferential orientation towards

threshold for IT companies is not adopted in

the foreign or Russian market.

2013, we can expect not only stagnation of

In 2012 companies that obtained over

headcount and turnover for small companies

a half of their revenue from software export

but also an actual decrease in these figures.

recruited Java and C# developers, as well as

In 2012 larger enterprises recruited new

ASP.Net/MSSQL web programmers 2-3 times

staff and lost employees approximately at the

more often than others. PHP/MySQL web

same level as in 2011.

programmers were more demanded for op-

In the previous years there was a strict rule

eration in the domestic market than for export.

according to which – more company’s export
share in its aggregate income was – more ac-

80

C/C++ and C# developers were the
most demanded staff in 2012. Among other
Chapter 5 / Employee recruitment and headcount reduction
51.	 Most popular developers that were employed by respondent companies in 2008-2012
2008

2009

2010

2011

2012

Developer (C/C++)

42%

30%

25%

29%

26%

Developer (Java)

29%

29%

21%

30%

17%

Developer (C#)

20%

19%

18%

28%

23%

Developer (DB)

4%

5%

2%

4%

4%

Test engineer

9%

14%

13%

22%

16%

Web programmer (PHP/MySQL)

21%

11%

13%

13%

18%

Web-programmer (ASP.Net/MS SQL)

16%

7%

4%

15%

13%

System administrator (Win)

2%

4%

7%

8%

6%

System administrator (UNIX)

2%

4%

2%

5%

2%

Others

8%

16%

11%

19%

15%

Average quantity of mentioned engineers

1.53

1.39

1.16

1.73

1.4

52.	 Positions for which the respondent companies hired employees in 2012 (depending on company turnover)
Over
$100
million

From $20
million
to $100
million

from $4
million
to $20
million

from $0.5
million to
$4 million

Less
than $0.5
million

Developer (C/C++)

40%

55%

44%

22%

9%

Developer (Java)

40%

36%

22%

15%

5%

Developer (C#)

40%

27%

44%

20%

5%

Developer (DB)

0%

0%

17%

3%

0%

Test engineer

40%

45%

17%

13%

9%

Web programmer (PHP/MySQL)

0%

36%

11%

21%

9%

Web-programmer (ASP.Net/MS SQL)

20%

18%

22%

12%

5%

System administrator (Win)

0%

18%

6%

6%

0%

System administrator (UNIX)

0%

0%

6%

1%

0%

Others

0%

0%

17%

21%

9%

Average quantity of mentioned engineers

1.53

1.39

1.16

1.73

1.4

demanded experts – 1C programmers and

ers for mobile devices (under Android and

technical support engineers (4 times each)

iOS) were mentioned mostly in the category

were mentioned by the respondents. Data-

of “other demanded engineers”.

base administrators, project managers, 1C

In May 2013, the RUSSOFT Association

system administrators, software deployment

and the TEAM FORCE out-staffing company

and maintenance engineers, Ruby and Delphi

signed a Cooperation Agreement regarding

programmers, sales managers and consul-

development and operation of a system for

tants were also wanted. Application develop-

exchange information about temporarily un-

81
Chapter 5 / Employee recruitment and headcount reduction
53.	 Distribution of positions for which the respondent companies hired employees in 2012,
depending on the respondent’s location
Moscow

St. Petersburg

Siberia

Ural

Other
towns

Developer (C/C++)

21%

31%

25%

25%

27%

Developer (Java)

17%

26%

19%

25%

7%

Developer (C#)

10%

26%

25%

13%

32%

Developer (DB)

7%

6%

0%

0%

2%

Test engineer

17%

26%

6%

25%

10%

Web programmer (PHP/MySQL)

17%

20%

25%

0%

20%

Web programmer (ASP.Net/MS SQL)

19%

3%

6%

0%

20%

System administrator (Win)

12%

3%

0%

0%

5%

System administrator (UNIX)

2%

0%

0%

0%

2%

committed developer resources. Initially, the

In view of the TEAM FORCE team’s experi-

system was created by Artezio directly for the

ence in development and administration of

RUSSOFT Association website and repre-

the SmartSAP portal, RUSSOFT made a

sented an online service to exchange informa-

decision to place the system under manage-

tion about temporarily free labor resources

ment of TEAM FORCE Group.

between the RUSSOFT member companies.

82
Chapter 5 / Shortage of engineers

Shortage of engineers

T

he number of companies that do

the existing employees. Also, staff shortage

not suffer for acute staff short-

is not a problem for some individual suc-

age considerably reduced for the

cessful companies (mainly for the producers

last year. There are only 27% of

of licensed software who are capable to

such companies left – but in the

increase sales without staff expansion) and

last several years their number was at the

for international corporations’ R&D centers. It

level of 45%-55%. Among medium and large

can be assumed that their immunity against

enterprises (with the turnover over $4 mil-

staff shortage is a matter of time. It should

lion), which account for 90% of all respondent

be noted that all largest (with the turnover

companies’ staff, this indicator was equal to

more than $100 million) and quickly growing

12% only.

companies experience staff shortage.

It is remarkable that 59% of companies

The deficit of developers is characterized

with turnover less than $0.5 million are not

in particular by the so called hh.index – the

pressed for staff shortage. The reason is that

ratio between the number of CVs and vacan-

in most cases they have to solve the prob-

cies published on the hh.ru and career.ru

lem of survival and do not know how to pay

websites. In the autumn of 2012 this index

54.	 Share of the companies that do not feel an acute shortage of developers, %
60

57

56

54

50

46
40
30

27

20
2008

2009

2010

2011

2012

83
Chapter 5 / Shortage of engineers
55.	 Share of companies with turnover over $4 million dollars

development” section increased by 28% and

experienced an acute lack of following developers

the number of vacancies – by 62% from April
2012 to April 2013.

Developer (C/C++)

15%

According to the ANCHOR High Tech-

Developer (Java)

41%

nologies data, in 2012 there was a serious

Developer (C#)

21%

Developer (DB)

12%

estimated demands, the employer was forced

Test engineer

12%

to accede to their requests.

Web programmer (PHP/MySQL)

12%

Web programmer (ASP.Net/MS SQL)

26%

System administrator (Win)

Like in the previous two years, most of companies having the turnover over $4 million
experienced a lack of Java developers (35%)

0%

Others

Moscow. Although they had obviously over-

3%

System administrator (UNIX)

problem with recruitment of test engineers in

24%

and of С# developers (23%).
The data of recruiting agencies and job
search portals are generally agreed with our

for programmers was 1.4 (there were 1-2

survey results. Considerable discrepancies

CVs per one vacancy, whereas for the entire

are explained, first of all, by a different selec-

Russian labor market the ratio was equal to

tion of interrogated employers as well as by

3.2 (there were over 3 CVs per one vacancy).

use of different survey techniques.

Thus, applicants for software developers

For example, according to the Superjob.

positions face practically no competition, and

ru data, 1С, C++, PHP and Java program-

in this case employers have no choice. This

mers were the most demanded IT engi-

situation in the labor market results in an

neers in Russia in 2012. Recruitment of

unjustified salary growth and in a certain staff

Ruby programmers was the most difficult

turnover growth.

task (there were about three vacancies per

According to the Superjob research

one applicant). However, the Superjob.ru

center, the number of CVs in the “Software

analysts note that the share of requests for

56.	 Distribution of positions for which the acute lack of developers is felt depending on the
respondents’ location (reference rate)
Moscow

St. Petersburg

Siberia

Ural

Other
towns

Developer (C/C++)

12%

11%

19%

13%

17%

Developer (Java)

21%

29%

19%

38%

10%

Developer (C#)

2%

14%

31%

0%

27%

Developer (DB)

7%

9%

0%

0%

0%

Test engineer

7%

9%

0%

0%

5%

Web programmer (PHP/MySQL)

12%

11%

19%

13%

17%

Web programmer (ASP.Net/MS SQL)

10%

9%

6%

13%

17%

System administrator (Win)

0%

0%

0%

0%

2%

System administrator (UNIX)

0%

3%

0%

0%

0%

84
Chapter 5 / Shortage of engineers
this language does not exceed 1% of all

experience from 3 to 6 years was 20%, and

requests.

the share of those with more than 6 year’s

According to HeadHunter, the program-

experience was 1% of all vacancies. There

mers with 1 to 3 years of experience are the

were 8% of vacancies suitable for developers

most in-demand (71% of vacancies on the

without experience.

hh.ru website). Demand for developers with

85
Chapter 5 / Foreign language skills

Foreign language skills

T

he surveys undertaken within

technical documentation reading, 28% admit

the last 5 years allow us to state

that they have basic skills only and 7% do not

that there is an increase in the

specify their level of proficiency in English.

number of developers (both in
absolute and in relative values)

According to ANCHOR High Technologies,
the situation with knowledge of English is

who have a good command of English. Their

much better: 64% of all developers (included

share grew from 65% to 72%. Other sources

in the recruiting agency’s database) have a

confirm this trend. It comes very often now

good command of English or are fluent in

that organizers of IT conferences in Russia do

English.

not engage interpreters to translate speeches

Considerable differences in the data of two

of foreign English-speaking contributors as

companies can be explained by the fact that

they believe (not without reason) that almost

they cover absolutely different audiences. It

all engineers who deal with imported software

is arguable that Superjob’s audience is much

or who sell their services and solutions in

wider, whereas ANCHOR is more oriented to-

foreign markets have a good command of

wards recruiting of personnel for international

English.

companies and for Russian exporters. Besides,

At the same time, according to the Su-

the knowledge of language at the level of

perjob research center, only 15% of software

technical documentation can be considered as

developers specify the ‘fluent’ or ‘conver-

a good command of language.

sational’ level of English in their CVs, 50%
declare knowledge of language at the level of

86

Concerning the German language, we
cannot state any unambiguous growth. Most
Chapter 5 / Foreign language skills
51.	 Most popular developers that were employed by respondent companies in 2008-2012, %
80
70

65

10
3

2009

68

68

5

8

11

2008

60

65

72

20
10
0

%

English

4

%

German

likely, the share of German-speaking develop-

2010
%

2011

8,5 9,5
2012

Others

teaching. However, this growth is mainly con-

ers in the in interrogated export companies

nected to the fact that companies from the

almost did not change and remained at the

two capitals have an opportunity to poach

level of 8-10% within the last 5 years.

the best developers from regions and from
small companies.

According to this year’s data, we can assume

The growth of the share of English-

that the number of employees who have

speaking employees in IT companies is not

good command of other languages has in-

caused by improvements in the Russian

creased.However, from year to year this figure

state educational system. People often study

varies widely that is indicative of a fairly big

foreign languages at their own expense or at

measurement error.
An increase in the number of developers
capable to speak other languages can be
explained by the change of Russian software

their employers’ expense, attending language
courses and engaging teachers.
As a rule, skilled English teachers do
not tend to work at schools and universi-

exporters’ geographical priorities (entrance

ties because of the low salary level in the

to the markets of South-East Asia, Latin

state educational institutions in Russia. This

America, and the Middle East). However, in

problem should be solved by the govern-

most cases, knowledge of other foreign

ment. Otherwise, the high-technology sector

languages is desirable but not crucial. As a

of economy will not fit the requirements of

rule, knowledge of English is sufficient for

the international competition, neither it will

communication with foreign customers, while

correspond to the potential of engineering

localization and promotion can be performed

resources available in Russia.

by local partners.

It is especially important to improve the
language teaching level in regional universi-

Despite an obvious progress in foreign lan-

ties and schools because many of these

guages proficiency, many problems remain

institutions provide a high level of education

unsolved. There are not enough English-

in the field of mathematical and technical sci-

speaking employees in small and in regional

ences but cannot provide their graduates with

companies. An increase in the number of

competitive positions with respect to foreign

such employees is provided by the larg-

languages skills.

est companies located in Moscow and St.

Russia is not at the bottom of the English

Petersburg.Partly, this happens because they

proficiency level list, but it is in the second

pay for their employees’ foreign language

half of the world ratings which cover several

87
Chapter 5 / Foreign language skills
58.	 Share of the staff with good knowledge of foreign languages,

percentage of English-speaking population in
these countries is ensured by the countries’

depending on company location

integration in the world economy and by

English

German

Others

Moscow

80%

12%

14%

of high technologies. In a small city of Salo

St. Petersburg

76%

2%

4%

(Finland) with the population about 55 thou-

Siberia

62%

4%

1%

Ural

40%

2%

2%

that export their hi-tech products to several

Other towns

39%

3%

0,2%

dozens of countries. We cannot say that all

their considerable achievements in the field

sand people, there is a great number of the
companies (large, medium, and very small)

these companies enjoy up-to-date production lines. However, they achieved very good

59.	 Share of the staff with good knowledge of foreign languages,
depending on company turnover

results thanks to the state support system as
well as to the knowledge of the global market
which is largely provided by a high proficiency

Over
$100
million

From
$20
million
to $100
million

From $4
million
to $20
million

from
$0.5
million
to $4
million

Less
than
$0.5
million

in English.
Venture investors are debating on the reasons
why Russian startups often work over devel-

English

79%

62%

73%

48%

39%

German

12%

3%

3%

3%

3%

Others

14%

3%

2%

0.4%

4%

opment of solutions without any idea of their
potential implementation in the global market.
Some analysts consider that the main reason
lies in their poor knowledge of English. Others see the reason in the unwillingness or

dozens of countries. For example, according

in the inability to learn the situation in the

to GlobalEnglish company research where

global market. Nevertheless, it is difficult to

the level of proficiency in business English

deny that an insufficient level of proficiency

was defined, Russia received 3.6 points. That

in English undermines the ability of Russian

is higher than in Colombia (2.75), Brazil (2.95)

business to create and to provide competi-

and Turkey (2.97), but it is much lower than in

tive solutions and services worldwide, and

the Philippines (7.11), India (5.57) and some

furthermore, blocks their promotion in the

other large countries. Sweden and Finland

global market. The unwillingness to monitor

who take the top positions in the English

the global trends can be mainly caused by

knowledge ratings should be a reference

weak competence in languages.

point for Russia. In many respects, the high

88
Chapter 5 / Salary

Salary

A

ccording to the present survey,

company, for some reason, named a figure of

the average salary of software

59 thousand RUR following the results of the

developers (including man-

first half of 2012. But a Russian programmer’s

agers) in 2012 was $2,300

average salary around 70 thousand RUR looks

(71,300 RUR). It grew up

more realistic. However, this figure is only use-

approximately by 7-8%. Following the results

ful for determination of general trends in the

of 2011 (when the growth was 18%) we can

entire labor market of Russia, as the pay level

state a certain decrease in the remuneration

dispersion depending on the developer’s level

growth rates.

and on city is quite great.

The data on salary obtained as a result of

The gap in the pay level among Moscow,

the present survey are agreed with informa-

St. Petersburg, and other Russian cities did

tion received from recruiting agencies. The

not reduce in the last 2-3 years. According

existing diversity is explained by the differ-

to the survey of software export companies,

ence of covered audience, by compared

there is no great difference by remuneration

periods and by calculation techniques. For

of experienced developers and managers

example, according to the Superjob research

between the two capitals (the difference is

center, salary offers increased by 12% from

11-13%). However, we should consider that

April 2012 to April 2013.It does not contra-

Moscow companies have the significant num-

dict the growth of 7-8% mentioned above.

ber of employees who work in other cities and

The fact is that Superjob determined not the

countries (where the pay level is often much

average pay per year, but salary offers at a

lower than in Moscow and St. Petersburg).

specific point in time. Besides, their survey

The data provided by recruiting agencies

covered not only exporters but all Russian IT

and by analysis of job offers on the Internet

employers.In addition, the comparison time

give evidence of a larger difference in salaries

frames do not match in different studies.

between the two capitals. According to infor-

According to CNews Analytics research

mation of the Yandex.Job job search system,

(its results were published in the autumn of

Java programmer’s average salary in Moscow

2012), on the average software developers

is 98 thousand RUR(in St. Petersburg, it is

receive 83.8 thousand RUR per month. Similar

20% less, and in Novosibirsk – 38% less).

data is provided by the Rabota.ru resource –
75-80 thousand RUR. HeadHunter recruiting

Approximately the same gap was determined by the CNews Analytics.

89
Chapter 5 / Salary
Beginning developer

Experienced developer

Manager

$1140

$2375

$2875

60.	 Average
monthly
salary of IT
employees
in 2012

61.	 Average monthly salary

62.	 Average monthly

63.	 Average monthly

of novice developers

salary of experienced

salary of managers in

in 2012, depending on

developers in 2012,

2012, depending on

company location

depending on company

company location

location

$1640

100%

$2530

$3060

67%

87%

89%

$855

$1915

$2355

52%

Regions

$3445

100%

$1120

St. Petersburg

$2900

100%

Moscow

66%

68%

64.	 Comparison of software developers average monthly salary in 2012 in companies
with different incomes
Over $100 million

From $20 million to
$100 million

From $4 million to
$20 million

From $0.5 million to
$4 million

Less than $0.5
million

100%

110%

105%

73%

56%

90
Chapter 5 / Salary
65.	 Average pay level of software developers in different regions of

The HeadHunter data on Java programmers shows a larger gap between the capital

Russia, depending on experience (thousand rubles)

and other cities. At the end of 2012, they
were offered the average monthly salary of
0-3
years

3-5
years

5-10
years

Over 10
years

Russia

54.5

74.3

92.4

114.0

Moscow

71.6

92.1

109.2

125.0

provided analysts with more correct data on

St. Petersburg

44.7

67.5

84.6

101.4

the cost of services provided by respondent

Other cities

38.8

54.7

70.5

88.3

107.7 thousand RUR in Moscow. In St. Petersburg, the figure was 30% less, in Novosibirsk – 44% less, and in Kazan – 58% less.
The change in the formulation of a question about the price of man-hour work

outsourcing service providers. Earlier, the
majority of respondents found it difficult to
answer this question or cited an unrealistic

than in medium-sized ones, whereas the

figure. As a result, we had to calculate the

pay level in large companies is higher. This

average cost based on a small number of

contradiction can be explained by the fact

companies that did not make sense because

that large service providers reduce the price

of a high measurement error.

of their services for the customer due to use

This year, there are much more answers

of developer labor in other countries, while in

to the question about the price of a man-

the questionnaire they specify the pay level in

hour service than in last few years. However,

Russia.

the range of specified values is still too wide

It is worthy of note that the man-hour

which an important gap in man-hour prices

price and the average salary almost do not

between different locations and also testifies

depend on the share of export in the consoli-

that a part of respondents strongly underesti-

dated revenues. In the companies with the

mated or overestimated their figures (as a rule,

export share that ensures over 50% of the

they are small companies which do not mark-

turnover, the expenses on personnel are only

edly affect the average level). In such condi-

4-5% higher than in the companies that gain

tions it is more practical to look at data of

the most part of their income from sales in

man-hour price of services in different regions

the domestic market. A few years ago, the

and in companies with different turnover.

difference was greater that was explained

It is remarkable that the employee’s manhour price in large service companies is lower

by higher requirements to employees which
work for export, as well as by higher financial

Source: Yandex.Job

66.	 Average salary of programmers in Russia at the beginning of summer of 2013 (thousand rubles)
80 000
70 000

79
68

66

60 000

66

C#

JavaScript

59
53

50 000

47

40 000
C++

Java

1C

Web

PHP

91
Chapter 5 / Salary
67.	 Profile man-hour price, offered for the customer,

68.	 Man-hour price for the customer, depending

depending on respondent company location (in USA)
Moscow St. Petersburg

Software development (beginner)
Software development (experienced)
Software development (team manager)
Software testing (experienced)

Regions

34

26

23

48

38

33

56

49

35

47

32

23

on respondent company export share (in USA)
Less than
50%

Software development (beginner)
Software development (experienced)
Software development (team manager)
Software testing (experienced)

Over
50%

25

26

37

36

39

43

27

31

69.	 Profile man-hour price for the customer, depending on respondent company turnover (in USA)
Over $100
million

From $20
million to
$100 million

From $4
million to
$20 million

from $0.5
million to
$4 million

Less
than $0.5
million

Software development (beginner)

19

24

31

31

30

Software development (experienced)

25

36

40

46

37

Software development (team manager)

25

40

47

51

42

Software testing (experienced)

17

27

39

38

42

solvency of foreign customers. The situa-

of the CIS countries which do not greatly dif-

tion has changed thanks to a considerable

to know foreign languages in order to work

vency and to the growth of the market share

92

fer from Russia (in any case, it is not essential

increase in Russian customers’ financial sol-

with customers in the neighboring countries).
Chapter 5 / Staff training. Universities

Staff training. Universities

D

ue to the staff shortage, the

the export share lower than 50%, increased

majority of companies actively

thanks to the graduates by 8.3% while that

recruit developers without ex-

of those with the export share over 50% – by

perience (university graduates).

29%. Nearly the same ratio was observed

However, recent students’ lack

following the results of 2011. It is explained

of experience is conditional as many of them

by the fact that exporters still have higher

undertake internships or even participate in

requirements to staff training and to work

commercial projects in parallel with university

experience.

degree courses.
Now, large enterprises tend to recruit

Like a year ago, Moscow companies
employed the least number of graduates

university graduates more actively than small

because they have more opportunities to en-

companies. A few years ago, small enter-

gage the most skilled developers from regions

prises employed recent students more often

and from abroad (particularly, hiring them for

and the leading software companies preferred

their offshore development centers). Moscow

experienced developers.

attracts programmers from regions thanks to

In 2012 university graduates obtained
employment in 71% of respondent compa-

the highest salaries in Russia.
Following the results of surveys for the

nies (thus several more percent of respon-

last 5 years we can say that the share of

dents, most likely, simply did not specified

companies that cooperate with higher educa-

the number of recruited young engineers

tion institutions has been gradually reducing.

although they hired them). For the enterprises

For the last five years it decreased from 58%

with the turnover over $4 million this figure is

to 47% (generally at the expense of the small-

81% and for those with the turnover less than

est companies that encounter difficulties in

$4 million – 68%.

labor market competition with larger compa-

In 2012 the respondent companies’ staff in-

nies). Many small companies cannot afford

creased thanks to university graduates by 4.6%.

to expand their staff, therefore they are not

It is slightly more than a year before (4.1%).
Companies that are oriented towards the
Russian market employ newcomers more
willingly. In 2012 the staff of companies with

interested in cooperation with higher education institutions.
Besides, in recent years it became much
harder even for medium companies and even

93
Chapter 5 / Staff training. Universities
70.	 Share of the university graduates employed in 2012

education institutions or colleges experience

in companies’ staff

difficulties as educational institutions come
into contact reluctantly. 49% of respondents

Moscow

2.4%

admit that the process is very difficult to be

St. Petersburg

9%

organized and 38% of companies cannot

Siberia

13%

easily find resources in the universities to train

Ural region

4.6%

Other cities

8.7%

inexperienced graduates.
The quality of engineers is affected by the socalled ‘demographic hole’ caused by a sharp
decrease in the number of schools graduates

for quite large foreign companies to harmo-

due to the decline of the birth-rate during

nize relations with the leading universities,

the ‘perestroika’ period in the 1990ties (some

which more and more realize their position as

growth of the number of school graduates is

a supplier of super-valuable resources.

expected not earlier than in 2018).

During the last 5 years the main form of

Entrance to universities became easier

cooperation with universities was the intern-

and the threat of expel decreased. There-

ship of students in companies. The share of

fore both – higher education institutions and

those who apply this model almost did not

young people have fewer stimuli to improve

change and is equal now to 40%. Among

the quality of training. By 2010 the fall of

other forms of cooperation respondents

graduates’ and student’s educational level

mentioned the following: creation of special-

became obvious almost for all employers.

ized basic chairs and laboratories in universities, providing free software (or software at a

Certainly it only concerns the average level of

preferential price) for universities, offering free

education which is slowly decreasing. At the

training courses and mentoring programs for

same time, there are some positive changes.

students, implementation of joint educational

For example, the state financial support to the

projects, holding career events and job fairs,

leading technical universities has improved. In

supporting graduates’ thesis contests and

particular, universities received grants which

programming competitions, monitoring of

allowed them to invite well-known professors

student’s projects with the company’ staff

from abroad. Furthermore, judging by achieve-

guidance, participation in development of a

ments of Russian students and graduates in

training course for testers.

international competitions in software engineer-

According to the Career.ru poll (the

ing, significant deterioration in comparison to

portal belongs to the HeadHunter company),

foreign universities can not be observed. This

30% of companies cooperating with higher

can be partly explained by the fact that the

71.	 Cooperation between companies and universities
2008

2009

2010

2011

2012

Students training

42%

41%

41%

37%

39%

Graduates employment

34%

23%

26%

32%

31%

Courses for employees

24%

21%

18%

17%

19%

Others

1%

14%

10%

17%

12%

Do not cooperate

42%

48%

48%

48%

53%

94
Chapter 5 / Staff training. Universities
72.	 Cooperation between companies and universities, depending on companies’ turnover
(according to the 2013 survey)
Over $100
million

From $20
million to
$100 million

From $4
million to
$20 million

from $0.5
million to
$4 million

Less
than $0.5
million

Students training

100%

82%

50%

36%

9%

Graduates employment

100%

55%

44%

29%

0%

Courses for employees

40%

64%

33%

13%

9%

Others

20%

27%

22%

10%

0%

Do not cooperate

0%

18%

44%

53%

82%

level of IT-education is gradually decreasing in

Another reason is that higher education

most countries (especially in the West).

institutions have not learned yet how to work

However, an increase in the state financial
support still does not allow involving young

with rating agencies. As a result, analysts
in the Rating Agencies do not have enough

talented teachers in the educational process

information on higher education in Russia.

in universities in the quantity necessary to

The situation may change in the future as the

retain the existing quality of education. The

Russian government is in train of implement-

salary at universities remains rather low and

ing a series of measures for supporting their

many things stay up thanks to the enthu-

accession to the Universities’ ratings. 40

siasts. But these enthusiasts retire over

billion rubles are to be provided in the budget

time or switch to a better-paid job by family

of Russia in the next 4 years for this purpose.

circumstances. The same things happen

A part of this money has been already al-

with teachers of Physics and Mathematics in

located to 15 Russian universities who won in

the secondary schools, who should provide

a tender. Each of them will receive about 600

a basic educational level to future students.

million rubles ($20 million) for these purposes

Universities are unable to train excellent

in 2013.

engineers without such basic knowledge.

So far, it is difficult to compare Russian

The government of Russia sets the task to

and foreign universities by key indicators

increase the university professors’ and school

which are being used in the international rat-

teachers’ salary up to the average level of the

ings.Nevertheless, higher education institu-

region where the educational institution is lo-

tions in Russia take the highest positions in

cated. However, such increase is materialized

some specific ratings. For example, the St.

too slowly. Besides, providing the pay rate at

Petersburg National Research University of

the level of the average regional salary is obvi-

Information Technologies, Mechanics and

ously not enough to involve the best teachers

Optics (SPNRU ITMO) is the best in the world

and professors.

by their results in participation in the ACM In-

Russian technical universities are presented

during the last decade. St. Petersburg State

ternational Collegiate Programming Contests
in the international ratings of universities ex-

University is the first 10 and some other Rus-

tremely poorly (or they are placed far outside

sian higher education institutions are in the

the first hundred of universities in the ratings).

top twenty in the rating prepared by organiz-

One of the main reasons is a small volume of

ers of this competition.

R&D performed by higher education institu-

At the beginning of July 2013 the regular

tions within contracts with private business.

ACM ICPC contest first took place in Russia

95
Chapter 5 / Staff training. Universities
73.	 Medal places of the Russian universities teams at the Student World Cup in Programming (ACM International
Collegiate Programming Contest) from 1999 to 2013*
Years 19992008

2009

1

Saint Petersburg State University of
Information Technologies, Mechanics
and Optics

3, 5, 3, 3,
1, 3, 3, 1

St. Petersburg State University

9, 1, 1, 6,
11

3

3

Moscow State University

9, 2, 2, 9,
10, 5

4

Saratov State University

6, 7, 1, 6

5

Izhevsk State University
Altai State Technical University

3

7
8

Perm State University
Petrozavodsk State University

13.1

10

Novosibirsk State University

5

11

Nizhny Novgorod State University

12

Ufa State Aviation Technical University

13

Ural State University

1

4

9

2013

1

Moscow Institute of Physics
and Technology

2012

8, 9, 3

6

2011

1

2

2010

Total number of prizewinners

4

2
4

9

10

7

5

6

10

10

8
3
13
5

5
10
13
from 2 to 5
(in 20062008)

4

11

5

5

3

4

* The quantity of medal
places varied from 10
to 13 during this period

(in St. Petersburg). SPNRU ITMO was the

the ACM International Programming Contest

host party of this prestigious competition and

only about 15 years ago.

Source: ACM International Collegiate
Programming Contest,
the rating is compiled
by the RUSSOFT Association.

place in the overall ranking. This university

places in this Contest on a regular basis. In

became the fivefold world champion. No

the last 5 years, there have usually been at

the university’s team once again won the top

Some more universities also take high

other team has won so many times for the

least 4 Russian teams among 12-13 prize-

entire 37-year history of this competition.

winners of the contest. Apart from SPNRU
ITMO with their gold medal, one silver and

Russian universities started to participate in

96

That said students of SPNRU ITMO and other

two bronze medals were awarded to the
Chapter 5 / Staff training. Universities
Russian teams in 2013 (St. Petersburg State

within the Google Pwnium competition and

University – the 5th absolute place, Moscow

was awarded the first prize – $60,000 in

State University – the 10th place, Perm State

2012. He also earned $50,000 from partici-

University – the 13th place). Three more

pating in the similar competition in 2011.

teams of Russian universities were very close

Egor Kulikov, an employee of the Yandex

to the prize-winners: Altai State Technical Uni-

company, became the winner of the most

versity, Ufa State Aviation Technical University

prestigious international individual competi-

and Ural Federal University who occupied the

tion among programmers – TopCoder Open

14th-16th places. Totally teams of 13 Russian

2012.

universities have become prize-winners of the

At the 24th International Olympiad in Infor-

ACM ICPC contest within their 15 years of

matics, which was held in Italy in September

participation in this Contest.

2012, the victory was shared by the Russian

Such competitions in many respects

national team and by the national team of

reflect the quality of programmer training.

China which collected four gold medals each.

Judging by their results, programmer training

During these competition it was decided to

in Russia is the best in the world, although

hold the International Olympiad in Informatics

Chinese universities achieved a similar prog-

(IOI) 2016 in Russia – in Innopolis just being

ress in the last decade. Among leaders and

built near Kazan.

prize-winners of the Contest there have been
also teams from Poland, Belarus, and Ukraine

It becomes trendy to hold in Russia different

but these countries do not have as many

competitions in programming and informat-

strong teams as Russia and China. Individual

ics, as well as various international contests

representatives of Western Europe and the

in the field of innovations. Only several days

USA sometimes also appear among the top

after ACM ICPC contest, the world final of the

teams.

Imagine Cup (an international contest of student’s innovative projects which was organized

Not always champions and prizewinners on

by the Microsoft) took place in St. Petersburg,

sports programming reach the outstanding

and also for the first time in Russia. Next year,

results in work in commercial and state struc-

ACM ICPC will take place in Yekaterinburg,

tures. However, they are able to meet the

Russia. Holding similar competitions in Rus-

most complex challenges in their R&D and

sian cities promotes the ‘Russia’ brand in the

in the labor activities that is being strongly

world market of high technologies, as well as

confirmed by the fact that many Russian

contributes to the popularity of highly demand-

ACM contest champions and prize-winners

ed IT-profession within the country.

established successful software companies or
work at key C-positions in these companies

Achievements of students’ performance in

(DevExperts, SPb Software, Yota, VKontakte).

the programming contests give an idea of the

Russians also win in other competitions

quality of IT-education at Russian universities.

in programming and in informatics. In the last

However, it is more important to estimate this

three years they steadily became winners of

quality by the degree of employer satisfac-

the Facebook Hacker Cup contest. In 2013

tion. The university rating by this indicator

as well as two years earlier Pyotr Mitrichev

would not be completely objective neither, but

won these competitions, while Roman An-

comparison of universities by different criteria

dreyev from St. Petersburg State University

allows drawing more reasonable conclusions

was the winner the last year.

concerning their effectiveness for the industry

Sergey Glazunov, student of Tyumen
State University, became the first one who
found vulnerabilities in the Chrome browser

and for the Economy altogether.
More than a year ago, the research center
of the Superjob.ru recruiting portal issued a

97
Chapter 5 / Staff training. Universities
74.	 The Superjob.ru recruiting portal rating of higher education institutions
Place

Name

The average salary
of graduates having
positions according to
the acquired specialty,
thousands of RUR

1-4

Moscow State University

85

1-4

Moscow Engineering Physics Institute

85

1-4

Moscow Institute of Physics and Technology

85

1-4

Novosibirsk State University

85

5

Bauman Moscow State Technical University

80

6-10

Moscow State Institute of Electronics and Mathematics

75

6-10

Novosibirsk State Technical University

75

6-10

Nizhny Novgorod State University

75

6-10

St. Petersburg State University

75

6-10

Ural Federal University

75

11-12

Saratov State Technical University

73

11-12

Ufa State Aviation Technical University

73

13-16

Kazan (Volga) Federal University

70

13-16

Moscow Aviation Institute

70

13-16

Moscow Institute of Electronic Equipment

70

13-16

Nizhny Novgorod State Technical University

70

rating of universities that was based on the

ber of the companies representing the spe-

evaluation of how successful their gradu-

cific city, first places are usually occupied by

ates were in getting a job in Moscow (first

universities from Moscow and St. Petersburg.

of all, the salary level was estimated). Surely,

In this regard, it is more appropriate to com-

universities from Moscow got an advantage

pare universities located in one city; however,

in this rating, but still, it provided sound basic

sufficient sample for this comparison presents

data. The quality of training was estimated for

only in Moscow and in St. Petersburg.

all specialties, not just for the IT alone.

Nevertheless, even taking aforesaid note
into account, universities ranking reflects the

The rating of RUSSOFT Association is cre-

level of programmers quality especially when

ated based on the poll of software exporters

taking into consideration the range in which

and, therefore reflects the view of software

the specific university is situated (3-5 nearing

business’ executives as to how successfully

places).

universities train personnel for the software

In the total, respondents have mentioned

industry. However, it is also not beyond

228 universities whose graduates have been

reproach.

mentioned as mostly demanded among IT

Since the position of a university in this
rating depends to a great extent on the num-

98

companies in the region. If repetitions are ex-
Chapter 5 / Staff training. Universities

Place

Name

The average salary
of graduates having
positions according to
the acquired specialty,
thousands of RUR

17-19

Moscow Power Engineering Institute

68

17-19

Orenburg State University

68

17-19

Penza State University

68

20-22

Volgograd State Technical University

67

20-22

St. Petersburg State Polytechnic University

67

20-22

Tula State University

67

23

Izhevsk State Technical University

66

24-26

Vladimir State University

65

24-26

Moscow State Institute of Radio Engineering, Electronics and
Automatics

65

24-26

Ryazan State Radio Engineering University

65

27-28

Kazan State Technical University

62

27-28

St. Petersburg State Electronic Technical University

62

29-33

Voronezh State Technical University

60

29-33

Moscow State University of Instrument Making and Informatics

60

29-33

Moscow State University of Means of Communication

60

29-33

St. Petersburg State University of Space Instrumentation

60

29-33

Saint Petersburg State University of Information Technologies,
Mechanics and Optics

60

cluded, employers have evaluated more than
80 higher educational institutions.

work in software companies, although there
is a huge staff shortage. Therefore there is a
great potential in the High School for increas-

St. Petersburg National Research University

ing the number of graduates who are capable

of Information Technologies, Mechanics and

to satisfy employers. First of all, it is neces-

Optics, occupies the first places in two rat-

sary to create stimuli to encourage young and

ings. It is also a leader by one more indicator –

perspective people to work in the educational

by the share of graduates who found a job

system, creating competition for university

according to their university specialty (76%).

professor’ and school informatics teacher’s

In the majority of other universities which train

job positions.

software developers this share is much less –
about 50%. Experts consider that 15-20%

The post graduate education system (the
career development and staff retraining sys-

of university graduates are ready to work for

tem) created by the organized business may

software companies right after the graduation.

also ensure an increase in the Russian labor

Other 30-35% of graduates need to continue

market supply. For example, St. Petersburg

their studies (to make them more practical).

Academy of Postgraduate IT Education (SPb

Thus, a half of graduates who got degree of a

ITAPO) was opened in 2013. Top managers

software developer are unable to immediately

of Lanit-Tercom, SoftJoys and First Line Soft-

99
Chapter 5 / Staff training. Universities

Place

Name

2010

2011

2012

For the last
three years

75.	 Ranking of the universities whose graduates are in great demand among the software companies

1

Saint Petersburg State University of Information Technologies, Mechanics and Optics

26

20

19

65

2

Bauman Moscow State Technical University

28

17

19

64

3

St. Petersburg State University

20

22

19

61

4

Moscow State University

23

10

17

50

5

Moscow Institute of Physics and Technology

18

15

12

45

6

St. Petersburg State Polytechnic University

21

10

12

43

7

St. Petersburg State Electronic Technical University

19

9

10

38

8

Moscow Engineering Physics Institute

8

6

8

22

9

Novosibirsk State University

7

2

9

18

10

Southern Federal University

3

3

6

12

11

Novosibirsk State Technical University

-

4

5

9

12

St. Petersburg State University of Space Instrumentation

6

2

2

10

13

Moscow Aviation Institute

6

2

2

10

14

St. Petersburg State Institute of Technology (Technical University)

-

5

3

8

15

Baltic State Technical University

5

3

-

8

16

St. Petersburg State University of Telecommunications
named after Prof. Bonch-Bruevich

3

2

2

7

17-20

Nizhny Novgorod State University

-

2

3

5

17-20

Omsk State University

-

2

3

5

17-20

Omsk State University

1

1

3

5

17-20

Voronezh State University

1

1

3

5

21

South Ural State University

2

2

1

5

22-23

Ulyanovsk State University

0

1

3

4

22-23

Omsk State Technical University

0

1

3

4

24

Don State Technical University

-

2

2

4

25

Moscow State University of Economy, Statistics and Informatics

-

2

1

3

26-27

Samara State Space University

-

3

-

3

26-27

Yaroslavl State University

-

3

-

3

Source: RUSSOFT Association

100
Chapter 5 / Staff training. Universities
ware became the initiators of the Academy

tion programs of the city/enterprise level – are

creation. Within two years about twenty

expected to be established on the basis

chairs offering modular programs for retrain-

of existing training centers in the leading

ing of professionals in various IT areas – from

market-players.

programming and software testing to applica-

101
Chapter 5 / Situation on the labor market in Russia and in other countries

Situation on the labor market in Russia
and in other countries

T

he Russian programmers’ labor

lem of diminishing number of applicants in

cost which rapidly grew for the

technical colleges and universities in the West,

last decade did not promote

not only because of the birth rate but also

competitiveness of Russia in

because of decreasing popularity of technical

the global market of software

specialties. The majority of young people in

and software development services. Due to

the western countries are not eager to strain

a rapid growth of salary, Russian software

themselves studying such difficult subjects as

companies’ export (in any case – the export

advanced mathematics and physics. How-

of software development services) could have

ever, this problem is typical not only for such

reduced long ago if the same tendencies

countries as the USA and Germany, but also

did not take place almost around the world.

for countries with developing economies like

Shortage of programmers is a global prob-

Russia and Mexico.

lem of the world economy. The labor market

There is another problem in the economi-

supply goes behind the growing demand for

cally developed countries: many of university

software developers In the majority of devel-

graduates are not prepared for unsupervised

oped countries.

work. Even in the USA employers complain

Russia is experiencing right now a ‘demo-

that they have to teach recent students the

graphic hole’ that is caused by a great reduc-

sense of initiative, so those students could

tion of the birth rate about 20 years ago. But

become productive employees.

the reduction of the young people share in

According to experts from Ernst & Young,

the overall population is observed in the eco-

nies on transfer of IT operations to offshore

if it is a time-expanded process. In the states

territories, which was done in the mid-nine-

with high living standards There is a prob-

102

the decision of many large western compa-

nomically developed countries as well, even

ties, became one of the main reasons for the
Chapter 5 / Situation on the labor market in Russia and in other countries
current industry’s staff shortage. For example,

Staff shortage is experienced even in the

about 32 thousand students studied math-

densely populated India which is the absolute

ematics, physics, and computer sciences

world leader in the area of IT-outsourcing

(i.e. the subjects that are necessary for work

services. However, the staff shortage in

in the IT area) at British universities in 1998.

this country is not connected to a birth rate

Two years later, the number of such students

decrease. The reason is related to problems

dropped down to 8 thousand. According to

in the general secondary education system in

Ernst & Young, the whole generation should

India, so only a small part of Indian children

probably be required to eliminate the gap in

get the high-quality school education.

engineering training.
High unemployment of software developers

The situation in the Indian labor market
leads to the fact that India is gradually being

and mass staff reductions in software compa-

less and less considered as a low-cost labor

nies in the Nordic countries do not fit well into

country. According to Reuters, the largest

the overall picture. For example, TietoEnator

Indian outsourcing companies started to

(Swedish – Finnish-Norvegian largest software

depart from having a numerous staff of low-

service company) declared in 2012 its plans to

skilled employees with rather low salaries in

dismiss 7% of employees (about 1,300 people)

India. They often aspire to build a small team

working in Sweden and Finland. The reason

of high quality professionals in order to make

for this reduction is the high level of salaries

money not by providing labor-consuming and

in these countries. Those salaries are much

low-profitable IT-services, but by creating of

higher than the world average level. It be-

intellectual property.

comes more favorable for Finnish and Swedish companies to place orders for software

There as a considerable pool of IT specialists in

development into other countries than to keep

Brazil, which is one of five most populous coun-

own programmers’ staff. In Baltic countries the

tries in the world. The government of this coun-

unemployment is also caused by this reason

try has been implementing a manpower training

and also due to the lack of career attractive

program for many years .As a result, millions

software companies with solid reputation and

of people have moved up from the category of

high-quality management.

the poor into the middle class category thanks

However, in such countries as Sweden
and Finland the developers usually remain

to technical education. Annually, 100 thousand
Brazilian university graduates have opportunities

unemployed for a short time. In any case,

to continue training at 50 world best universities

their number is not big enough to influence

at public expense. The Brazilian government set

demand and supply in the world labor market.
Many skilled programmers are unem-

a task to train additionally 900 thousand IT specialists in the next 10 years. This figure is almost

ployed in the countries of Southern Europe

equal to the number of IT-professionals currently

which are experiencing the financial crisis. In

working in Russia.

these countries, software development ser-

However, the vast majority of Brazilian

vices as a business has not been developed

IT-staff and the largest Brazilian IT companies

yet and software companies are not reputable

are oriented towards the internal IT market.

enough for customers from wealthier coun-

It should be noted that – thanks to the state

tries. However, there are no investments into

IT development support policy – this market

offshore development centers in these coun-

reached $123 billion following the results of

tries yet and the situation has not become

2012. It is 3.7 times bigger than the Russian

aggravated to the degree that would lead to

IT market, although Russia and Brazil have

software developers’ mass emigration from

the fairly comparable population size and

these countries, although such a probability

gross domestic product volume. The Brazilian

of exodus does exist.

IT market continues to grow quicker.

103
Chapter 5 / Situation on the labor market in Russia and in other countries
For various reasons (first of all, because
of the domestic market high attractiveness
which is partly achieved via the State protec-

By this indicator Russia is hardly differs from
other countries.
The programmers’ average monthly salary

tionist policy) Brazilian software companies

in Russia is still much lower than in the USA,

did not achieve important success in the

where in the Silicon Valley and in the largest

world market, and the entire software export

cities it reaches $8,000-$11,000 (in Russia

of Brazil is less than that of Russia. Besides,

it is $2,000-$4,000). In addition, there is a

the Brazilian programmers’ labor cost is quite

strong deficit of developers in the Nordic

high. Therefore, creation of software develop-

countries, Germany, the UK and in several

ment centers in this country may be interest-

more countries. But it is not as essential as

ing for software companies from other coun-

that of the USA. For example, in Sweden

tries who are looking at the large Brazilian IT

(where the pay level is higher than in Russia)

market. If Brazil further increases the number

the total cost of software development ser-

of IT-students, the situation may change. The

vices is already comparable with the Russian

country may significantly increase software

one because of a higher average office rent in

export that will allow reducing the labor mar-

Russia. The competitive advantage of Russia

ket demand in other countries.

over more economically developed countries
in the labor cost is compensated by the

China and some other countries of the South

higher costs of overcoming the administrative

East Asia achieve a good pace in training of

barriers and by higher cost of office rent.

software developers. However, building of an

Judging by the Java programmers’ aver-

education system is a long process. Therefore

age incomes, the salaries of the Russian

the global shortage of developers cannot be

developers are approximately the same as

covered by the increasing offer in this region.

the salaries in the Spanish-speaking countries

It is particularly true taking into account that

(Spain, Mexico, Colombia, Argentina, and

the internal demand for qualified personnel

Peru) as well as in such countries of Southern

is growing very quick in the countries of the

Europe as Greece and Italy.

South-East Asia. Chinese IT industry com-

According to Russian software developer

petitiveness is not promoted by the country’s

companies, the labor cost in Vietnam and

improving standard of living, which displays

China is at least twice lower than in Russia.

itself in a wage level growth in all economic

Other costs on business organization are also

sectors.

lower there. As it was earlier, total expenses

Generally, we can state that even a significant increase in the number of trained soft-

on software development in India are still
much lower, than in Russia. It is partly due

ware developers in any country in the world

to the fact that in India there are no pension’

does not allow compensating the growth of

and social taxes as pensions are generally

demand on the Global market.

absent at all (in any case, for the most part of

The Manpower Group annual research
showed that 49% of employers worldwide
meet problems in filling crucial IT vacancies

the population).
Equalization of pay levels in Russia and in
the economically developed countries leaves

in their companies. IT-positions take the third

less preconditions for mass relocation of

place in the list of the vacancies that are the

Russian developers to the West for perma-

hardest to fill. Java, J2EE, and .Net programmers are especially demanded.
Due to the existing disproportions their

nent residence or for several years’ work. The
“brain drain” is not a serious problem for the
Russian software industry any more.Some

salaries are growing worldwide. In most

experts leave Russia, others, on the contrary,

cases the increase is at least 5-10% per year.

move here from other countries. Multidirectional streams are equivalent in its scope. In

104
Chapter 5 / Situation on the labor market in Russia and in other countries
the recent years the largest Russian software

to achieve the growth of IT staff immigration

companies demonstrated that they could

to the USA to the required value or at least by

compete on equal terms for top-managers

tens of thousands. It is not difficult to assume

with the leading companies of the world.

that a considerable part of these visas will be

There are still many software developers
desiring to go abroad. However only few of

intended for Russian programmers.
Although a number of countries (for ex-

them take active attempts for this purpose.

ample, Germany and Finland) did not act for

The motives have also changed – they aspire

attracting foreign developers actively in the

to go abroad not to receive a higher salary in

last 2 years, they have the State programs

other countries, but to gain new experience

providing a simplified naturalization procedure

and new knowledge. Thus, return to Russia is

for programmers and their adaptation in the

not excluded in many cases.

new living conditions. Thus, a threat of an increase in Russian developers outflow abroad

In spite of the fact that the deterioration of the
Russian labor market situation is offset by the

still remains.
Russia needs to undertake active steps

similar problems abroad, the current state of

to sustain competition for software develop-

things cannot be considered as normal. The

ers in the global labor market. It is desirable

available huge unused potential of Russia al-

not only to create favorable conditions that

lows counting on a significant increase of the

will prevent brain exodus from Russia, but to

country share in the global software market.

involve foreign developers more actively to

According to Frost & Sullivan, Russia is on

Russia. The government has already declared

the first place in the world by the number of

the necessity to promote attraction of IT-

researchers and developers per thousand citi-

professionals from the neighboring countries.

zens and on the third place by the number of

However, it still does not deal with the matter

scientists and engineers per million persons,

in practice. Probably, it is more reasonable

considerably advancing India and China.

to attract staff not only from the nearing

Russia is also on the first place in the world

countries but from the entire world, as well. In

by the share of students acquiring technical

many countries there is a quite loyal attitude

qualifications (according to UNESCO, Federal

to Russia. For example, at Indian forums,

Statistic Office of Germany).To use this poten-

you can read enthusiastic reviews of trips to

tial, it is necessary to create more favorable

Russia. In addition, European programmers

conditions for IT business in Russia.

who lost their jobs may be minded to move

In the last 18 months American IT compa-

to Russia. The global tendencies and the

nies became more active in attracting IT-staff

crisis phenomena in a number of European

from other countries; they lobby for a signifi-

countries are such that reasonably massive

cant increase in the number of employment

immigration of developers does not seem a

visas for foreign experts. The first version of

fantasy any more. Actually, not a few em-

the bill provided an increase in the quota of the

ployees from the West European countries

H-1B visas from 65 thousand to 110 thou-

already work for Russian software compa-

sand with an option of further annual increase

nies. And it is observed despite the fact that

up to 180 thousand with an increment of 10

obtaining employment visas for such experts

thousand. However, IT companies requested

is an intricate task and the visas should be

to extend the quota at least up to 300 thou-

prolonged each six months.

sand. Experts consider that there is a chance

105
CHAPTER 6
TECHNOLOGIES

106
Chapter 6 / Operating systems

Operating systems
76.	 Commonly used operating systems
2007

1
2
3
4
5
6
7
8
9
10
11

MS Windows
GNU Linux family
Android
Mac OS
iOS
MS Windows Mobile
MS Windows Phone
Sun Solaris
Open/Free/NetBSD
RIM Blackberry
Symbian OS

T

2008

2009

2010

2011

2012

97%
64%
26%
41%
26%
25%
25%

94%
54%
9%
17%
16%
7%
11%

93%
54%
6%
15%
16%
15%
9%
12%

96%
59%
4%
19%
15%
19%
9%
9%

94%
60%
37%
32%
28%
23%
19%
19%
13%
11%
11%

88%
65%
33%
31%
24%
17%
19%
14%
10%
6%
6%

he two most popular operating

in comparison with the companies that are

systems (Windows and Linux)

more geared to the global market.

remained on their places, but MS

It means that the applications for mobile

Windows was mentioned a little

devices and Apple tablets are being mainly

less frequently and GNU Linux

developed now for sale abroad. Still, consid-

family – more frequently than the last year. Most

ering an important increase in the share of

likely, it is not a random fluctuation but a dem-

smart phones and tablets in Russia, it is pos-

onstration of the regular tendency towards a

sible to assume that these systems’ popular-

certain expansion of free software in the world.

ity will be aligned among the companies with

Another trend is an increase in use of

orientation towards the Russian market and

operating systems for mobile communication
devices by the companies that are oriented

among exporters.
Traditionally, the percentage of the compa-

towards the foreign market. There is a con-

nies that use mobile operating systems (iOS,

siderable lag of demand for mobile applica-

Windows Mobile, Windows Phone, Symbian)

tions on the part of the companies that are

is much higher in St. Petersburg than in other

mainly geared to the Russian market. Their

cities.

audience rating of such operating systems

Along with the OSs specified in the table,

as Mac OS, iOS, Windows Mobile, Win-

the respondents also mentioned QNX and

dows Phone, Symbian is much lower than

VxWorks (once each OS) and the operating

the average figure given by all respondents

systems for IBM mainframe (twice).

107
Chapter 6 / Programming tools

Programming tools

T

he three most popular program-

from Eclipse is still considerable but it slightly

ming languages remained the

reduced during the year. The indicator of MS

same: .NET, C/C ++, and Java/

Visual Studio popularity turned out to be the

J2EE. The popularity of PHP

lowest for all the years of research.

has considerably grown in the

recent years.

Xcode (2%) and Oracle NetBeans (3%)
are most often mentioned among the pro-

PL/SQL and Perl are almost not used as

gramming tools that are not listed in the Table.

the main programming languages, but they

It should be noted that only a half of the

are still mentioned by several companies as

respondents specified the programming tools

subsidiary languages. Five companies (4%)

they use. Apparently, an important potential

have also specified 1C embedded program-

of improving of the industry’s labor productiv-

ming language.

ity exists there.

MS Visual Studio remains the most
popular programming tool. Its breakaway
77.	 Frequency of mentioned programming languages specified as main tools in 2008-2012, % of respondent
companies
2007

.NET (C#)
C/C++
Java/J2EE
PHP
Pascal (Delphi)
ruby
Python
Other
Open/Free/NetBSD
RIM Blackberry
Symbian OS

108

2008

2009

2010

2011

2012

48%
33%
38%
13%
13%

17.5%
36%
21.1%
5.8%
18.4%

21%
46%
22%
8%
18%

24%
38%
20%
9%
9%

25%
25%

7%
11%

9%
12%

6%
9%
9%

41%
36%
30%
9%
3%
4%
3%
18%
13%
11%
11%

32%
30%
23%
16%
7%ц
4%
3%
20%
10%
6%
6%
Chapter 6 / Programming tools
78.	 Usage of programming languages which are not considered as main tools, but are applied
by the companies in a number of projects, % of respondents
2008

2010

2011

2012

2012

43%
31%
24%
19%
17%
6%
5%

41%
38%
45%
17%
15%
8%
6%

28%
25%
22%
8%
11%
4%
2%

49%
30%
39%
21%
18%
4%
6%

45%
29%
36%
11%
19%
4%
6%
4%
40%
14%

88%
65%
33%
31%
24%
17%
19%
14%
10%
6%

2007

Java/J2EE
C/C++
.NET
Pascal (Delphi)
PHP
PL/SQL
Perl
Python
Others
Not specified

2009

2008

2009

2010

2011

2012

46%
19%
10%
10%

64%
25%
5%
7%

60%
19%
3%
3%

62%
6%
8%
-

45%
16%
9%
2%

36%
15%
4%
1%

79.	 Most popular programming tools

MS Visual Studio
Eclipse
Intellij IDEA
Delphi

109
Chapter 6 / DBMS

DBMS

F

requency of mention for all DBMSs

are developed and supported by Oracle).

that are present in the table almost

However, Oracle DBMS is still on the second

did not change during the year

place among the companies with the turnover

(the existing fluctuations can be

over $4 million, which account for nearly 90%

explained by random factors). MS

of all respondent companies’ personnel.

SQL is still in the lead. On the second place,
there is the free MySQL DBMS, which a

About 15 DBMSs also mentioned by respondents did not enter the table. MongoDB

year ago moved back to the third place the

was most often mentioned among them

commercial Oracle DBMS (both systems

(3 times).

80.	 Commonly used DBMSs, % of the interrogated companies
2007

MS SQL
Oracle
MySQL
MS Access
Firebird
PostgreSQL
MSDE
IBM DB2
InterBase
Sybase ASA
SQLite
IBM Informix
SAP DB
Sybase ASE
Paradox
Other

110

2008

2009

2010

2011

2012

82%
69%
68%
49%
19%
31%
27%
33%
18%
13%
8%
18%
9%
13%
12%

66.1%
48.6%
35.8%
14.7%
11.%
11.0%
9.2%
8.3%
7.3%
6.4%
5.5%
5.5%
4.6%
3.7%
1.8%

63%
49%
47%
19%
11%
17%
7%
13%
9%
6%
9%
7%
6%
6%
4%
13%

74%
55%
40%
9%
9%
15%
5%
14%
7%
6%
5%
5%
5%
3%
3%
8%

70%
51%
59%
19%
10%
26%
5%
9%
7%
5%
12%
7%
7%
3%
3%
7%

66%
47%
56%
17%
13%
30%
5%
10%
10%
6%
10%
7%
5%
6%
2%
8%
Conclusions

CONCLUSIONS

A

ccording to results of the year

cause of a cyclical nature of the startup’ cre-

2012, the cumulative turnover

ation and development process. The software

of Russian software develop-

vendors of the first wave of startups reached

ment industry is considered to

the maturity level. Their natural growth within

be as high as $9.5 billion (it is

their market segments stabilized, while the

about 0.45% of the nominal GDP of Russia)

next wave of startups have not yet reached

and the export reached the value of $4.6

the global players level.

billion (that is nearly 15% more than a year

In 2013-2014 the growth of IT export

before). Industrial software development for

from Russia will continue at a speed of about

export is conducted on a noticeable level at

15-20% per year. The growth rate of the

least in 45 Russian cities.

software development outsourcing services’

Export of software development services

export, most likely, will remain at the level of

increased by 10% up to $2.1 billion, while ex-

2012. Meanwhile the growth rate of export

port of licensed software grew by 17% up to

of licensed software and that of R&D centers

$2.0 billion. The export growth rates of R&D

of foreign corporations in Russia will slightly

centers of foreign corporations increased in

increase.

2012 (largely thanks to the Skolkovo Founda-

The total number of staff of software

tion activities). The rates went at least up to

companies comprised at least 120 thousand

12% and the volume of export reached $500

employees including 18-20 thousand people

Million.

in the foreign branches of Russian compa-

More the service company size is – the

nies. Totally, in the companies of all types and

higher their export growth ratio is. The largest

in the public sector of Russia there are over

software development outsourcing service

400 thousand software developers, while 850

providers’ growth reached 20-30% per year,

thousand Russian people have programming

while the smallest service companies’ export

skills (i.e., may be potentially involved in the

did not increase at all. The basic reason of

industry).

the services’ export growth slowdown is the
staff shortage in Russia.

This year’ survey results first allowed
assuming that the gap in the growth of the

Export sales of Russian licensed software

software development industry between the

increased to a lesser extent than in 2011 be-

two capitals and regions has been gradually

111
Conclusions
but steadily closed (infrastructure develop-

the social tax incentives, the corresponding

ments including science and technology

figures were 10.5% and 7% (i.e., the growth

parks were put into operation; venture and

rates were approximately twice lower). If we

investment funds came to the regions;

assume that the best growth figures were

startups got local support). The number of

reached thanks to granting the privileges

companies outside Moscow and St. Peters-

only, the preferential tax treatment led to an

burg is growing slightly quicker and new large

increase in the Russian software companies’

software development companies grew up to

cumulative turnover by $830 million, and to

a remarkable level. Conditions for conducting

their software export – by $252 million.

Hi-Tech business in some regions considerably improved.
For the last year Russia improved its

Following the results of 2012, the share
of Russian software and services in the
entire Russian export was 0.88% (a year

positions in the various global ratings which

ago, it was 0.8%). Most likely, it will grow in

reflected the level of IT development and

the next years. In Moscow and St. Peters-

usage, as well as conditions for conducting

burg this indicator is higher than the aver-

business.

age Russia-wide value – about 2% and 5%

The image of Russia abroad as a hi-tech

respectively. The software industry provides a

country keeps improving. The results of the

greater export share than the aircraft industry

analysis of the publications devoted to the

(aircrafts account for 0.8% of the export) and

high technologies’ sector in Russia showed

among hi-tech sectors it only concedes to

that the share of articles that positively influ-

the atomic power industry’ export and to the

enced the image of Russia abroad increased

arms export.

from 57% to 70% within the last 12 months.
The share of Russian companies in the

Analyzing the share of companies that
attracted investments in 2009-2012 we can

most well-known and prestigious global IT-

note that for the first time after the cor-

ratings was kept at the level of 5-8% within

responding questions had appeared in the

several recent years. Considering that not

survey it increased in 2012 (from 9% to 12%).

only IT service providers but also BPO service

According to the Russian Venture Com-

providers are included into the Top-100

pany (RVC) and to PricewaterhouseCoopers

world’s best outsourcing companies, we can

(PwC), venture investors invested $910.6 mil-

honestly say that the share of Russian com-

lion in Russian IT companies in 2012, which

panies in the Top-100 world’s leading service

is 2.3 times more than a year before.

IT companies is greater than 10%.
The volume of the Russian information

The respondents’ general average estimation of the conditions for business existing in

and communication technology market (ICT

Russia remained the same, as well as a year

market) increased by only 1.2% in 2012. The

ago. However, by some individual criteria

information technology market grew slightly

there were significant (multidirectional and

more – approximately by 4% according to

compensating) changes, which need to be

IDC and by 7% according to the Ministry of

noted. By the results of 2012, the estimates

Telecom and Mass Communications of the

increased almost in all criteria that are af-

Russian Federation.

fected by the government support to the

The share of respondent companies that

Industry. The only exception is the problem

enjoyed incentives in social taxation according

of bureaucracy and administrative barriers,

to the Federal Law No. 212 of 2010 remained

which often considerably reduces the effects

at the level of 36-37%. Companies that took

of State support.

advantage of these privileges increased their

As the situation with incentives in social

turnover by 26% and their export volume – by

112

taxation to software companies and the

14%. For similar companies that did not use

extension of privileges to small companies
Conclusions
cleared up, the share of respondents dissatis-

to the end of 2012. This occurred mainly due

fied with the Russian tax system sharply re-

to the off-shore development centers that

duced (from 66% to 36%) in the last 2 years.

have been established or expanded by the

Not regular nor significant State support

largest companies, as well as (on a second-

to the international marketing activities and

priority basis) thanks to the Russian higher

export still does exist in Russia, but there

education institution graduates.

emerged hopes that it would be provided to
the industry.
The USA stopped being the second most

Conditions for conducting business for
the smallest exporter companies (with the
turnover less than $4 million) considerably

important market for Russian companies

worsened during the last 2 years despite the

(after Russia). Russian software developers

State stimulation measures to startups. These

began to pay more attention to promotion of

companies are in a more difficult situation in

their services and products in the neighbor-

comparison to larger software developers as

ing countries of the former USSR, as well as

they do not enjoy the social taxation incen-

in Africa, in Arab countries, in South America

tives. Conceding the competition for employ-

and in the South-East Asia. Their orientation

ees, they did not increase neither personnel

towards Europe and the USA is becoming

nor turnover and export.

less significant.
About one third of Russian software com-

The number of companies that are not
pressed for acute staff shortage considerably

panies have at least one off-shore software

reduced. There are 27% of such companies

development center (16% of companies have

(while in the last several years their number

two and more development centers and 7%

was at the level of 45%-55%). Due to the

of companies have three such centers and

staff shortage, the majority of companies

more). Most of Russian companies’ foreign

actively recruit developers without experience

development centers are located in Ukraine.

from university graduates.

Favorable conditions for software companies

The results of this survey obtained within

are established there (many experts consider

the last 5 years allow us to state that there is

that these conditions are better than in Rus-

a net increase in the number of software de-

sia) and the labor cost is lower than in both

velopers (both in absolute and in relative val-

Russian capitals.
Conditions favorable for mass recruitment

ues) who have a good command of English.
Their share grew from 65% to 72%. However,

of foreign qualified personnel to Russia have

the quality of foreign language teaching at

arisen in the recent years. Thanks to these

universities and schools should be improved

changes, business began to look for new

to match the software export growth rates.

staff not only at the neighboring but also at

Small companies and companies located in

the far-abroad countries, as well. However at

regions primarily experience a lack of English-

present the migration policy of the Russian

speaking employees.

Federation does not promote the inflow of

According to the survey of exporter

qualified personnel to Russia. Instead, it does

companies, the average salary of software

not prevent the inflow of migrants who do not

developers (including managers) was $2,300

have any labor skills. Russia needs to have a

(71,300 rubles) in 2012. It grew up approxi-

new legislation which would allow the country

mately by 7-8% compared with the previous

to be involved in the global competition for

year. As the growth of the average salary level

highly qualified staff.

was 18% in 2011, we can speak of a certain

The staff size of the respondent compa-

decrease in the staff remuneration growth.

nies increased by 14% from the end of 2011

113
PARTICIPANTS
OF RESEARCH

114
Participants of research

Artezio –
the Art of Technology
Company overview:

Founded:
2000
Headquartered:
Moscow, Russian
Federation

Artezio is an ISO 9001:2008 certified software development and consulting company. Over the last
thirteen years, Artezio has completed more than 500 projects for its international clients. Artezio's
software development services allow its clients to deploy multi-platform applications, thus letting
them leverage the power of modern software technologies. This is done with the highest degree of
engineering skills in conjunction with clear and transparent communication processes. As a business consulting service provider, Artezio offers technology companies help and expertise in setting
up and managing their own offshore/ nearshore software development centers.
Since 2005, Artezio is a member and a major offshore division of LANIT group which is a
$2.5B IT Services vendor with 5000+ employees. From its development centers Artezio delivers
cost effective, high quality IT services to clients in North America, Europe, Middle East and Japan
thus being one of the leading Russian offshore software developers.

Development centers: Moscow, Saratov, Nizhny Novgorod (Russia); Minsk, Vitebsk, Mogilev (Belarus); Kharkov (Ukraine)
Certification: ISO 9001:2008, Microsoft Gold Certified.
Industry awards: IAOP Global Outsourcing 100 2006, 2010-1013; Global Services 100 2011, Software 500 2010-2013,
the Black Book of Outsourcing 2005.
Services:
• Custom software development
• System integration
• Technology consulting

• Software quality assurance and control • Offshore development center setup
• Support and maintenance
and operate
• Business Analysis and Consulting
• IT outstaffing

Corporate solutions:
Custom software: Mobile, Web and desktop applications;
Multi-tier distributed solutions; SaaS, IaaS, PaaS; e-learning; CRM.
Portal&Collaboration: JBoss; Liferay; Oracle; IBM; Microsoft SharePoint; NewsGator; Drupal.
Integration platforms: IBM WebSphere ESB; Oracle Fusion Middleware; JBoss ESB; Apache ServiceMix; Spring
Integration; BizTalk.
BI: Oracle BI; Microsoft BI; Pentaho BI; JasperSoft.
Document workflow: Microsoft SharePoint; IBM FileNet;
Alfresco; Landocs.
Business solutions: Microsoft Dynamics CRM; Microsoft
Dynamics NAV.
Mobile platforms: iOS, Windows Mobile/Phone, Android.

Technological profile:
Operation systems: Microsoft Windows; Linux; FreeBSD;
IBM AIX; Sun Solaris; HP-UX.
Development platforms: Java, J2EE; Microsoft.NET; Windows API; Cocoa; L.A.M.P.
Programming languages: Java; C/C++; Objective C; C#,
VB.Net; PHP/Perl/Python; Scala.
Application servers: IBM WebSphere; Oracle AS, WebLogic
Server; JBoss AS; Apache Tomcat; Microsoft IIS.
Databases: Oracle; Microsoft SQL Server; IBM DB2, Informix; MySQL; PostgreSQL.
Methodology: WF, RAD, RUP, Agile (SCRUM).

In-house software products:
iVizart – cloud on-line visualization tool;
Artezio Kanban Board – plugins to simplify project management in Attlasian JIRA and MS Outlook;
MinutesPad – professional mobile app for meeting minutes management;
Travel Stories – travel planning mobile app;
iLikeSlide – app to create and demonstrate Instagram slideshows.
Industry focus:
Core: Healthcare/Pharmaceuticals/Bio-tech/Life Sciences,
Finance/Banking, Telecommunications, Hi-tech.
Emerging: Transportation/Logistics, Retail, Entertainment/Media,
Education, Governmental, Gas and Oil.

http://www.artezio.com, http://www.artezio.ru
info@artezio.com, sales@artezio.com
Phone: +7 495 981-0531
Fax: +7 495 232-2683

115
Elite Software R&D Services
Since 1990
Company overview:

Founded:
1990
Headquartered:
Moscow, Russia

Auriga (www.auriga.com), a software R&D services provider, enjoys one of the highest customersatisfaction ratings worldwide (top 20 across outsourcing industries and #1 in engineering services).
The list of services provided covers all aspects of software product engineering and a broad range
of knowledge areas from embedded and mobile software to enterprise and Web apps. Due to the
appropriate size of the company for software R&D tasks, its client list consists of both established
industry leaders and fast-growing start-ups, including IBM, Draeger Medical, Datascope, Chrysler,
Barclays, Sberbank Russia, Yandex, LynuxWorks, Pigeon Point Systems, and many others.
Founded in 1990, Auriga was the first Russian company to provide software R&D offshore/
nearshore services to EU/US customers. In its work, Auriga focuses on soft factors — communications, flexibility, mindset, and culture — in addition to technology expertise. The company has
been consistently included in the Global Services 100, Global Outsourcing 100, and other global
industry ratings. In 2011, Auriga was named #1 Engineering Services Outsourcing (ESO) provider
worldwide by Datamonitor, ahead of such names as Wipro, Siemens, Capgemini, IBM, and others.

Engineering Locations: 4 development centers in Russia (2 in Moscow, N. Novgorod, Rostov-on-Don), +1 in EU (Vilnius,
Lithuania)
Industry Standards: CMMI Level 4, ISO 9001, SPICE, DO-178B, ISO 13485
Domain Verticals: high-tech, Telecom, Mobile, Healthcare, Finance, Information security, Enterprise, Computer SW, Education, Government, Automotive and more
Major Clients: IBM, Draeger Medical, Chrysler, Sberbank Russia, Yandex, LynuxWorks, Pigeon Point Systems, HomeCredit, IBM, CROC, iMind, onMobile, etc.
Services:
•	 Software Product Engineering
and ADM
•	 Custom Software Development

•	 Product Maintenance
•	 Re-engineering and Porting
•	 Customization and Integration

Technologies & Platforms:
•	 Embedded devices (ARM, PowerPC, Intel, FPGA…)
•	 Real-time systems (VxWorks, QNX, ThreadX, pSOS, eCos,
LynxOS)
•	 Linux (server, desktop and embedded), UNIX, Windows
internals.
•	 Mobile (Android, iOS, Symbian, RIM BlackBerry, Tizen,
Windows Phone) and Connectivity (GSM, 3G, GLONASS,
Bluetooth, WiFi, WiMax)
•	 Enterprise applications: Workflow, document and content
management (EMC Documentum and other), CRM systems.
•	 Web services, high loaded distributed applications
•	 .Net and Java platforms for portals (SharePoint, Liferay,
IBM WebSphere), web and desktops application development
•	 Databases (MS SQL, Oracle, DB2, Sybase, MySQL)
•	 Multimedia streaming: multiplexing/de-multiplexing, realtime transcoding, optimization for mobile devices, face
recognition
•	 Geolocation and Geopositioning (LBS, GPS, GSM, NFC,
SS7)

•	 Software Testing and QA
•	 Product Support
•	 Technology Research and Consulting

Awards:
• In Global Outsourcing 100 (rating by IAOP) since 2008. In
2013 listed among best in healthcare, high-tech industries,
R&D services, Russia region.
• In Global Services 100 (by Global Services Media and neoIT)
since 2006. The company is ranked among the “Top 10
Service Providers: Eastern Europe”.
• In The Black Book of Outsourcing (by Datamonitor) с 2006.
In 2011 Auriga is ranked the No. 1 Engineering Services
Outsourcing (ESO) provider worldwide. In 2010 Auriga was
named #15 in the prestigious “Global Top 50 Vendors” list.
In previous years the company is named No. 3 in the list of
IT Outsourcing Vendors in Central/Eastern Europe and No.
6 in the list of Global Software QA & Testing.
• Auriga is included in overall Top 20 of software R&D service
providers and in Top 10 among the companies serving
Software industry, in a 2009 ranking of service providers in
India, China, Russia, Ukraine & CEE by Zinnov Management
Consulting, a leading management consulting firm
• Microsoft Silver Partner in Application Development since
2010
http://www.auriga.com
info@auriga.com
92 Potter Rd, Ste. 1

116

Wilton, NH 03086, USA
Phone: +1 (866) 645-1119
Fax: +1 (603) 386-6097
Participants of research
Founded:
1996

Confirmit Ltd.
Company overview:

Headquartered:
Oslo, Norway

Confirmit is founded in 1996, the world’s leading software vendor for Voice of the Customer, Voice
of the Employee, and Market Research. Using the feedback received from customers and employees, helps to streamline business processes and make targeted investments to improve customer
loyalty and increase profits. 10 offices placed in Norway, the UK, Russia, Germany, USA and
Canada. Customers include Barnes Research, Best Buy, British Airways, British Standards Institute
(BSI), Dow Chemical, Farmers Insurance, GlaxoSmithKline, Halifax Bank of Scotland, Hoffman
LaRoche, HSBC, Ipsos, Marketo, Nasdaq, Nielsen, Office Depot, The NPD Group, Royal College
of Surgeons, Symantec, Wells Fargo, WorldOne, etc.

Development centers: Moscow, Yaroslavl
Expertise: Voice of the Customer, Market Research

Employees: 300

Industry:
Software development

Programming
languages:
C#, JScript

Technology: Scrum

Web-server: IIS

OS: Microsoft
Windows Server

Awards:
•	 2013 TMC Labs Innovation Award
from CUSTOMER Magazine
•	 2013 CRM Excellence Award
•	 2012 Product of the Year Award from
CUSTOMER magazine

Data base: MS SQL
Server

•	 2012 Customer Magazine Innovation
Award
•	 2012 TMC Labs Innovation Award
•	 2012 CRM Excellence Award,
Customer Interaction Solutions

•	 2012 Service Leaders Enterprise
Feedback Management
•	 Leader in The Forrester Wave™: EFM
Vendors, Market Insights Platform
Providers, Q3 2011

www.confirmit.ru
Ru.info@confirmit.com
+7 495 7855185

117
Global presence:
USA, EU, Russia

First Line Software
Company overview:

First Line Software is a premiere provider of custom software development and technology enablement services to industry leaders and growth companies around the world. We maximize business
value for clients by coupling our highly effective development processes and technology talent
with a comprehensive professional services portfolio, helping our customers accommodate new
business and open up new markets. First Line’s customers benefit from our almost two decades
of experience and deep expertise in building, operating and growing highly productive software
development teams. We serve a variety of clients from different industries and geographies, from
North America and Europe to Southeast Asia. Although we specialize in helping software product
vendors, we can work with any firm whose business is enabled by or greatly relies on software

Services:
•	 Product development: technology
•	 Technology enablement: integration, •	 QA and testing: Test process audit,
research and selection, product
implementation and customization
test coverage analysis, test strategy
design, specification and mock-ups,
services
development, test execution, test
prototyping, full cycle development,
•	 Custom application development:
automation
component design and integration,
feasibility and requirements analysis
performance engineering, customizafor business case, application design,
tion and enhancement, porting and
development, and implementation,
migration, deployment, support and
systems integration/consolidation, remaintenance
engineering, performance tuning and
porting services
Areas of expertise:
•	 ECM
•	 WCM
•	 BPM
•	 Loyalty & digital marketing

118

•	 Cloud computing
•	 Enterprise portals
•	 Business Intelligence

www.firstlinesoftware.com
sales@firstlinesoftware.com
+1 (877) 737-7178
Participants of research
Founded:
1993

EPAM Systems, Inc
Company overview:

Global
headquarters:
Newtown, PA, USA

EPAM Systems, Inc. (NYSE:EPAM) is a leading global software engineering and IT consulting provider with software development centers throughout Central and Eastern Europe. Headquartered
in the United States, EPAM employs over 9,000 IT professionals and provides services to clients
worldwide using a global delivery model through its client facing and delivery operations in the
United States, Belarus, Hungary, Russia, Ukraine, UK, Germany, Kazakhstan, Sweden, Switzerland, Poland, and Canada.
EPAM’s core competencies include complex software product engineering for leading global
software and technology vendors, as well as development, testing, maintenance, and support
of mission critical business applications and vertically oriented IT consulting services for Forbes
Global 2000 corporations.
The company has always focused on providing distributed application development services
across multiple sites. As such, our entire core processes and systems (quality systems, management processes, software development tools, build management, etc.) have been designed,
implemented, and proven over the last 18 years to support this delivery model.
Certified as compliant with ISAE 3000 Type 2 and CMMI Level 4 standards, EPAM’s experience
is backed by financial strength, security & IPR protection, maximizing quality, efficiency and scalability of the company operations while minimizing risks.

Development centers: Russia, Ukraine, Belarus, Poland, Hungary, Kazakhstan
IT Headcount: 9000+
Services:
• Software product engineering and custom development
• Project-based technology consulting
• Application Testing, Maintenance and Support
• Application Migration and Reengineering
Practice areas:
• ISVs and Technologies
• Banking & Financial Services
• Business Information & Media
• Travel & Consumer
• Emerging Verticals

Technology focus:
• SAP NetWeaver (xApps, Web Dynpro, EP, BW, BI, XI,
MDM)
• Business Intelligence (IBM, Microsoft, Oracle)
• E-Commerce (ATG)
• Content Management (Adobe CQ, EMC Documentum,
OpenText, Microsoft SharePoint)
• Mobile (iOS, Android, Blackberry, Windows Mobile)
• Cloud (VMware, HP, Microsoft, Amazon)
• NET (ASP.NET, Win Forms, WPF, Silverlight)
• Java EE (SOA, ESB, Web & Rich Client Applications, Grid)
• DBMS (Oracle, MS SQL Server, Sybase, MySQL)
• Embedded SW development (OSE, VxWorks, LynxOS,
Reliant (pSOS), QNX, Linux, HP-UX, Solaris, Windows NT
4.0 Embedded)

Partial customer list:
Adidas, The Coca-Cola Company, Viacom/MTV Networks, Expedia, Schlumberger, Renaissance Capital, Moscow
Exchange, SAP, Microsoft, Oracle, UBS AG, Sephora

Awards
Forbes: EPAM is ranked #6 on the Forbes “America’s 25 Fastest-Growing
Tech Companies”
The 2013 Global Outsourcing 100— EPAM included in the Top 30
outsourcing providers in IAOP’s (International Association of Outsourcing
Professionals) list.
CRN 2013 Solution Provider 500: EPAM has been recognized by UBM
Tech Channel as a part of CRN’s 2013 Solution Provider 500 list, which
identifies the top technology integrators in the U.S.A. and Canada

www.epam.com
www.epam.com
41 University Drive Suite 202
Newtown (PA), 18940, USA

119
Founded:
1991

ICL Group
Company overview:

Headquartered:
Kazan,
Russian Federation

Global Delivery Centre (GDC) – is a business unit of ICL group of companies delivering comprehensive outsourcing services in application development, support and maintenance and remote
infrastructure management for international and global customers.
GDC employs more than 700 specialists, has over 100 Customer, and completed over 250
major projects.
Our services help Customers achieve their business goals –increase enterprise growth, reduce
enterprise costs, improve business processes, implement and update business applications, update IT infrastructure, improve enterprise efficiency, business continuity and security.
GDC adopted Fujitsu methodologies and processes in providing outsourcing services and is
preferred supplier of services to Fujitsu.

Development centers: Kazan, Voronezh
Certifications: ISO 9001:2008, ISO 27001, ISAE 3402 Type II (SAS70)
Supported industries: Retail, Logistics, Manufacturing, Financial services, Automotive, Telecommunications.
Provided services and technical expertise
Application Development and Integration
• Bespoke development using Java (J2SE, J2EE, J2ME),
Microsoft (MS .Net Framework, MOSS, MSF), Oracle
(Oracle Database and Application Server, BI, Portal,
SOA, BPEL, RAC) and Mobile (iOS SDK, Cocoa Touch,
Objective-C, Android SDK, Windows Phone 7/8, Silverlight) Technologies
• Application Re-design and reengineering (SOA, Web-services), legacy modernization (old ORACLE and MS, PHP,
Cobol, Progress, Delphi)
• Application Integration using enterprise solutions (Sonic
ESB, Sonic MQ, Apache Camel, MS BizTalk, Azure)
• Independent testing (ISEB-certified team providing test
management, test planning and design, test data and
environment preparation, test automation)

Complex Remote Infrastructure Management and
Implementation
• Design and implementation of infrastructure solutions
• Managed Data Center
	 • Managed Server (UNIX, WINTEL, E-Mail, Enterprise
Management, Virtualization, Databases, IT security, etc)
	 • Managed Storage (NetApp, EMC,
Backup/Recovery, etc)
• Managed Networks (LAN, WAN, VPN, DSL,
Networ Security etc)
• Managed Workplace (Remote Desktop Management,
Software Delivery, Image Management, Application Packaging, Virtualization and Testing)
• Multilingual Service Desk

Application Management
• Application transition, support and maintenance
• Reengineering, replatforming, application innovation

Business Process Automation
• Automated process discovery (Fujitsu APD tool)
• ITSM consulting & automation (e.g. ServiceNow, OTRS)
• BP consulting & automation (e.g. Business Studio, Nintex)

www.icl.ru/gdc
info@gdc-services.com
34 Sibirsky trakt, Kazan, 420029, Russia
Tel. (843) 2795294

120
Participants of research
Foundation date:
May 2003

ISS Art, LLC
New Vision – Best Solution
Company overview:

Headquarter:
Omsk, Siberia,
Russian Federation

Information Service Systems Art, LLC has been rendering custom software development and support services in Russia and abroad for more than 10 years. We constantly improve our processes
to achieve customers’ business goals within shorter terms and optimal budget. ISS Art believes its
important task is to build close and trust-based relations with its partners and customers, which allows performing quality product as a result complying with the customer’s requirements. Our tools
are absolutely clear for the customer’s representative at any stage of the project. We fundamentally
observe laws and ethical business practices. We also care about employees’ professional growth.
The company provides a teaching program enabling the employees to improve their skills and
increase the quality of product. As a result comes a high quality product developed using modern
technologies and business processes. The reward for our efforts is 75% repeat customers.
Our aim is to ensure your project’s success.

Development centers: Omsk, Krasnoyarsk (Russian Federation)
Quality standards: ISO 9001:2008
Industry focus: IT, social sphere, education, media
Founder: NPO “Siberian IT-cluster” www.itsiberia.ru, Social media “ISS Art Media” www.issartmedia.ru

Services:
•	 Custom software development (architecture design,
development, integration and maintenance)
•	 QA services
•	 IT consulting
•	 Dedicated development centers

Area of expertise:
•	 Information systems
•	 Mobile solutions (iOS, Android)
•	 Web and desktop applications
•	 Science-intensive projects (R&D)

Technologies:
•	 Desktop Applications – .NET, •	 Mobile Applications – iOS,
C++, Java
Android, Windows Mobile,
•	 Web Applications – PHP, Java,
BlackBerry, Bada
ASP.NET; Javascript, XHTML, •	 Databases – MS SQL, MySQL,
HTML 5, CSS;
PostgreSQL, NoSQL.

www.issart.com
info@issart.com
Tel +7 3812 909 808
+1 (415) 729-3933

121
Founded:
1991

Reksoft
Company overview:

Headquartered:
St. Petersburg,
Russian Federation

Reksoft is a software engineering service provider headquartered in St. Petersburg, Russia, and
having local offices in Germany and Sweden. More than 20 years Reksoft delivers high quality
software engineering and integration services and end-to-end solutions for telecom, financial &
banking, public and cross-industrial sector. The company counts more than 380 employees. Citi
Bank, Ascom, Aastra Telecom, Comverse, Dirol Cadbury, Fujitsu Technology, FXDD, Infor, Mavenir
Systems, Mazda, Philip Morris, Sicap, Springer Business+Science Media, StoraEnso, Swisscom
Mobile, Tieto and T-Systems are among Reksoft’s clients.

Development centers: St. Petersburg, Voronezh
Offices: Moscow (Russia), Munich (Germany), Stockholm (Sweden)
Employees: 400+
Recognition: The 2012 Global Services 100 list, the 2012 top 100 Russian employers list by HeadHunter
Services:
• Software Engineering

• Enterprise application services (devel- • Dedicated development centers
opment, support, migration & integration, application management)

Industry expertise:
In more than 20 years of business, we have accumulated
software development experience across a wide range
of sectors, including high technology, telecommunications, financial services, media, hospitality and travel and
manufacturing.

Quality:
Reksoft appraised at Level 5 of the CMMI Institute’s Capability Maturity Model Integration (CMMI). All business units
took part in appraisal: departments of financial, telecom,
public sector and cross-industrial projects Reksoft is the
first company from Russia and CIS rated at maturity level 5
according to the CMMI-DEV v1.3 model. Appraisal details
available at https://sas.cmmiinstitute.com/pars/pars_detail.
aspx?a=20167.

Partnership:
Reksoft collaborates with Microsoft, Oracle, EMC, IBM, Adobe and
other global IT companies.

122

www.reksoft.com
rfi@reksoft.com
Participants of research

We thank participants
of research
Adept
www.gk-adept.ru

info@gk-adept.ru

+7(831) 464-9777

Year of Аoundation

Headcount

Programming Languages

2002

20

Nizhny Novgorod, Russia

C++

The group of companies Adept is a successful Russian IT company - a leading developer and supplier of software for
the construction industry - provides a full range software services, from development and implementation to training
and consulting. Today Adept employs more than 130 professionals, has offices in Moscow, St. Petersburg and Nizhny
Novgorod and is connected with all major Russian cities trough more than 130 authorized distributors.
Alditek
www.alditech.ru

web@alditech.ru

+7(496) 773-6220

Year of Аoundation

Headcount

Programming Languages

2006

15

Puschino, Russia

C, C++, VHDL, Verilog

ALDITECH Limited offers its customers a completed cycle of hardware and software development: from technical
specifications development prior to real sample of the developed product release. Major activities are: Research and
Development; FPGA design and electronic circuit design; Mathematical modeling; Embedded and application software
development; Machine vision and image processing; Biotechnology systems development; PCB design.
ALT Linux
www.altlinux.ru

org@altlinux.ru

+7(495) 662-3883

Moscow, Russia

Year of Аoundation

Headcount

Programming Languages

2001

37

PHP, Python, Python, Scheme

ALT Linux operation systems ALT Linux releases operation systems since the day of its foundation in 2001. before
the foundation its developers developed free operation systems, for instance, within the IP Labs Linux Team project.
This is how you can explain success of a new company which managed to join efforts of over 150 dvelopers from
across the planet.Operation systems by ALT Linux are result of collaboration of its developers and users.
ANCUD
www.ancud.ru

marketing@ancud.ru

+7(499) 731-0000

Year of Аoundation

Headcount

Programming Languages

1991

80

Moscow, Russia

C++, C

ANCUD Limited Liability Company is a well-known Russian designer and manufacturer of hard- and software for
cryptographic protection of information. It was established in 1991. ANCUD engages in a full Hi-Tech product cycle
from development of its own component base to providing complex solutions. Main Activities: Design of encryption
hardware and software for cryptographic protection of information; Design and manufacturing user acceess control
system; Custom design of microprocessor components and electronic hardware.
APM Research and Development Centre LLC
www.apm.ru

com@apm.ru

+7(498) 600-2530

Year of Аoundation

Headcount

Programming Languages

1992

30

Korolev, Russia

C++, .NET

Research and Software Development Center APM was founded in 1992 and specializes in software development for
machine elements and units, mechanisms, structures design. The main product of our company is CAD/CAE software
system APM WinMachine intended for machine elements calculation and design. Our software contains methods for
strength, stiffness, longevity calculation. Some of methods, implemented in WinMachine for non-ideal machine element calculation have no analogues in the world.

123
Arcadia, ZAO
www.arcadia.spb.ru

info@arcadia.spb.ru

+7(812) 610-5955

Year of Аoundation

Headcount

Programming Languages

Saint Petersburg, Russia

1993

195

MS .NET, С#, MS SQL, C, C++, Objective-C, Java, MS
Silverlight, HTML5, MS SharePoint, Android, iOS

Custom development of business applications, re-engineering of legacy software and data migration; dedicated teams
(offshore/nearshore development centers). Vertical expertise: education & e-learning, HRM, workflow & business
process automation (BPA), ECM, financials & accounting, insurance automation, pharmaceutical data warehousing,
information security. Our engineers have great experience in development of large-scale, high-performance information
systems — desktop solutions, web applications (RIA, intranet, collaboration portals), and mobile apps (Android, iOS,
Windows Phone) for business.
ASV
www.asv.ru

info@asv.ru

+7(342) 222-4444

Year of Аoundation

Headcount

Programming Languages

1994

30

Perm, Russia

C++, Java

Created in 1994, JSC ASV is Russia's leading developer of highly technological solutions for the telecommunication
business automation. Over 50 Russian telecommunication companies are quite successfully using JSC ASV's solutions, profiting from their reliability, scalability, availability, low operating costs and simplicity of servicing. JSC ASV has
been able to develop a unique technology to implement and support its own solutions, thus being able to make more
than 50 installations in the lines of three regions in the Republic of Kazakhstan in 1998, including the largest city of
Alma-Ata, in Kazakhtelecom JSC.
Asys Soft
www.asys.ru

asys@asys.ru

+7(499) 645-5364

Year of Аoundation

Headcount

Programming Languages

1996

10

Zelenograd, Russia

C#, PHP, Java

ASys has been developing information systems for enterprise management for more than 15 years. Over this period
the company has worked out a specific approach to information systems building on the basis of a single model that is
able to reflect any kind of activity in an organization. ASys creates information systems on the basis of a single model.
These information systems allow gradual elimination of 'information system zoos'. In the nearest future you will be able
to build business models of your operations and manage them on the basis of ASys platform.
Autosoft
www.autosoft.ru

info@autosoft.ru

+7(343) 267-2938

Year of Аoundation

Headcount

Programming Languages

1997

15

Yekaterinburg, Russia

.NET, PHP, Delphi

AutoSoft Company, Ltd. is one of the leading developers of the specialized software for business-processes automation at the enterprises of automobile and allied industries. AutoSoft carries out the activity in the market of computer
technologies for the domestic autoindustry since 1997 year, being one of the pioneers in this area. For this time the
company saves up a wide experience which helps it with goals achievement, namely: in development of high-quality
products and competent, fast introduction of the systems on the various enterprises.
Bee Pitron
www.beepitron.com

all@beepitron.com

+7(812) 740-1800

Year of Аoundation

Headcount

Programming Languages

1993

Saint Petersburg, Russia

214

Engineering and manufacturing of EWIS for transportation. Implementation of PLM (Dassault), CAM, project management systems (1C ERP)

124
Participants of research
Capital-Soft
www.mmtt.ru

e@mmtt.ru

+7(495) 766-0867

Year of Аoundation

Headcount

Programming Languages

2008

5

Moscow, Russia

C++, Delphi

Capital-Soft is a successor to Management Technology company, established in mid-2001 by a team of professionals
in the field of accounting and software development in order to develop a range of commercial software solutions for
accounting management. We offer a retail product that helps small and medium-sized companies to solve most of the
problems in the area of accounting management. The application "Capital" is designed to maintain a unified automated records of all transactions and actual cash flows.
CN-Software
www.cn-software.com

support@cn-software.com

+7(816) 260-3500

Year of Аoundation

Headcount

Programming Languages

2005

15

Veliky Novgorod, Russia

Java, C, PHP

CN-Software Ltd. was registered in August, 2005; however, the history of our company (known as CN-Software.com)
started in 2002, when the first copies of CNSearch - the search system for web-sites - had been sold. That was the
time when the core of our team, aimed at web-site software development, formed. Later, the number of our software
products increased. Some of our developments are now presented as software products.
Compass
www.compas.ru

market@compas.ru

+7(812) 327-7429

Year of Аoundation

Headcount

Programming Languages

1991

80

Saint Petersburg, Russia

C++, C#, .NET

Compass company is one of the leading Russian software vendors. It develops ERP system of the same name. Company suggests licenсes of ERP system "Compass" and its separate subsystems (CRM< HRM). Besides it suggests
services of software implementation and suppport, development of specialized sotware applications and industry
solutions for operation of business. Company implemented hundreds of solutions during the time of its existance since
1991.
COMPETENTUM
www.competentum.ru

info@competentum.ru

+7(495) 514-1100

Year of Аoundation

Headcount

Programming Languages

1993

100

Dolgoprudny, Russia

C#, Javascript, HTML5

Competentum is a group of international companies that operates in the global e-Learning market in Russia, Europe
and the USA. We offer a full set of innovative proprietary e-Learning products as well as high-level consulting, software
and e-content development services for both academic education and professional training.
Comtec - systems for business Co Ltd.
www.comtec.ru

comtec@comtec.ru

+7(495) 544-2552

Year of Аoundation

Headcount

Programming Languages

1990

14

Moscow, Russia

Sybase PowerBuilder, C++

Comtec Systems for Business, Ltd. specializes in the development and implementation of enterprise management
systems. The 9th generation of the product named Comtec for Business is a full-fledged ERP-system that inherits
all the advantages of the previous versions and adds new services and functions for the customers. Based on clientserver architecture it is aimed at ERP solutions for SMB in various activities - manufacturing, retail, wholesale trade and
service. It is oriented on top managers, accountants, warehousemen, sales managers, analysts.

125
CSI International Software
www.trace.ru

csi-software@trace.ru

+7(812) 252-0412

Year of Аoundation

Headcount

Programming Languages

1997

10

Saint Petersburg, Russia

Java

CSI International Software Ltd. Is software developer company working in the field of bespoke solutions for Software
projects. Our company started its business activity in 1997. The main directions of our activity are Internet catalogues
& directories; E-commerce; Portal solutions; Transport logistics; Interactive Internet services; Vehicle Tracking Systems; Corporate Informational Systems; CRM systems; Internet Mapping Service; Mobile solutions; Security systems.
DataArt®
www.dataart.com

info@dataart.com

+1(212) 378-4108

Year of Аoundation

Headcount

Programming Languages

1997

850

New York, USA

.Net, Java, C++, iOS, Android

DataArt is a custom software development firm that builds advanced solutions for the financial services, healthcare,
hospitality and other industries. Combining domain knowledge with offshore cost advantages and resource flexibility,
DataArt develops industry-defining applications, helping clients optimize time-to-market and minimize software development risks in mission-critical systems. With an unrivaled talent pool of highly skilled software engineers in New York,
London, Russia and Ukraine, DataArt provides the technical skill, accountability and industry knowledge.
Digital Design
www.digdes.ru

info@digdes.com

+7(812) 346-5583

Saint Petersburg, Russia

Year of Аoundation

Headcount

Programming Languages

1992

377

C#, Objective C , Java, VB Script, JavaScript

Digital Design renders full range of services for business automation, including mobile solutions, electronic content
management systems, corporate portals, infrastructure solutions, custom software development.
e-Legion
www.e-legion.com

sales@e-legion.com

+7(812) 324-2724

Year of Аoundation

Headcount

Programming Languages

2005

70

Saint Petersburg, Russia

Java, C#

e-Legion is a Russian company founded on November 2, 2005. The company provides software development services
with a 7-year experience in this field. The company’s primary business activity is software development for the following
mobile operating systems: iOS, Android, Windows Phone and Windows 8. Also we work with web-development and
business processes integrated automation. e-Legion has accomplished various projects for such companies as Yandex,
Mail.Ru Group, BMW, KFC, Stanford University, Ginza Project, i-Free, Reget Software, Solaris Development and others.
EMC / Russia COE
www.russia.emc.com/CoE

maria.melnichenko@emc.com

+7(812) 325-4633

Year of Аoundation

Headcount

Programming Languages

2007

275

Saint Petersburg, Russia

C, С++, С#, Java, .Net

EMC builds information infrastructures and virtual infrastructures to help people and businesses around the world unleash the
power of their digital information. EMC offerings in backup and recovery, enterprise content management, unified storage, big
data, enterprise storage, data federation, archiving, security, and deduplication help customers move to and build IT trust in their
next generation of information management and enable them to offer IT-as-a-Service as part of their journey to cloud computing
Enterra Holdings, Inc
www.enterra.ru

salesteam@enterra-inc.com

+7(385) 256-7295

Barnaul, Russia

Year of Аoundation

Headcount

Programming Languages

2001

80

.NET, C#, Java, PHP, C++, Objective C, Delphi

Enterra is a software development company that provides high-end application development and design as well as
product engineering based on technical expertise of over 60 software developers in our staff. Enterra representative
offices in USA (Tampa), Germany (Schwetzingen), Russia (Moscow, Barnaul) provide you with the confidence and
simple way of work with us in your area. Our development centers in Russia and Ukraine staffed with technical professionals provide you with top quality software that meets your specification.

126
Participants of research
ETNA Software
www.etnasoft.com

info@etnasoft.com

+1(855) 779-7171

Year of Аoundation

Headcount

Programming Languages

2002

140

New York, USA

C#, Java, C++

ETNA Software is a technology solutions provider for financial markets and has been operating internationally for more
than ten years. ETNA Software creates custom trading software for all asset classes and technical analysis systems for
financial market start-ups, technology firms, retail brokers, market makers, exchanges and individual traders. Leveraging nearshore or offshore outsourcing allows company clients to optimize project budgets, reduce expenses and
maximize both, fiscal and organizational goals. Major company clients are Saxo Bank, SogoTrade and ChoiceTrade
eVelopers Corp
www.evelopers.com

info@evelopers.com

+7(812) 324-3211

Saint Petersburg, Russia

Year of Аoundation

Headcount

Programming Languages

1999

60

J2EE, JavaScript, HTML, Ext-JS, Ext-GWT,
GWT, PHP, JQuery, DoJo, Flash, Flex

eVelopers™ is a software development, consulting and outsourcing company. We serve customers worldwide by
designing and building complex solutions that integrate with back end systems, using open source components when
appropriate. Founded in 1999 as California Corporation, eVelopers maintains presence in Silicon Valley and a global
development center in St. Petersburg, Russia. Businesses and organizations of all sizes, including Fortune 500 companies use eVelopers as extension of their IT team to become cost effective and more responsive.
Exigen Services
www.exigenservices.com

info@exigenservices.com

+7(812) 702-5115

San Francisco, USA

Year of Аoundation

Headcount

Programming Languages

2000

1500

Java/ JavaEE, .Net, C#, C++, PHP

Exigen Services is a global IT company that provides core systems transformation services to clients in the Insurance,
Financial Services, Telecom and Media industries as well as offshore development services to Commercial Software
Solution providers. Together, Exigen Services and its clients manage project risk and focus on maximizing the value
delivered throughout the project lifecycle. Centers of Excellence for industries and technologies and a global network
of delivery teams are located across Eastern Europe, Baltic states, Russia, China and the U.S.
IBA Group
www.ibagroupit.com

info@ibagroupit.com

+375(17) 217-3952

Year of Аoundation

Headcount

Programming Languages

Prague, Czech Republic

1993

2705

Enterprise applications, SAP, Mainframe and Multiplatform C++, VC++, Java, Cobol, PL/1, RPG/400, ABAP/4,
Fortran, Forth, Basic, Pascal, Smalltalk, Lisp, PLX, ADA,
Prolog, Modula, Natural, Assemblers for different platforms.Scripting Languages Lotus/Java/VB Scripts, Unix
Shell, REXX, Perl, PHP, and JCL.

IBA Group is one of the largest IT service providers in Eastern Europe performing onshore, near–shore and offshore
projects with 2,500+ professionals. Headquartered in Prague, Czech Republic, IBA Group has offices in the US, Great
Britain, Germany, Cyprus, Bulgaria, Russia, and Ukraine and software development centers in the Czech Republic,
Belarus, and Kazakhstan. IBA was founded in 1993 as a software development company located in Minsk, Belarus.
Today, IBA is an international group that serves customers in more than 40 countries across diverse markets and
industries.
IFS
www.ifs-company.com

sales@ifs-company.com

+7(843) 200-0548

Year of Аoundation

Headcount

Programming Languages

2010

12

Kazan, Russia

C#, C++, .NET, PHP

IFS Company is your safe and reliable partner in IT services and software development. We have rich experience in
software for retail brokerage companies, we know the brokers’ needs and needs of their clients. Our goal is to help
our customers to grow by improvement and upgrade their IT frontend and backend tools.

127
InfoShell
www.infoshell.ru

info@shell.ru

+7(495) 792-9235

Year of Аoundation

Headcount

Programming Languages

2009

25

Saint Petersburg, Russia

PHP, Java

InfoShell provides iPhone (iPad), Android, Windows phone and BlackBerry applications development. We create software of any complexity: Information applications; Promotional applications; Games and entertainment systems; Comprehensive solutions: website integration, intranet integration; Integration with CRM, ERP and accounting systems;
Development of business management systems for iPad tablets; Any other application based on your ideas.
InfoWatch
www.infowatch.com

info@infowatch.ru

+7(495) 229-0022

Moscow, Russia

Year of Аoundation

Headcount

Programming Languages

2003

150

С++, С#, C, PL, SQL, perl, bash

InfoWatch is a group of innovative technology companies focused on developing and providing cutting-edge comprehensive technologies and services dedicated to Data Loss Prevention & Protection, Intellectual Property Protection,
Customer Experience and Reputation Management, as well as Risk Management and Compliance solutions.
Inostudio Solutions
www.inostudio.com

info@inostudio.com

+7(863) 432-0318

Year of Аoundation

Headcount

Programming Languages

Taganrog, Russia

2006

71

ASP.NET, MSSQL, iOS, C#, PHP, Android,
Oracle, MySQL, Sharepoint, Windows Phone

Inostudio Solutions is a professional software development company. We adhere to international standards and provide
clients with high-quality products. Three facts about us: 1. We always act as partners suggesting the best solutions,
minimizing costs, making things going right, working on solving your business problems not just creating software. 2. We
are always around and ready to help you: no communication gaps, disappearances and misunderstandings. 3. We have
very professional team and create reliable software providing a lifetime warranty for our software products.
Inotech
www.inotechgroup.ru

info@inotechgroup.ru

+7(812) 314-7694

Year of Аoundation

Headcount

Programming Languages

2000

15

Saint Petersburg, Russia

Delphi

Inotech company, software developer for telecom operators, was created in 2000. We are engaged in the implementation of integrated OSS / BSS solutions, system and application software, supplies the equipment, commissioning
works, maintenance and development of products, staff training, audit and consulting on telecom market. The main
product of the company is replicable, universal, converged automated billing system Platex® of the high functional
level.
Inside
www.inside.ru

info@inside.ru

+7(495) 542-8808

Moscow

Year of Аoundation

Headcount

Programming Languages

1997

50

PHP, Html, Css, Javascript, Ajax, jQuery, Perl, C

The Internet agency "Inside" – is a leading developer of solutions in the area of software development, corporate style,
web design, online advertising, e-commerce. Since 1997 our staff is a well-organized team of professional analysts,
marketers, managers, artists, designers, programmers, translators and copywriters. Projects with real return are our
profession, we are not limited in the development of a web resource on the Internet market, we are focused on longterm services for large corporate clients.

128
Participants of research
KB Panorama
www.gisinfo.ru

kb@gisinfo.ru

+7(495) 739-0245

Moscow, Russia

Year of Аoundation

Headcount

Programming Languages

1991

50

C++, C, C#, Java, Delphi, Perl, .NET, PHP

Closed joint-stock company KB "Panorama" is formed in 2001 by association of the existing enterprises and divisions
with the group of software developers "Panorama" known since 1991. The main activity of Joint-Stock Company
KB "Panorama" is the development of geoinformation systems and technologies that are used by federal agencies,
municipal services, agencies working with the land and real estate, road organizations, committees on architecture
and construction, etc. Result of long-term activity of our company – more than 18 thousand users across Russia and
abroad.
Kentor
www.kentor.ru

spb@kentor.se

+7(812) 325-1300

Year of Аoundation

Headcount

Programming Languages

1983

33

Stockholm, Sweden

С#, Java, .Net, Oracle

Kentor provides custom software development and IT consulting for the clients in the areas of telecommunications and
electronic commerce, government and public organizations. High quality of our services is confirmed by the feedbacks
from our customers, many of whom have been cooperating with us for more than 10 years. Our employees are Certified Java, Oracle and Microsoft developers and the company is Oracle Certified Partner and Microsoft Gold Certified
Partner. Totally we employ 230 persons working in our offices in Stockholm, Gothenburg, Oslo and St. Petersburg.
Krug-Soft
www.krugsoft.ru

krugsoft@krugsoft.ru

+7(841) 249-9775

Year of Аoundation

Headcount

Programming Languages

2011

60

Penza, Russia

C#, C++, Java, .NET, PHP

KRUG-Soft, is a software development company in the «KRUG» Group оf Companies. Nowadays many people associate the Group of companies «KRUG» with reliability of complex automation systems, with high responsibility in relations
with partners and customers, economic stability of business.
Luxoft
www.luxoft.com

russia@luxoft.com

+7(495) 967-8030

Moscow

Year of Аoundation

Headcount

Programming Languages

2000

5754

C, C++, C#, Java, PL/1, Python, Perl, PHP, Ruby, ASP.
NET, Assembler, Flex, Visual Basic, scripting languages,
COBOL, HTML, J2ME, JavaScript, JSP, PL/SQL

Luxoft, a member of the IBS Group, is an emerging global leader in application and product engineering outsourcing
services for enterprise IT organizations and software vendors. Luxoft builds lasting partnerships with its clients, such
as Boeing, Deutsche Bank, UBS, Dell, IBM, Sabre and other global leaders, based on the culture of engineering excellence, innovation, and deep domain expertise. Luxoft offers global delivery capability through its network of state-ofthe-art delivery centers in North America, Central & Eastern Europe, and Asia.

Mallenom Systems
www.mallenom.ru

info@mallenom.ru

+7(820) 220-1635

Year of Аoundation

Headcount

Programming Languages

1999

25

Cherepovets, Russia

C#, .NET, Java

Mallenom was established in 1999. We deal with: Optic-electronic traffic and registration control in transport; Industrial
quality control; Decision support systems. We develop complex computer vision and analytic systems for automatization of various engineering processes and managerial decision support. Most developments of the company are
applied in difficult production areas, on motor and railways, in offices and institutions.

129
Mapilab
www.mapilab.com

info@mapilab.com

+7(401) 299-1366

Year of Аoundation

Headcount

Programming Languages

2003

30

Kaliningrad, Russia

.NET

The MAPILab company was founded in 2003 and has managed to take the leading position on the market of software
products for Microsoft Outlook since then. Today it offers more than 30 products within a wide range - there are utilities for work automation and productivity improvement, components for developers, tools for teamwork. An important
trend in the work of the company is developing software products for Microsoft Exchange Server. We create truly
unique and high-quality solutions that take a firm position on the market of server extension software.
Monitor Soft
www.monitorsoft.ru

monitor@monitorsoft.ru

+7(495) 556-4595

Year of Аoundation

Headcount

Programming Languages

Zhukovsky, Russia

1993

58

C++, C#, Java, Perl. Delphi, PHP

Monitor Soft, Ltd. develops and provides the aeronautical fixed telecommunication systems AFTN, flight navigation
services, as well as the systems of fast-acting airport management and air traffic planning. In the development of the
products specialists apply the advanced methods and programming techniques, implement integrated use of various
hardware, produced both by global manufacturers and their own development. All these advantages along with the
opportunities granted by the usage of the Internet and the Intranet, modern digital ground and satellite communication
systems allow to create the distributed management information systems.
Movavi
www.movavi.com

job@movavi.com

+7(383) 363-2201

Year of Аoundation

Headcount

Programming Languages

2004

50

Novosibirsk, Russia

C++

MOVAVI Inc. is an independent software developing company specializing in video area. We combine the high-level
skills and wide experience of our technical professionals with the efficient approach to the market. We work to solve
the present-day needs of our customers by providing the quality video products and support services.
Nautsilus
www.nautsilus.ru

info@nautsilus.ru

+7(495) 939-5872

Year of Аoundation

Headcount

Programming Languages

1990

10

Moscow, Russia

C, Java

NAUTSILUS, Ltd. is an independent privately owned company established in 1990 by a strong team of real-time
software engineers. The business area includes process automation software development under QNX (and Linux too),
system integration, and industrial/building automation application implementation.
Neolant
www.neolant.ru

info@neolant.ru

+7(499) 999-0000

Moscow, Russia

Year of Аoundation

Headcount

Programming Languages

2004

312

C#, .NET, C++, Java, Delphi, Visual Basic

The group of companies NEOLANT is the supplier of solutions for the enterprises of fuel-energy complex and state
sector. Areas of company’s activities: Development and implementation of information systems to decision-making
support based on the integration of technologies: PLM, BIM, GIS, CAD, PDM, PM; Engineering and information support of oil-and-gas and nuclear objects on different life cycle stages; Permanent search for innovative solutions.
Netris
www.netris.ru

info@netris.ru

+7(495) 950-5525

Year of Аoundation

Headcount

Programming Languages

2006

40

Moscow, Russia

Java, C++

Netris is the leader in software development and systems integration for service providers, banking institutions and
contact-centers. The company’s staff consists of highly skilled programmers and engineers, who implement the goals
set by customers in a professional manner. It is the high level of professionalism and the focus and dedication of Netris
employees which gives the company a market leadership position and competitive edge.

130
Participants of research
Nicotech International
www.nicotech.ru

info@nicotech.ru

+7(499) 500-3829

Year of Аoundation

Headcount

Programming Languages

1991

41

Moscow, Russia

Java, ABAP, .NET, C#, PHP

Nicotech provides to its customers (ISVs, Business clients and Pubic organizations) commercially effective IT and software product development services based on the cutting-edge technologies which help to bring agility, innovation and
productivity to our clients.
Norsi-Trans
www.norsi-trans.ru

info@norsi-trans

+7(499) 238-8153

Year of Аoundation

Headcount

Programming Languages

1996

100

Moscow, Russia

C++, C#, Java

Innovative company involved in development, production and sale of computer information system for collection,
analysis, recording, and processing of telecommunication network data. The Company has been working in this area
since 1996 along with a number of leading domestic and foreign vendors, and markets hardware and software systems which ensure completion of tasks faced by telecommunication network systems.
Novel Software Systems
www.nprog.ru

info@nprog.ru

+7(383) 332-1676

Year of Аoundation

Headcount

Programming Languages

2006

10

Novosibirsk, Russia

Java, Perl

Novel Software Systems company based in A.P. Ershov Institute of Informatics Systems develops high-quality informatics solutions for the scientific community. We provide a wide range of software development services and readyto-implement products. Our company specializes in intelligent software development for analysis and recognition of
signals, images and genetic texts.
Novosoft
www.novosoft.ru

info@novosoft.ru

+7(383) 330-3474

Year of Аoundation

Headcount

Programming Languages

1992

35

Novosibirsk, Russia

C++, Oracle, Java

Novosoft LLC is a large international company with a major development unit in Novosibirsk, Russia. We provide highquality, offshore software development services and Web design solutions at excellent rates. Besides, we are selling
our program products for improvement of customer's business.
Optical Recognition Objectives
www.magtoapp.ru

info@magtoapp.ru

+7(499) 638-8659

Year of Аoundation

Headcount

Programming Languages

2003

15

Samara, Russia

iOS, Ruby, Android

Optical Recognition Objectives LLC is focused on development of technology and software for pattern recognition to
match the market needs in applications for human face and other complex objects recognition. The Company made
outstanding pattern recognition technology GABITUS based on the novel artificial neural network model. GABITUS is
the core engine for existing and upcoming Company products.
Oracle Development SPB LLC
www.oracle.com/ru

grigori.labzovsky@oracle.com +7(812) 334-6000

Year of Аoundation

Headcount

Programming Languages

1999

321

Saint Petersburg, Russia

Java, C++, C

Oracle provides the world's most complete, open, and integrated business software and hardware systems. Its product
strategy provides flexibility and choice to customers across their IT infrastructure. The St. Petesrburg Development Center
(SPBDC) specializes in creating computer software, engineering environment tools, and providing infrastructure solutions.

131
PITERSOFT, LLC
www.piter-soft.ru

info@piter-soft.ru

+7(812) 333-0860

Year of Аoundation

Headcount

Programming Languages

2005

14

Saint Petersburg, Russia

1С

PiterSoft presents products and services in the region of business-process automation, development and implementation of software, electronic document circulation systems, management technologies based on «1C:Enterprice» using
process management technologies. «PiterSoft» is a partner of «1C». It has status «Manufacturing competence center».
The company works with more than 60 partners, distributing «PiterSoft: Process management» software. It is the
member of audit-consulting group «SPG».
PROGNOZ
www.prognoz.ru

prognoz@prognoz.ru

+7(342) 240-3663

Perm, Russia

Year of Аoundation

Headcount

Programming Languages

1991

1619

C, C++, C#, JavaScript, Fore (proprietary),
ASP.NET, Java, Flash, Web Services

PROGNOZ is an international company that has been working in the IT market since 1991. Today, we are one of the
top Business Intelligence software vendors in Russia. PROGNOZ Platform, our flagship solution, is designed to develop
modern Business Intelligence and decision support systems to fit the needs of industrial enterprises, national and regional governments, banks, and financial sector participants.
QarkSoft
www.qarksoft.ru

inbox@qarksoft.com

+7(383) 380-2263

Novosibirsk, Russia

Year of Аoundation

Headcount

Programming Languages

2012

6

Scala, Java, C#, Nemerle, C++

Company QarkSoft - is a highly skilled team of programmers with extensive experience of working together. We love
and know how to program. We are pleased to take on the programming tasks in your projects and are ready to implement your ideas.Why us? Quality(We always test multiple times developing solutions), 100% satisfaction guarantee
terms(we guarantee the execution of the project on time),we do not have layer of ineffective managers, full transparency of Customer-Contractor collaboration. We are good at: Unified communications, Traffic management,Mobile app.
Quorus ACS
www.quorus.ru

market@quorus.ru

+7(343) 272-1092

Year of Аoundation

Headcount

Programming Languages

1989

Yekaterinburg, Russia

100

Quorus ACS is the most experienced and skilled system integrator of information solutions independently from its
complexity. Quorus` partners are banks, industrial and state enterprises. "Quorus ACS" specialises on computational,
telecommunicationsand engineering designing and implementation; sevcice, IT consulting and audit.
RITG
www.ritg.ru

cto@ritg.ru

+7(842) 246-2226

Ulyanovsk

Year of Аoundation

Headcount

Programming Languages

2006

35

С#, ASP.NET, PHP, C++, Java, J2EE,
Objective C, 1C-Bitrix

Holding «Russian IT Group» was founded in 2006. Since the beginning, holding promotes advanced information technologies to Russian and international markets. Our team is a fast growing player on the World IT-market. Our mission
is to improve the quality of information technologies used in your company to the level of highest international standards. We are looking forward to make the business of our customers dynamic, informative and flexible with the help
of development and implementation of effective and innovative solutions to improve the efficiency and competitiveness
of customers

132
Participants of research
Rus Wizards
www.ruswizards.com

info@ruswizards.com

+7(929) 820-6238

Year of Аoundation

Headcount

Programming Languages

Taganrog, Russia

2009

40

.NET, C#, Java, PHP, Ajax, Objective C

Rus Wizards is a software developing company that holds a Microsoft certificate in Data Management and Business
Intelligence Solutions and has proficiency certificates for MS SQL Server 2005 DBA/DBD, ASP.NET 4.0 and MVC. The
company develops mobile applications for iPhone/iPad, Android and Blackberry. Rus Wizards proficiency lies in DB
solutions, Web solutions, Reporting solutions and Mobile apps.
SCANEX R&D Center
www.scanex.ru

scanex@scanex.ru

+7(495) 739-7385

Year of Аoundation

Headcount

Programming Languages

1989

200

Moscow, Russia

C++, C#, Java, Perl

SCANEX Research and Development Center is the leading Russian company on the remote sensing market that offers
a complete set of services ranging from acquisition to thematic processing of Earth observation images from space.
Today, ScanEx is the only Russian company that has signed license agreements with the top world remote sensing
Operators for direct data acquisition from SPOT, FORMOSAT, EROS, UK-DMC2, RADARSAT satellites series to UniScan™ ground stations, enabling regular near real-time monitoring of territories of Russia and the CIS countries with
spatial resolution from hundreds to less than one meter.
Sibers
www.sibers.ru

info@sibers.ru

+7(383) 330-6626

Year of Аoundation

Headcount

Programming Languages

1998

130

Novosibirsk

PHP, .NET

Sibers is a software development offshore center. It is one of the largest players representing Russia on this market.
At present the company is in Top Three companies on the online service marketplace called Elance, which is providing
hundreds of offshore software companies with various projects. To support the its intentions, Sibers has been able to
build teams of different scale with diverse exchange rates. Sibers team consists of CS-major graduates, experienced
scientists and IT professionals with BS/MS from top Russian universities.
Sigma Technology
www.iosotech.com

company@iosotech.ru

+7(495) 761-2487

Year of Аoundation

Headcount

Programming Languages

2001

9

Moscow, Russia

.NET, Fortran

SIGMA Technology is a software company in the private sector which operates in the field of numerical optimization for
complex technical systems. The company is located in Moscow (Russia). The main goals are: Development of optimization strategy and software (IOSO Technology algorithms family) as well as Real-life optimization problems solution in
cooperation with other companies. SIGMA Technology was founded in 2001 on the basis of IOSO Technology Center.
Developments of the company are based on 25 year operational experience in the fields of Turbomachinaryand Aerospace.
SimbirSoft
www.simbirsoft.com

info@simbirsoft.com

+7(842) 244-6691

Ulyanovsk

Year of Аoundation

Headcount

Programming Languages

2001

95

Java, C++, .NET (C#), PHP, Android, iOS, WinPhone,
Ruby, Python

Founded in 2001 SimbirSoft Ltd. provides custom software development and testing services for the companies from the USA,
the Russian Federation, Japan and European countries. The company has a big experience in developing document workflow
and project management systems, CRM, cloud systems, financial and statistics products, web and mobile applications as well
as IT-consulting services. The key technological competences are Java, C++, .NET (C#), PHP, Ruby, Android, iOS, WinPhone.

133
Smart-soft.ltd
www.smart-soft.ru

info@smart-soft.ru

+7(495) 615-5057

Year of Аoundation

Headcount

Programming Languages

Kolomna, Russia

2003

28

C++, C, Java, Delphi, Visual Basic

Founded in 2003, Smart-Soft is a privately owned Russian software development company specializing in Internet
technology solutions. Smart-Soft has a range of software products that allow businesses to connect, collaborate and
communicate securely and to resolve the problems that can arise when using the Internet.
Soft-Consult Ltd.
www.soft-consult.ru

postmaster@soft-consult.ru

+7(812) 534-8481

Saint Petersburg, Russia

Year of Аoundation

Headcount

Programming Languages

2001

15

C#, C, C++, VB.NET, Java, JavaScript,

Soft-Consult provides consulting services in IT and software development, covering a wide amount of customers’ needs, beginning with auditing and ending with developing of complex information systems. The major lines of our activities are the following:
Developing document management systems; Developing geographic information systems; Developing distributed systems for
business processes automation; Developing computer‑integrated telephony applications; Developing mobile applications.

SoftDev SPb
www.softdev.spb.ru

gkovaleva@softdev.spb.ru

+7(812) 325-7422

Saint Petersburg, Russia

Year of Аoundation

Headcount

Programming Languages

1994

55

C++, C#, Java, Perl, .NET, PHP, Visual Basic

Headquartered in St.Petersburg, Russia, SoftDev SPb has been rendering services to its customers for over 18 years.
Extensive experience of working with companies worldwide enabled our company to amass a wealth of industry-specific knowledge, which, combined with proficiency in various programming technologies, makes SoftDev the perfect
choice for outsourcing even the most complex software development tasks.
SoftReactor
www.softreactor.ru

info@softreactor.ru

+7(812) 336-6066

Year of Аoundation

Headcount

Programming Languages

2010

7

Saint Petersburg, Russia

PHP, Java, Perl, flex

SoftReactor is a Saint-Petersburg based software development company founded in 2010 and is growing since that
time. Specialization of the company includes Internet applications, Web development, Mobile applications, Web programming, Business automation, Geoinformation technologies, Social network applications and Internet solutions.
Speech technology center
www.speechpro.ru

stc-spb@speechpro.com

+7(812) 325-8848

Saint Petersburg, Russia

Year of Аoundation

Headcount

Programming Languages

1990

356

C#, C++, Java, C, Python, PHP, Matlab

Speech Technology Center (STC) is an international leader in speech technology and multimodal biometrics. It has
over 20 years of research, development and implementation experience in Russia and internationally. STC is leading global provider of innovative systems in high-quality recording, audio and video processing and analysis, speech
synthesis and recognition, and real-time, voice and facial biometrics solutions. STC innovations are used in both public
and commercial sectors, from small expert laboratory
Tecom Group
www.tecomgroup.ru

info@tecomgroup.ru

+7(831) 432-6687

Year of Аoundation

Headcount

Programming Languages

1992

250

Nizhny Novgorod, Russia

C, C++, C#

Tecom is headquartered in Melbourne, FL (USA). The company’s engineering centers are located in Nizhny Novgorod
(Russia) and Arzamas (Nizhny Novgorod region). Our Quality Management System is certified in accordance with ISO
9001-2001 and CMM Level 3 standards. Main business activities of the company: Software and hardware design,
development, testing and maintenance in networking, telecommunications, broadcasting, microwave communications
and embedded systems; Implementation and system integration of software and hardware systems in broadcasting,
telecommunications and ERP; IT consulting.
134
Participants of research
Teknavo
www.teknavo.com

info@teknavo.com

+7(812) 336-3612

Year of Аoundation

Headcount

Programming Languages

2006

London, UK

С++, Java

Teknavo designs, builds and manages front office technology applications for the financial services sector. We focus
on two important areas: We leverage our in-depth knowledge of the industry and its technical challenges and have
access to the best practitioners both on- and offshore. From the ground up, we build custom-made onshore/offshore
organizations with a flexible workforce model that augments the existing in-house technology capability, operating in
sync with, rather than at odds with, your current operations.
Titan - information service
www.speereo.com

spr-feedback@speereo.com +7(812) 327-4455

Year of Аoundation

Headcount

1998

Saint Petersburg, Russia

Programming Languages

C++, MS

Titan - Information Service JSC is an owner and developer of Speereo continuous speech recognition system. Since
2002 Company has been developing mobile applicaitons and systems enhanced with speech recognition. Speereo
Speech Recognition possesses some unique features that set it apart from competition. Since 2011 Company started
a new project: universal remote with voice recognition that allows users to control misc. devices with voice commands.
UniPro
www.unipro.ru

marketing@unipro.ru

+7(383) 332-6061

Year of Аoundation

Headcount

Programming Languages

1992

70

Novosibirsk, Russia

C++, Java

Founded in 1992, UniPro started with 16 specialists participating in Sun Microsystems projects. Since then, UniPro
has steadily grown and has become a reliable partner in the IT offshore outsourcing market. Now it's a full service IT
company, having successfully completed more than 60 projects in a wide range of technologies. We deliver our clients
the best IT solutions through the world-famous creativity of Russian software developers, backed up by their excellent
educational background and the Russian R&D tradition.
Unisoft Plus
www.unisoftplus.com

contact@unisoftplus.ru

+7(383) 363-7001

Year of Аoundation

Headcount

Programming Languages

1990

16

Novosibirsk, Russia

C#

Unisoft plus is an independent software development and research company that works in the international market
since 1994. Unisoft plus offers tailor-made software development in two broad categories: Business applications
including e-business + Technical and scientific applications AND Reengineering and porting of existing legacy software
to new platforms/environments + Development of off-the-shelf software.
Wave Access
www.wave-access.com

info@wave-access.ru

+7(812) 326-8626

Year of Аoundation

Headcount

Programming Languages

Saint Petersburg, Russia

2000

100

C#, C++, .NET, Java, JavaScript, Perl

WaveAccess is a software company developing business solutions since 2000. Headquartered in the USA with offices
in the UK, Russia and the Ukraine. Today, WaveAccess is a provider of advanced automation technologies for businesses all over the world. At Wave Access we develop custom software for Internet Enterprise, Medical markets and
Microsoft Dynamics CRM.
WebSoft Development
www.websoft.ru

websoft@websoft.ru

+7(495) 514-0436

Year of Аoundation

Headcount

Programming Languages

1999

50

Moscow, Russia

C++, C#, Java, JavaScript

WebSoft, founded in 1999, is the leading Russian independent software vendor that develops a comprehensive suite
of software products for e-Learning and humal capital management. Our software supports the processes of e-Learning, authoring electronic content, employee assessment, testing, competency management, knowledge management,
talent management, career development, and personnel recruitment.
135
Yumasoft
www.yumasoft.com

info@yumasoft.com

+7(812) 334-0805

Year of Аoundation

Headcount

Programming Languages

2003

25

Saint Petersburg, Russia

C#

Yumasoft is a well-known, growing outsourcing software development company that has been in this business since
2003. Our main development centers are in Russia and Belarus with a team of more than 60 highly educated and
experienced software engineers, who are ready to take on even the most complex projects and who deliver top quality
software products and solutions, maintenance, and support. Our experience, expertise, and competence have made
us one of the most reputable software development companies in Europe and the US.
Dom Programm
www.domprog.com

info@domprog.com

+7(812) 320-2136

Year of Аoundation

Headcount

Programming Languages

2001

14

Saint Petersburg, Russia

C#, .NET, PHP

Dom Programm Ltd. specializing in the development of corporate proprietary products; classical applications; clientserver solutions, and applications to work with databases; WEB sites development of several level of complexity. We
use service oriented architecture approach (SOA), cloud computing, and Software as a Service (SaaS) paradigm;
technologies based on modern protocols, data presentations and transformation. We develop in Windows, Linux with
MS Visual Studio, Eclipse, Netbeans as development tools. We use C# in .NET and PHP + MySQL with the use of
HTML5, CSS3, Ajax.

136
RUSSOFT Association
Birzhevaya line 16, suite 411,
St. Petersburg, 199034, Russia
contact@russoft.org
www.russoft.org

Editor-in-Chief
Valentin Makarov

Analytics
Dmitry Zhelvitsky
137

The 10th Annual Survey of the Russian Software Export Industry

  • 1.
    10-TH ANNUAL SURVEY 2013 RUSSIANSOFTWARE DEVELOPING INDUSTRY AND SOFTWARE EXPORTS With support from APKIT Association RUSSOFT Association 2013
  • 2.
    Luxoft is oneof the leading Central & Eastern European ITO providers. We offer custom application development services to world’s largest brands in Finance, Telecom, Energy, Travel & Aviation, Automotive & Transportation and Technology industries. Our deep industry expertise and highest quality of the service receive regular recognition (’’IT Outsourcing Project of the Year’’ by EOA, ‘’Outsourcing Provider of the Year’’ by NOA). Augment your IT strategy, and select the nearshore partner that will enable you to expand your horizons.
  • 3.
    Introduction Dear colleagues! Dear friends! I vendorswere included in the so-called “Magic Quadrants” of Gartner and Russian service companies strengthened their positions in the international ratings. The trend of attracting investments into the Russian IT industry became more apparent (two more Russian representatives – Luxoft and QIWI successfully am very happy to present you the results held the IPO procedure and entered the world of the 10th annual survey of the software financial market, while venture investments in export industry in Russia. the Russian IT grew up to 2.3 times compared The research was conducted by RUS- to the previous year. SOFT (Association of software companies, I would like to catch this opportunity and RUSSOFT) from February to April, 2013 when to thank the Confirmit and Toy Opinion for their more than 140 market players were interro- effective support of source information collec- gated. tion, to PROMT for their professional transla- This year we celebrated the 10th an- tion services as well as to convey our sincere niversary of our research, so we decided to gratitude to Andrey Terekhov, professor of St. improve the methodology and to revise the Petersburg University, for his participation in previously obtained results. During the revision the report editing. And certainly, I wish to give we came to conclusion that our last year’s es- kind words of gratitude to our analyst Dmitry timates of export value of the Russian software Zhelvitsky for his fantastic work on putting and of software development services were together all the obtained information. almost completely confirmed (with a very small We are very grateful to the Association correction upwards). The ratio of export shares of Computer and Information Technology of different industry’s segments has slightly Companies (APKIT) and to our sponsors changed, but it has not led to major changes without whom it would have been impossible in the identified trends and the previously to perform such a large-scale project. drawn conclusions. Now we can even more safely judge the Many thanks to all survey participants who provided information on their companies. The industry position in the global market, to trace jubilee research summarizes the result of the dynamics of its development, to identify long- industry development decade, and this result term and medium-term tendencies as well as is very positive. The industry is rapidly develop- to predict the further course of events. ing and is becoming a significant and respect- The last year passed within the global ed global market player. contraction of the economic growth and with a slowdown in the Russian industrial growth. This period was also marked by the ‘rebound’ in the Russian IT market dynamics – the market volume practically remained at the previous year’s level. Nevertheless, in 2012 the Russian software development industry continued to develop actively, having increased its export almost by 15% and having reached the export volume of 4.6 billion dollars. The last year was notable for several distinctive features: a whole group of Russian software Best regards, Valentin Makarov Executive Editor RUSSOFT Association President 3
  • 4.
    Content Introduction . .. . . . . . . . . . . . . . . . . . . . . . . . . . . . . . . . . . . . . . . . . . . . . . . . . . . . . . . . . . . . . . . . . . . . . . . . . . . . 2 Methodology. . . . . . . . . . . . . . . . . . . . . . . . . . . . . . . . . . . . . . . . . . . . . . . . . . . . . . . . . . . . . . . . . . . . . . . . . . . . . . 5 Chapter 1 Positions of Russia in the global market of software and software development services. . . . . . . . . . . . . . . . . . . . . 11 Russia in the Global IT-ratings . . . . . . . . . . . . . . . . . . . . . . . . . . . . . . . . . . . . . . . . . . . . . . . . . . . . . . . . . . . 12 Achievements of individual Russian companies in the world ratings . . . . . . . . . . . . . . . . . . . . . . . . . . . . . . . 15 Russian IT Market in 2012. . . . . . . . . . . . . . . . . . . . . . . . . . . . . . . . . . . . . . . . . . . . . . . . . . . . . . . . . . . . . . 20 Publications on High Technologies in Russia in Foreign Mass Media. . . . . . . . . . . . . . . . . . . . . . . . . . . . . . . 25 Chapter 2 Volume and structure of Russian software export . . . . . . . . . . . . . . . . . . . . . . . . . . . . . . . . . . . . . . . . . . . . . . . . . . 31 Software development services export. . . . . . . . . . . . . . . . . . . . . . . . . . . . . . . . . . . . . . . . . . . . . . . . . . . . . 39 Products and ready-to-use solutions . . . . . . . . . . . . . . . . . . . . . . . . . . . . . . . . . . . . . . . . . . . . . . . . . . . . . . 43 R&D and software development centers of foreign corporations (captive centers). . . . . . . . . . . . . . . . . . . . . 46 Chapter 3 Major trends and targets in the Russian software development industry. . . . . . . . . . . . . . . . . . . . . . . . . . . . . . . . . . 50 Quality management system certification . . . . . . . . . . . . . . . . . . . . . . . . . . . . . . . . . . . . . . . . . . . . . . . . . . . 52 Investment promotion . . . . . . . . . . . . . . . . . . . . . . . . . . . . . . . . . . . . . . . . . . . . . . . . . . . . . . . . . . . . . . . . . 54 Investments of Russian companies and funds in other countries. . . . . . . . . . . . . . . . . . . . . . . . . . . . . . . . . . 58 The global software market and ways to increase sales for Russian suppliers. . . . . . . . . . . . . . . . . . . . . . . . 60 Chapter 4 Geographic Reach and Main Vertical Markets. . . . . . . . . . . . . . . . . . . . . . . . . . . . . . . . . . . . . . . . . . . . . . . . 63 of the Russian Software Development Industry Main geographical markets . . . . . . . . . . . . . . . . . . . . . . . . . . . . . . . . . . . . . . . . . . . . . . . . . . . . . . . . . . . . . 64 Vertical markets. . . . . . . . . . . . . . . . . . . . . . . . . . . . . . . . . . . . . . . . . . . . . . . . . . . . . . . . . . . . . . . . . . . . . . 67 Software development center geographic distribution. . . . . . . . . . . . . . . . . . . . . . . . . . . . . . . . . . . . . . . . . . 68 Geographic distribution of marketing and sales offices of Russian companies. . . . . . . . . . . . . . . . . . . . . . . . 72 Chapter 5 Human resources and labor market. . . . . . . . . . . . . . . . . . . . . . . . . . . . . . . . . . . . . . . . . . . . . . . . . . . . . . . 74 Employee recruitment and headcount reduction. . . . . . . . . . . . . . . . . . . . . . . . . . . . . . . . . . . . . . . . . . . . . . 79 Shortage of engineers . . . . . . . . . . . . . . . . . . . . . . . . . . . . . . . . . . . . . . . . . . . . . . . . . . . . . . . . . . . . . . . . . 83 Foreign language skills. . . . . . . . . . . . . . . . . . . . . . . . . . . . . . . . . . . . . . . . . . . . . . . . . . . . . . . . . . . . . . . . . 86 Salary . . . . . . . . . . . . . . . . . . . . . . . . . . . . . . . . . . . . . . . . . . . . . . . . . . . . . . . . . . . . . . . . . . . . . . . . . . . . . 89 Staff training. Universities. . . . . . . . . . . . . . . . . . . . . . . . . . . . . . . . . . . . . . . . . . . . . . . . . . . . . . . . . . . . . . . 93 Situation on the labor market in Russia and in other countries . . . . . . . . . . . . . . . . . . . . . . . . . . . . . . . . . . . 102 Chapter 6 Technologies. . . . . . . . . . . . . . . . . . . . . . . . . . . . . . . . . . . . . . . . . . . . . . . . . . . . . . . . . . . . . . . . . . . . . . . . . . . . . . 106 Operating systems. . . . . . . . . . . . . . . . . . . . . . . . . . . . . . . . . . . . . . . . . . . . . . . . . . . . . . . . . . . . . . . . . . . . 107 Programming tools. . . . . . . . . . . . . . . . . . . . . . . . . . . . . . . . . . . . . . . . . . . . . . . . . . . . . . . . . . . . . . . . . . . . 108 DBMS. . . . . . . . . . . . . . . . . . . . . . . . . . . . . . . . . . . . . . . . . . . . . . . . . . . . . . . . . . . . . . . . . . . . . . . . . . . . . 110 Conclusions. . . . . . . . . . . . . . . . . . . . . . . . . . . . . . . . . . . . . . . . . . . . . . . . . . . . . . . . . . . . . . . . . . . . . . . . . . . . . . 111 Participants of research. . . . . . . . . . . . . . . . . . . . . . . . . . . . . . . . . . . . . . . . . . . . . . . . . . . . . . . . . . . . . . . . . . . . . . 114 4
  • 5.
    Methodology METHODOLOGY T he research thatRUSSOFT only companies which have foreign contracts Association conducts annually (irrespective of their export share in the total since 2004 traditionally begins amount of sales) were selected in both cases. with a polling of a regularly As a result, 144 high-quality questionnaires updated database of 1400 filled by software export companies were Russian companies and organizations which are engaged in the international software collected. It should be noted that the line-up and development. The survey was carried out the structure of respondents is considerably using technology of Comfirmit with participa- changing from year to year. Only 26 respon- tion of the Toy Opinion marketing agency. In dents (18%) participated in the survey both addition to this, RUSSOFT performed its own this year and last year. However, as a whole, survey of its members. During the research these changes do not prevent from compar- 01. Respondents’ distribution by market operation duration Companies’ age 50 40 48 % 28 20 From 4 to 8 years % From 9 tо 13 years % 25 27 23 25 32,5 30,5 26 10 10 0 % More than 14 years 41 35 30 Up to 3 years 3 Survey of 2011 Survey of 2012 Survey of 2013 2 Survey of 2010 11 5
  • 6.
    Methodology 02. Distribution ofrespondents depending on their specialization: Year of survey Software companies (product companies) 2012 22% 2013 29% Foreign corporations’ development centers Software development service providers Service and product companies 78% 3% 59% ing the survey results obtained in the last 2 9% * In 2012, the “service and product” companies were regarded as the service companies, and foreign companies’ development centers did not participate in the survey. Several new questions describing service years and from revealing the current trends. companies’ activities were added to the Besides, a relative increase in this or that questionnaire. In particular, the following respondents’ group in certain cases reflects points were determined: a payment model real processes in the software industry. For for service contracts (payment on “time and example, a sharp increase in the share of material” or on a “fixed price”), a customer brand new companies (with an effective relationship model (custom software devel- period less than three years) from 2% to opment, creation of the customer’s offshore 10% which was revealed in the last year is development center or both models), a type connected with a significant growth of the of services offered by service provider (soft- number of startups appearing after 2008. The ware development, software testing, software information on such increase is confirmed technical support, IT consulting and others), by the venture companies and investment types of service companies’ clients (system funds operating in Russia. The fact that this integrator, end-user, software development change was not revealed 1-2 years earlier is subcontracting and so on). explained by a certain delay in including new companies in the exporter database. This year, the share of companies operat- Besides, thanks to the change in the wording of the question regarding the price of the company’s working hour offered to the ing less than 3 years remained at the last customer, additional information for analysis year’s level (or slightly increased) and reached appeared. The information on the man-hour 11%. This means that a hyperactivity period cost was classified by areas of expertise so in startup creation still goes on. the number of answers to the corresponding This year, the challenge of attributing certain companies according to the product or survey question sharply increased. There was one more change – separation service business model becomes especially of the largest companies (with the turnover obvious. Many custom software develop- over $20 million) in two categories: with the ers eventually create their own standard turnover from $20 million to $100 million and solutions. These solutions are sold in parallel those with the turnover over $100 million. with the delivery of software development This change was connected with a significant services, otherwise service companies de- growth of largest companies in the recent velop new systems on customer’s requests years. As a result, very large companies (by based on their own existing solutions. The Russian standards) became «global» and they companies with the equivalent income from should be considered separately from other both sale of licensed software and from software development services were put “conditionally” large companies. During all years of research, there was a together into a new category – «service and 6 dominance of Moscow and St. Petersburg product companies» companies among respondents. The two
  • 7.
    Methodology Year of survey 2011 2012 2013 03. Distribution 19 of respondents by central office location 22 8 13 9 04. Distribution cumulative income 8 21,1 distribution by central 21 office location 11 10,9 14 of respondents’ 6 29 25 29 28 34 39 26 9 16 60 65 66,9 05. Distribution of respondents’ 14 consolidated export 18,6 18 revenues by central office location 76 % Moscow % St. Petersburg 74,8 % Siberia 74 % Ural Russian capitals are accounted for 55% of Other towns Actually, considering the difficulties of respondents, for 81% of aggregate income % obtaining questionnaires from provincial com- and for 92% of consolidated export revenues. panies and the fact that more than a half of The financial crisis of 2008 accelerated the large Moscow or St. Petersburg companies process of business consolidation in the Rus- have their software development centers in sian software industry (it especially concerns the regions (at least one regional develop- custom software developers) that resulted in ment center each), the contribution of regions a small increase in the share of Moscow and into the export of software and of develop- St. Petersburg, where largest Russian export ment services is much greater. companies are concentrated. This year survey results allow assuming a Companies representing 35 Russian cities took part in the survey (by the location of the change of balance of power between capitals headquarters or of their main production site). and regions. A gradual but steady reduction of In 10 more cities there are no companies’ the gap between two capitals and regions has headquarters but there are remote devel- been outlined. Outside Moscow and St. Pe- opment centers. Thus, industrial software tersburg, the number of companies is growing development for export is conducted at least slightly quicker and new large companies ap- in 45 Russian cities. Considering sales offices pear. Examples of such large regional compa- as well, the respondent companies have nies are MERA Networks in Nizhny Novgorod, employees in 60 Russian cities. PROGNOZ in Perm, ICL-KME CS in Kazan, Parallels and Alawar in Novosibirsk. The total revenue of all respondent companies was $1724 million, and the export 7
  • 8.
    Methodology 06. Distribution ofthe respondents by their turnover Less than $0.5 million From $0.5 million to $4 million From $4 million to $20 million Over $20 million 2008 39% 39% 15% 8% 2009 24% 58% 13% 5% 2010 31% 48% 14% 7% 2011 19% 53% 20% 8% 2012 15,5% 60,6% 12,7% (11,2%) From $20 million to $100 million Over $100 million 7,7% 3,5% from $20 million to $100 million higher than $100 million 20% 62,9% 07. Distribution of the respondents depending on their aggregate income Companies with turnover less than $0.5 million from $0.5 million to $4 million from $4 million to $20 million higher than $20 million 2009 1% 17% 18% 64% 2010 2% 13% 20% 66% 2011 1% 10% 16% 73% 2012 0,5% 7,7% 8,9% (82,9%) revenue was $1049 million (61% out of the higher (about 85% of the export income of all total turnover). Last year, their average share respondents accrues to 10% of them). The of export was 68%. Its reduction is explained tendency of market consolidation remains the not only by random fluctuations but also by same during all recent years. Large compa- the fact that the income from sales in the nies are growing quicker than small ones. domestic market in 2012 increased more When considering the structure of the than export (that reflects the growth of the aggregate income and the share of export Russian IT market in connection with deferred depending on responds’ headquarter location, demand after the crisis). we need to take into account the fact that About 80% of the aggregate income of by 2008–2010 the formation of the Russian all respondents accrues to 10% of the larg- software development industry «pyramid» had est companies. As the survey mainly covers come to the end. At the top of the pyramid the largest companies (especially since the there is a group of leaders which naturally majority of them belong to the RUSSOFT have turned into the global corporations that Association and traditionally participate in the have their sales offices in all leading markets research), the real ratio for the entire industry and the branched-out network of develop- is somewhat different. However, it may safely ment centers in Russia and other countries. be said that the share of large companies is at least 70% (if not 80%) of the total market. The contribution of the largest companies to the aggregate export revenues is even 8 The situation in the lower part of the pyramid is not so stable. The number of respondents (in relative values) with the turnover less than $0.5
  • 9.
    Methodology 08. Distribution ofthe respondent companies depending on their export income Companies with turnover less than $0.5 million By the results of 2012 from $0.5 million to $4 million from $4 million to $20 million from $20 million to $100 million than $100 million 0,3% 4,2% 8,2% 16% 71,4% million and turnover from $4 to $20 million or decrease in the number of personnel of considerably reduced. It cannot be explained such centers. Nevertheless, this year several by random factors only. The decrease of the software development centers of large foreign smallest companies share is connected with corporations provided information for our the fact that startups began to overcome the research, although the data was limited. turnover level of half a million dollars quicker. The results of the survey conducted by Also, there is every indication that a part of RUSSOFT in February-April 2013 constitute the smallest companies does not sustain the basic information for this research. At competition both in the service and software the same time, a considerable part of the product market and in the labor market. It information about the situation in the industry is understandable as they can not use tax and in the various markets was received from incentives in social payments. This factor other sources. First of all, we can mention the is one of the most powerful reasons for the ratings of authoritative analytical agencies, re- decrease in the share of small companies search companies’ reports, information from among the survey participants. The largest Russian software vendors, as foreign and international software developers associations, publications in Russian and is usual with them, did not participate in the foreign mass media (the news were mainly survey directly. Information on their financial monitored on the following media resources: performance was collected from different CNews, Computerworld Russia, ITRN portal). sources: mass media publications, compa- In this research, we also used opinions of ex- nies’ press releases and their web sites. We perts, results of the express polls of recruiting also used estimations of external industry agencies and the statistics of training centers, experts and the data received when commu- as well as the information received by experts nicating with company managers (all data on directly during communication with managers companies’ financial performance collected of companies (and many of these companies within this research is used for calculation did not take part in the survey). Especially, we of cumulative revenue only and cannot be should mention the ANCHOR High Technolo- divulged). gies and SuperJob recruiting agencies which Foreign corporations’ research centers which provide cross-border software development services for their parent companies provided the most complete and detailed information on the labor market situation. After research completion and report are not willing to disclose information on their preparation, the text of the report and the turnover. The assessment of turnover and of drawn conclusions were revised by experts aggregate income of such development cen- (the heads of companies that play an active ters was performed based on the expert esti- role in the RUSSOFT Association). Besides, mations taking into account the available data the experts commented on some discovered on the their staff, the results of interviews with changes and tendencies. corporation representatives and information of recruiting agencies which fix mass increase As the questionnaire sent to respondents changes insignificantly and includes the same 9
  • 10.
    Methodologies key parameters forcomparing companies’ indi- engaging into the whole process those experts cators for several years, it allows revealing the companies and have been moral authorities for ment process continuity. This is facilitated by 10 who are in charge of the leading RUSSOFT industry tendencies and maintaining measure- the entire industry for many years.
  • 11.
    CHAPTER 1 POSITIONS OFRUSSIA IN THE GLOBAL MARKET OF SOFTWARE AND SOFTWARE DEVELOPMENT SERVICES
  • 12.
    Chapter 1 /Russia in the Global IT-ratings Russia in the Global IT-ratings business IT solutions which might be also in Arkadiy Dobkin CEO and President, EPAM Systems high demand at those markets. We also see a positive tendency coming up, when many more IT events are happening annually in the region, more talented software engineers are recognized in their native countries, more domestic organizations are For EPAM, our delivery centers in the region eager to benefit from advanced software play a strategic role. It is not only about solutions and best IT practices locally. In its the geographic proximity to our clients in turn, EPAM invests into helping young IT Western Europe. It is also about an excep- specialists through multiple educational ini- tional engineering talent we have access tiatives and setting training labs together with to in this geography; it is about developing the leading local universities. We do believe and serving local and international clients in all that helps push the market forward, and Russia, Ukraine, Belarus, and Kazakhstan, that is what we have been trying to do for which are looking to benefit from our strong 20 years of EPAM’s active presence in the international expertise in many industry and region. F or the last year, Russia improved ment and about the carried-out reforms, its positions in the various global but also by growing information openness IT related ratings which reflect the of the Russian government bodies and of level of IT development and usage, commercial structures. For example, just in as well as conditions for conduct- a year Russia flew up 32 positions higher in ing business. Similar processes are observed the world rating of the Electronic government in the majority of IT-ratings for several last development (E-Government Survey 2012: years, however for the first time there has not E-Government for the People), having risen been noted any exception connected with from the 59th to the 27th place. This rat- deterioration of any of them. ing was published by the United Nations. It In some cases negative publications in the reflects the readiness and the feasibility of the mass media have been producing their impact state agencies from 193 countries to use ICT on experts who created these ratings. Then to provide the state services. they were partly guided by political stereo- Certainly, Russian government made types, maintaining political games and creating some decisions that contributed to the of Russia an image of the enemy. This orienta- increased use of IT and of the Global network tion was partially enforced because Russian in the interaction of various departments and companies, universities and state structures the government institutions with the citizens. were not always aspiring to provide all informa- Particularly to be noted that a unified portal tion that is necessary for analysts. for the state services was created. However it At the same time, movement up of Russia is hard to say that it is already operating with in world IT-ratings was not only caused by 12 the full functionality support. Many services available real information about its develop- are not transformed to the electronic form yet.
  • 13.
    Chapter 1 /Russia in the Global IT-ratings but that progress could not be so great in World Competitiveness Yearbook (by IMD) such a short term. In the World Competitiveness Yearbook 2013 The work is underway and there is a progress In reality Russia jumped from one category of countries of the rating to another – published annually by IMD (International Institute for Management Development, Switzer- from countries with emerging economics to land) Russia took the 42nd place among 60 the economically developed countries – just countries, after having risen by six positions in a year. Moreover, countries in this rating for the year. The researchers have noted the are ranged based on the weighed index of substantial achievements in the state of the estimates on three main components (scale economy. The rating is compiled based on and quality of online services, level of ICT- statistics and on surveys of corporate leaders infrastructure development and human capi- (4,200 people interrogated, including about tal) and it is hard to change them in a year to 100 in Russia). overtake about thirty countries. Apparently, The main reason for the increase in the this breakthrough was caused by efforts Russia’s rating position is the data on the on the e-government programs that were employment – the country moved up by this undertaken in Russia within several years, parameter from the 27th to the 13th place. Ex- but analysts got information about them and perts also acknowledged the following strong estimated results no earlier than a year ago. or improving Russia’s indicators: low level of In e-Government Survey 2012, Russia public debt, low personal income tax, stable took the 37th place in the online services de- interest rate, high level of employees’ educa- velopment, the 30th place in the level of the tion and qualifications. They also marked as ICT-infrastructure development and the 44th weak or worsening indicators the following: place in the human capital development. All imbalanced export, weak pension system, three indexes were improved for Russia. underdeveloped capital market, bureaucracy, low need of innovations. A number of demog- Doing business raphy and health care indicators were also Apparently Russia takes worst positions in the mentioned (Russia is at the bottom by the ratio Doing Business rating which is compiled by of elderly and of employable population, by the the World Bank experts occupying the 112th quality of life and by the level of health care). place among 185 countries. However there was a step up by 8 places compared to the Global Innovation Index last year that testifies to a certain progress. It In the rating of the world’s most innovative should be noted that the World Bank tradition- states (which is compiled by the Bloomberg) ally estimates the situation in Russia worse than Russia took the 14th place, having outstripped other international organizations and some- Canada, the UK, Australia and many other times predicted decline in the Russian GDP that states. Totally 50 countries were included in was not confirmed by subsequent events. The the Global Innovation Index where information Ministry of Economic Development of the Rus- on 200 states and sovereign territories was sian Federation considers that Russia should analyzed. Analysts considered the follow- already take the 44th place in this rating. It may ing seven factors: R&D intensity, productivity, be realistically assumed that Russia’s position in high-tech density, researcher concentration, the rating may be somewhere within 40th-60th manufacturing capability, tertiary efficiency and places. Vladimir Putin, the incumbent president patent activity. The information was provided of Russia, demanded at the end of 2011 (then by the World Bank, the World Intellectual he held the position of the prime minister) that Property Organization, the Conference Board by 2020 Russia should move up in the Doing organization, the Organization for Economic Business rating to the 20th place. Cooperation and Development and UNESCO. 13
  • 14.
    Chapter 1 /Russia in the Global IT-ratings comScore National Cloud Computing Policy According to the comScore report, Rus- Following the results of the analytical research on sia possesses the largest Internet audience changes of different countries’ national policy in among the European states and takes the the sphere of cloud computing which was con- third place by indicator of web page viewing ducted by the Business Software Alliance (BSA) from mobile phones (by the share of page Russia took the 14th place among 24 world’s views from all types of mobile devices). leading IT economies (a year ago Russia was on IDI («ICT Development Index») Japan thanks to adoption of the complex legisla- Following the results of 2011, Russia moved tive initiatives to support e-commerce. Australia up by 2 places in the ICT Development Index is on the second place, and the third place this the 16th place). The global rating is headed by and took the 38th place, having closely ap- year belongs to the USA which have moved proached to Portugal that occupies the row Germany to the fourth position. BSA made an above. assessment of the national legislation and regulatory acts by seven different parameters that are The Web Index critically important for development of globally According to The Web Index report 2012 integrated market of cloud computing. (compiled by the World Wide Web Foundation organization), Russia took the 31st place by the level of the Internet development and Innovation Cities Global Index 2012-2013 usage. Every year Russia steadily improves In the rating of the world’s most innovative its positions in this rating. Following factors cities Moscow took the 74th place and St. prevent Russia from making a greater prog- Petersburg – the 84th place. Only 133 cities ress: low level of use of social networks and have been ranked there among 445 cities of the global network for health care informa- which participated in the rating. Except two tion availability, low level of e-learning services, Russian capitals the following Russian cities high level of cyber-crime and quite a low level also participated there: Yekaterinburg, Kazan, of e-commerce development. Novosibirsk, Samara, Krasnoyarsk, Kaliningrad, Rostov-on-Don, Nizhny Novgorod, Perm, Networked Readiness Index Saratov, Tomsk, Vladivostok, Omsk, Volgograd, According to the annual report published Izhevsk, Barnaul, Orenburg, and Togliatti. by the World Economic Forum and INSEAD business school, Russia moved up by two The Top 100 Outsourcing Cities places in the Networked Readiness Index The ranking of cities pretending to be the best 2013 (having overtaken China and other destinations for the software development BRICS countries) and took the 54th place. outsourcing (organized by Global Services) To be noted that in 2010 Russia was on the included four Russian cities. All of them were 80th place only. This year the improvement present in this listing a year ago. Only Moscow of the Russia’ position is mainly explained conceded its position and dropped from the by an increase in the number of Internet 46th to the 56th place. St. Petersburg moved users and especially by an exponential Novgorod – from the 63rd to the 62nd place, in the world). 14 up from the 33rd to the 32nd place, Nizhny growth of 3G-connections (the 20th place Novosibirsk – from the 97th to the 92nd place.
  • 15.
    Chapter 1 /Achievements of individual Russian companies in the world ratings Achievements of individual Russian companies in the world ratings M any large Russian software The Russian service companies have a vendors still do not aspire very different attitude towards the participa- to appear in various ratings tion in the international ratings. Among the created by the globally most well-known ratings, we can note two authoritative analyst teams. versions of the Top-100 world’s outsourcing The main reason is unwillingness to disclose providers: Global Services and IAOP (Interna- their turnover and profit data so that it would tional Association of Outsourcing Profession- not become widely known in their country. als). In these ratings (which are mainly based Besides, software vendors sometimes do not on the quality of rendered services rather than wish to demonstrate their Russian origin as on the company size) a significant number of they position themselves at the corresponding companies represent Russia (only India and markets as local residents (in order to use the the USA have more companies in the ratings). status of these countries’ national manufactur- Currently, the number of Russian software ers). There are also some fears that the Rus- development service providers in the Global sian affiliation may prevent from their success- Services and IAOP ratings looks very close to ful operations in some foreign markets due the maximum extent possible, still it may be to the politically prejudiced attitude towards even more increased due to the progress in Russia (mostly, in Europe and the USA). other Russian companies’ transparency and Due to these reasons, the representa- PR activity. Totally 10 Russian service provid- tion of Russian companies in a number of ers have been included at least once in the software vendor ratings is much lower than Top-100 outsourcing companies according to it can be expected in the present context. Global Services and IAOP for last five years. However, Russian vendors are gradually be- This year, the IAOP rating did not in- coming more open, and their representation clude such provider as MERA from Nizhny is growing even in those ratings for which the Novgorod, which decided not to participate turnover data has to be disclosed in the 2012 rating in order to be included 15
  • 16.
    Chapter 1 /Achievements of individual Russian companies in the world ratings into a higher category (“global”) next year. It it is noted that they are growing very quickly. would be also logical to see in this rating next Another candidate for a place among the year ICL-KME CS (based in Kazan) which is global providers is MERA. The growth of rapidly developing and has the staff number the company’ staff size to 2000 employees over 1200 people. allows it to anticipate the achievement of this In recent years, the share of Russian com- purpose following the results of 2013. panies in these ratings has kept at the level of 5-8%. We need to keep in mind that apart The 2012 Global Services 100 from the IT-service providers both ratings The last published rating of the top-100 also include leading BPO service providers. outsourcing companies according to the Excluding such companies from the ratings Global Services appeared in the summer of above, the proportion of Russian IT-compa- 2012. The new version (following the results nies will be higher than 10%. And summing of 2012) was not ready by the time of this up all achievements of Russian, Ukrainian, research report preparation. A year ago, and Belorussian IT-service providers in these the 2012 Global Services 100 list included ratings, the total share of service companies 7 companies from Russia: Auriga, DataArt, from the Russian-speaking industry of the for- EPAM Systems, First Line Software, Luxoft, mer USSR among the top world’s IT service MERA, and Reksoft. providers will be over 15%. The Global Services and IAOP analysts In the Global Services 100 rating, there were five companies from Ukraine and not only identify the global top-100 leading Belarus as well: IBA Group, SaM Solutions, outsourcing companies but also define the SoftServe, Intetics, and Itransition. All three best ones in various nominations, which al- countries are culturally and economically lows for judging the most important strengths close, so we can quite reasonably mention of the Russian software developers. The the so-called «Russian-speaking community» companies with their main development cen- of the IT-service providers. The strengths of ters in Russia are considered to be among the companies from these three States are the leaders in the following areas: Product approximately identical. First of all, they have Engineering, Software/Hardware, Information high quality education in the field of physical and Communication Technology Services, and mathematical sciences, exclusive creativ- Entertainment & Media, Automotive, Finan- ity of personnel and experience in performing cial Services, Health Care, Government and complex projects. Industry-Specific Services. determine the best service providers by The 2013 Global Outsourcing 100 Global Services and IAOP separately figures that reflect their size (staff number, The IAOP experts, among whom there are consolidated revenues, number of develop- representatives of General Electric, Sprint, ment centers). A few Russian companies are Thomson Reuters, WMS Gaming and of included into the corresponding additional leading US business schools, selected the ratings. They are also on the first positions winners by a number of criteria, such as the among IT service providers from the Eastern turnover growth and the company staff size, and Central Europe (almost all largest East the positive customers’ feedback, company’s European companies are concentrated in top management experience, and others. Russia, Belarus, and Ukraine). Only Luxoft and EPAM Systems are noted by analysts as the “global” companies, but Like in 2012, IAOP included 6 companies representing Russia in the Top-100 in 2013. They are: Artezio, Auriga, EPAM Systems, they are still considered to be medium-sized 16 First Line Software, Luxoft, Reksoft. Two enterprises by the global standards. Although years ago there were 5 such companies and
  • 17.
    Chapter 1 /Achievements of individual Russian companies in the world ratings three years ago there were only 3. According to experts, the increase in the number 09. Representation of Russian companies among the best ones in various sub-nominations of IAOP of companies in this rating confirms that Russian service providers successfully added Nomination understanding of market and their ability to Top ten do business to existing highest technological level of Russian engineers. This year there is one more Russian company (MERA) among the best in one of the separate nominations of IAOP. Thus, 7 representatives of Russia were included into The 2013 Global Outsourcing 100. Telecontact may be considered as the eighth, but it was only noted as a «rising star» of Russia. Besides, this company is oriented towards the Russian market and to the market of the nearing countries – Ukraine, Belarus, and Kazakhstan. It is to note that there are less Russian companies in The Global Outsourcing 100 than in The Global Services 100. It is explained by the fact that IAOP covers with its rating a larger range of outsourcing application areas (including BPO sector, where Russian export companies are not represented abroad). Except Russia, neighboring Ukraine and Belarus (with IBA Group, Intetics, Itransition, Oxagile, TEAM International, Miratech, Company name Leaders in Revenue Growth EPAM Systems Rising Stars in Revenue Growth First Line Software Rising Stars in Employee Growth Artezio, First Line Software Rising Stars in No. of Centers Worldwide Artezio Leaders – Entertainment & Media EPAM Systems, MERA Rising Stars – Retail & Consumer Goods Artezio Rising Stars – Financial Services (Banking, Markets) Artezio, Reksoft Rising Stars – Health Care Auriga Rising Stars – Telecommunications Reksoft Rising Stars – Information/Comm. Technology Services Reksoft, Artezio as well as with SaM Solutions, Softjourn and SoftServe which were listed in separate nominations) are also represented in the IAOP global rating. Some of mentioned companies have their headquarters in other countries but their main development centers are located in Belarus or Ukraine. PwC Global 100 Software Leaders According to PwC, Kaspersky Lab with its turnover of $615 million took the 57th place in the top-100 software companies (following the results of 2011). This company takes the 12th place in the EMEA region and the second place in the emerging markets (Emerging Markets 100), being slightly behind the Brazilian TOTVS. In the EMEA region, 1C was also included in the top-100 (it took the 30th place with Top twenty Leaders – Technology (Hardware & Software) EPAM Systems, Luxoft Leaders – Telecommunications Luxoft Rising Stars – Technology (Hardware & Software) Auriga Companies – Government (all levels) First Line Software, Reksoft Companies – Financial Services (Insurance) Exigen Services Leaders – Industry-Specific Services Luxoft Leaders – Information/ Comm. Technology Services EPAM Systems, Luxoft Companies– Research & Development Services Artezio, Auriga, First Line Software, Luxoft 17
  • 18.
    Chapter 1 /Achievements of individual Russian companies in the world ratings the turnover of $360 million). In the Emerg- of technologies and services for the financial ing Markets 100, there appeared three more industry). This year it took the 68th place, Russian companies apart from Kaspersky and Diasoft appeared in this rating on the Lab and 1C (8th place) – Dr. Web (42nd 88th place. place, $38 million), ABBYY (51st place, $31 million), and Positive Technologies (68th Magic Quadrants of Gartner place, $25 million). The Gartner Group analytical agency ratings are among the most prestigious ratings for Deloitte Technology Fast 500 EMEA software vendors. This agency year over year According to Deloitte, among 500 most fast- ner, which include products and companies publishes so-called Magic Quadrants of Gart- growing high-technology companies in the that are among the leaders in certain software EMEA region we can usually see companies segments. Since 2012, three new players that are not the largest software exporters. were unexpectedly added to the Russian An exception is Kaspersky Lab, which a year software leaders who are traditionally present ago took the 185th place by revenue growth in their «quadrants» (Kaspersky Lab, ABBYY indicator for the last 5 years. Many other Rus- and some others). These companies are sian software exporters promptly increased PROGNOZ from Perm (in the Business Intelli- their income for the last 5 years, but they did gence), Diasoft (in the Core Banking Software), not try to enter the Deloitte rating. and InfoWatch (in the new Data Loss Preven- In the last version of this rating, there are three Russian companies: ER-Telecom (136th tion quadrant), both from Moscow. In the Summer of 2013, Gartner included place), Service Plus (239th place), and STEC. Kaspersky Lab in the «magic quadrant» COM (462nd place). which comprises global vendors of mobile device management solutions (Mobile Device Software 500 In the recent years, only two Russian soft- Management – MDM). Besides, according to Gartner experts, a ware developers were present in this rating: small Moscow company IntelTech with their following the results of 2011 Luxoft took products in the field of Big Data analysis took the 188th place with the turnover of $206.2 the lead in the 2012 Cool Vendors list. million, and Artezio – the 462nd place. EPAM ment centers there), took the 181st place in Other Achievements of Russian Software Developers the Software 500. The European Outsourcing Association rec- Systems, which also represents Russia (based on the location of its largest develop- This year, Luxoft and EPAM Systems im- ognized Luxoft as the Outsourcing Company proved their positions in the Software 500 rat- of 2011, and also gave it the IT Outsourcing ing (they occupied the 186th and the 160th Project of the Year award. place, respectively). Artezio slightly fell back In 2013, Forbes business magazine put (466th place). In addition to them, this year EPAM Systems at the 6th position among the other Russian companies were also included most quickly growing American technological in the rating: PROGNOZ (292nd place) and companies (the EPAM Systems headquarters DataArt (403rd place). is located in the USA). Business Week called DataArt one of the FinTech 100 best developing outsourcing companies in In 2010 and in 2011, only one Russian the world. company (Luxoft) was included in the FinTech 100 (the rating of the global leading providers 18 At the end of 2012, the Russian developer of speech technologies (Speech Technology
  • 19.
    Chapter 1 /Achievements of individual Russian companies in the world ratings Center) was first awarded with the Speech internet security space and the first in the US Industry Award, which are annually conferred antivirus software retail market. to the main players of the global speech tech- In April 2013, two Russian compa- nology market for their achievements. Earlier, nies – Softkey and Next Media Group – were Speech Technology Center (STC) became the included in the top-100 innovative and tech- first Russian company to be honored with an nological Internet projects according to Red award for their technological achievements by Herring, one of the largest media holdings. the Technology Marketing Corporation (TMC), In September 2012, a Russian company one of the largest media North American first appeared in the IDC Security & Vulner- holdings oriented towards the market of tele- ability Management rating among the top-10 communications and CRM. According to the American INTERNET by revenue size. It was Positive Technologies, which occupied 2% of the segment of IT sys- TELEPHONY periodical, VideoMost (video- tem vulnerability assessment software with conferencing tools produced by SPIRIT the income from operation in this segment of Group) became the Product of 2012. SPIRIT over $16 million. software products are integrated in various A team of developers (from a small city telecommunication devices and systems. called Ulyanovsk) who developed Ecwid, a Over 1 billion people in more than 100 shop for social networks, forced out of Face- countries use their software globally on a book its US competitor, Payvment. Payvment daily basis. will transfer to Ecwid its user base – then Ec- By Gartner estimates, Kaspersky Lab comes the third in the world in the consumer wid will become the absolute leader among the Facebook shop designers. 19
  • 20.
    Chapter 1 /Russian IT Market in 2012 Russian IT Market in 2012 L ast year, the volume of the Russian capacities without purchasing new servers, information and communication and the IP telephony ousted more expensive technology market (ICT market) traditional voice communication. increased by only 1.2%. The information technology market Considering the entire ICT market, the main reason for the slowdown of its growth grew slightly more – approximately by 4% is the saturation in a number of its significant according to IDC and by 7% according to the segments. Now, it is no longer possible to Ministry of Telecom and Mass Communica- increase the volume of cellular communication tions of the Russian Federation. operators’ services and mobile phone sales Against a rapid (by tens of percent) at the expense of new subscribers as almost increase in the ICT market during the period all Russians (over 91% of the entire popula- after the crisis of 2009, the market actually tion, including children) already use mobile showed a zero growth in 2012. communications. Last year, mobile phones A year ago, experts expected the growth were generally purchased to replace existing of the Russian ICT market to reduce, but not in old devices. Replacement of traditional mobile such degree. The IDC analysts see two main phones (mainly used for voice communication) reasons for the deceleration: the decrease in by smart phones was underway. The aver- the Russian economy growth rates and the age price of a sold mobile phone significantly reduction of IT costs caused by the fact that increased, which means that in this case companies, coming through trials of that crisis, Russian economy deceleration had no great tend to spend money for various projects more impact on the market growth indicators. reasonably demanding sound justifications of The same holds true for the market of all costs. The ICT Russian market saturation personal computers, which now can be seen in some of its separate large segments should almost in each house and on each workplace. be added to these two factors. The relatively small growth that still remains Another factor that is worth mentioning is in this segment is supported by replacement development and expansion of modern cloud of desktops with laptops. Apparently, the and telecom technologies which provide desktop computer market in Russia, as well as new instruments to cut communication and around the world, will be steadily reduced. IT costs. The services of commercial data centers allow to upgrade available computing 20 Considering the level of economically developed countries, the Russian ICT market
  • 21.
    Chapter 1 /Russian IT Market in 2012 is not mature yet, although some signs of its maturation are already visible and the gap 10. Basic figures characterizing the Russian ICT market in 2012 is quickly closing. In the sphere of telecommunication services the only lags behind the Indicator 2012 Drop (-)/ Growth (+) following the results of 2012 Source Russian ICT market $69 billion* +1,2% IDC Russian IT market $33 billion* +3.9% IDC 700 billion rubles +7% Ministry of Telecom and Mass Communications Income from communication services 1.53 trillion rubles +5.2% Rosstat Mobile communication market 679.2 billion rubles +5.6% Rosstat Western World exist for the share of smart phones in the total number of mobile communication devices, and also for the share of mobile Internet users in the total number of Internet users. Due to the size of the country and to the rapid growth in recent years, the Russian Internet sector became one of the largest in Europe and will probably become the largest soon. About a year ago, Russia took the first place by the number of Internet users in Europe (according to comScore) and by the number of imported PCs in the EMEA region (IDC). In Russia there are 3.6% of all Internet users in the world, but herein less than 2% of all globe population lives in the country. By the number of broadband Internet users our position is not much worse – 6th and 7th place in the world (according to J’son & Partners Consulting and to Broadband-Forum.org, respectively). By the average data downloading speed, which does not depend on country size, in 2011 Russia took 16th place among 224 countries of the world (according to Pando Networks). The Internet access rate in the Russian regions grew 4.4 times over the past year (according to a number of tariff plans). some other European countries. In the previ- * preliminary data ous similar rating it took 59th place only. It can be assumed that the increase in the Russian IT market in 2013 should be a little greater than in 2012. IDC predicts its increase on the average by 8% per year in the next five years. Various companies’ experts anticipate more important growth rates in the following segments: By Internet connectivity, Moscow and St. Petersburg already match the level of the cutting-edge countries (over 80% of house- 11. Structure of the Russian IT market (results of 2012) holds are covered by the Internet) while other regions will reach this level in several years. According to the Ipsos analytical company survey (which was conducted on demand of Reuters) – Russians are the world leaders among the VoIP technology users (36% of respondents used it at least once over the IT services 19% Software 14% PCs 24% Mobile phones 16% Telecommunication and network equipment 11% Other equipment 16% last three months). Following results of 2011, Russia moved up to a rather high 27th place among 193 countries in the UN rating by the level of eGovernment development, having overtaken Ireland, Italy, Greece, Lithuania, Poland and Source: IDC 21
  • 22.
    Chapter 1 /Russian IT Market in 2012 12. Major segments of the Russian IT market Indicator 2012 Drop (-)/Growth (+) following the results of 2012 Source Russian motor vehicle navigation market (systems, solutions, equipment, services) 15 billion rubles +25% NP GLONASS Russian mobile application market $160 million +256% J’son & Partners Consulting Smart phones 11.2 million pieces +29% IDC +256.7% Euroset Company +289.5% IDC +344% (+278%) ITResearch -17% ITResearch +16.7% (+20.5%) Euroset Company Mobile computers - 5% (in monetary terms) Euroset Company Smart phones +69% in pieces (+60% in monetary terms) Euroset Company +41.3% IDC + over 100% Euroset Company Tablet computers 3.89 million pieces ($1.77 billion) Netbooks Portable electronics 88.6 million devices (484.8 billion rubles) E-book devices Professional data panels $125.5 million (33.3 thousand units) +15% ITResearch Video conferencing $96 million +20% TrueConf Laptop computers 9.5 million units +13% IDC 9.37 million units Desktop computers ITResearch -7.5% ITResearch 4.16 million units Total revenue of the external DSS vendors 4.66 million units +1.7% Gartner $152 million +22.9% IDC +13% IDC Infrastructure software Printers, copiers, and multifunctional devices 4.2 million units ($1 billion) +0.1% (9.2% in monetary terms) IDC Monitors 5.07 million units ($870 million) -10% (-15.5%) ITResearch +9.2% IDC Servers IT services (system integration, consulting, etc.) $6.3 billion +8.4% IDC Software $3.4 billion +10%* IDC * preliminary data 22
  • 23.
    Chapter 1 /Russian IT Market in 2012 13. Use of Internet technologies in Russia in 2012 Indicator Time Absolute value Indicator change Runet mobile audience SeptemberOctober, 2012 35 million subscribers +51% Wireless Internet connectivity End of 2012 40 million active subscribers (65.5 million subscribers by number of SIM cards) Active mobile Internet connection subscriber base of smart phone users End of 2012 22.5 million subscribers +88% J'son & Partners Consulting Average mobile data transmission traffic per smart phone owner 2012 303 MB/month +150% J'son & Partners Consulting Internet audience scope End of 2012 61.3 million subscribers +15% comScore Broadband Internet access services End of 2012 +13.5-14% AC&M-Consulting Monthly Internet audience in Russia Autumn 2012 61.2 million people 18+ (about 47 million people daily) Penetration indicator WapStart and Openstat 83% (of all Internet users) +12% Source 52% smart phones, mobile applications, mobile the world market exceeded 50%. However, navigation equipment and navigation services. According to the Obshchestvennoye Mneniye Fund first three months of this year this indicator in Internet access, software, cloud technologies, J'son & Partners Consulting in Russia, the smart phone sales volume is The Russian software market grew by 10% growing faster. Therefore, it can be assumed in 2012 (the sales of information security solu- that this year this ratio for the world and for tions increased even more). In the next years, Russian markets will be identical. According the cumulative sales of software companies to the Euroset the sales of smart phones in will most likely grow at least by 10% per year. Russia in the first quarter of 2013 increased In particular J’son & Partners Consulting by 34%, and the sales of traditional mobile experts expect a rapid growth of the mobile phones reduced by 24% (in comparison with application market. By 2016, it will increase 8 the same period of the previous year). fold and will reach $1.3 billion. The ratio between smart phones and traditional mobile phones sold in Russia is The sales of smart phones will be promoted by the launch of 4G networks (LTE). In this sphere, still not in favor of smart phones. In the first Russia’s lag behind the economically devel- quarter of 2013 their share was 40%. For the oped countries is not really great. According to 23
  • 24.
    Chapter 1 /Russian IT Market in 2012 14. Russian market of cellular communication and of mobile phones Indicator Time Absolute value Share of sales of the LTE technology supporting subscriber devices By the results of 2012 0.6% Mobile video market By the results of 2012 $65 million By the results of 2012 By the results of 2012 Market of mobile phones (including smart phones) Source Source J'son & Partners Consulting WapStart and Openstat +160% J'son & Partners Consulting J'son & Partners Consulting 42 million units (199.1 billion rubles) +5.8% (+14.4%) Euroset Company J'son & Partners Consulting 40 million units (95 billion rubles) +5% (+18%) Svyaznoy company J'son & Partners Consulting +5% (1517%) MTS retail network comScore By the results of 2012 Change Mobile phone availability March, 2012 91% of population +13.514% Public Opinion Foundation AC&M-Consulting Netbook or laptop availability March, 2012 28% of population +12% Public Opinion Foundation According to the Obshchestvennoye Mneniye Fund Smart phone availability March, 2012 11% of population Public Opinion Foundation Tablet computer availability March, 2012 7% of population Public Opinion Foundation J’son & Partners Consulting, in 2012 the share lutions, equipment, and services in the trans- of sales of the subscriber devices that support port segment) was 15 billion rubles (about the LTE technology in Russia comparing with 0.5 billion US dollars) that is 25% more than the global sales was only 0.6%, but by 2015 it the year before. GLONASS predicts its qua- will increase up to 2%. druple increase – up to 60 billion rubles ($2 The volume of the Russian mobile video market in 2012 was $65 million (according to billion) in 2013. By IDC estimates, the Russian market of J’son & Partners Consulting). Expectedly, it will cloud services is growing approximately by reach the level of $344.8 million by 2015. 50% per year. J’son & Partners Consulting predicts that The ICT market share in Russia’s GDP did within the next three years, the sales of tablet- not change considerably and has remained at computes in Russia will grow 2.3 times and in the level of 4% in recent years. 2015 it will reach 5.8 million devices. Last year, the volume of the Russian navigation market (the sales of systems, so- 24
  • 25.
    Chapter 1 /Publications on High Technologies in Russia in Foreign Mass Media Publications on High Technologies in Russia in Foreign Mass Media W hen it does not come to By 2012-2013 such secrecy faded in political things, foreign importance. Usage of the «Made in Russia» journalists usually look slogan in marketing is not unambiguously de- with favor on Russia here sirable yet (especially in the leading Western and now and perceive it countries, i.e. in the markets on which Rus- as a country where globally competitive solu- sian software companies are mainly focused) tions and technologies may appear. However, but it is not as risky as it used to be a few only a few years ago the situation was abso- years ago. lutely different. The analysis of leading mass That drastic change of mood happened media publications was suggesting that the ar- two years ago. Then, the share of scientific ticle writers often thought of Russia as a huge and technical publications that provided territory with oil derricks, vodka making facto- relatively positive information about Russia ries, and missile pits. Even the availability of the exceeded the level of 50% and reached 66% frightening military industrial complex, which with a significant increase in the foreign mass seemed to testify the Russians’ capability to media interest towards the Russian hi-tech solve the most challenging technological tasks, economy sector. For all the previous years hardly influenced the extremely show-me at- (until 2011) there were approximately one and titude of ordinary people towards the «Made a half times more negative publications than in Russia» text on a shrink-wrapped software positive ones. Last year we made a tentative product. Because of this, Russian software prognosis that this turn was most likely natu- companies who wished to sell software to a ral and irreversible despite some decrease in wide audience of foreign consumers, avoided – the foreign press loyalty index (from 66% to by all means and whenever possible – drawing 59%). The results of mass media monitoring attention to the country where solutions were for the last 12 months showed that this con- originated. They often operated at a foreign clusion was correct: the number of publica- market on behalf of their local subsidiaries, tions that positively influenced the image of who were selling their alleged own product Russia considerably increased in comparison without reference to Russian developers. with the previous year. 25
  • 26.
    Chapter 1 /Publications on High Technologies in Russia in Foreign Mass Media 15. Character of publications in foreign mass media (analysis results for two periods: from April 1, 2011 to March 31, 2012 and from April 1, 2012 to March 31, 2013) Impact on Russia's image Out of all publications 01.04.201131.03.2012 01.04.201231.03.2013 Positive 57% 70% Negative 43% 30% The analysis was only performed based but this year we changed timeframes and on publications describing the hi-tech selected publications from April to March. In economy sector and, first of all, the soft- this regard, comparison with the last year’s ware development industry. The search was research results is not so absolutely correct. performed within a number of specialized Therefore, this year we have done job twice – editions and in the media resources which are we recalculated the number of articles within the most popular in the world and in separate two periods: from April 1, 2011 to March continents. And we were hunting for two key- 31, 2012 and from April 1, 2012 to March words only – Russia and Software. Messages 31, 2013. That is, 2011-2012 publications and reviews not directly related to the high were analyzed repeatedly but with different technologies were peeled apart. The list of search parameters. It is worthy of note that monitored mass media included the following the discrepancy between the received loyalty 25 resources: Asia Times, BВC, Business- indexes for closely resembling time periods is Week, CIO Magazine, CNET, Computerworld, insignificant – 2% only (57% instead of 59%). The Independent, eWeek (PC Week), Finan- The result of publication content analy- cial Times, Forbes, Global Services magazine, sis for the last two years testifies that the The Hindu, IT Europa, InfoWorld, Information- share of articles that positively influence Week, Linux Magazine, MacWorld, Network the image of Russia increased from 57% to World, The New York Times, PC World, 70%. Most likely, such significant increase is REUTERS, TechNewsWorld, The Washington explained by two main reasons. The first is Post, The Wall Street Journal, and ZDnet. connected to the recently observed fact that Due to a huge increase in the number of publications under consideration, we had our companies and officials finally began to provide information to foreign mass media to significantly reduce the search range. more actively. This credit is due to the Rus- Moreover, there was a time offset. Ear- sian export companies, government officials, lier, we selected publications from June to sub-governmental structures, and industry July of the next year (or from May to June), associations. The second main reason is a 16. Distribution of publications negatively influencing the image of Russia, by edition type From April, 2011 to March, 2012 From April, 2012 to March, 2013 For two years (from April, 2011 to March, 2013) Specialized publications Business and general political publications Specialized publications Business and general political publications Specialized publications Business and general political publications 49% 51% 60% 40% 54% 46% 26
  • 27.
    Chapter 1 /Publications on High Technologies in Russia in Foreign Mass Media decrease in the number of events connected 17. Rating of editions by number of publications for the period from April 1, 2012 to March 31, 2013 to technical failures, which negatively affect the country’s image. It is important to note that the total num- 1 ZDnet 25 increased by 8%. The growth did not turn out 2 eWeek (PC Week) 21 to be as great as a year before (then, it was 3 PC World 21 4 TechNewsWorld 19 5 InfoWorld 18 6 InformationWeek 18 7 Forbes 13 were far from participation in political games. 8 MacWorld 11 It was also the case for the mass media of 9 BusinessWeek 10 attitude in to Russia. Now this rule does not 10-11 Computerworld 8 work any longer. Moreover, when analyz- 10-11 Financial Times 8 ber of publications about high-tech Russia 93%) but considerable enough to be mentioned. A few years ago there was a consistent pattern: positive publications favorable for Russian software companies’ export appeared mainly in the specialized editions that countries that assumed, at least, a neutral ing publications over the past 12 months, it became clear that for the first time negative publications appeared more often in special- 18. Rating of editions by number of publications for the last two years (from April 1, 2011 to March 31, 2013) ized high-tech editions than in business and general political editions (60% versus 40%). Such ratio will hardly remain in the future. 1 ZDnet 44 Nevertheless, at present it is fair to say that 2 PC World 44 between specialized editions and business 3 eWeek (PC Week) 37 ones have been blurred out. The two mass 4 InfoWorld 37 indicators – by number of editions included 5 Forbes 36 in our analysis, by number of publications, 6 TechNewsWorld 26 by share of articles with a negative attitude 7 The Hindu 18 8 BBC 18 9 Financial Times 17 10-11 Computerworld 15 10-11 BusinessWeek 14 the distinctions that were earlier observed media types show approximate parity by all towards Russia. The deviations are accidental or temporary. All conclusions drawn above only concern those articles and reviews that refer high technologies. Publications on other subjects (for example, about political events) contain much more negative than positive that is and in the European markets. Some Russian certainly not favorable for promotion Russian companies also take the leading positions in software products and software development these markets irrespective of the content of services in foreign markets. However, it is not western mass media publications about Rus- worth overestimating the importance of nega- sia. Kaspersky Lab manages to dominate not tive articles. For example, China is presented only in the US corporate’ but even in the retail in western mass media as an even more non- market. In Germany, the Russian antivirus democratic state but it does not disturb suc- developer steadily heads the list, after having cessful promotion of Chinese goods in the US beaten the local G-Data to the second place. 27
  • 28.
    Chapter 1 /Publications on High Technologies in Russia in Foreign Mass Media 19. Top-10 most loyal editions for the last 12 months (01.04.2012-31.03.2013) Share of positive publications about Russia Total number of publications 1 BusinessWeek 100% 10 2 The Hindu 100% 6 4 REUTERS 100% 5 5 Financial Times 88% 8 6 Forbes 85% 13 7 MacWorld 82% 11 8 Asia Times 80% 5 9 Computerworld 75% 8 10 ZDnet 72% 25 * Only editions with at least 5 publications per year are included in the table 20. Top-4 most disloyal editions for the last 12 months (01.04.2012-31.03.2013) Share of negative publications about Russia Total number of publications 1 InformationWeek 56% 18 2 PC World 48% 21 3 InfoWorld 44% 18 4 TechNewsWorld 42% 19 * Only editions with no less than 5 publications per year are included in the table 21. Top-5 most disloyal editions for the last two years (from April 1, 2011 to March 31, 2013) Share of negative publications about Russia Total number of publications 1 InformationWeek 61% 28 2 InfoWorld 51% 37 3 Network World 50% 10 4 TechNewsWorld 50% 26 5 PC World 48% 44 * Only editions with no less than 8 publications for the last two years are included in the table. In Spring 2013 IDC awarded Kaspersky Lab with the title “leader” in the Endpoint Security Apparently, western consumers are pragmatic and mostly evaluate quality and price protection solutions for large business, fol- instead of an exporting country’s «democratic lowing results of the comparative analysis of character» and «friendliness» in the mass me- vendors in the West European market. dia coverage. In the USA, after the one more exacerbation of relations with China, attempts 28
  • 29.
    Chapter 1 /Publications on High Technologies in Russia in Foreign Mass Media 22. Top-10 most loyal editions for the last two years (from April 1, 2011 to March 31, 2013) Share of negative publications about Russia Total number of publications 1 The Hindu 89% 18 2 REUTERS 89% 9 3 MacWorld 85% 13 4 Forbes 83% 36 5 BusinessWeek 79% 14 6 Financial Times 76% 17 7 Computerworld 67% 15 8 eWeek (PC Week) 65% 37 9 ZDnet 61% 44 10 BBC 61% 18 * Only editions with no less than 8 publications for the last two years are included in the table. to launch Chinese goods boycott campaigns InformationWeek, PC World, and InfoWorld are periodically made but, as a rule, they were the most disloyal ones. It is remarkable turn out to be unsuccessful. Thus articles that editions that publish the most negative that show possibilities of creating quality hi- materials about technological Russia have a tech solutions in Russia are more important very small number of publications. Most likely, for promotion of the Russian products and it reflects the fact that their warped concep- services than negative publications about the tions are connected to a lack of information political situation. about Russia. More active work with such edi- At the end of 2012 Wired (US edition) put tions may considerably improve the situation Evgeny Kaspersky on the eighth place in the with their negative publications. Such work list of the most dangerous people in the world. can be carried out, for example, in lending the The resource explained its choice by partici- state support to the international marketing pation of Kaspersky Lab (Evgeny Kaspersky activity of Russian hi-tech companies. How- is the founder and the head of the company) ever, individual companies can also improve in neutralization of virus attacks against the the situation by working more closely with the Middle Eastern countries. It is unlikely that most disloyal editions. even such invective may negatively affect the The majority of publications about Rus- Kaspersky Lab positions in the US market. sian high-tech in foreign mass media were Moreover other US mass media did not sup- connected to the information security. At the port Wired. same time, the share of this subject contin- Editions whose content we have analyzed in this research considerably differ from each ues to increase in the last three years. Thus foreign readers may begin to think that other other by their attitude towards Russia. The IT directions are neglected in Russia – al- greatest attention to the Russian hi-tech though it is not true. However, similar distor- sector was paid by ZDnet, eWeek, and PC tion is natural. Firstly, it is explained by the fact World. Following results of the last 12 months that the mass media pay special attention to BusinessWeek, The Hindu, and REUTERS information security (to threats and revealed can be considered as the most loyal editions. vulnerabilities). Secondly, Russian companies 29
  • 30.
    Chapter 1 /Publications on High Technologies in Russia in Foreign Mass Media 23. Publications by subject area that are engaged in information security matters more actively communicate with foreign Share for the period from April 1, 2012 to March 31, 2013 Investment attraction, merges and takeovers, cooperation Growth (+)/reduction (-) of the number of publications 4% -44% mass media still consider Russia (along with China) to be the largest source of cyber threats (which reflects an artificially created enemy image rather than the real situation). However the share of publications about the Space 4% -65% Conditions for hi-tech business in Russia 2% -69% Activities of Russian developers and scientists 16% +21% Information security 70% +35% GLONASS 1% +50% Other journalists than others. Thirdly, the western Russian cyber threat significantly reduced over the last 12 months. From now foreign mass media are frightening their citizens with the Russian bugbear far less frequently. Dr. Web was most mentioned in the foreign mass media for the last 12 months. Most likely this company’s leadership is temporary. The leadership is connected to the fact that Dr. Web experts managed to identify vulnerabilities in the globally popular software, and 3% this fact raised the interest of the world mass 24. Russian companies most mentioned in foreign mass media publications for the period from April 1, 2012 to March 31, 2013 (the number of publications with reference) media to the company and to its experts. Almost all articles that mentioned Dr Web were published within 2-3 months. The second place of Kaspersky Lab (the largest Russian software product exporter) is 1 Dr. Web 52 2 Kaspersky Lab 35 was caused by several events – as well as 3 Yandex 12 journalists’ resort to its expert estimations. 4 Group-IB 6 5 Positive Technologies 4 surely look forward to new publications about 6 Parallels 4 it in the future. 7 ElcomSoft 3 8 i-Free 2 media interest towards this company. Other Internet companies are mentioned much more natural as the reference to the company This company was among the leaders in this rating in prior years as well, and we can The third place of Yandex is connected to their recent IPO that increased foreign mass 9 Pirate Pay 2 10 Yota 2 Odnoklassniki – just once each). Totally for- 11 Elbrus Technologies 2 eign journalists noted 20 Russian companies, 12 Luxoft 2 some of which are mainly oriented towards 13 VKontakte 2 30 less often (f.ex. Mail.Ru, X-Cart, OZON, and the Russian market.
  • 31.
  • 32.
    Chapter 2 /Volume and structure of Russian software export T his year, we verified our previ- development services export. As a quite ous estimations on the Russian representative sample (100-150 companies) software export and made some was used we could objectively assume that adjustments. The matter is that the results of measurements and calculations when we started our research were quite realistic. in 2004 there were no reliable data on the sales volumes of both software and software However, after 10 years of surveys such technique could lead to essential deviations development services (within Russia and because of the existing error. This error is for export). We selected groups of known not critical as the main research objective companies which represented different seg- is the identification of trends (in particular, ments of the industry (providing IT services, export growth acceleration or deceleration, selling proprietary software, offering services in general and by separate types) as well as for creating and managing R&D centers) and assessment of the total amount of Russian extrapolated data which was obtained by software export). There is a strong possibility the polling of these companies to the whole that the real value deviation was less than industry. The extrapolation was made for 10-15%. However, it is necessary to revise each segment depending on the assessment the calculation procedure periodically so that of share sizes which was prepared by known this deviation would not exceed the allow- experts from companies in each segment. able value. Further we verified the input against the Another important stimulus for adjusting previous year’s export volume multiplied by the last 10 years the pyramid of the software ceived based on respondents’ answers). In development industry was completely con- case of marginal differences (less than 10%) structed and by now it precisely reflects the we took the extrapolation result as this year’s 80:20 law (when 20% of the total number of official volume of software and software 32 the estimation technique was the fact that for the estimated value of export growth (re- market players produce 80% of sales volume).
  • 33.
    Chapter 2 /Volume and structure of Russian software export Considering these two factors, this year’s sia. It is supposed that about one and a half calculation of the total export volume was thousand Russian companies are software verified through comparing it to the direct ad- exporters (i.e. the companies that have at dition of the export volume data of all largest least 1% of their income from sales outside Russian software developers that sale their Russia, for example, in Belarus or Ukraine). services and products abroad. Performing In the RUSSOFT database there are about of such an addition is a nontrivial task as the 1400 companies that are mainly exporters. majority of the software export companies However, this database requires regular re- (especially software vendors and foreign cor- plenishment taking into account a big number porations’ R&D centers in Russia) historically of newly born startups for the last 2-3 years do not tend to disclose their financial data. A (over 100 apart from Internet companies). lot of companies even made a secret out of According to our assessment, at least their consolidated revenues, not to mention 2300 software companies actually operate in the income related to sales in foreign markets. Russia. Very probably there are considerably However, Russian software companies more such companies (by several hundreds) and foreign corporations’ software develop- in reality. In this case (as well as in other ment centers eventually disclose some data on cases when we did not have enough actual their sales volumes or on the number of staff information) the most conservative estimates (sometimes, under the nondisclosure condi- were used in our calculations. Therefore, any tion) that allows correcting the previous cal- overestimation of cumulative software export culations. For example, some of them provide which is following the results of our research information to Russian and foreign compilers is improbable. Most likely there is a small of software and hi-tech company ratings that underestimation. allows us to obtain source information, which is vital for validation of our calculations. If a company conceals its turnover, it can As a revision of the estimation procedure was done this year, we should remind the content of the basic concepts used in the be assessed based on the information on research: the number of the company’s employees. By • under the volume export we consider all this indicator and considering the company’s Russian software companies’ cumulative unique features (its specialization, state and income that is gained in foreign markets size of office premises, types of solutions and (including the markets of the near-abroad services, contracts signed and investments countries, even if many software develop- made) the company’s approximate consoli- ers do not consider sales in the CIS as dated revenues can be determined. On the official websites (including those in English), export); • Russian companies with the main develop- some companies place enough data to get ment centers situated in Russia which an idea of their turnover and export income, gain the major portion of added value as well as to estimate their dynamics within thanks to their own software develop- the year. Thus, we obtained information ment are considered as Russian software (additional or basic one) about 50-60 largest companies; Russian software exporters which provided about 80% of export. Small developers’ export was calculated • final products of some companies can also be hardware (terminals, simulators, special recorders, etc.) but their basis by extrapolation according to available data functionality is being assured up by their from the respondent companies (there were own software. more than 100 small companies in the total Collection of information on the turnover sample) taking into account their share in the and the export volume of 60 leading software total number of such companies in Rus- companies was made by the results of 2012, 33
  • 34.
    Chapter 2 /Volume and structure of Russian software export most likely at the level of 2012. According to 25. Software export volume in 2002–2014, $ billion 2002 345 2003 2004 2005 2006 forecasts, the share of software products and 2007 0,53 0,74 0,95 1,41 2,15 +55% +39% +28% +49% +52% of foreign corporations’ development centers’ services will be still growing, while the export of licensed software will grow the fastest. In the current conditions the return to the growth rates of 40–50%, which were observed earlier at the low initial base, is improbable. Nevertheless, the industry still 2008 2009 2010 2011 2012 2013* 2014* has a potential for growth in the next several 2,6 2,75 3,3 4,0 4,6 5,4 6,2 small acceleration up to 30% in some years) +21% +5% +20% +22% +15% +16% +16% years at the level of 20–25% (with a possible * forecast and comparison with the previous research results – according to the information of 2011, which was calculated based on the data of 2012 and the index of export volume growth in 2012. The revision of the calculation procedure did not lead to any essential correction of the indicators of aggregate software and software development services export. It became clear that in 2011 software development services export was slightly overestimated. It was not $2 billion but $1.9 billion. The corresponding indicators for software products were revised upwards – from $1.6 billion to $1.7 billion. The volume of exported services of foreign corporations’ R&D centers seems to be the same or a little bit higher. Cumulatively there was an increase in the total amount of Russian software export by $30-$50 million that is comparable with the error of measurement. Following the results of 2012, Russian software sales reached $4.6 billion that is nearly 15% more than the year before. The level of $5 billion was not exceeded, while according to the last year’s forecasts the export index would have expected to reach $5.1 billion with 26% growth. The calculations were performed on the basis of respondent companies’ expectations at the beginning of 2012, but the world market recession affected implementation of the export income growth forecasts. The growth rate of the software development services export in 2013-2014 remains 34 in case the world economy will recover. Thus, an increase may be predicted by all export segments: software products, software development services and R&D services of foreign companies’ development centers. However, it should be noted that the current achievements were gained without significant state support. This support came into being in recent years (first of all, in form of State grants to startups and of financing to prospective R&D). It may seriously affect the export growth rates if the support to the international marketing of software companies is added. Another important reserve of the industry’s export growth is the state support in the form of elimination of administrative barriers, first, in the customs’ and currency regulation, as well as in financial accounting. The effect of this support shall not be only considered from the point of view of tax payment receipt and employment growth. The increase in the software export allows to diversify the Russian economy and to reduce its dependence on fluctuations of the world prices for raw materials. Software exporters gain the competences and knowledge abroad that will be used by them to work in the Russian market. Upgrade of outdated sectors of traditional economy in Russia is impossible without Information Technology. It is also necessary to consider that all modern hi-tech economy sectors depend on software. More high quality developers with experience of successful global competition are in Russia, the higher are chances to create globally
  • 35.
    Chapter 2 /Volume and structure of Russian software export 26. Software export distribution according to export revenue sources 55 51 50 50,5 48 45,5 41 40 43,5 40 37 30 30 20 15 12 10 11 2009 2010 11 9,5 0 2008 % Software development services provided by Development Centers of foreign companies, universities, and research institutes competitive solutions in any area of innovative economy. 2011 % Sale of software products and ready-to-use solutions 2012 % Software development services There is an obvious effect gained as a result of granting social tax incentives to In the previous years we witnessed a software companies (under the Federal law rule – more companies were focused on for- No. 212 FZ). Companies that take advantage eign markets, the higher the turnover growth of this incentive have increased their turnover indicators were. This year the indicators of by 26% and their export volume – by 16%. companies with different export share in their For companies that did not use the incentive, consolidated revenues equalized. The turn- the corresponding indicators were 10.5% and over of companies mainly oriented towards 7% (i.e., the growth rates were approximately the Russian market increased slightly more. twice lower). An opportunity to carry out sales in various countries ensures stable company It should be noted that the export companies’ turnover growth was 21.2% with development during economic crises. When an increase in their export revenue by 15%. stagnation of Russian economy is overcome, Thus, according to IDC in 2012 the Russian an increase in sales in the fast-growing software market grew only by 10%. It means domestic software market may be even more that either the market growth was more considerable than an increase in export. than 10% (that is quite probable) or Russian companies were increasing their share in the 27. Income growth of companies with different export shares Export share Less than 10% Less than 50% Over 50% Over 75% Income Growth in 2011 11% 17% 34% 36% Income Growth in 2012 28.5% 22.1% 20.6% 24.5% 35
  • 36.
    Chapter 2 /Volume and structure of Russian software export 28. Basic figures characterizing the Russian software industry Cumulative turnover of Russian software companies (the share in the Russian GDP) at least $9.5 billion. Software export $4.61 billion Total size of Russian software companies' staff at least 120 thousand people Staff size of Russian companies' software development centers in foreign countries 20 thousand people Total number of software developers at least 400 thousand people Size of the Russian software market about $5 billion. Number of Russian software companies at least 2,300 Number of companies operating for export about 1,500 domestic market at the expense of foreign Russian export, that of chemical industry – competitors. Besides, the difference between 5.6%, that of machinery and equipment is the IDC and RUSSOFT estimations may be 3.6%, that of aircraft – 0.8%, the share of caused by the difference of techniques they cars and trucks is 0.3%, that of arms – 2.9%. apply. If IDC only considers software sales The next and quite achievable target for the (possibly, license sales) we consider the cu- Russian software industry can be the volume mulative income of software companies. The of arms export which reached $15.2 billion by difference is essential. It is quite possible that the results of 2012. However, last year there some mismatch of indicators is explained by was no essential reduction of the gap to this the combination of all above factors. export segment as the growth of armament Following the results of 2012, the share of Russian software foreign sales is 0.88% of all Russian export (a year ago, there was 0.8%) which increased by 1.2% and reached export and software export was approximately the same (by 12% and 15% respectively). It is important to note that when the software export volume is determined we do $524.7 billion. The share of Russian software not include here the income of the Internet is not great yet, but this indicator already companies, the commercial success of which comes into view of the Russian government. is mainly assured by software developers. Most likely, this share will be growing in years Earlier, they were mostly oriented towards the to come. In Moscow and St. Petersburg, the Russian market and – on a second priority software export share in the volume of region- basis – towards the former Soviet Union mar- al export is higher than the average Russia- ket. However, for the last 2 years (particularly wide value – about 2% and 5%, respectively. after the successful IPO) Yandex and Mail.Ru Here it is necessary to keep in mind that the Group began their expansion in the foreign exporters of petrol and gas, of wood and of markets. These two companies are the largest other natural resources are often registered in Internet companies in Russia, but there is a the Russian capitals while resource extrac- great number of others that are also oriented tion and processing is generally conducted in towards the foreign audience. If, following the other regions. Now, the software industry is quite impor- results of 2012, the cumulative turnover of Yandex and of Mail.Ru Group is nearly $1.6 tant for the Russian economy. For compari- 36 billion (by 40-50% more than a year before), son: the share of foodstuff is 3.1% of the total the size of the entire Russian Internet econo-
  • 37.
    Chapter 2 /Volume and structure of Russian software export my is $16 billion (according to the data of the speaking Internet users are citizens of other Russian Association for Electronic Communi- states. Based on the available data we can cations) with the annual growth of about 30%. assume, that the export volume of the Inter- In addition, we should take into consideration net companies that use their own software, that the boom of Internet companies’ startups exceeds $1 billion. began in Russia and many of these companies are initially oriented towards the global This year, we calculated not only the Russian market. Therefore, the export income from software export but also the entire turnover of Internet services will grow. the Russian software companies as well as It is not groundless to consider Internet companies as software ones, as their suc- the total number of their personnel. The cumulative turnover reached at least cessful promotion in the global market is $9.5 billion (it is about 0.45% of the nominal firmly connected to their own new software GDP of Russia). If we subtract from this vol- solutions. Therefore, their export income ume the export income ($4.6 billion) and the shall be considered as another segment of IT Russian market income of foreign software export in the future. vendors (such as Microsoft, SAP, Oracle, As these companies can be considered neither as standard software vendors nor as IBM and many others – with the total product volume of $3 billion or over a half of the software development service providers, their Russian market size), it does not mean that export revenue shall be accounted sepa- we will obtain the Russian software indus- rately. There are serious problems concerning try’s sales volume. determination of this value. First of all, it is A considerable data mismatch is difficult to identify the export revenue in the explained by the fact that the cumulative cumulative income if an Internet company revenue of the software companies (Russian mainly earns from the advertizing. Such and foreign ones) from sales in Russia – advertizing may be oriented towards both from one side – and the Russian software the Russian audience and the audience of market value determined by the analysts of Internet users in the near- and far-abroad IDC and of other similar companies – from countries. Besides, it is incorrect to sum up the other side – are not the same. As a rule, the revenues (such as the export ones) from analysts generally consider sales of licenses. advertizing and e-commerce. It is more cor- However, the software companies’ income rect to identify it as an online store income may be gained not only due to sales of not an entire turnover but only the margin licenses but also due to sales of hardware which is not as great for e-commerce as for that is produced on the basis of the com- offline commerce. It is essential to decide panies’ own software and of their software whether we can consider the revenues that development services. were gained by Mail.Ru Group from purchase Besides, Russian companies’ sales and sale of foreign hi-tech companies’ shares predominantly include – in addition to sales as the export revenue. Last year, according to of their own software – sales of licenses of the experts, these revenues were on the level foreign vendors that provide platforms for of hundreds of millions of dollars. development of the Russian companies’ There are a lot of methodical difficulties software. However, the value of this double but some estimates still can be done if more count is not so great in comparison with the complete information about Internet com- software companies’ cumulative turnover panies is available. For example, the export (most likely it does not exceed $200-300 share can be calculated taking into account million). The price of using the platform the proportion of the Russian and foreign makes one third – one fifth of the cost of the audience. Presently, about a half of Russian- system that is delivered to end users. 37
  • 38.
    Chapter 2 /Volume and structure of Russian software export According to our calculation, the number of more than 400 thousand software developers personnel of all Russian software companies work in Russia. It corresponds to the Microsoft is at least 120 thousand employees including data, according to which there were about about 20 thousand people that work in the 350 thousand software developers in Russia in development centers of Russian companies 2010. For the last 3 years, their number could abroad. To add, that according to the AN- increase at least by 15-20 thousand people CHOR High Technologies recruiting agency, per year. It is interesting that according to Mi- only about a quarter of Russian software de- crosoft, at least 850 thousand of the Russians velopers are employed in software companies. have programming skills. Other developers work in various economy Figures characterizing the Russian sectors (in Internet companies, in system integrators, in banks, in the public sector and adjusted, but they are quite accurate to in enterprises of all economy sectors). Totally, 38 software industry most likely need to be provide a general coverage.
  • 39.
    Chapter 2 /Software development services export Software development services export I f in 2010-2011 software development ser- the turnover in 2011 that contributed an ad- vices export was quickly growing in order to ditional hundred million dollars into the service Export volume: $2100 million. satisfy deferred demand for services during industry’s total export volume. Last year, Growth: about 10%. the crisis (the growth by 14% in 2010, and the company’s foreign revenue growth rate then by 22% in 2011, according to adjust- remained at the previous year’s level. At the ed estimations)the growth rates were reduced beginning of 2012, EPAM Systems capitaliza- approximately to 10%.The main reason is ob- tion during IPO at NYSE was $490 million. In vious – staff shortage and the growth of labor August 2013, EPAM Systems was already cost connected with it as service companies evaluated at $1.22 billion. are especially dependent on these problems In June 2013, Luxoft held a successful in comparison with software vendors. Com- IPO at the New York stock exchange. For a panies that could recruit employees in other long time, Luxoft and EPAM Systems have countries grew quicker. These are large com- been at the top of the ratings of leading Cen- panies with development centers not only in tral and Eastern European service companies. various Russian cities but also abroad. More the company size is, the higher the During the last years Luxoft’s growth rates exceeded 20% that alongside with its top export growth rate is. The largest custom international ratings was quite sufficient for software developers have the growth rate at initial capitalization up to $555 million (that is the level of 20-30%. Individual companies (for even greater than the EPAM Systems capital- example, ICL KME CS from Kazan) managed ization during its IPO in 2012). to increase their export by 50% but they still By the time of IPO holding, Luxoft already gain over a half of income from sales in the had the extended geography of its develop- domestic market, and only in the recent years ment resources worldwide with the main they began to operate in foreign markets development centers in Ukraine (3,000 em- much more actively. ployees), in Russia (1,000 people in Moscow The success of EPAM Systems should be and Omsk) as well as in Bulgaria, Romania, particularly noted. The company, following Vietnam, and even in the UK (18 centers in steps of Mail.Ru and Yandex, successfully worldwide). held the initial public offering at the New-York stock exchange. EPAM Systems’ preparation Almost all largest service companies were for the IPO forced the company to increase formed before Y2000 and their number 39
  • 40.
    Chapter 2 /Software development services export 29. Structure of service companies’ export in 2008-2012 Development and support of software solutions and products Custom software development IT outsourcing Other 2008 9% 75.5% 4.5% 6% 2009 11% 72% 12% 3% 2010 30% 49% 15% 5% 2011 29% 64% 5% 2,00% 2012 26% 63% 10% 1% almost did not change during the last decade. banking sectors. The entry into TechnoServ Among new market players that recently Group allowed Reksoft to get access to Rus- came into the world elite (in the Global sian projects of national scale that gives the Services and IAOP ratings) we can mention company a chance to use its experience and few players: Artezio from Moscow which the financial leverage in Russia for participa- showed persistently high growth rates over tion in challenging foreign tenders. A serious the years, specializing mainly in such vertical candidate for coming into the rating of the market segments as telecommunications and world’s leading outsourcing companies is the health care; and First Line Software from St. ICL-KME CS from Kazan, which essentially Petersburg with its president Nikolay Puntikov surged in terms of promotion of its services in who should be noted separately as for the the market and raised its staff size up to 1200 last 7 years he consistently led three compa- people for the last 3 years. DataArt and Lanit- nies to thetop-100 world’s leading providers Tercom are close to entry into the rating of of IT services (first Star Software, then Exigen 100 world’s leading outsourcing companies. Services and now – First Line Software). We Earlier, they were included in various world should also mention Auriga, which regularly ratings and successfully developed their appears in the global rating of the leading ser- business (software development services for vice companies for about 10 years. In 2011 banks and for science-driven developments, Auriga was recognized as the world best en- respectively). gineering company in the field of IT (according to the Data Monitor) having outstripped The foreign sales of relatively small and the smallest service companies (with the such giants as IBM, Dell, HP, HCL, Wipro and turnover less than $4 million) did not grow at Siemens. all in 2012 (their export decreased by 0.4%). As was noted above, MERA from Nizhny Several years ago large service companies Novgorod did not come into the 2012 IOAP mainly grew due to involvement of employees rating for tactical reasons. It is one of the from smaller ones. In the last 2-3 years it be- largest Russian service providers that still came noticeable that this source ran low, and place its labor forces (about 2,000 people) a staff growth is generally provided by univer- in its hometown only. In 2013, this company sity graduates and recruitment of employees expects to move from the “quickly developing” in their off-shore development centers. The category to the category of “leaders”. Reksoft recruitment was especially active in Belarus gained a foothold in the rating of 100 world’s and Ukraine where the cost is lower and the leading service companies; it is focused on state support of software companies is better development of large e-government projects than in Russia. and on providing export software development services to customers in telecom and in 40 As a rule new companies appeared as a result of a demerger of formerly well estab-
  • 41.
    Chapter 2 /Software development services export lished exporters. Judging by the fact that small enced and reliable provider of services that companies almost do not grow, we do not add value to the client’s business. expect any significant increase in the number of such companies in the next 5 years. According to the expectations of respon- This year, thanks to three new questions added in the survey, we managed to estimate dents, the growth rates of export in 2013- the popularity of various customer relations 2014 will remain at the last year’s level (by models and various types of contracts, as well 2-3 percentage points higher).However, it will be difficult to stay at this level as there are no prerequisites for a considerable increase in 30. Contract types used, % of respondent companies supply in the labor market. Payment on time consumed The service companies’ export structure almost did not change in comparison with 2011.After an increase in the share of R&D and software product development services 40% three years ago there was stabilization, and now the share of application development is fixed at the level of 63-64%. 54% Russian service companies have a strong lead in the listing of the IT outsourcing service providers in Eastern and Central Europe, and together with companies of Belarus and 6% Payment on fixed price Both types Ukraine they form a so-called IT outsourcing Russian-speaking cluster which is the largest cumulative provider of IT services (software development services mostly) in Europe. 31. Major customers, % of respondent companies 100 Service companies still have a potential for a further increase in the export revenue, despite 90 88 the current staff problems. In the both leading IT outsourcing world 80 ratings (Global Services and IAOP) Russian companies reinforced their standing in 2012 (names of eight Russian companies – Artezio, Auriga, DataArt, EPAM Systems, First Line Software, Luxoft, MERA and Reksoft – were mentioned in different ratings). As the listed ratings estimate service companies by a number of criteria(including clients’ 70 60 50 40 30 assessment of the quality of the delivered IT services) rather than by their absolute data of 36 29 20 turnover, we can safely state that the Russian IT outsourcing industry has gained a 10 significant world recognition both as a hi-tech resource for effective development of state-ofthe-art technical solutions and as an experi- 1 0 System integrator End customer Software developer Others 41
  • 42.
    Chapter 2 /Software development services export as to determine the major customers that are The popularity of certain business models and offered the respondent companies’ services. contract types is approximately identical for All these three questions were only meant large and small companies. End users are the for service enterprises. As a result it became major customers of Russian service compa- clear that services for creation of remote nies (88% of respondents work with the end development centers are provided by 10% users of services). 36% of companies work of the respondent companies. Other 90% of on subcontracting, while 29% of respon- respondents offer their services to external dents are engaged in provision of services to customers under the contracts of both types system integrators. Important to notice that (Time&material and Fixed price) with some ad- service companies apply different business vantage of the fixed price contract model (54% 42 models, showing flexibility and providing their against 40% for the Time&material model). customers with the required services.
  • 43.
    Chapter 2 /Products and ready-to-use solutions Products and ready-to-use solutions T he growth of software and Development of separate software ven- of standard solution export dors also has certain cycles. For a few first continued in 2012 with 17% years (probably, decades) they can increase growth rate (still in 2010 it was export by 30-50% per year. In occasional 30%, then – 20%, and last year – Volume – $2 Billion. years the growth even may exceed 50%. 17%). Deceleration in growth is also typical for However, deceleration inevitably takes place software development services. However, it when product companies reach a certain size only revealed itself in 2012. Thus, the reasons and their market segment saturation. In the are absolutely different. Export growth – about 17%. last 2-3 years all leading Russian software Staff shortage is the main roadblock for vendors reached this size, while fast-growing service companies. Labor force shortage younger companies still have not achieved also affects software vendors, but to a lesser such large turnovers to compensate the extent because in many cases they can reduction of leaders’ growth rates. increase export by means of active marketing The state support of international market- and creation of an extended sales infrastruc- ing activity could significantly facilitate faster ture abroad. promotion of young companies’ development The main reason of the deceleration in at offshore markets, but this support is so software export growth is a cyclical pattern of insignificant that cannot exert noticeable influ- the startup creation and of their development ence on the volume of software product export. process in Russia. New software companies were most actively created in certain time There are all preconditions for an increase in software product export growth rate (or periods (for 3-4 years each period) during at least for retention at a rather high level economic crises or just after them. A number of 15-20%). All recent years the Russian of successful software vendors first appeared development of mobile applications (including during the Soviet economy collapse. The next computer games for mobile devices) is rapidly startup boom took place in the late 1990th growing. Companies that specialize in such and early 2000th (in 1998 there was a default development are still very young and, as a and economic crisis in Russia). The third rule, do not enjoy wide visibility. Nevertheless, wave is connected with the world crisis of their quantity is already so great that it makes 2008, which also heavily affected the Russian possible holding of large-scale conferences economy. on mobile applications and games in Russia. 43
  • 44.
    Chapter 2 /Products and ready-to-use solutions Such companies are practically not cov- as the one capable to pay back the huge ered by the surveys that are carried out by investments and to bring a notable economic the RUSSOFT Association. This may be due effect. However, the failures to launch rockets to the fact that many of them are startups with communication satellites that would which are being included in the Association’s have allowed the system’s full use in the near database of software companies with a delay future, created some uncertainty concerning of several years. Besides, the developers of the perspectives of the system commercial Internet computer games and applications use. Most likely, an increase in the volume of often do not position themselves as software services involving traffic and cargo tracking companies and, therefore, are not included in based on the GLONASS system will remain, the above base, as well. but it will be not as high as it could have been The sphere of mobile application devel- on condition of planned implementation of the opment is still under-explored. We can only global project on GLONASS satellite group in assume that export of such applications most the redundant operation mode. likely exceeds $200 million. According to the An additional gain of export may be J’son & Partners Consulting experts’ forecast, ensured by sufficiently large Russian software the Russian market of mobile applications companies that were previously oriented will reach $1.3 Billion in 2016 that is 8 times towards the Russian and CIS market. Many greater than the similar figure of 2012. As of them plan to work more actively in the the developers of such solutions are mostly developed and it the developing countries. oriented towards the global market we can Among them, there is a need to mention 1C assume that their export growth rates will with the turnover of about $1 billion (including remain approximately the same (the average income from software distribution and from figure is 60-70% per year) and probably will merchandising). Such turnover may allow for even speed up. Thus, mobile applications can investing not only in localization of existing ensure the annual gain of software export in solutions in other countries, but also in effec- the amount of at least $100-200 million. Now tive and massive marketing and sales of new their share is 5-10% of the entire product ex- products in various countries. Besides, 1C port but it can increase considerably depend- has extremely successful experience of sales ing on the global demand. organization involving partners (franchising) Certain hopes are pinned on development of the Global Navigation Satellite System – GLONASS – applications (it is worth mention- that can help it to move ahead successfully at foreign markets. There are a few mid-sized companies ing that the similar system in operation is only that hold promises of promotion in foreign available in the USA). Thanks to the National countries of their solutions successfully ap- system, Russian companies exporting termi- proved in the Russian market. This promotion nals and applications (for ensuring monitoring is, in particular, supported by their inclusion of moving targets on Earth and processing of in so-called Magic Quadrants of Gartner. The relevant information) have gained certain ad- following software vendors appeared in the vantage over foreign competitors. For example, Quadrants in 2012: Diasoft (“Core Banking NIS GLONASS plans to get about 20% of Software” Quadrant), PROGNOZ (“Business the Indian professional navigation equipment Intelligence”) and InfoWatch (“Data Loss market within 5 years; and in the long term, Prevention”). In 2012 IntelTech from Moscow the company intends to capture 20–30% of headed the Gartner’s “Cool Vendors list” of the global market in this segment with the esti- the most prospective companies. mated current capacity of $60–$90 Billion. Diasoft, which until recently mainly pro- In 2013 the GLONASS navigation satellite 44 duced solutions for Russian banks, has good system has for the first time been considered prospects thanks to the agreement for global
  • 45.
    Chapter 2 /Products and ready-to-use solutions cooperation with IBM (Global Alliance Attach- The Qiwi processing company began its ment) signed in 2011. This agreement provides operation in the USA with delivery of a pilot joint development and promotion in the global batch of 100 payment terminals with a pur- markets of the Russian company’s bank- pose to define its specific development plans ing solutions based on the Service Oriented in the US market. Architecture (SOA). As part of this agreement, In the autumn of 2011, Rosoboronexport IBM will provide its partner with technologi- and Russian Telecom Equipment (which are cal expertise, with support of Diasoft projects a part of the Russian Technologies State Cor- on optimization and introduction to banking poration) announced the beginning of their systems, will assist with implementation of cooperation in the field of international market marketing initiatives and worldwide promotion promotion of integrated automated security of the Diasoft products. The Russian company management systems. The most promising management expects that by 2015, about regions for the system promotion are thought 30% of the company’s income will be connect- to be Latin American countries (Argentina, ed with the operation at international markets. Brazil, Venezuela, Peru, Ecuador, etc.) and PROGNOZ is mainly engaged in developing analytical tools and decision making South-East Asia. In the spring of 2012 Naumen announced support systems, which derives the most part its entry into the call-center market of the of its income from sales in Russia. In Summer Asia-Pacific region. of 2012 they opened its new office in Zambia. If a few years ago Russian software The company plans to be engaged into devel- exporters were mainly oriented towards the opment of a statistical portal and applications markets of the western countries, in recent for the African Development Bank, to create years they began active promotion of their statistical portals for Mozambique, Rwanda, solutions in developing countries where the and Nigeria. PROGNOZ offices already oper- IT market is growing very quickly and in many ate in Beijing, Washington, Brussels, Kiev, cases is already sufficiently large. Activation Astana, Dubai, and Minsk. of operations in these countries ensures one ASCON, which dominates in the Russian market of CAD/CAM/CAPP/PDM systems tries to gain a foothold in the markets of more source of Russian software product export growth. The largest exporters also have opportuni- developed countries. At the end of 2011 it ties to strongly increase foreign sales by in- opened the first representation office outside troducing new solutions in the global market. the former Soviet Union. It was established in For example, Kaspersky Lab is creating its Munich and is oriented towards the German- own operating system, which is expected to speaking countries – Germany, Austria, and be much safer than the existing analogs. This Switzerland. The company’s management set project details are not revealed but it is quite a task to open the similar offices in all conti- probable that such system will be in demand nents in the next 10 years. in many markets. 45
  • 46.
    Chapter 2 /R&D and software development centers of foreign corporations (captive centers) R&D and software development centers of foreign corporations (captive centers) Volume – $500 million. Export volume growth – 12%. I n 2012 some more international companies broadcasting. Microsoft’s Russian develop- started implementing the earlier declared ment center staff size is expected to reach plans for creation of new R&D centers in 150 people by 2015. Russia. Generally, these centers appeared thanks to the Skolkovo Foundation and The R&D centers of EMC and Samsung have been operating for a long time in St. Pe- to the self-named innovation center being tersburg and Moscow respectively, but both built near Moscow. Residents of this center companies established additional centers at already receive certain tax incentives. A pos- Skolkovo in 2012. sibility of obtaining incentives (first of all, in T-Systems (Deutsche Telekom’ subsidiary) taxation ones) supported an increase in the while expanding the number of developers volume of foreign corporations’ investment in its St. Petersburg office, entered the labor into R&D services in the territory of the Rus- market of Voronezh, where they already sian Federation. In comparison to 2011 the began to recruit programmers and to cooper- amount of these services increased at least ate with Voronezh State University within the by 12% and reached $500 billion. staff training program. The T-Systems office in Such powerful corporations as IBM, Cisco Systems, Microsoft, and SAP were Voronezh was opened in the autumn of 2012. Chinese Huawei Technologies declared its among the active investors in implementa- plans to increase investments into R&D in the tion of R&D in the territory of Russia in the territory of the Russian Federation. Qualcomm, last 2 years. SAP plans to bring its research a US mobile microelectronics vendor, started division staff up to 250 people by 2015, and sourcing a team that can form the basis of its R&D investment volume – up to 45 million creation of its Russian development center euro. Microsoft plans to develop software in experts who have experience in application video, as well as software for multimedia data 46 last year. The company is interested in the Skolkovo for face and speech recognition in programming and digital signal processing.
  • 47.
    Chapter 2 /R&D and software development centers of foreign corporations (captive centers) Facebook is also considering a possibility to establish its R&D in Skolkovo. The primary and unsolved issue for inter- ing. Thus, customs duties are applied when importing equipment. The problem of hi-tech equipment import could be generally resolved national R&D centers is serious administrative by Russia’s accession to the IT Agreement barriers for import to Russia of hi-tech equip- within Russia’s accession to the World Trade ment for software development and test- Organization. Examples of foreign corporations which have their own R&D centers in Russia Alcatel-Lucent, Allied Testing, AVIcode, Cadence, Design Systems, Chrysler, Cisco Systems, Columbus IT, Dell, Deutsche Bank, Digia, EGAR Technology, EMC, EMS, Ericsson, Google, Hewlett-Packard, Huawei, IBM, Intel, InterSystems, Jensen Technologies, LG Softlab, Motorola, NEC, NetCracker, Nival Interactive, Microsoft, Nokia, Nokia Siemens, Quest Software, RDSoftware, Samsung Research Center, SAP, Scala CIS, SmartPhoneLabs, Oracle (Sun Microsystems), Tagrem Studio, Teleca, T-Systems. 47
  • 48.
    CHAPTER 3 MAJOR TRENDSAND TARGETS IN THE RUSSIAN SOFTWARE DEVELOPMENT INDUSTRY 48
  • 49.
    Chapter 3 /Major trends and targets in the Russian software development industry demanded completely different skills and Andrey Terekhov financial structures to custom development Lanit-Tercom, CEO or classic outsourcing. But now, it seems to me that a trend of new product development can be clearly observed in practically all companies. Perhaps somebody realized that, Many years ago now, I was talking about how while the creation of new products is a risky service companies should be performing business, it is a beneficial one, somebody research and using this as a basis to develop had a product that came about without any new software products. Product development effort – on the basis of other work, or maybe is also possible on the basis of the experience the widespread startup and innovation rage obtained from custom development, espe- has also served its purpose. An example at cially development for international clients. At Lanit-Tercom is computer stereo vision and that time, however, young colleagues, even the creation of a gesture recognition system in my team, refused to accept this idea, for the advertising business on the basis of saying that these were completely different this, which is already on sale in Europe. I kinds of business, that product development believe that this is the right direction. U pon considering respondents’ ket are Moscow and Ural region (83% and answers to questions about 88% correspondingly). St. Petersburg is well assessment of primary trends known for the primer aspiration of its compa- of the software development nies towards the Global market (65%). industry for a number of years, The increase of the companies’ share we should note a stable increase in the share which note “Growth of sales via Internet” as of companies that construe domestic mar- a priority tendency and main target – is quite ket growth and export growth as guidelines. natural and explicable. As in the previous years Similarly, since 2008 “More active work at the the greatest focus on growth of online sales is domestic market” and “Work for export/expan- peculiar to the Siberian companies (50%). sion of the marketing network abroad” have Creation of remote development centers been most often mentioned as the industry de- is considered to be the priority target by 60% velopment tendencies and the business priority of companies with turnover over $100 million, targets for a next year. The only exception was by 29% of companies with turnover from $20 a reduction of the corresponding indicators million to $100 million, and by 15% of compa- in 2009 that was connected with uncertainty nies with turnover from $0.5 million to $4 mil- caused by the world financial crisis. lion. There is no company with turnover less In 2012 a small decrease in the number of domestic market-oriented companies against some growth of export-oriented companies than $0.5 million that is aiming at creation of a remote development center. Among business targets that have been was observed, which is explained by the identified as additional (“other targets”), “rebound” (a decrease) of the Russian internal respondents indicated the following: improve- IT market in 2012 after a rapid growth in 2011 ment and development or creation of new which was caused by a deferred demand technologies (4 respondents) and also launch- during and after the crisis. ing of new projects, change of business line, Regions where companies intend the most to play actively at the domestic mar- distribution network establishment (each area was mentioned by one respondent). 49
  • 50.
    Chapter 3 /Major trends and targets in the Russian software development industry 32. Main targets of companies development* 2008 2009 2010 2011 2012 More active work at the domestic market 66% 68% 77% 73% 81% Growth of online sales 22% 31% 28% 29% 36% Work for export/expansion of the marketing network abroad - - 47% 52% 59% Certification of software development processes 8% 13% 12% 13% 10% Establishment of regional development centers 7% 12% 13% 15% 15% 8% 8% 5% Other * Respondents could choose more than one area 33. Priority areas for the companies’ development in 2013 More active work in the domestic market 55% Growth of online sales 9% Work for export/expansion of the marketing network abroad 31% Certification of software development processes 1% Establishment of regional development centers 2% Other 3% It is indicative that the majority of respon- Apart from the previously mentioned dents who noted “other” target consistently trends, following tendencies were mentioned mentioned creation of new products and as secondary ones: domination of internation- technologies year in and year out. We can al companies and growth of system integra- state with certainty that if such target (de- tion (once each tendency), as well as the velopment of products and technologies) is growth of mobile applications in the market defined as a separate identified target, the (twice). number of companies to mention this target will significantly grow. Among the major trends – Growth of local In the recent years, such phenomenon as purchase of foreign companies by large Russian software enterprises has become market kept the leadership, Export growth ceded the second place to the Growth of objectives. Remote development centers may sales via Internet, while Production of licensed be created on the basis of the purchased software was growing faster compared to the company (but by no means always). However, Providing of IT-servicers. 50 distinct. Such purchases pursue different acquisition of a new asset abroad is mostly
  • 51.
    Chapter 3 /Major trends and targets in the Russian software development industry 34. Modern trends in the Russian software development industry 2007 2008 2009 2010 2011 2012 Domestic market growth 71% 44% 49% 54% 51% 58% Export growth 56% 19% 35% 35% 23% 37% IT outsourcing growth (IT infrastructure support) 30% 34% 32% 28% 35% 32% Growth of direct sales via the Internet 31% 27% 39% 38% 39% 47% Market consolidation (mergers, takeovers, creation of holdings) 61% 21% 35% 30% 25% 31% Increase in product developments (Box/Licensed Software) 32% 21% 26% 19% 26% 27% Growth in development and adoption of software solutions (Services & Solutions) 50% 18% 35% 24% 37% 32% Increase in custom software development (Custom Software Development) 38% 14% 35% 29% 30% 31% Adoption of quality management systems 38% 10% 21% 12% 20% 24% Others - - 12% 4% 10% 4% aimed at getting access to new markets and section dealing with investments this aspect is to new customers. Later in this chapter, in the addressed in more detail. 51
  • 52.
    Chapter 3 /Quality management system certification Quality management system certification T he survey attributed particular reduction in the share of companies having place for studying the issue of valid certificates is most likely caused by the quality management system certi- accelerated growth of the number of software fication. It slightly decreased over vendors resulting in an increase in the share the past year. The share of companies that of product companies which do not have mentioned obtaining the Certificate of Com- special requirements for quality management pliance with the international standards (ISO, system certification. CMM, and CMMI) among their main objec- The share of the companies that plan to tives declined from 13% to 10%. The share obtain certificates in the next two years has of companies that possess at least one such considerably reduced. If there were 46% such certificate decreased from 36% to 26%. The companies among the respondents that did survey results for several years showed that not possess the certificates a year ago, this this indicator fluctuation within 5% can be year there are 27%. Considering this share explained by the error of estimate. However, of all respondent companies, the figure was proper allowance must be made for the fact reduced from 29% to 27%. that the share of service companies among It is obvious that companies (especially the respondents was considerably reduced small ones) are more realistically estimating in this year while software vendors need the their chances to go through expensive certifi- ISO, CMM or CMMI certificates to a lesser cation and the benefits of certificate issuance. extent than the enterprises that specialize in custom software development. One of explanations of the decrease in According to the interviewed experts, the issue of establishing a quality management system in the software development com- interest in certification is the fact that all large panies in Russia lost its urgency 5-7 years service companies had been certified in the ago. Practically all companies have their own years 2000+ (Russia takes the leading place quality management systems to a varying in Europe by the number of certificates on participate in the international tenders with est levels (4 and 5)). At the same time, the 52 degree. For those service companies, which compliance with the CMMI standard high- formal requirements for availability of CMMI
  • 53.
    Chapter 3 /Quality management system certification certificates, this problem is resolved by the 35. Share of companies certified to international standards regulatory certification. All product companies and small service providers content them- 2008 2009 2010 2011 2012 Not certified 65% 61% 69% 64% 74% ISO 31% 31% 29% 35% 24% CMM 0% 7% 3% 3% 1% CMMI 4% 7% 2% 6% 6% selves with ISO or implement their own quality management systems based on ISO and CMMI, but not requiring expensive procedure of certification and its confirmation. The state support in this field is insignificant, so most of the companies are not aware that in the competing countries States are strongly interested in the quality management system certification of domestic companies. Therefore, the respondent companies in Russia are either satisfied with this support (37%) or assess it with the failing grade (57%). The estimates of the state support for *- more than 100 % overall because some companies have been certified for compliance with more than one standard 36. Evaluation of the State support for international certification certification practically have not changed in comparison to the last year. In 2007 the first authorized (and later – certified) CMMI Expert appeared in Russia, and in 2009 – the first Russian-speaking Lead Appraiser (that still remains the only one). This fact only led to a short-term and small increase in the number of certified companies as the share of the Russian experts’ services cost in the total assessment and certification cost is not great enough to have a serious bearing on the certification cost. Low Satisfactory Good 2009 56% 40% 4% 2010 78% 21% 2% 2011 57% 41% 1% 2012 57% 39% 4% * more than 100 % overall because some companies have been certified for compliance with more than one standard 53
  • 54.
    Chapter 3 /Investment promotion Investment promotion T he share of companies that attracted investments in 2009- This year, as well as a year ago, about a quarter of respondents plan to attract invest- 2011 almost was not changing ments in the following 2 years. According to from year to year. Following the Russian Venture Company (RVC), more results of 2012 we need to and more investment funds appear in Rus- notice that for the first time after the corre- sia every year and the volume of available sponding questions appeared in the survey investment resources grows respectively. For the indicator has increased (from 9% to 12%). the last two years, the volume of bond funds Such increase looks natural considering the doubled annually and by the beginning of fact that last year the share of respondents 2013 it reached about $6.8 billion. The num- that planned to attract investments in 2012 ber of funds has exceeded 150. According and 2013 increased (from 16% to 24% and to RVC, considering the venture market as a from 18% to 24%, correspondingly). It is also whole, 70% of transactions of these funds fall natural that not all companies managed to ef- on the IT industry. The total amount of trans- fectuate their intents. However, as the number actions in 2012 was about $1 billion. of companies planning to attract investments For the last two years, investments were had grown, the number of those that man- most often attracted by relatively small com- aged to do that has also increased. panies with the turnover from $0.5 million to 37. Share of companies that attracted (or plan to attract) investments 30 26 24 20 10 18 25 12 9 9 2010 2011 0 54 2012 Last year % 16 % This year % Next year
  • 55.
    Chapter 3 /Investment promotion $4 million. Last year, 15% of such companies 9%, respectively). However companies that managed to get external financing. Among are equally specialized in both – development the software development companies with of custom software and in development of the turnover over $100 million there are even standard solutions – were most successful in more such respondents – 40% (but this attraction of investments in 2012 (31%). category only included five companies, and Although some business owners com- significance of random factors with such plain that they cannot find financing for their quantity is great). Besides, a year before, projects or ideas, the majority of venture only one tenth of companies with turnover investment experts consider that in Russia over $20 million attracted investments (then, there is more money than high-quality proj- companies with turnover over $100 million ects. For example, according to the Russian were not selected in a separate group). Thus, Venture Company (RVC) the relation between the largest companies do not plan to attract the volume of available funds and the annual external financing in 2013-2014. As a rule, volume of investment in Russia is calculated they do need investments and the amounts as 7:1. However, experience of investment in question are interesting for serious venture fund operations has proven that the optimum and investment funds (tens of millions US ratio is 4(5):1. dollars). Most likely large companies either do The reason is that there are still many not want to declare publicly their activities for projects that are good from the standpoint attraction of investments considering this to of technology development but are poorly be a private matter or they expect to reach the initial public offering (IPO) by their own efforts. Venture funds begin their operations in “packed” from the viewpoint of business plan and marketing. It is understandable considering that the opportunity to attract investments with the wide range of startups appeared the Russian market mainly in Moscow and St. actually 2-3 years ago. The Russian market of Petersburg. Therefore, it is logical to assume venture investments has sprung up recently that most of companies that managed to (in many respects thanks to such State devel- attract investments are located in these cities. opment institutions as the Skolkovo Founda- This assumption is fair concerning Moscow tion and RVC) and it is natural that not all but (last year almost one fifth of respondents just a few first-time entrepreneurs know how from the capital had external financing). St. to attract these investments. Therewith, there Petersburg has shown the lowest result the are not enough those who can share their second year in a row – only 3% of companies successful experience. from this city attracted investments. There are The ability to prepare high-quality projects 12% of such companies in the regions which is changing but not as quickly as the volume have just started being interesting for inves- of venture investments is growing. According tors. At the same time St. Petersburg compa- to the MoneyTree (Venture Market Navigator nies plan to attract investments in 2013 and research carried out by the PwC Technology 2014 more often than others (32% and 30%, and Innovation Center and RVC) the total respectively). One could say they transfer IP amount of venture investments in the Russian to and find investments in other jurisdictions. Companies that are mainly oriented market in 2012 was $910.6 million, which was obtained as a result of 201 transac- to the Russian market manage to attract tions (taking into account transactions only investments more often than those that gain with undisclosed cost). The majority of the the most part of their income from export attracted venture investments still – like a year (13% and 10%, respectively). Besides the ago – fall on the IT sector. Companies from software vendors have a small advantage in this sector attracted $792.1 million in 2012 comparison to service companies (12% and which is twice more than in 2011. 55
  • 56.
    Chapter 3 /Investment promotion The double growth of venture investments RVC and PwC predict that in 2013 the has been reached even though the share of growth rates of venture investments will the software exporters that obtained invest- decrease. However, the market is still far from ments has only increased by one third. This saturation. So, an increase in the volume of in- implies a growth of the volume of invest- vestment by tens percent per year is still pos- ment per company. According to MoneyTree sible even if the double growth would not be Venture Market Navigator, the venture deal retained. Following the results of 2012, Russia average cost in the IT sector increased from has taken the fourth place in Europe by the $2.8 million in 2011 to $5.1 million in 2012. absolute volume of investments in technologi- At the same time, there showed up cal projects and the first place by growth rates. consequences of the fact that some first-time It will be possible to speak about some signs entrepreneurs who obtained investments 2-3 of saturation when Russia becomes the abso- years ago did not manage to fit the market. lute European leader by the volume of venture As a result, funds and organizers of various investments as other European countries are competitions with prize money adopted then considerably behind Russia by population. a more rigid approach to selection of prize contenders. The RVС and PwC research showed that According to a study produced by the RVC and All-Russian Public Opinion Research Center, there are about one thousand the wave of “emotional” startups and unfairly active business angels in Russia. However, overestimated investment expectations there is not enough information on their came to the end in 2012. Last year investors work. As a rule, they do not desire to provide began to employ a more careful approach publicly available information on transactions to the selection of portfolio projects giving made. In this regard RVC suggests continu- preference to those who could prove their ing systematic work directed at increasing the own success and perspectives not only by number of practicing business angels as well word of mouth but also with actual business as at increasing transparency of this venture key figures. It concerns both private and investment market segment. state funds. Following the MoneyTree Venture Market Over the past year, after the issuing of our previous report, one more Russian high- Navigator report, the year 2012 was also tech company came through the IPO. As we marked with the hyperactivity of venture already reported the EPAM Systems held the funds at later stages of company develop- IPO at the New York Exchange in the begin- ment. For example, the number of concluded ning of 2012 and attracted $72 million. After transactions at the seed stage in 2012 was some time of trading the price of company by 22% less (60) than in 2011 (77), while at shares grew several times that showed the “startup” stage almost double increase investment capacity of software development was registered in the number of transactions industry service segment. The EPAM Sys- (65 transactions in 2012 against 34 transac- tems achievements were especially significant tions in 2011). against a relative failure of the most expected Last year, there were 12 investors’ exits from projects to the total amount of $372 million (including transactions with undisclosed IPO of the year – that of Facebook. In June 2013 Luxoft successfully placed 4.1 million shares on the American financial cost). Besides, three large transactions were market. The flotation value was 12% of the concluded with the amount over $100 million total number of shares, and the company each. Occurrence of such transactions is an was valued at over $700 million. important market development factor demon- Now Qiwi which has created the self- strating that investors are ready for consider- 56 named payment system for settlement via e- able investments in attractive projects. wallets, plans to hold IPO at foreign exchang-
  • 57.
    Chapter 3 /Investment promotion es. Company publicly declared its intention to hold the IPO in March, 2013. Most likely, other large Russian compa- In October 2012, the OppenheimerFunds (American investment fund) became one of the largest Yandex shareholders after hav- nies also plan to hold IPO but they still have ing purchased 5% of the total number of its not made their final decision which could be shares. The market cost of this holding of reported publicly in the context of unstable shares is $390 million. world economic environment. 57
  • 58.
    Chapter 3 /Investments of Russian companies and funds in other countries Investments of Russian companies and funds in other countries W ith important increase in viewpoint of Russian economy integration the amount of venture into the world economy. Acquisition of large investment in Rus- shares in successful foreign companies is a sia, recent years also way to adopt managerial experience and to witnessed a growth of find opportunities for cooperation between investments of Russian citizens, of Russian these enterprises and Russian IT companies, companies and funds in the high-tech sector as well as to provide Russian companies with of foreign economies. We do not have precise entrance into new markets. In certain cases, information about the amount of investments Russians obtain ready-to-use technologies and the growth indicators due to lack of rel- that may be elaborated and used in their own evant researches. Nevertheless, such conclu- business in Russia. Besides, money earned sion can be drawn on a basis of transactions from purchase and sale of shares may return reported by mass media. to the Russian IT sector. Judging by a num- Russian investors can pursue different purposes when investing abroad. This may be acquisition of companies as resources for ber of successful transactions, this process is already well in progress. First, it should be mentioned that after the establishing their remote development cen- Facebook’s IPO their Russian shareholders ters. Besides, purchase of foreign enterprises (Mail.Ru Group, Alisher Usmanov, Yury Milner, provides software developers with access Mikhail Frolkin, and others) became owners to new significant clients in the markets of shares worth a total of several billion dol- concerned. Finally, shares are also acquired lars. Had they sold their shares, they would in order to make profit from their resale or have received several times more money than to get opportunities to exert influence upon they recently invested. For example, Mail. decision-making process as the company’s Ru Group acquired 2.4 % of the Facebook shareholder. shares for $200 million in 2009. After the IPO, Foreign investments allow particular the price of this shares exceeded $2 billion. individuals or companies to enjoy their profit. However, they are also important from the 58 Although the Facebook stock value then fell down, Mail.Ru Group remains in the green.
  • 59.
    Chapter 3 /Investments of Russian companies and funds in other countries At the end of 2012, one more invest- participation was made: the company pur- ment with participation of Yuri Milner was chased Empathy Lab, an American consult- announced. Together with Sergey Brin (the ing company specializing in development of founder of Google), his wife Anne Wojcicki digital strategies and UX design. and several investment funds they invested In the autumn of 2011, the DST Global $50 million in the 23andMe in the US which fund headed a new round of investments operates in the field of bioinformatics. It was into the Swedish developer of the Klarna declared that Milner is the leading investor at payment system where $155 million were in- this round of investments. vested. Yandex declared the beginning of the Russians show their interest in many new Challenges program for startup search other American high-tech companies. Mail.Ru around the world (Yandex is already one of Group, Alisher Usmanov’s DST Global fund, investors of the Face.com Israeli startup). In and Mikhail Frolkin own shares of Zynga, a the spring of 2012 Transas acquired Revue US vendor of online games. In the summer of Thommen Swiss, manufacturer of aircraft 2011 the DST Global fund acquired about 5% instruments. In the summer of 2012 a small of Twitter shares for $400 million. At the end Russian antivirus developer acquired a Hun- of 2011 Runa Capital venture fund became garian company, VirusBuster. In the autumn an investor of the BigTime Software produc- of 2011 a group of investors that includes ing software for clouds. Leonid Boguslavsky, one of the most the DST Global Russian investment fund declared its intention to buy out the shares of well-known Russian investors, launched a the Chinese Alibaba Group from its employ- venture fund priced at $100 million in the ees and shareholders to the total amount of USA. The new fund will invest into startups $1.6 billion (the transaction completion has in the software industry, in cloud computing – not been reported yet). and eventually – in e-commerce and Internet services. EPAM Systems expanded its presence In October 2012, InfoWatch (Natalya Kaspersky’s company) declared acquisition of a 16.3% stake in G Data, a German antivirus at the North American market in the spring programs developer that ranks No.2 at the of 2012, after having purchased for $17.4 antivirus market in Germany, yielding leader- million Thoughtcorp, a Canadian software de- ship to the Russian Kaspersky Lab. Acquisi- veloper that has customers in retail, telecom- tion of a stake in G Data is fully compliant munications, and finance. At the beginning of with InfoWatch’s plans to promote their own 2013, one more bargain with EPAM Systems corporate products in the European markets. 59
  • 60.
    Chapter 3 /The global software market and ways to increase sales for Russian suppliers The global software market and ways to increase sales for Russian suppliers T he world IT market is grow- purchased corporate software was $278 bil- ing by only several percent per lion and the cost of IT services – $881 billion. year. Thus, in the spring of 2013 According to the CompTIA International the IDC analysts reviewed their IT Association forecast, the growth of the forecasts concerning the world global IT industry will be 3% in 2013. Thus, IT-market growth from increase to decrease. the decisive contribution to this growth will According to their findings based on results be made by the USA, where the growth will of 2013, the total world investments into IT in reach 2.9%. 2014 will be $3.7 trillion and will increase not Nevertheless, according to the analysts by 5.5% but by 4.6% only (Gartner predicts the situation in the American market (which almost the same figures – $3.8 trillion and is important for the Russian software export- 3.8%, respectively). The review of the forecast is explained by ers) is jittery. In 2013, the USA is going to cut down the expenditures on information support budget cuts in the USA, by ongoing problems of governmental authorities by 0.7% (that will with debentures in Europe, and by a relatively be as much as $79 billion). This reduction low GDP growth ratio of China. According to is insignificant by Russian standards. Thus, the IDC analysts, the greatest gain of invest- the US market still remains the world’s No.1. ments into IT can be expected in the develop- However, considering its combination with the ing countries such as Brazil and India. They protectionist measures, such small reduction may become the powerhouse of the entire can mainly affect foreign companies that oper- global IT market in 2013. According to the Gartner analytics, a slight- ate at the American market. As the importance of the US market has considerably decreased ly bigger growth is expected in the Corporate in recent years (see Chapter 5), this already Software and IT Services segments than in the manifests itself. In any case, it affects Russian global IT market as a whole (6.4% and 5.2%, exporter companies which start redirecting respectively). In 2014, the growth rates are to other markets. Possibly, thing that matters predicted to be at the same level. Following 60 is not only the budget cutting on information the results of 2012, the worldwide volume of support of governmental authorities but a
  • 61.
    Chapter 3 /The global software market and ways to increase sales for Russian suppliers reduction of the growth rate of the entire US operation is beginning in 2013) creates new IT market (particularly, in its segments that promises for developers from Russia. are especially important for Russian software exporters) and protectionism. The Everest Group analysts also report Russian companies and programmers are good at developing and selling abroad mobile applications, and this segment is about alarming situation at the US market. In one of the backbone directions of the global their opinion, the economic problems of the IT industry development. According to the USA (as well as of Europe and of some other analysts, “cloud services”, social networks, key markets) caused a considerable reduction and systems for “large data” analysis belong of a number and of a total cost of contracts in to the same line. Mobile applications can be the global market of ITOBPO in the second developed and successfully sold abroad by and in the third quarters of 2012. According to even very small Russian companies as well Everest Group, 381 new outsourcing contracts as individuals. were concluded worldwide in Q3 that is 19% According to J’son & Partners Consulting, less than a year before. The total value of the volume of the global mobile applications these contracts fell down even more – from market reached $7.83 billion in 2012 and by $2.7 billion to $1.5 billion (by 44%) as the aver- 2016 it will reach $65.79 billion. age cost of transactions reduced. In Q2, the Last year the sales value of business ap- number of contracts decreased by 20%. Such plications for mobile devices reached $250 reduction is partly connected with some disap- million. According to the J’son & Partners pointment in outsourcing as well. According to Consulting analysts, the market of mobile the Deloitte research, some companies termi- business applications has good growth per- nated their outsourcing contracts and returned spectives in the next four years. If the share to insourcing in 2012. This trend is mostly con- of business applications in the total mobile nected with the deterioration in the business applications’ global market in monetary terms environment in the developed countries and was a little more than 3% in 2012, it will reach with a decrease in the IT experts’ pay grade 5.4% in 2016. level that made their services competitive as compared to IT outsourcing services to the Business Intelligence (BI – large data bulks analysis and interpretation) should be also third countries. Thus, Deloitte experts revealed noted as a dynamically developing segment. an “insignificant but developing” trend. In addition, an increase in the number of busi- Although the macroeconomic environment ness applications operating with unstructured in such large markets as the USA and Europe information and using semantic methods to is not the most favorable for strengthening find relevant data is expected. In these areas, IT service sales, in the number of IT market Russian developers either have already made segments there is a quite notable growth that significant progress or have potential to ap- can positively affect the Russian software prove themselves in the next years. export figures. It is particularly topical for the According to Gartner, e-business intel- global expenses on information security ser- ligence (BI) global market increased by 6.8% vices. They grow by more than 10% per year. and reached $12.3 billion. In the previous Russian companies are traditionally strong in years the growth was higher (for example, in this sphere and have a very good worldwide 2011 it was 17%) but this segment is growing reputation. faster than the global IT market as a whole. There is also a rapid growth of the global Besides, higher growth rates are noted in de- telematic services market where the Russian veloping countries where Russian companies navigation and traffic monitoring applications have good opportunities to increase sales are expected to take a rightful place. Avail- owing to higher loyalty to Russian solutions ability of GLONASS system (its commercial than in the Western markets. 61
  • 62.
    Chapter 3 /The global software market and ways to increase sales for Russian suppliers According to the Russian IT industry development strategy, which was produced jointly by Russian Association of Computer and Information Technology Companies – APKIT) and by McKinsey, Russian software export revenues are expected to reach $27 billion in 2020. In order to reach such level of export it is enough to increase it approximately by 20% per year. Such export growth rates have been already observed on the average for the last three years (before the crisis, the growth rates were 40%-50% per year). With a certain State support, the export growth may be even higher. 62 A growing trend toward an increase of development services. This gap will probably the project-based software development is remain in the next years, although there is favorable for Russian companies in compari- still a potential for an increase in sales of the son with the process outsourcing as Russian software development services’ sector. developers are stronger than others in hightech projects. No more than 2.5% of total production falls on the share of Russian software compa- An increase in developers’ labor cost nies in the global software market (including slightly slowed down in Russia in 2012. Nev- customized development services). However, ertheless, this growth was noticeable. Russian for many years this share has been increasing providers of software development services by approximately 0.1% per year irrespective lost the low labor cost advantage before the of the global market growth deceleration or world economic crisis in 2008. The exception acceleration. to this is the case when in addition to Russian companies West European and American Russia is far behind India (more than 10 times) by software export volumes in mone- service companies participate in the tender. At tary terms. However, the gap is gradually nar- the same time, the man-hour cost is often a rowing (10 years ago, the gap was 20 times). less important criterion for a customer when Russian developers should not look up to the selecting a project contractor. Customers pay Indian IT export volume figures. The differ- more and more attention to the developer ence in population and in living standards is skills (technical, communication and cultural). too great. At the same time, the Russian in- Nevertheless, the deficit of developers dustry is on firm ground in the most profitable and increase in labor cost led to the fact high-tech development segments, where it is that the growth of software export in Rus- worth increasing Russian developers’ compe- sia in 2012 was higher than that of software tences for enhancing their competitiveness.
  • 63.
    CHAPTER 4 GEOGRAPHIC REACH ANDMAIN VERTICAL MARKETS OF THE RUSSIAN SOFTWARE DEVELOPMENT INDUSTRY
  • 64.
    Chapter 4 /Main geographical markets Main geographical markets I n comparison with the last year’s survey decreased — from 79% to 24%. The Russian results, the average number of mentioned market has never had such low figure for the key markets per one company consider- entire research period. Possibly, this figure ably reduced (from 1.87 to 1.56). The was affected by the reduction of the market same applies to the markets in which growth rates in 2012, as well as by extending respondents are present with just single proj- ects (from 3.9 to 3.3). The decrease appears opportunities of access to foreign markets. The interest in the «USA and Canada» to be even more significant considering that market, which increased after the crisis, this year one more region — the Middle East – was replaced with a sharp de-emphasis for was added in the appropriate questionnaire. the respondents in 2011.Last year, 31% of It turned out that 10% of the respondent respondent companies were present at this companies already operate in this market that market (a year before, there were 45%), and adds 0.1 per one company when considering only 14% of respondents consider it as the all mentions together. key one (in 2011, there were 30%). The index Now, the respondents less often men- of American market importance for Russian tion almost all markets as the key ones. The software exporters turned out to be the low- exceptions are Russia, Ukraine, Belarus, and est for the last 10 years. the «Australia, Africa, South America» region. The vast majority of respondent companies (89%) still operate in the Russian The next year’s survey results may allow stating a decrease in Russian developers’ market. However, the share of the compa- 64 interest in the Russian and US markets more nies considering it as the key market sharply definitely as such sharp change of attitude
  • 65.
    Chapter 4 /Main geographical markets 38. Presence of Russian companies in the world markets* 2007 2008 2009 2010 2011 2012 Russia 55% 87% 89% 99% 93% 89% USA and Canada 55% 52% 38% 40% 45% 31% Ukraine 17% 35% 41% 57% 35% 34% Other countries of Western Europe 35% 30% 33% 35% 40% 25% Other countries of the former USSR 39% 26% 34% 51% 50% 36% Belarus 32% 23% 31% 45% 29% 31% Germany 25% 24% 28% 33% 34% 26% Scandinavia (with Finland) 28% 18% 18% 20% 27% 19% South East Asia 19% 14% 19% 19% 23% 15% Australia, Africa, South America 25% 7% 12% 19% 15% 15% Middle East - - - - - 10% * the markets which are key ones or the marketplaces where separate projects are implemented towards these markets in 2012 can be partly dents with the turnover more than $4 million explained by the considerable change of the operated at this market (a year ago there respondent structure in comparison with the were 70%). In the previous years the situation previous survey. here was different. A reduction of mentioning Ukraine and Belarus, «Other countries American market was generally taking place at of the former USSR», and Germany are the expense of small companies that had an mentioned as the key market more often insignificant total export. than a year ago. Software exporters not only focused on a smaller number of markets, but As in the previous years, St. Petersburg leads with the highest number of companies reoriented towards the near-shore countries that operate in the foreign markets (except and to Germany. Asia and the Middle East). Moscow is in the A few years ago, Russia and the USA were lead by the share of exporters that are mainly way ahead by the frequency of mentions as oriented towards the markets of the former the key markets. However, for the last years, USSR republics. the USA backslided from the second place to In the last three years, opening of sales the 6th-7th spot, and Russia shared the first and of local customer technical support place with the countries of the former USSR. offices was declared by several Russian com- According to respondents, the near-abroad panies: Group-IB in the USA, Softline in Peru, countries are considered to be the most ABBYY in Kazakhstan, Yandex in Switzerland prospective market for the next two years, and Belarus, Kaspersky Lab in the Republic although a small growth of interest is expected of South Africa. in regard to the Western Europe (except Ger- At the end of 2012, the InfoWatch re- many and the Nordic Countries), the USA, the ported that they were thinking of opening its South East Asia, the «Australia, Africa, South office in the United Arab Emirates or Saudi America» region, and the Middle East. Arabia.The share of this region in the compa- The change of attitude towards the «USA ny’s revenue is quickly growing. InfoWatch al- and Canada» market concerns both small and ready runs projects in Bahrain, Kuwait, Saudi large companies. In 2012, 36% of respon- Arabia, and other Middle Eastern countries. 65
  • 66.
    Chapter 4 /Main geographical markets 39. Key markets 2007 2008 2009 2010 2011 2012 Russia 42% 71% 72% 86% 79% 24% USA and Canada 43% 28% 26% 15% 30% 14% Other countries of Western Europe 12% 15% 10% 12% 17% 13% Ukraine 6% 13% 11% 10% 9% 22% Other countries of the former USSR 12% 7% 11% 6% 11% 24% Belarus 24% 9% 8% 12% 8% 20% Germany 11% 10% 12% 12% 14% 18% Scandinavia 13% 8% 6% 6% 8% 8% South East Asia 6% 6% 3% 3% 7% 6% Australia, Africa, South America 9% 3% 2% 1% 4% 3% Middle East - - - - - 3% subsidiary will help to promote the GLONASS The news connected with expansion of the Russian companies in the foreign markets for the last 2-3 years: navigation technologies in the Indian market. In April 2013, the i-Free and China Telecom, a Chinese mobile network operator represented by the Dazzle Interactive Network ABBYY acquired 100% of the Connective Technologies subsidiary, signed an agreement Language Services in order to extend its share on strategic cooperation in the field of mobile of localization and support in the US market. games. In June 2010, Playnatic Entertainment announced the agreement with Sina Data Coin, the first Russian-Iranian agreement in the IT sphere. In May 2011, Entensys, a Russian information security software developer, signed a Cooperation Agreement with ITXON, a Polish software distributor. In January 2011, Vitim has officially In April 2013, the integrated automated security management system developed by the RTEC was presented at LAAD-2013, the leading armament exhibition in Latin America. At the beginning of 2013 Mail.Ru Group launched the Spanish version of its mail service interface. According to the Internet World opened its office in Finland; this company will Stats, Spanish is one of the top-3 languages become the main European partner of the spoken by Internet users globally. Speech Technology Center in St. Petersburg In March 2013, Naumen from Yekaterin- and will be engaged in development of soft- burg reported that Magellan Solutions, a Philip- ware in sphere of speech record, processing pine outsourcing call center, began operations and analysis. NIS GLONASS has registered the NIS based on the company’s software. Naumen expects to start expansion in the region with GLONASS Pvt Ltd subsidiary in India, which automation of 100 workplaces of this center. will be engaged in the large projects requir- According to developers, the size of the Philip- ing system integration and in creating the larger than the similar Indian market and is consumer market. It is supposed that the 66 pine call-center service market is considerably distribution network for its solutions in the measured in billions of dollars.
  • 67.
    Chapter 4 /Vertical markets Vertical markets 40. Frequency of vertical market references in 2006-2012 (percentage of all respondents) 2006 2007 2008 2009 2010 2011 2012 Information Technology 89% 88% 69% 71% 74% 70% 74% Banking* 35% 36% 36% 28% 23% 36% 26% Telecom 34% 44% 33% 29% 26% 38% 31% Industries 31% 40% 31% 34% 27% 36% 38% Hospitality, Travel & Transportation 24% 29% 31% 26% 28% 37% 29% Government 28% 38% 25% 28% 21% 31% 24% Power supply, Gas & Oil 18% 27% 24% 19% 17% 22% 22% Healthcare & Pharmaceuticals 23% 29% 24% 18% 23% 29% 28% Retail & Distribution 35% 38% 24% 21% 26% 41% 29% Education 36% 32% 23% 24% 21% 28% 28% Science & Research - - - - 18% 28% 26% Gambling & Entertainment 20% 19% 11% 12% 9% 17% 15% Media - - - - 13% 20% 18% Sport & Travel - - - - 10% 20% 17% Insurance - - - - 13% 28% 15% Building & Real estate - - - - 12% 23% 17% Services - - - - 27% 40% 35% Finances - - - - 25% 30% 26% Energy - - - - 17% 22% 21% F or the previous 10 years, no As a whole, it can be concluded that Russian regular change in the importance export companies’ industry priorities have not of separate vertical markets was * before 2010 – Banking & Financial Services changed essentially for the decade. revealed. The majority of the figure fluctuations are random The only clearly revealed regularity connected with vertical markets is a sharp or temporary. In the results of 2012 survey reduction of their total frequency of mentions we can only note the upward trend of during the period of crisis. In 2009-2010, mentioning the “Information Technolo- software developers were forced to focus gies” segment that reflects the increasing their efforts on the areas in which they were concentration of Russian developers in the most competitive or which were least affected B2B segment for technological companies by the world crisis. all over the world. We can also note some decrease in importance of the financial and e-government sectors against a small Only 3% of respondents mentioned “Other” (not listed) vertical markets. ”International Organizations”, “Advertising”, “Housing growth of interest towards industrial pro- and Utilities” (twice), “Agriculture”, “Security duction automation. companies” were mentioned. 67
  • 68.
    Chapter 4 /Software development center geographic distribution Software development center geographic distribution 31% of DataArt also have their large development respon- center networks in Ukraine. dents (a Many Russian companies’ remote devel- year ago, opment centers also operate in Belarus and there in other CIS countries. However, Ukraine has were 35%) reported existence of one own re- a special place as it is the second largest mote software development center. The share post-Soviet state (after Russia) by its popula- of these companies varied within 25–40% tion. According to Luxoft, there are about 38 during the recent years.16% of respondents thousand qualified programmers in Ukraine. (there were 17% last year) reported two and Every year, the Ukrainian higher education more remote development centers while 7% institutions produce 18 thousand IT gradu- of companies (last year, there were 10%) ates who know English generally better than have at least three such centers. Russians. Most of Russian companies’ foreign The majority of the Ukrainian software de- development centers are located in Ukraine. velopment centers of Russian companies are It can be surely assumed that this country located in Kiev (this year, there are offices of is significantly ahead of other countries and 5% of respondent companies). There are 2-3 regions by the total number of the employ- times less development centers in Kharkov, ees working for Russian companies outside Dnepropetrovsk and Odessa. The following Russia. In Ukraine there have been created Ukrainian cities are also mentioned there: favorable conditions for software companies Sevastopol, Kherson, Lvov, Vinnytsa, Cher- (many experts consider that these conditions kassy and Anthracite (Lugansk region). are better than in Russia) and the labor cost is much lower there than in Russian capitals. Luxoft has more staff in its production In Belarus, the majority of software development centers are also located in the capital divisions in Ukraine than in Russia (about centers in Gomel, Vitebsk, Mogilev, Alek- In addition to Luxoft, EPAM Systems and 68 city of Minsk. There are also development 2600 employees of nearly 6000 worldwide). seyevka and Brest.
  • 69.
    41. Rating ofRussian cities (by number of companies’ head offices and remote development centers) 42. Rating of Russian cities (by the number of the company head offices, trade offices and remote development centers) 1 Moscow 46 1 Moscow 64 2 45 2 St. Petersburg 52 3 Novosibirsk St. Petersburg 10 3 Nizhny Novgorod 12 4 8 4 Novosibirsk 10 5 Kazan Nizhny Novgorod 6 5 Kazan 7 6-7 Omsk 5 6-8 Voronezh 6 6-7 Izhevsk 5 6-8 Yekaterinburg 6 8-10 Voronezh 4 6-8 Omsk 6 8-10 Yekaterinburg 4 9-12 Izhevsk 5 8-10 Taganrog 4 9-12 Krasnoyarsk 5 11-15 Krasnoyarsk 3 9-12 Rostov-on-Don 5 11-15 Rostov-on-Don 3 9-12 Ulyanovsk 5 11-15 Ulyanovsk 3 13-15 Kaliningrad 4 11-15 Perm 3 13-15 Perm 4 11-15 Kolomna 3 13-15 Taganrog 4 16-25 Kaliningrad 2 16-19 Barnaul 3 16-25 Barnaul 2 16-19 Belgorod 3 16-25 Belgorod 2 16-19 Kolomna 3 16-25 Zelenograd 2 16-19 Chelyabinsk 3 16-25 Oryol 2 20-33 Arkhangelsk 2 16-25 Penza 2 20-33 Dubna 2 16-25 Puschino 2 20-33 Zelenograd 2 16-25 Samara 2 20-33 Irkutsk 2 16-25 Cherepovets 2 20-33 Krasnodar 2 16-25 Tver 2 20-33 Obninsk 2 20-33 Oryol 2 20-33 Penza 2 20-33 Puschino 2 20-33 Samara 2 20-33 Saratov 2 20-33 Stavropol 2 20-33 Tyumen 2 20-33 Cherepovets 2 Remote development centers operate in 25 Russian cities. Most of them are located in St. Petersburg (8), Nizhny Novgorod (5), Moscow (4), Voronezh (3), Kazan (3), and Krasnoyarsk (3). Russian export companies are present (have their head offices, remote development centers or sales agencies) in 60 Russian cities 69
  • 70.
    Chapter 4 /Software development center geographic distribution 43. Geography of remote development centers (share of respondents who specified a country or a region) 2008 2009 2010 2011 2012 Planned to open a development center in 2012-2013 Plan to open a development center in 2013-2014 In Russia 19% 23% 18% 28% 24% 12% 4% In Belarus 4% 6% 6% 7% 8% 6% 3% In Ukraine 4% 6% 7% 7% 10% 2% 1% In other CIS countries 4% 1% 2% 3% 6% 2% 0% In Western European countries 4% 4% 4% 5% 5% 2% 1% In Central and Eastern European countries 3.5% 1% 4% 3% 1% 3% 1% In USA and Canada 3% 5% 4% 3% 3.5% 2% 1% In South East Asia 0.5% 3% 2% 5% 1% 2% 1% In Africa - - - 0% 0% 2% 0% In South America 0% 0% 2% 1% In the Middle East 0% 1% 1% 0% Gambling & Entertainment 20% 19% 11% 12% 9% 17% 15% Media - - - - 13% 20% 18% Sport & Travel - - - - 10% 20% 17% Insurance - - - - 13% 28% 15% Building & Real estate - - - - 12% 23% 17% Services - - - - 27% 40% 35% Finances - - - - 25% 30% 26% Energy - - - - 17% 22% 21% Among other CIS countries, Kazakhstan production sites but on expansion of already is an attractive place for creation of remote existing ones. Besides in Ukraine, Belarus, and development centers. The Baltic states (with other countries, a limitation of available human cities of Riga, Vilnius, Liepaja) are also men- resources is beginning to emerge. In any case, tioned. It is quite possible that in the next 2 only 12% of respondents plan to create new years several new production sites of Russian development centers in 2013-2014. software developers will appear in Kazakhstan. As a whole, the share of respondents who plan to expand its network of remote develop- Respondents have their remote production sites in 45 cities of Russia (last year, there were 46). The leading five cities, where the majority of ment centers or to create its first center, was ters are located, remained the same in compari- previous year. Probably, some companies son with the previous year. Kazan has gained a concentrated their efforts not on opening new 70 head-quarters and of remote development cen- considerably reduced in comparison with the foothold on the 5th place and – keeping up cur-
  • 71.
    Chapter 4 /Software development center geographic distribution 44. Share of export companies that have remote development centers in 2013 Somewhere In Russia Plan to open a development center in 2013-2014 Turnover less than $0.5 million 14% 5% 0% Turnover from $0.5 million to $4 million 23% 15% 12% Turnover from $4 million to $20 million 56% 50% 28% Turnover from $20 million to $100 million 64% 64% 9% Turnover higher than $100 million 100% 80% 20% rent pace – it pretends to catch up with Nizhny made in order to obtain new customers from Novgorod within two-three years ahead. the US financial sector. Development centers in Moscow and Earlier, in the spring of 2012 EPAM Sys- in economically developed countries with a tems expanded its presence in the market high programmers’ salary level are opened of North America, having acquired for $17.4 purposely either to access high competences million Thoughtcorp, a Canadian software or to support customers’ project by local en- developer with customers in retail, telecom- gineers. Western companies are often being munications, and finance. At the beginning of acquired for this purpose. 2013, one more bargain with EPAM Systems For example, in April 2013 Luxoft de- participation was concluded: they purchased clared the acquisition of Freedom OSS, a US Empathy Lab, an American consulting com- developer of corporate open source software pany specializing in development of digital using RedHat products. The acquisition was strategies and UX design. 71
  • 72.
    Chapter 4 /Geographic distribution of marketing and sales offices of Russian companies Geographic distribution of marketing and sales offices of Russian companies O ne third of respondents have State development institutes (first of all Rus- their sales offices abroad sian Venture Company – RVC), are unwilling or in other cities of Rus- to participate in the research; they create sia.12.5% of companies their offices abroad but try not to display have only one sales office, their Russian origin. 21% – at least two, and We should note a very small percent- 12.5% of respondents have at least three age of companies that have sales offices in sales offices. Belarus and Ukraine, although these markets According to the last year’s research forecasts, about 20% of respondents are mentioned as the most significant for respondents. Apparently, they are specified planned to open new sales offices. However, as important, first of all, from the viewpoint of the total quantity of companies that have developer resource availability. sales offices almost did not change. The There is a considerable increase in interest situation has remained stable for 5 years. It in the African market which was exotic for is generally explained by the fact that major the Russian companies for a long time.6% of service companies take part in the survey respondents plan to open their sales offices in a regular way. The leaders among them in the African countries in the next two years. established long ago, they create almost all Last year, the corresponding figure was equal new sales and support centers while small- to 2%.Some companies really demonstrated and medium-sized service companies are years, but such big growth (three times) may vendors who are promptly developing in the be caused by random factors (for example, last 3-5 years thanks to the efforts of the 72 their interest in the African market in recent developing far less rapidly. New software by change of the respondent structure).
  • 73.
    Chapter 4 /Geographic distribution of marketing and sales offices of Russian companies 45. Presence of sales offices (the share of the respondents who specified a country or a region) 2008 2009 2010 2011 2012 Plan to open at least one new commercial agency in 2012-2013 Plan to open at least one new agency in 2013-2014 In Russia 15% 27% 26% 19% 21% 8% 8% Abroad (in foreign countries) 17% 29% 26% 27% 26% (17%) - 20% (17%) In Belarus 0% 6% 10% 2% 6% 1% 1% In Ukraine 1% 11% 14% 3% 6% 2% 1% In other CIS countries 1% 8% 9% 6% 6% 3% 6% In Western European countries 11.5% 11% 11% 16% 5% 8% 6% In Central and Eastern European countries 2.5% 3% 2% 3% 2% 4% 6% In USA and Canada 12% 11% 9% 19% 15% 4% 5% In South East Asia 2% 3% 1% 6% 3% 3% 3% In Africa - - - 2% 0% 2% 6% In South America - - - 3% 2% 3% 1% In the Middle East - - - 3% 1% 4% 1% All countries and regions 28% 41% 39% 34% 33% 20% 25% Sport & Travel - - - - 10% 20% 17% Insurance - - - - 13% 28% 15% Building & Real estate - - - - 12% 23% 17% Services - - - - 27% 40% 35% Finances - - - - 25% 30% 26% Energy - - - - 17% 22% 21% Share of exporting companies with sales offices in other cities and countries Turnover less than $0.5 million 5% 18% 22% 5% 14% 15% 14% Turnover from $0.5 million to $4 million 30% 45% 27% 32% 28% 19% 24% Turnover from $4 million to $20 million 47% 48% 70% 57% 39% 24% 33% Turnover from $20 million to $100 million - - - - 73% - 36% Turnover higher than $100 million - - - - 80% - 20% 56% 75% 22% 31% Turnover higher than $20 million 73
  • 74.
  • 75.
    Chapter 5 /Human resources and labor market This market segment in Russia, accordIvan Orekhov ing to various sources, makes approximately ISS Art, LLC,Owner, CEO $500 million annually, around 300 000 people. To arrange work with freelancers effectively it is necessary to have universally available According to our experience, the main reason instruments providing system work quality why software developers leave is for freelance. and transparency. Such instruments have al- The main characteristic feature of freelancers ready been developed and several companies is that they do not care about their reputation are using them. and may stop working at any time for any rea- To solve the issue on a global scale, dras- son. This makes a bad impact on the overall tic measures of government support need to Russian developers’ reputation. Most freelanc- be taken. ers do not pay taxes, work at home and have I call all IT companies to unite and create nearly no organization expenses. No-one is regional and federal associations with the scared of being held liable for their illegal busi- purpose of mutually profitable partnership ness activities. and the protection of common interest. F ollowing the conclusions of this ing the fact that the survey covered almost all research we can assume that a largest service companies (while the staff of total of 120 thousand professional SMEs did not grow) the overall staff growth software developers work in the for all Russian companies was much lower – Russian software companies within 8-10% whereas about 2-3% university (including those who work in their dedicated graduates were engaged in the companies’ development centers in other countries). staff. According to the ANCHOR High Tech- It is necessary to explain that the num- nologies recruiting company, the number of ber of personnel in the software companies software developers in Russia increased by includes not only those employees who 9% in 2012 (by 11% in 2011) but their analysts are directly engaged in coding but also considered all kind of staff (not only working architects, team/project/quality manag- for software companies) excluding only staff in ers and others who are actually involved in the offshore development centers of Russian software development process. Linguists companies. are also subject of professional staff in some Thus, an additional engineers’ acces- software companies. Besides, software sion to Russian software companies in 2012 developers sometimes produce and sell reached 9.5-11.5 thousand people. University their own electronic equipment (hardware) graduates provided an addition equal to 2-3 that is based on their own software. Most thousand people. This data do not consider likely, those who are engaged in develop- the staff of startups that had been created ment and assembly of hardware can be also in the last 2-3 years and thus – were not in- considered as a part of the original staff of a cluded in the RUSSOFT database. This figure software company. is expected to be comparable to data on the The number of staff in the responding compa- fact that the number of new startups increased larger companies’ recruitment, considering the nies increased by 14% in 2012 and 4.6% of several times from 2010 to 2012 (see Chapter their staff was university graduates. Consider- 3, the Investment Attraction section). 75
  • 76.
    Chapter 5 /Human resources and labor market 46. Approximate distribution of software developers by the largest cities of Russia are employed in Russian software companies. Others work in the IT divisions of government institutions, banks, large industrial companies, Moscow 35% Internet companies, and so on. Thus, slightly St. Petersburg 15% less than 400 thousand software developers Yekaterinburg 5.2% Novosibirsk 5% on the domestic sales of licenses for develop- Nizhny Novgorod 2.5% ment tools, DBMS and other software used Kazan 2.4% in Russia reached 350 thousand people in Voronezh 1.2% 2010. Taking into account the recruitment are engaged in the IT-industry. According to Microsoft estimations (based by programmers), the number of developers that took place for 3 years, at least 400 thou47. Number of CVs in the Software Development section on the Superjob website (for the year) sand software developers are supposed to work in Russia in 2012. Taking into account the complexity of calculations and a great Moscow 18.5 thousand 31% Petersburg 8 thousand 13.3% Throughout Russia 60 thousand 100% degree of uncertainty, these two estimations of number of software developers which were received in absolutely different ways are in agreement with each other. According to the Microsoft estimations, Source: Superjob research center Russian companies’ offshore develop- about 20 thousand new professional software ment centers employ 18-20 thousand people. developers (generally, university graduates) Thus, in the territory of Russia there are at appeared in Russia every year before 2010. least 100 thousand software developers in The data published by the Russian govern- the software companies. The number of peo- ment are approximately the same. Unfortu- ple employed in the software industry (taking nately, government authorities hardly have into account secretaries, marketing and sales their own data from official statistics. The managers, and others) is much higher. available state statistics still does not meet requirements of the market economy, which In addition to universities, another main source is even more true for statistical information of Russian companies’ staff size grow this (including data on the employment of popula- the segment of offshore development centers, tion) that characterizes development of the which actively recruited developers in 2012. hi-tech economy sector. According to experts (largest employers and representatives of recruiting agencies), the In addition to software companies, banks are inflow of developers to Russia has no consid- also actively engaging software developers erable influence on the labor market demand who appear in the labor market. According and supply. The same applies to the person- to HeadHunter, banks were the most active nel outflow abroad, which still takes place but employers of IT engineers (not only program- is not as massive as it used to be about 10 mers) in 2012. years ago. According to surveys produced by Data on the total number of IT profession- recruiting agencies, there are a lot of people als working in Russia varies greatly depending desiring to work abroad – at least 25%. How- on the information source. Dmitry Medvedev, ever, the vast majority of these people do not Russian Prime Minister, reported in December leave Russia for various reasons. 2012 that 0.6% of working-age population According to the ANCHOR High Technologies, 26% of Russian software developers 76 (about 520 thousand people) was employed in the IT industry of Russia, while in economi-
  • 77.
    Chapter 5 /Human resources and labor market cally developed countries – a usual figure is Similar support measures are to be taken and 4-5%. Mark Shmulevich, Deputy Minister of being prepared on the regional level. Telecom and Mass Communications, consid- Unfortunately, the proposed program is ers that nearly 1 million people are engaged intended for staff retraining based on the exist- in the IT industry (the industry’s staff figures ing chairs of universities and does not foresee are higher because they include IT engineers involvement of capacities of training centers working for IT companies as well as those in that have been created by medium and large the IT divisions of enterprises in all economy Russian companies as well as foreign corpora- sectors, in government bodies and in the tions’ training centers in Russia. Experience social sphere). This data is quite realistic, but shows that in terms of professional develop- nevertheless, it requires regular verification, ment and retraining the efficiency of higher clarification and explanation in regards to the education institutions is lower than that of estimation methodology and meaning. companies’ training centers as the majority of According to the Association of Computer and Information Technology Companies (APKIT) three years ago at least 60 thousand university professors are not involved in specific development projects on a regular basis. Considering all aforesaid, it can be stated IT professionals graduated annually from uni- that the existing educational system is only versities, one third of whom started to work capable to partially reduce the deficit of IT for the IT industry while the demand for such engineers and, in particular, of software devel- professionals is 1.5 times higher. opers. It is especially fair taking into account The government has already been trying to observed until 2018. Besides, changes in the change the situation in the IT education. At education system will give effect at best in 2-3 the end of 2011, Vladimir Putin, then the years. the “demographic hole” in Russia which will be Prime Minister of Russia, approved the list of Another way of reducing staff deficit specialties in higher educational institutions may be seen in involvement of trained and and the list of scientist areas that correspond experienced professionals from abroad. to priority directions of the Russian economy Rather favorable conditions for mass recruit- modernization and technological develop- ment of foreign qualified personnel to Russia ment. The list included about 100 posi- have arisen during few recent years. Thus, in tions, approximately one third of which dealt search of staff our companies can be orient- with the ICT sphere. Since 2012, students ed not only towards the neighboring countries and scientists who have chosen prioritized but towards the far-abroad countries as well. directions will apply for presidential and for By the level of programmers’ salaries, Russia governmental grants which will be rather big is more attractive than many other countries. by Russian standards. Even in once-affluent countries of Western Besides, the Ministry of Education ap- Europe, business recruits fewer engineers proved the three-year retraining course or reduces the headcount due to the eco- program for technical staff where at least 15 nomic recession. The programmers’ salaries thousand people are supposed to be trained. in Southern Europe are already lower than This program will be implemented based on those in St. Petersburg and Moscow. It could the public and private partnership. Ministry of be assumed that West Europeans who are Education is ready to finance up to 50% of the used to have a certain level of comfort would employers’ expenses on engineer retraining. not want to go to Russia. However, it is not Up to $10 million are supposed to be annually the case any longer. Not only citizens of East allocated for these purposes in the Minis- European states but also those of Western try’s budget. This program provides profes- Europe willingly hold positions of top manag- sional training in Russia as well stages abroad. ers and supervisors in Russian companies. 77
  • 78.
    Chapter 5 /Human resources and labor market Nikolay Nikiforov, the Minister of Telecom in Russia, although the visas were requested and Mass Communications of the Russian a month before the planned trip). Participants Federation suggested in Autumn 2012 that of the Contest should have been persuaded Russian companies should engage profes- to come to Russia, having in view that in the sionals from abroad. He was supported by future some of them may want to come to the senior management of the largest Rus- work for Russian companies. Instead, the sian software companies. However, within six existing visa policy de facto hindered their months of that no decisions on simplification participation in the Contest in St. Petersburg. of the migration regulations were adopted at Russia needs to be involved in the global the government level, although the discussion staff competition but such visa and migra- is under way. tion policy will prevent from doing this. While the USA are making decision on the number Participants of the ACM International Pro- of employment visas provided to foreign IT gramming Collegiate Contest’ Final which professionals (100 thousand or 300 thou- was held at the beginning of July 2013 in St. sand), Russia is only beginning discussing on Petersburg, had difficulties when obtaining theoretical possibilities of recruiting staff from Russian visas (a number of foreign journalists abroad. invited by sponsors did not manage to arrive 78
  • 79.
    Chapter 5 /Employee recruitment and headcount reduction Employee recruitment and headcount reduction T he total staff of the respondent companies is not so big to affect the average companies increased by 14% staff turnover of all respondent companies. from the end of 2011 to the end Nevertheless, it can be assumed that the of 2012. This happened largely fight for manpower in regions became more thanks to the offshore devel- desperate. opment centers that have been opened or In the last several years, the labor market extended by the largest Russian companies of St. Petersburg was the most adverse abroad. 82% of staff size gain was provided (judging by the staff turnover and by the by the companies with the turnover over $20 share of companies that did not recruit any million (69% of staff size gain fall on the com- employees). This market keeps the same po- panies with the turnover over $100 million). sition in 2012 but it did not stand out against In 2012, 16% of companies employed other regions (except for Ural). nobody, almost as many as in 2011 (15%). In 2010 there were much more such companies – 28%, and before the crisis – 5-10%. The staff turnover rate practically did not St. Petersburg also lost its unambiguous leadership by the number of employed university graduates. Now this figure is approxi- change neither. It was 6% in 2011 and follow- mately identical for St. Petersburg, Siberia ing the results of 2012 it was about the same region and “Other cities”. It is much higher (6.1%).This figure remains at a rather low level than the Ural figure and twice lower than the in comparison to other countries that is one Moscow one. The respondent companies’ of competitive strengths of Russian software staff size increased by 4.6% thanks to engag- industry. ing recent students. The steadiness of these two figures The smallest companies (with the turnover means stabilization of the situation in the less than $0.5 million) considerably reduced Russian labor market. However, companies their activity in the labor market and recently with the head offices outside of Moscow and found themselves in the most difficult situa- St. Petersburg had considerably increased tion in comparison to other companies. The staff turnover rates. The total number of these non-competitive status of small companies is 79
  • 80.
    Chapter 5 /Employee recruitment and headcount reduction 48. Respondent companies’ activity in the labor market depending on their location Moscow St. Petersburg Siberia Ural Other towns Zero recruitment 29% 11% 13% 0% 12% Staff turnover indicator 4.4% 9.7% 11.9% 6.4% 9.3% 49. Share of the companies that did not recruit new employees in 2008-2012, depending on the company turnover Over $100 million From $20 million to $100 million Over $20 million From $4 million to $20 million from $0.5 million to $4 million Less than $0.5 million 2008 - - 0% 0% 10% 14% 2009 - - 0% 14% 18% 46% 2010 - - 18% 13% 26% 42% 2011 - - 0% 5% 19% 45% 2012 0% 9% - 11% 8% 59% 50. Annual figure of the employee turnover, depending on company size Over $100 million From $20 million to $100 million Over $20 million From $4 million to $20 million from $0.5 million to $4 million Less than $0.5 million 2008 - - 10% 11% 6% 7% 2009 - - 6% 9% 3% 12% 2010 - - 4.3% 4.8% 4.4% 3.2% 2011 - - 4.4% 10.3% 5.4% 6.6% 2012 4.56% 8.29% - 9.02% 8.41% 4.76% primarily caused by the fact that they cannot tive in the labor market the company was. Fol- enjoy the incentives in the social taxation, lowing the results of 2012 this rule was broken. which are being currently used by the com- There were no dependencies between the panies with the staff size over 30 employees. shares of companies that did not employ new If the decision on a decrease in the staff size staff and their preferential orientation towards threshold for IT companies is not adopted in the foreign or Russian market. 2013, we can expect not only stagnation of In 2012 companies that obtained over headcount and turnover for small companies a half of their revenue from software export but also an actual decrease in these figures. recruited Java and C# developers, as well as In 2012 larger enterprises recruited new ASP.Net/MSSQL web programmers 2-3 times staff and lost employees approximately at the more often than others. PHP/MySQL web same level as in 2011. programmers were more demanded for op- In the previous years there was a strict rule eration in the domestic market than for export. according to which – more company’s export share in its aggregate income was – more ac- 80 C/C++ and C# developers were the most demanded staff in 2012. Among other
  • 81.
    Chapter 5 /Employee recruitment and headcount reduction 51. Most popular developers that were employed by respondent companies in 2008-2012 2008 2009 2010 2011 2012 Developer (C/C++) 42% 30% 25% 29% 26% Developer (Java) 29% 29% 21% 30% 17% Developer (C#) 20% 19% 18% 28% 23% Developer (DB) 4% 5% 2% 4% 4% Test engineer 9% 14% 13% 22% 16% Web programmer (PHP/MySQL) 21% 11% 13% 13% 18% Web-programmer (ASP.Net/MS SQL) 16% 7% 4% 15% 13% System administrator (Win) 2% 4% 7% 8% 6% System administrator (UNIX) 2% 4% 2% 5% 2% Others 8% 16% 11% 19% 15% Average quantity of mentioned engineers 1.53 1.39 1.16 1.73 1.4 52. Positions for which the respondent companies hired employees in 2012 (depending on company turnover) Over $100 million From $20 million to $100 million from $4 million to $20 million from $0.5 million to $4 million Less than $0.5 million Developer (C/C++) 40% 55% 44% 22% 9% Developer (Java) 40% 36% 22% 15% 5% Developer (C#) 40% 27% 44% 20% 5% Developer (DB) 0% 0% 17% 3% 0% Test engineer 40% 45% 17% 13% 9% Web programmer (PHP/MySQL) 0% 36% 11% 21% 9% Web-programmer (ASP.Net/MS SQL) 20% 18% 22% 12% 5% System administrator (Win) 0% 18% 6% 6% 0% System administrator (UNIX) 0% 0% 6% 1% 0% Others 0% 0% 17% 21% 9% Average quantity of mentioned engineers 1.53 1.39 1.16 1.73 1.4 demanded experts – 1C programmers and ers for mobile devices (under Android and technical support engineers (4 times each) iOS) were mentioned mostly in the category were mentioned by the respondents. Data- of “other demanded engineers”. base administrators, project managers, 1C In May 2013, the RUSSOFT Association system administrators, software deployment and the TEAM FORCE out-staffing company and maintenance engineers, Ruby and Delphi signed a Cooperation Agreement regarding programmers, sales managers and consul- development and operation of a system for tants were also wanted. Application develop- exchange information about temporarily un- 81
  • 82.
    Chapter 5 /Employee recruitment and headcount reduction 53. Distribution of positions for which the respondent companies hired employees in 2012, depending on the respondent’s location Moscow St. Petersburg Siberia Ural Other towns Developer (C/C++) 21% 31% 25% 25% 27% Developer (Java) 17% 26% 19% 25% 7% Developer (C#) 10% 26% 25% 13% 32% Developer (DB) 7% 6% 0% 0% 2% Test engineer 17% 26% 6% 25% 10% Web programmer (PHP/MySQL) 17% 20% 25% 0% 20% Web programmer (ASP.Net/MS SQL) 19% 3% 6% 0% 20% System administrator (Win) 12% 3% 0% 0% 5% System administrator (UNIX) 2% 0% 0% 0% 2% committed developer resources. Initially, the In view of the TEAM FORCE team’s experi- system was created by Artezio directly for the ence in development and administration of RUSSOFT Association website and repre- the SmartSAP portal, RUSSOFT made a sented an online service to exchange informa- decision to place the system under manage- tion about temporarily free labor resources ment of TEAM FORCE Group. between the RUSSOFT member companies. 82
  • 83.
    Chapter 5 /Shortage of engineers Shortage of engineers T he number of companies that do the existing employees. Also, staff shortage not suffer for acute staff short- is not a problem for some individual suc- age considerably reduced for the cessful companies (mainly for the producers last year. There are only 27% of of licensed software who are capable to such companies left – but in the increase sales without staff expansion) and last several years their number was at the for international corporations’ R&D centers. It level of 45%-55%. Among medium and large can be assumed that their immunity against enterprises (with the turnover over $4 mil- staff shortage is a matter of time. It should lion), which account for 90% of all respondent be noted that all largest (with the turnover companies’ staff, this indicator was equal to more than $100 million) and quickly growing 12% only. companies experience staff shortage. It is remarkable that 59% of companies The deficit of developers is characterized with turnover less than $0.5 million are not in particular by the so called hh.index – the pressed for staff shortage. The reason is that ratio between the number of CVs and vacan- in most cases they have to solve the prob- cies published on the hh.ru and career.ru lem of survival and do not know how to pay websites. In the autumn of 2012 this index 54. Share of the companies that do not feel an acute shortage of developers, % 60 57 56 54 50 46 40 30 27 20 2008 2009 2010 2011 2012 83
  • 84.
    Chapter 5 /Shortage of engineers 55. Share of companies with turnover over $4 million dollars development” section increased by 28% and experienced an acute lack of following developers the number of vacancies – by 62% from April 2012 to April 2013. Developer (C/C++) 15% According to the ANCHOR High Tech- Developer (Java) 41% nologies data, in 2012 there was a serious Developer (C#) 21% Developer (DB) 12% estimated demands, the employer was forced Test engineer 12% to accede to their requests. Web programmer (PHP/MySQL) 12% Web programmer (ASP.Net/MS SQL) 26% System administrator (Win) Like in the previous two years, most of companies having the turnover over $4 million experienced a lack of Java developers (35%) 0% Others Moscow. Although they had obviously over- 3% System administrator (UNIX) problem with recruitment of test engineers in 24% and of С# developers (23%). The data of recruiting agencies and job search portals are generally agreed with our for programmers was 1.4 (there were 1-2 survey results. Considerable discrepancies CVs per one vacancy, whereas for the entire are explained, first of all, by a different selec- Russian labor market the ratio was equal to tion of interrogated employers as well as by 3.2 (there were over 3 CVs per one vacancy). use of different survey techniques. Thus, applicants for software developers For example, according to the Superjob. positions face practically no competition, and ru data, 1С, C++, PHP and Java program- in this case employers have no choice. This mers were the most demanded IT engi- situation in the labor market results in an neers in Russia in 2012. Recruitment of unjustified salary growth and in a certain staff Ruby programmers was the most difficult turnover growth. task (there were about three vacancies per According to the Superjob research one applicant). However, the Superjob.ru center, the number of CVs in the “Software analysts note that the share of requests for 56. Distribution of positions for which the acute lack of developers is felt depending on the respondents’ location (reference rate) Moscow St. Petersburg Siberia Ural Other towns Developer (C/C++) 12% 11% 19% 13% 17% Developer (Java) 21% 29% 19% 38% 10% Developer (C#) 2% 14% 31% 0% 27% Developer (DB) 7% 9% 0% 0% 0% Test engineer 7% 9% 0% 0% 5% Web programmer (PHP/MySQL) 12% 11% 19% 13% 17% Web programmer (ASP.Net/MS SQL) 10% 9% 6% 13% 17% System administrator (Win) 0% 0% 0% 0% 2% System administrator (UNIX) 0% 3% 0% 0% 0% 84
  • 85.
    Chapter 5 /Shortage of engineers this language does not exceed 1% of all experience from 3 to 6 years was 20%, and requests. the share of those with more than 6 year’s According to HeadHunter, the program- experience was 1% of all vacancies. There mers with 1 to 3 years of experience are the were 8% of vacancies suitable for developers most in-demand (71% of vacancies on the without experience. hh.ru website). Demand for developers with 85
  • 86.
    Chapter 5 /Foreign language skills Foreign language skills T he surveys undertaken within technical documentation reading, 28% admit the last 5 years allow us to state that they have basic skills only and 7% do not that there is an increase in the specify their level of proficiency in English. number of developers (both in absolute and in relative values) According to ANCHOR High Technologies, the situation with knowledge of English is who have a good command of English. Their much better: 64% of all developers (included share grew from 65% to 72%. Other sources in the recruiting agency’s database) have a confirm this trend. It comes very often now good command of English or are fluent in that organizers of IT conferences in Russia do English. not engage interpreters to translate speeches Considerable differences in the data of two of foreign English-speaking contributors as companies can be explained by the fact that they believe (not without reason) that almost they cover absolutely different audiences. It all engineers who deal with imported software is arguable that Superjob’s audience is much or who sell their services and solutions in wider, whereas ANCHOR is more oriented to- foreign markets have a good command of wards recruiting of personnel for international English. companies and for Russian exporters. Besides, At the same time, according to the Su- the knowledge of language at the level of perjob research center, only 15% of software technical documentation can be considered as developers specify the ‘fluent’ or ‘conver- a good command of language. sational’ level of English in their CVs, 50% declare knowledge of language at the level of 86 Concerning the German language, we cannot state any unambiguous growth. Most
  • 87.
    Chapter 5 /Foreign language skills 51. Most popular developers that were employed by respondent companies in 2008-2012, % 80 70 65 10 3 2009 68 68 5 8 11 2008 60 65 72 20 10 0 % English 4 % German likely, the share of German-speaking develop- 2010 % 2011 8,5 9,5 2012 Others teaching. However, this growth is mainly con- ers in the in interrogated export companies nected to the fact that companies from the almost did not change and remained at the two capitals have an opportunity to poach level of 8-10% within the last 5 years. the best developers from regions and from small companies. According to this year’s data, we can assume The growth of the share of English- that the number of employees who have speaking employees in IT companies is not good command of other languages has in- caused by improvements in the Russian creased.However, from year to year this figure state educational system. People often study varies widely that is indicative of a fairly big foreign languages at their own expense or at measurement error. An increase in the number of developers capable to speak other languages can be explained by the change of Russian software their employers’ expense, attending language courses and engaging teachers. As a rule, skilled English teachers do not tend to work at schools and universi- exporters’ geographical priorities (entrance ties because of the low salary level in the to the markets of South-East Asia, Latin state educational institutions in Russia. This America, and the Middle East). However, in problem should be solved by the govern- most cases, knowledge of other foreign ment. Otherwise, the high-technology sector languages is desirable but not crucial. As a of economy will not fit the requirements of rule, knowledge of English is sufficient for the international competition, neither it will communication with foreign customers, while correspond to the potential of engineering localization and promotion can be performed resources available in Russia. by local partners. It is especially important to improve the language teaching level in regional universi- Despite an obvious progress in foreign lan- ties and schools because many of these guages proficiency, many problems remain institutions provide a high level of education unsolved. There are not enough English- in the field of mathematical and technical sci- speaking employees in small and in regional ences but cannot provide their graduates with companies. An increase in the number of competitive positions with respect to foreign such employees is provided by the larg- languages skills. est companies located in Moscow and St. Russia is not at the bottom of the English Petersburg.Partly, this happens because they proficiency level list, but it is in the second pay for their employees’ foreign language half of the world ratings which cover several 87
  • 88.
    Chapter 5 /Foreign language skills 58. Share of the staff with good knowledge of foreign languages, percentage of English-speaking population in these countries is ensured by the countries’ depending on company location integration in the world economy and by English German Others Moscow 80% 12% 14% of high technologies. In a small city of Salo St. Petersburg 76% 2% 4% (Finland) with the population about 55 thou- Siberia 62% 4% 1% Ural 40% 2% 2% that export their hi-tech products to several Other towns 39% 3% 0,2% dozens of countries. We cannot say that all their considerable achievements in the field sand people, there is a great number of the companies (large, medium, and very small) these companies enjoy up-to-date production lines. However, they achieved very good 59. Share of the staff with good knowledge of foreign languages, depending on company turnover results thanks to the state support system as well as to the knowledge of the global market which is largely provided by a high proficiency Over $100 million From $20 million to $100 million From $4 million to $20 million from $0.5 million to $4 million Less than $0.5 million in English. Venture investors are debating on the reasons why Russian startups often work over devel- English 79% 62% 73% 48% 39% German 12% 3% 3% 3% 3% Others 14% 3% 2% 0.4% 4% opment of solutions without any idea of their potential implementation in the global market. Some analysts consider that the main reason lies in their poor knowledge of English. Others see the reason in the unwillingness or dozens of countries. For example, according in the inability to learn the situation in the to GlobalEnglish company research where global market. Nevertheless, it is difficult to the level of proficiency in business English deny that an insufficient level of proficiency was defined, Russia received 3.6 points. That in English undermines the ability of Russian is higher than in Colombia (2.75), Brazil (2.95) business to create and to provide competi- and Turkey (2.97), but it is much lower than in tive solutions and services worldwide, and the Philippines (7.11), India (5.57) and some furthermore, blocks their promotion in the other large countries. Sweden and Finland global market. The unwillingness to monitor who take the top positions in the English the global trends can be mainly caused by knowledge ratings should be a reference weak competence in languages. point for Russia. In many respects, the high 88
  • 89.
    Chapter 5 /Salary Salary A ccording to the present survey, company, for some reason, named a figure of the average salary of software 59 thousand RUR following the results of the developers (including man- first half of 2012. But a Russian programmer’s agers) in 2012 was $2,300 average salary around 70 thousand RUR looks (71,300 RUR). It grew up more realistic. However, this figure is only use- approximately by 7-8%. Following the results ful for determination of general trends in the of 2011 (when the growth was 18%) we can entire labor market of Russia, as the pay level state a certain decrease in the remuneration dispersion depending on the developer’s level growth rates. and on city is quite great. The data on salary obtained as a result of The gap in the pay level among Moscow, the present survey are agreed with informa- St. Petersburg, and other Russian cities did tion received from recruiting agencies. The not reduce in the last 2-3 years. According existing diversity is explained by the differ- to the survey of software export companies, ence of covered audience, by compared there is no great difference by remuneration periods and by calculation techniques. For of experienced developers and managers example, according to the Superjob research between the two capitals (the difference is center, salary offers increased by 12% from 11-13%). However, we should consider that April 2012 to April 2013.It does not contra- Moscow companies have the significant num- dict the growth of 7-8% mentioned above. ber of employees who work in other cities and The fact is that Superjob determined not the countries (where the pay level is often much average pay per year, but salary offers at a lower than in Moscow and St. Petersburg). specific point in time. Besides, their survey The data provided by recruiting agencies covered not only exporters but all Russian IT and by analysis of job offers on the Internet employers.In addition, the comparison time give evidence of a larger difference in salaries frames do not match in different studies. between the two capitals. According to infor- According to CNews Analytics research mation of the Yandex.Job job search system, (its results were published in the autumn of Java programmer’s average salary in Moscow 2012), on the average software developers is 98 thousand RUR(in St. Petersburg, it is receive 83.8 thousand RUR per month. Similar 20% less, and in Novosibirsk – 38% less). data is provided by the Rabota.ru resource – 75-80 thousand RUR. HeadHunter recruiting Approximately the same gap was determined by the CNews Analytics. 89
  • 90.
    Chapter 5 /Salary Beginning developer Experienced developer Manager $1140 $2375 $2875 60. Average monthly salary of IT employees in 2012 61. Average monthly salary 62. Average monthly 63. Average monthly of novice developers salary of experienced salary of managers in in 2012, depending on developers in 2012, 2012, depending on company location depending on company company location location $1640 100% $2530 $3060 67% 87% 89% $855 $1915 $2355 52% Regions $3445 100% $1120 St. Petersburg $2900 100% Moscow 66% 68% 64. Comparison of software developers average monthly salary in 2012 in companies with different incomes Over $100 million From $20 million to $100 million From $4 million to $20 million From $0.5 million to $4 million Less than $0.5 million 100% 110% 105% 73% 56% 90
  • 91.
    Chapter 5 /Salary 65. Average pay level of software developers in different regions of The HeadHunter data on Java programmers shows a larger gap between the capital Russia, depending on experience (thousand rubles) and other cities. At the end of 2012, they were offered the average monthly salary of 0-3 years 3-5 years 5-10 years Over 10 years Russia 54.5 74.3 92.4 114.0 Moscow 71.6 92.1 109.2 125.0 provided analysts with more correct data on St. Petersburg 44.7 67.5 84.6 101.4 the cost of services provided by respondent Other cities 38.8 54.7 70.5 88.3 107.7 thousand RUR in Moscow. In St. Petersburg, the figure was 30% less, in Novosibirsk – 44% less, and in Kazan – 58% less. The change in the formulation of a question about the price of man-hour work outsourcing service providers. Earlier, the majority of respondents found it difficult to answer this question or cited an unrealistic than in medium-sized ones, whereas the figure. As a result, we had to calculate the pay level in large companies is higher. This average cost based on a small number of contradiction can be explained by the fact companies that did not make sense because that large service providers reduce the price of a high measurement error. of their services for the customer due to use This year, there are much more answers of developer labor in other countries, while in to the question about the price of a man- the questionnaire they specify the pay level in hour service than in last few years. However, Russia. the range of specified values is still too wide It is worthy of note that the man-hour which an important gap in man-hour prices price and the average salary almost do not between different locations and also testifies depend on the share of export in the consoli- that a part of respondents strongly underesti- dated revenues. In the companies with the mated or overestimated their figures (as a rule, export share that ensures over 50% of the they are small companies which do not mark- turnover, the expenses on personnel are only edly affect the average level). In such condi- 4-5% higher than in the companies that gain tions it is more practical to look at data of the most part of their income from sales in man-hour price of services in different regions the domestic market. A few years ago, the and in companies with different turnover. difference was greater that was explained It is remarkable that the employee’s manhour price in large service companies is lower by higher requirements to employees which work for export, as well as by higher financial Source: Yandex.Job 66. Average salary of programmers in Russia at the beginning of summer of 2013 (thousand rubles) 80 000 70 000 79 68 66 60 000 66 C# JavaScript 59 53 50 000 47 40 000 C++ Java 1C Web PHP 91
  • 92.
    Chapter 5 /Salary 67. Profile man-hour price, offered for the customer, 68. Man-hour price for the customer, depending depending on respondent company location (in USA) Moscow St. Petersburg Software development (beginner) Software development (experienced) Software development (team manager) Software testing (experienced) Regions 34 26 23 48 38 33 56 49 35 47 32 23 on respondent company export share (in USA) Less than 50% Software development (beginner) Software development (experienced) Software development (team manager) Software testing (experienced) Over 50% 25 26 37 36 39 43 27 31 69. Profile man-hour price for the customer, depending on respondent company turnover (in USA) Over $100 million From $20 million to $100 million From $4 million to $20 million from $0.5 million to $4 million Less than $0.5 million Software development (beginner) 19 24 31 31 30 Software development (experienced) 25 36 40 46 37 Software development (team manager) 25 40 47 51 42 Software testing (experienced) 17 27 39 38 42 solvency of foreign customers. The situa- of the CIS countries which do not greatly dif- tion has changed thanks to a considerable to know foreign languages in order to work vency and to the growth of the market share 92 fer from Russia (in any case, it is not essential increase in Russian customers’ financial sol- with customers in the neighboring countries).
  • 93.
    Chapter 5 /Staff training. Universities Staff training. Universities D ue to the staff shortage, the the export share lower than 50%, increased majority of companies actively thanks to the graduates by 8.3% while that recruit developers without ex- of those with the export share over 50% – by perience (university graduates). 29%. Nearly the same ratio was observed However, recent students’ lack following the results of 2011. It is explained of experience is conditional as many of them by the fact that exporters still have higher undertake internships or even participate in requirements to staff training and to work commercial projects in parallel with university experience. degree courses. Now, large enterprises tend to recruit Like a year ago, Moscow companies employed the least number of graduates university graduates more actively than small because they have more opportunities to en- companies. A few years ago, small enter- gage the most skilled developers from regions prises employed recent students more often and from abroad (particularly, hiring them for and the leading software companies preferred their offshore development centers). Moscow experienced developers. attracts programmers from regions thanks to In 2012 university graduates obtained employment in 71% of respondent compa- the highest salaries in Russia. Following the results of surveys for the nies (thus several more percent of respon- last 5 years we can say that the share of dents, most likely, simply did not specified companies that cooperate with higher educa- the number of recruited young engineers tion institutions has been gradually reducing. although they hired them). For the enterprises For the last five years it decreased from 58% with the turnover over $4 million this figure is to 47% (generally at the expense of the small- 81% and for those with the turnover less than est companies that encounter difficulties in $4 million – 68%. labor market competition with larger compa- In 2012 the respondent companies’ staff in- nies). Many small companies cannot afford creased thanks to university graduates by 4.6%. to expand their staff, therefore they are not It is slightly more than a year before (4.1%). Companies that are oriented towards the Russian market employ newcomers more willingly. In 2012 the staff of companies with interested in cooperation with higher education institutions. Besides, in recent years it became much harder even for medium companies and even 93
  • 94.
    Chapter 5 /Staff training. Universities 70. Share of the university graduates employed in 2012 education institutions or colleges experience in companies’ staff difficulties as educational institutions come into contact reluctantly. 49% of respondents Moscow 2.4% admit that the process is very difficult to be St. Petersburg 9% organized and 38% of companies cannot Siberia 13% easily find resources in the universities to train Ural region 4.6% Other cities 8.7% inexperienced graduates. The quality of engineers is affected by the socalled ‘demographic hole’ caused by a sharp decrease in the number of schools graduates for quite large foreign companies to harmo- due to the decline of the birth-rate during nize relations with the leading universities, the ‘perestroika’ period in the 1990ties (some which more and more realize their position as growth of the number of school graduates is a supplier of super-valuable resources. expected not earlier than in 2018). During the last 5 years the main form of Entrance to universities became easier cooperation with universities was the intern- and the threat of expel decreased. There- ship of students in companies. The share of fore both – higher education institutions and those who apply this model almost did not young people have fewer stimuli to improve change and is equal now to 40%. Among the quality of training. By 2010 the fall of other forms of cooperation respondents graduates’ and student’s educational level mentioned the following: creation of special- became obvious almost for all employers. ized basic chairs and laboratories in universities, providing free software (or software at a Certainly it only concerns the average level of preferential price) for universities, offering free education which is slowly decreasing. At the training courses and mentoring programs for same time, there are some positive changes. students, implementation of joint educational For example, the state financial support to the projects, holding career events and job fairs, leading technical universities has improved. In supporting graduates’ thesis contests and particular, universities received grants which programming competitions, monitoring of allowed them to invite well-known professors student’s projects with the company’ staff from abroad. Furthermore, judging by achieve- guidance, participation in development of a ments of Russian students and graduates in training course for testers. international competitions in software engineer- According to the Career.ru poll (the ing, significant deterioration in comparison to portal belongs to the HeadHunter company), foreign universities can not be observed. This 30% of companies cooperating with higher can be partly explained by the fact that the 71. Cooperation between companies and universities 2008 2009 2010 2011 2012 Students training 42% 41% 41% 37% 39% Graduates employment 34% 23% 26% 32% 31% Courses for employees 24% 21% 18% 17% 19% Others 1% 14% 10% 17% 12% Do not cooperate 42% 48% 48% 48% 53% 94
  • 95.
    Chapter 5 /Staff training. Universities 72. Cooperation between companies and universities, depending on companies’ turnover (according to the 2013 survey) Over $100 million From $20 million to $100 million From $4 million to $20 million from $0.5 million to $4 million Less than $0.5 million Students training 100% 82% 50% 36% 9% Graduates employment 100% 55% 44% 29% 0% Courses for employees 40% 64% 33% 13% 9% Others 20% 27% 22% 10% 0% Do not cooperate 0% 18% 44% 53% 82% level of IT-education is gradually decreasing in Another reason is that higher education most countries (especially in the West). institutions have not learned yet how to work However, an increase in the state financial support still does not allow involving young with rating agencies. As a result, analysts in the Rating Agencies do not have enough talented teachers in the educational process information on higher education in Russia. in universities in the quantity necessary to The situation may change in the future as the retain the existing quality of education. The Russian government is in train of implement- salary at universities remains rather low and ing a series of measures for supporting their many things stay up thanks to the enthu- accession to the Universities’ ratings. 40 siasts. But these enthusiasts retire over billion rubles are to be provided in the budget time or switch to a better-paid job by family of Russia in the next 4 years for this purpose. circumstances. The same things happen A part of this money has been already al- with teachers of Physics and Mathematics in located to 15 Russian universities who won in the secondary schools, who should provide a tender. Each of them will receive about 600 a basic educational level to future students. million rubles ($20 million) for these purposes Universities are unable to train excellent in 2013. engineers without such basic knowledge. So far, it is difficult to compare Russian The government of Russia sets the task to and foreign universities by key indicators increase the university professors’ and school which are being used in the international rat- teachers’ salary up to the average level of the ings.Nevertheless, higher education institu- region where the educational institution is lo- tions in Russia take the highest positions in cated. However, such increase is materialized some specific ratings. For example, the St. too slowly. Besides, providing the pay rate at Petersburg National Research University of the level of the average regional salary is obvi- Information Technologies, Mechanics and ously not enough to involve the best teachers Optics (SPNRU ITMO) is the best in the world and professors. by their results in participation in the ACM In- Russian technical universities are presented during the last decade. St. Petersburg State ternational Collegiate Programming Contests in the international ratings of universities ex- University is the first 10 and some other Rus- tremely poorly (or they are placed far outside sian higher education institutions are in the the first hundred of universities in the ratings). top twenty in the rating prepared by organiz- One of the main reasons is a small volume of ers of this competition. R&D performed by higher education institu- At the beginning of July 2013 the regular tions within contracts with private business. ACM ICPC contest first took place in Russia 95
  • 96.
    Chapter 5 /Staff training. Universities 73. Medal places of the Russian universities teams at the Student World Cup in Programming (ACM International Collegiate Programming Contest) from 1999 to 2013* Years 19992008 2009 1 Saint Petersburg State University of Information Technologies, Mechanics and Optics 3, 5, 3, 3, 1, 3, 3, 1 St. Petersburg State University 9, 1, 1, 6, 11 3 3 Moscow State University 9, 2, 2, 9, 10, 5 4 Saratov State University 6, 7, 1, 6 5 Izhevsk State University Altai State Technical University 3 7 8 Perm State University Petrozavodsk State University 13.1 10 Novosibirsk State University 5 11 Nizhny Novgorod State University 12 Ufa State Aviation Technical University 13 Ural State University 1 4 9 2013 1 Moscow Institute of Physics and Technology 2012 8, 9, 3 6 2011 1 2 2010 Total number of prizewinners 4 2 4 9 10 7 5 6 10 10 8 3 13 5 5 10 13 from 2 to 5 (in 20062008) 4 11 5 5 3 4 * The quantity of medal places varied from 10 to 13 during this period (in St. Petersburg). SPNRU ITMO was the the ACM International Programming Contest host party of this prestigious competition and only about 15 years ago. Source: ACM International Collegiate Programming Contest, the rating is compiled by the RUSSOFT Association. place in the overall ranking. This university places in this Contest on a regular basis. In became the fivefold world champion. No the last 5 years, there have usually been at the university’s team once again won the top Some more universities also take high other team has won so many times for the least 4 Russian teams among 12-13 prize- entire 37-year history of this competition. winners of the contest. Apart from SPNRU ITMO with their gold medal, one silver and Russian universities started to participate in 96 That said students of SPNRU ITMO and other two bronze medals were awarded to the
  • 97.
    Chapter 5 /Staff training. Universities Russian teams in 2013 (St. Petersburg State within the Google Pwnium competition and University – the 5th absolute place, Moscow was awarded the first prize – $60,000 in State University – the 10th place, Perm State 2012. He also earned $50,000 from partici- University – the 13th place). Three more pating in the similar competition in 2011. teams of Russian universities were very close Egor Kulikov, an employee of the Yandex to the prize-winners: Altai State Technical Uni- company, became the winner of the most versity, Ufa State Aviation Technical University prestigious international individual competi- and Ural Federal University who occupied the tion among programmers – TopCoder Open 14th-16th places. Totally teams of 13 Russian 2012. universities have become prize-winners of the At the 24th International Olympiad in Infor- ACM ICPC contest within their 15 years of matics, which was held in Italy in September participation in this Contest. 2012, the victory was shared by the Russian Such competitions in many respects national team and by the national team of reflect the quality of programmer training. China which collected four gold medals each. Judging by their results, programmer training During these competition it was decided to in Russia is the best in the world, although hold the International Olympiad in Informatics Chinese universities achieved a similar prog- (IOI) 2016 in Russia – in Innopolis just being ress in the last decade. Among leaders and built near Kazan. prize-winners of the Contest there have been also teams from Poland, Belarus, and Ukraine It becomes trendy to hold in Russia different but these countries do not have as many competitions in programming and informat- strong teams as Russia and China. Individual ics, as well as various international contests representatives of Western Europe and the in the field of innovations. Only several days USA sometimes also appear among the top after ACM ICPC contest, the world final of the teams. Imagine Cup (an international contest of student’s innovative projects which was organized Not always champions and prizewinners on by the Microsoft) took place in St. Petersburg, sports programming reach the outstanding and also for the first time in Russia. Next year, results in work in commercial and state struc- ACM ICPC will take place in Yekaterinburg, tures. However, they are able to meet the Russia. Holding similar competitions in Rus- most complex challenges in their R&D and sian cities promotes the ‘Russia’ brand in the in the labor activities that is being strongly world market of high technologies, as well as confirmed by the fact that many Russian contributes to the popularity of highly demand- ACM contest champions and prize-winners ed IT-profession within the country. established successful software companies or work at key C-positions in these companies Achievements of students’ performance in (DevExperts, SPb Software, Yota, VKontakte). the programming contests give an idea of the Russians also win in other competitions quality of IT-education at Russian universities. in programming and in informatics. In the last However, it is more important to estimate this three years they steadily became winners of quality by the degree of employer satisfac- the Facebook Hacker Cup contest. In 2013 tion. The university rating by this indicator as well as two years earlier Pyotr Mitrichev would not be completely objective neither, but won these competitions, while Roman An- comparison of universities by different criteria dreyev from St. Petersburg State University allows drawing more reasonable conclusions was the winner the last year. concerning their effectiveness for the industry Sergey Glazunov, student of Tyumen State University, became the first one who found vulnerabilities in the Chrome browser and for the Economy altogether. More than a year ago, the research center of the Superjob.ru recruiting portal issued a 97
  • 98.
    Chapter 5 /Staff training. Universities 74. The Superjob.ru recruiting portal rating of higher education institutions Place Name The average salary of graduates having positions according to the acquired specialty, thousands of RUR 1-4 Moscow State University 85 1-4 Moscow Engineering Physics Institute 85 1-4 Moscow Institute of Physics and Technology 85 1-4 Novosibirsk State University 85 5 Bauman Moscow State Technical University 80 6-10 Moscow State Institute of Electronics and Mathematics 75 6-10 Novosibirsk State Technical University 75 6-10 Nizhny Novgorod State University 75 6-10 St. Petersburg State University 75 6-10 Ural Federal University 75 11-12 Saratov State Technical University 73 11-12 Ufa State Aviation Technical University 73 13-16 Kazan (Volga) Federal University 70 13-16 Moscow Aviation Institute 70 13-16 Moscow Institute of Electronic Equipment 70 13-16 Nizhny Novgorod State Technical University 70 rating of universities that was based on the ber of the companies representing the spe- evaluation of how successful their gradu- cific city, first places are usually occupied by ates were in getting a job in Moscow (first universities from Moscow and St. Petersburg. of all, the salary level was estimated). Surely, In this regard, it is more appropriate to com- universities from Moscow got an advantage pare universities located in one city; however, in this rating, but still, it provided sound basic sufficient sample for this comparison presents data. The quality of training was estimated for only in Moscow and in St. Petersburg. all specialties, not just for the IT alone. Nevertheless, even taking aforesaid note into account, universities ranking reflects the The rating of RUSSOFT Association is cre- level of programmers quality especially when ated based on the poll of software exporters taking into consideration the range in which and, therefore reflects the view of software the specific university is situated (3-5 nearing business’ executives as to how successfully places). universities train personnel for the software In the total, respondents have mentioned industry. However, it is also not beyond 228 universities whose graduates have been reproach. mentioned as mostly demanded among IT Since the position of a university in this rating depends to a great extent on the num- 98 companies in the region. If repetitions are ex-
  • 99.
    Chapter 5 /Staff training. Universities Place Name The average salary of graduates having positions according to the acquired specialty, thousands of RUR 17-19 Moscow Power Engineering Institute 68 17-19 Orenburg State University 68 17-19 Penza State University 68 20-22 Volgograd State Technical University 67 20-22 St. Petersburg State Polytechnic University 67 20-22 Tula State University 67 23 Izhevsk State Technical University 66 24-26 Vladimir State University 65 24-26 Moscow State Institute of Radio Engineering, Electronics and Automatics 65 24-26 Ryazan State Radio Engineering University 65 27-28 Kazan State Technical University 62 27-28 St. Petersburg State Electronic Technical University 62 29-33 Voronezh State Technical University 60 29-33 Moscow State University of Instrument Making and Informatics 60 29-33 Moscow State University of Means of Communication 60 29-33 St. Petersburg State University of Space Instrumentation 60 29-33 Saint Petersburg State University of Information Technologies, Mechanics and Optics 60 cluded, employers have evaluated more than 80 higher educational institutions. work in software companies, although there is a huge staff shortage. Therefore there is a great potential in the High School for increas- St. Petersburg National Research University ing the number of graduates who are capable of Information Technologies, Mechanics and to satisfy employers. First of all, it is neces- Optics, occupies the first places in two rat- sary to create stimuli to encourage young and ings. It is also a leader by one more indicator – perspective people to work in the educational by the share of graduates who found a job system, creating competition for university according to their university specialty (76%). professor’ and school informatics teacher’s In the majority of other universities which train job positions. software developers this share is much less – about 50%. Experts consider that 15-20% The post graduate education system (the career development and staff retraining sys- of university graduates are ready to work for tem) created by the organized business may software companies right after the graduation. also ensure an increase in the Russian labor Other 30-35% of graduates need to continue market supply. For example, St. Petersburg their studies (to make them more practical). Academy of Postgraduate IT Education (SPb Thus, a half of graduates who got degree of a ITAPO) was opened in 2013. Top managers software developer are unable to immediately of Lanit-Tercom, SoftJoys and First Line Soft- 99
  • 100.
    Chapter 5 /Staff training. Universities Place Name 2010 2011 2012 For the last three years 75. Ranking of the universities whose graduates are in great demand among the software companies 1 Saint Petersburg State University of Information Technologies, Mechanics and Optics 26 20 19 65 2 Bauman Moscow State Technical University 28 17 19 64 3 St. Petersburg State University 20 22 19 61 4 Moscow State University 23 10 17 50 5 Moscow Institute of Physics and Technology 18 15 12 45 6 St. Petersburg State Polytechnic University 21 10 12 43 7 St. Petersburg State Electronic Technical University 19 9 10 38 8 Moscow Engineering Physics Institute 8 6 8 22 9 Novosibirsk State University 7 2 9 18 10 Southern Federal University 3 3 6 12 11 Novosibirsk State Technical University - 4 5 9 12 St. Petersburg State University of Space Instrumentation 6 2 2 10 13 Moscow Aviation Institute 6 2 2 10 14 St. Petersburg State Institute of Technology (Technical University) - 5 3 8 15 Baltic State Technical University 5 3 - 8 16 St. Petersburg State University of Telecommunications named after Prof. Bonch-Bruevich 3 2 2 7 17-20 Nizhny Novgorod State University - 2 3 5 17-20 Omsk State University - 2 3 5 17-20 Omsk State University 1 1 3 5 17-20 Voronezh State University 1 1 3 5 21 South Ural State University 2 2 1 5 22-23 Ulyanovsk State University 0 1 3 4 22-23 Omsk State Technical University 0 1 3 4 24 Don State Technical University - 2 2 4 25 Moscow State University of Economy, Statistics and Informatics - 2 1 3 26-27 Samara State Space University - 3 - 3 26-27 Yaroslavl State University - 3 - 3 Source: RUSSOFT Association 100
  • 101.
    Chapter 5 /Staff training. Universities ware became the initiators of the Academy tion programs of the city/enterprise level – are creation. Within two years about twenty expected to be established on the basis chairs offering modular programs for retrain- of existing training centers in the leading ing of professionals in various IT areas – from market-players. programming and software testing to applica- 101
  • 102.
    Chapter 5 /Situation on the labor market in Russia and in other countries Situation on the labor market in Russia and in other countries T he Russian programmers’ labor lem of diminishing number of applicants in cost which rapidly grew for the technical colleges and universities in the West, last decade did not promote not only because of the birth rate but also competitiveness of Russia in because of decreasing popularity of technical the global market of software specialties. The majority of young people in and software development services. Due to the western countries are not eager to strain a rapid growth of salary, Russian software themselves studying such difficult subjects as companies’ export (in any case – the export advanced mathematics and physics. How- of software development services) could have ever, this problem is typical not only for such reduced long ago if the same tendencies countries as the USA and Germany, but also did not take place almost around the world. for countries with developing economies like Shortage of programmers is a global prob- Russia and Mexico. lem of the world economy. The labor market There is another problem in the economi- supply goes behind the growing demand for cally developed countries: many of university software developers In the majority of devel- graduates are not prepared for unsupervised oped countries. work. Even in the USA employers complain Russia is experiencing right now a ‘demo- that they have to teach recent students the graphic hole’ that is caused by a great reduc- sense of initiative, so those students could tion of the birth rate about 20 years ago. But become productive employees. the reduction of the young people share in According to experts from Ernst & Young, the overall population is observed in the eco- nies on transfer of IT operations to offshore if it is a time-expanded process. In the states territories, which was done in the mid-nine- with high living standards There is a prob- 102 the decision of many large western compa- nomically developed countries as well, even ties, became one of the main reasons for the
  • 103.
    Chapter 5 /Situation on the labor market in Russia and in other countries current industry’s staff shortage. For example, Staff shortage is experienced even in the about 32 thousand students studied math- densely populated India which is the absolute ematics, physics, and computer sciences world leader in the area of IT-outsourcing (i.e. the subjects that are necessary for work services. However, the staff shortage in in the IT area) at British universities in 1998. this country is not connected to a birth rate Two years later, the number of such students decrease. The reason is related to problems dropped down to 8 thousand. According to in the general secondary education system in Ernst & Young, the whole generation should India, so only a small part of Indian children probably be required to eliminate the gap in get the high-quality school education. engineering training. High unemployment of software developers The situation in the Indian labor market leads to the fact that India is gradually being and mass staff reductions in software compa- less and less considered as a low-cost labor nies in the Nordic countries do not fit well into country. According to Reuters, the largest the overall picture. For example, TietoEnator Indian outsourcing companies started to (Swedish – Finnish-Norvegian largest software depart from having a numerous staff of low- service company) declared in 2012 its plans to skilled employees with rather low salaries in dismiss 7% of employees (about 1,300 people) India. They often aspire to build a small team working in Sweden and Finland. The reason of high quality professionals in order to make for this reduction is the high level of salaries money not by providing labor-consuming and in these countries. Those salaries are much low-profitable IT-services, but by creating of higher than the world average level. It be- intellectual property. comes more favorable for Finnish and Swedish companies to place orders for software There as a considerable pool of IT specialists in development into other countries than to keep Brazil, which is one of five most populous coun- own programmers’ staff. In Baltic countries the tries in the world. The government of this coun- unemployment is also caused by this reason try has been implementing a manpower training and also due to the lack of career attractive program for many years .As a result, millions software companies with solid reputation and of people have moved up from the category of high-quality management. the poor into the middle class category thanks However, in such countries as Sweden and Finland the developers usually remain to technical education. Annually, 100 thousand Brazilian university graduates have opportunities unemployed for a short time. In any case, to continue training at 50 world best universities their number is not big enough to influence at public expense. The Brazilian government set demand and supply in the world labor market. Many skilled programmers are unem- a task to train additionally 900 thousand IT specialists in the next 10 years. This figure is almost ployed in the countries of Southern Europe equal to the number of IT-professionals currently which are experiencing the financial crisis. In working in Russia. these countries, software development ser- However, the vast majority of Brazilian vices as a business has not been developed IT-staff and the largest Brazilian IT companies yet and software companies are not reputable are oriented towards the internal IT market. enough for customers from wealthier coun- It should be noted that – thanks to the state tries. However, there are no investments into IT development support policy – this market offshore development centers in these coun- reached $123 billion following the results of tries yet and the situation has not become 2012. It is 3.7 times bigger than the Russian aggravated to the degree that would lead to IT market, although Russia and Brazil have software developers’ mass emigration from the fairly comparable population size and these countries, although such a probability gross domestic product volume. The Brazilian of exodus does exist. IT market continues to grow quicker. 103
  • 104.
    Chapter 5 /Situation on the labor market in Russia and in other countries For various reasons (first of all, because of the domestic market high attractiveness which is partly achieved via the State protec- By this indicator Russia is hardly differs from other countries. The programmers’ average monthly salary tionist policy) Brazilian software companies in Russia is still much lower than in the USA, did not achieve important success in the where in the Silicon Valley and in the largest world market, and the entire software export cities it reaches $8,000-$11,000 (in Russia of Brazil is less than that of Russia. Besides, it is $2,000-$4,000). In addition, there is a the Brazilian programmers’ labor cost is quite strong deficit of developers in the Nordic high. Therefore, creation of software develop- countries, Germany, the UK and in several ment centers in this country may be interest- more countries. But it is not as essential as ing for software companies from other coun- that of the USA. For example, in Sweden tries who are looking at the large Brazilian IT (where the pay level is higher than in Russia) market. If Brazil further increases the number the total cost of software development ser- of IT-students, the situation may change. The vices is already comparable with the Russian country may significantly increase software one because of a higher average office rent in export that will allow reducing the labor mar- Russia. The competitive advantage of Russia ket demand in other countries. over more economically developed countries in the labor cost is compensated by the China and some other countries of the South higher costs of overcoming the administrative East Asia achieve a good pace in training of barriers and by higher cost of office rent. software developers. However, building of an Judging by the Java programmers’ aver- education system is a long process. Therefore age incomes, the salaries of the Russian the global shortage of developers cannot be developers are approximately the same as covered by the increasing offer in this region. the salaries in the Spanish-speaking countries It is particularly true taking into account that (Spain, Mexico, Colombia, Argentina, and the internal demand for qualified personnel Peru) as well as in such countries of Southern is growing very quick in the countries of the Europe as Greece and Italy. South-East Asia. Chinese IT industry com- According to Russian software developer petitiveness is not promoted by the country’s companies, the labor cost in Vietnam and improving standard of living, which displays China is at least twice lower than in Russia. itself in a wage level growth in all economic Other costs on business organization are also sectors. lower there. As it was earlier, total expenses Generally, we can state that even a significant increase in the number of trained soft- on software development in India are still much lower, than in Russia. It is partly due ware developers in any country in the world to the fact that in India there are no pension’ does not allow compensating the growth of and social taxes as pensions are generally demand on the Global market. absent at all (in any case, for the most part of The Manpower Group annual research showed that 49% of employers worldwide meet problems in filling crucial IT vacancies the population). Equalization of pay levels in Russia and in the economically developed countries leaves in their companies. IT-positions take the third less preconditions for mass relocation of place in the list of the vacancies that are the Russian developers to the West for perma- hardest to fill. Java, J2EE, and .Net programmers are especially demanded. Due to the existing disproportions their nent residence or for several years’ work. The “brain drain” is not a serious problem for the Russian software industry any more.Some salaries are growing worldwide. In most experts leave Russia, others, on the contrary, cases the increase is at least 5-10% per year. move here from other countries. Multidirectional streams are equivalent in its scope. In 104
  • 105.
    Chapter 5 /Situation on the labor market in Russia and in other countries the recent years the largest Russian software to achieve the growth of IT staff immigration companies demonstrated that they could to the USA to the required value or at least by compete on equal terms for top-managers tens of thousands. It is not difficult to assume with the leading companies of the world. that a considerable part of these visas will be There are still many software developers desiring to go abroad. However only few of intended for Russian programmers. Although a number of countries (for ex- them take active attempts for this purpose. ample, Germany and Finland) did not act for The motives have also changed – they aspire attracting foreign developers actively in the to go abroad not to receive a higher salary in last 2 years, they have the State programs other countries, but to gain new experience providing a simplified naturalization procedure and new knowledge. Thus, return to Russia is for programmers and their adaptation in the not excluded in many cases. new living conditions. Thus, a threat of an increase in Russian developers outflow abroad In spite of the fact that the deterioration of the Russian labor market situation is offset by the still remains. Russia needs to undertake active steps similar problems abroad, the current state of to sustain competition for software develop- things cannot be considered as normal. The ers in the global labor market. It is desirable available huge unused potential of Russia al- not only to create favorable conditions that lows counting on a significant increase of the will prevent brain exodus from Russia, but to country share in the global software market. involve foreign developers more actively to According to Frost & Sullivan, Russia is on Russia. The government has already declared the first place in the world by the number of the necessity to promote attraction of IT- researchers and developers per thousand citi- professionals from the neighboring countries. zens and on the third place by the number of However, it still does not deal with the matter scientists and engineers per million persons, in practice. Probably, it is more reasonable considerably advancing India and China. to attract staff not only from the nearing Russia is also on the first place in the world countries but from the entire world, as well. In by the share of students acquiring technical many countries there is a quite loyal attitude qualifications (according to UNESCO, Federal to Russia. For example, at Indian forums, Statistic Office of Germany).To use this poten- you can read enthusiastic reviews of trips to tial, it is necessary to create more favorable Russia. In addition, European programmers conditions for IT business in Russia. who lost their jobs may be minded to move In the last 18 months American IT compa- to Russia. The global tendencies and the nies became more active in attracting IT-staff crisis phenomena in a number of European from other countries; they lobby for a signifi- countries are such that reasonably massive cant increase in the number of employment immigration of developers does not seem a visas for foreign experts. The first version of fantasy any more. Actually, not a few em- the bill provided an increase in the quota of the ployees from the West European countries H-1B visas from 65 thousand to 110 thou- already work for Russian software compa- sand with an option of further annual increase nies. And it is observed despite the fact that up to 180 thousand with an increment of 10 obtaining employment visas for such experts thousand. However, IT companies requested is an intricate task and the visas should be to extend the quota at least up to 300 thou- prolonged each six months. sand. Experts consider that there is a chance 105
  • 106.
  • 107.
    Chapter 6 /Operating systems Operating systems 76. Commonly used operating systems 2007 1 2 3 4 5 6 7 8 9 10 11 MS Windows GNU Linux family Android Mac OS iOS MS Windows Mobile MS Windows Phone Sun Solaris Open/Free/NetBSD RIM Blackberry Symbian OS T 2008 2009 2010 2011 2012 97% 64% 26% 41% 26% 25% 25% 94% 54% 9% 17% 16% 7% 11% 93% 54% 6% 15% 16% 15% 9% 12% 96% 59% 4% 19% 15% 19% 9% 9% 94% 60% 37% 32% 28% 23% 19% 19% 13% 11% 11% 88% 65% 33% 31% 24% 17% 19% 14% 10% 6% 6% he two most popular operating in comparison with the companies that are systems (Windows and Linux) more geared to the global market. remained on their places, but MS It means that the applications for mobile Windows was mentioned a little devices and Apple tablets are being mainly less frequently and GNU Linux developed now for sale abroad. Still, consid- family – more frequently than the last year. Most ering an important increase in the share of likely, it is not a random fluctuation but a dem- smart phones and tablets in Russia, it is pos- onstration of the regular tendency towards a sible to assume that these systems’ popular- certain expansion of free software in the world. ity will be aligned among the companies with Another trend is an increase in use of orientation towards the Russian market and operating systems for mobile communication devices by the companies that are oriented among exporters. Traditionally, the percentage of the compa- towards the foreign market. There is a con- nies that use mobile operating systems (iOS, siderable lag of demand for mobile applica- Windows Mobile, Windows Phone, Symbian) tions on the part of the companies that are is much higher in St. Petersburg than in other mainly geared to the Russian market. Their cities. audience rating of such operating systems Along with the OSs specified in the table, as Mac OS, iOS, Windows Mobile, Win- the respondents also mentioned QNX and dows Phone, Symbian is much lower than VxWorks (once each OS) and the operating the average figure given by all respondents systems for IBM mainframe (twice). 107
  • 108.
    Chapter 6 /Programming tools Programming tools T he three most popular program- from Eclipse is still considerable but it slightly ming languages remained the reduced during the year. The indicator of MS same: .NET, C/C ++, and Java/ Visual Studio popularity turned out to be the J2EE. The popularity of PHP lowest for all the years of research. has considerably grown in the recent years. Xcode (2%) and Oracle NetBeans (3%) are most often mentioned among the pro- PL/SQL and Perl are almost not used as gramming tools that are not listed in the Table. the main programming languages, but they It should be noted that only a half of the are still mentioned by several companies as respondents specified the programming tools subsidiary languages. Five companies (4%) they use. Apparently, an important potential have also specified 1C embedded program- of improving of the industry’s labor productiv- ming language. ity exists there. MS Visual Studio remains the most popular programming tool. Its breakaway 77. Frequency of mentioned programming languages specified as main tools in 2008-2012, % of respondent companies 2007 .NET (C#) C/C++ Java/J2EE PHP Pascal (Delphi) ruby Python Other Open/Free/NetBSD RIM Blackberry Symbian OS 108 2008 2009 2010 2011 2012 48% 33% 38% 13% 13% 17.5% 36% 21.1% 5.8% 18.4% 21% 46% 22% 8% 18% 24% 38% 20% 9% 9% 25% 25% 7% 11% 9% 12% 6% 9% 9% 41% 36% 30% 9% 3% 4% 3% 18% 13% 11% 11% 32% 30% 23% 16% 7%ц 4% 3% 20% 10% 6% 6%
  • 109.
    Chapter 6 /Programming tools 78. Usage of programming languages which are not considered as main tools, but are applied by the companies in a number of projects, % of respondents 2008 2010 2011 2012 2012 43% 31% 24% 19% 17% 6% 5% 41% 38% 45% 17% 15% 8% 6% 28% 25% 22% 8% 11% 4% 2% 49% 30% 39% 21% 18% 4% 6% 45% 29% 36% 11% 19% 4% 6% 4% 40% 14% 88% 65% 33% 31% 24% 17% 19% 14% 10% 6% 2007 Java/J2EE C/C++ .NET Pascal (Delphi) PHP PL/SQL Perl Python Others Not specified 2009 2008 2009 2010 2011 2012 46% 19% 10% 10% 64% 25% 5% 7% 60% 19% 3% 3% 62% 6% 8% - 45% 16% 9% 2% 36% 15% 4% 1% 79. Most popular programming tools MS Visual Studio Eclipse Intellij IDEA Delphi 109
  • 110.
    Chapter 6 /DBMS DBMS F requency of mention for all DBMSs are developed and supported by Oracle). that are present in the table almost However, Oracle DBMS is still on the second did not change during the year place among the companies with the turnover (the existing fluctuations can be over $4 million, which account for nearly 90% explained by random factors). MS of all respondent companies’ personnel. SQL is still in the lead. On the second place, there is the free MySQL DBMS, which a About 15 DBMSs also mentioned by respondents did not enter the table. MongoDB year ago moved back to the third place the was most often mentioned among them commercial Oracle DBMS (both systems (3 times). 80. Commonly used DBMSs, % of the interrogated companies 2007 MS SQL Oracle MySQL MS Access Firebird PostgreSQL MSDE IBM DB2 InterBase Sybase ASA SQLite IBM Informix SAP DB Sybase ASE Paradox Other 110 2008 2009 2010 2011 2012 82% 69% 68% 49% 19% 31% 27% 33% 18% 13% 8% 18% 9% 13% 12% 66.1% 48.6% 35.8% 14.7% 11.% 11.0% 9.2% 8.3% 7.3% 6.4% 5.5% 5.5% 4.6% 3.7% 1.8% 63% 49% 47% 19% 11% 17% 7% 13% 9% 6% 9% 7% 6% 6% 4% 13% 74% 55% 40% 9% 9% 15% 5% 14% 7% 6% 5% 5% 5% 3% 3% 8% 70% 51% 59% 19% 10% 26% 5% 9% 7% 5% 12% 7% 7% 3% 3% 7% 66% 47% 56% 17% 13% 30% 5% 10% 10% 6% 10% 7% 5% 6% 2% 8%
  • 111.
    Conclusions CONCLUSIONS A ccording to resultsof the year cause of a cyclical nature of the startup’ cre- 2012, the cumulative turnover ation and development process. The software of Russian software develop- vendors of the first wave of startups reached ment industry is considered to the maturity level. Their natural growth within be as high as $9.5 billion (it is their market segments stabilized, while the about 0.45% of the nominal GDP of Russia) next wave of startups have not yet reached and the export reached the value of $4.6 the global players level. billion (that is nearly 15% more than a year In 2013-2014 the growth of IT export before). Industrial software development for from Russia will continue at a speed of about export is conducted on a noticeable level at 15-20% per year. The growth rate of the least in 45 Russian cities. software development outsourcing services’ Export of software development services export, most likely, will remain at the level of increased by 10% up to $2.1 billion, while ex- 2012. Meanwhile the growth rate of export port of licensed software grew by 17% up to of licensed software and that of R&D centers $2.0 billion. The export growth rates of R&D of foreign corporations in Russia will slightly centers of foreign corporations increased in increase. 2012 (largely thanks to the Skolkovo Founda- The total number of staff of software tion activities). The rates went at least up to companies comprised at least 120 thousand 12% and the volume of export reached $500 employees including 18-20 thousand people Million. in the foreign branches of Russian compa- More the service company size is – the nies. Totally, in the companies of all types and higher their export growth ratio is. The largest in the public sector of Russia there are over software development outsourcing service 400 thousand software developers, while 850 providers’ growth reached 20-30% per year, thousand Russian people have programming while the smallest service companies’ export skills (i.e., may be potentially involved in the did not increase at all. The basic reason of industry). the services’ export growth slowdown is the staff shortage in Russia. This year’ survey results first allowed assuming that the gap in the growth of the Export sales of Russian licensed software software development industry between the increased to a lesser extent than in 2011 be- two capitals and regions has been gradually 111
  • 112.
    Conclusions but steadily closed(infrastructure develop- the social tax incentives, the corresponding ments including science and technology figures were 10.5% and 7% (i.e., the growth parks were put into operation; venture and rates were approximately twice lower). If we investment funds came to the regions; assume that the best growth figures were startups got local support). The number of reached thanks to granting the privileges companies outside Moscow and St. Peters- only, the preferential tax treatment led to an burg is growing slightly quicker and new large increase in the Russian software companies’ software development companies grew up to cumulative turnover by $830 million, and to a remarkable level. Conditions for conducting their software export – by $252 million. Hi-Tech business in some regions considerably improved. For the last year Russia improved its Following the results of 2012, the share of Russian software and services in the entire Russian export was 0.88% (a year positions in the various global ratings which ago, it was 0.8%). Most likely, it will grow in reflected the level of IT development and the next years. In Moscow and St. Peters- usage, as well as conditions for conducting burg this indicator is higher than the aver- business. age Russia-wide value – about 2% and 5% The image of Russia abroad as a hi-tech respectively. The software industry provides a country keeps improving. The results of the greater export share than the aircraft industry analysis of the publications devoted to the (aircrafts account for 0.8% of the export) and high technologies’ sector in Russia showed among hi-tech sectors it only concedes to that the share of articles that positively influ- the atomic power industry’ export and to the enced the image of Russia abroad increased arms export. from 57% to 70% within the last 12 months. The share of Russian companies in the Analyzing the share of companies that attracted investments in 2009-2012 we can most well-known and prestigious global IT- note that for the first time after the cor- ratings was kept at the level of 5-8% within responding questions had appeared in the several recent years. Considering that not survey it increased in 2012 (from 9% to 12%). only IT service providers but also BPO service According to the Russian Venture Com- providers are included into the Top-100 pany (RVC) and to PricewaterhouseCoopers world’s best outsourcing companies, we can (PwC), venture investors invested $910.6 mil- honestly say that the share of Russian com- lion in Russian IT companies in 2012, which panies in the Top-100 world’s leading service is 2.3 times more than a year before. IT companies is greater than 10%. The volume of the Russian information The respondents’ general average estimation of the conditions for business existing in and communication technology market (ICT Russia remained the same, as well as a year market) increased by only 1.2% in 2012. The ago. However, by some individual criteria information technology market grew slightly there were significant (multidirectional and more – approximately by 4% according to compensating) changes, which need to be IDC and by 7% according to the Ministry of noted. By the results of 2012, the estimates Telecom and Mass Communications of the increased almost in all criteria that are af- Russian Federation. fected by the government support to the The share of respondent companies that Industry. The only exception is the problem enjoyed incentives in social taxation according of bureaucracy and administrative barriers, to the Federal Law No. 212 of 2010 remained which often considerably reduces the effects at the level of 36-37%. Companies that took of State support. advantage of these privileges increased their As the situation with incentives in social turnover by 26% and their export volume – by 112 taxation to software companies and the 14%. For similar companies that did not use extension of privileges to small companies
  • 113.
    Conclusions cleared up, theshare of respondents dissatis- to the end of 2012. This occurred mainly due fied with the Russian tax system sharply re- to the off-shore development centers that duced (from 66% to 36%) in the last 2 years. have been established or expanded by the Not regular nor significant State support largest companies, as well as (on a second- to the international marketing activities and priority basis) thanks to the Russian higher export still does exist in Russia, but there education institution graduates. emerged hopes that it would be provided to the industry. The USA stopped being the second most Conditions for conducting business for the smallest exporter companies (with the turnover less than $4 million) considerably important market for Russian companies worsened during the last 2 years despite the (after Russia). Russian software developers State stimulation measures to startups. These began to pay more attention to promotion of companies are in a more difficult situation in their services and products in the neighbor- comparison to larger software developers as ing countries of the former USSR, as well as they do not enjoy the social taxation incen- in Africa, in Arab countries, in South America tives. Conceding the competition for employ- and in the South-East Asia. Their orientation ees, they did not increase neither personnel towards Europe and the USA is becoming nor turnover and export. less significant. About one third of Russian software com- The number of companies that are not pressed for acute staff shortage considerably panies have at least one off-shore software reduced. There are 27% of such companies development center (16% of companies have (while in the last several years their number two and more development centers and 7% was at the level of 45%-55%). Due to the of companies have three such centers and staff shortage, the majority of companies more). Most of Russian companies’ foreign actively recruit developers without experience development centers are located in Ukraine. from university graduates. Favorable conditions for software companies The results of this survey obtained within are established there (many experts consider the last 5 years allow us to state that there is that these conditions are better than in Rus- a net increase in the number of software de- sia) and the labor cost is lower than in both velopers (both in absolute and in relative val- Russian capitals. Conditions favorable for mass recruitment ues) who have a good command of English. Their share grew from 65% to 72%. However, of foreign qualified personnel to Russia have the quality of foreign language teaching at arisen in the recent years. Thanks to these universities and schools should be improved changes, business began to look for new to match the software export growth rates. staff not only at the neighboring but also at Small companies and companies located in the far-abroad countries, as well. However at regions primarily experience a lack of English- present the migration policy of the Russian speaking employees. Federation does not promote the inflow of According to the survey of exporter qualified personnel to Russia. Instead, it does companies, the average salary of software not prevent the inflow of migrants who do not developers (including managers) was $2,300 have any labor skills. Russia needs to have a (71,300 rubles) in 2012. It grew up approxi- new legislation which would allow the country mately by 7-8% compared with the previous to be involved in the global competition for year. As the growth of the average salary level highly qualified staff. was 18% in 2011, we can speak of a certain The staff size of the respondent compa- decrease in the staff remuneration growth. nies increased by 14% from the end of 2011 113
  • 114.
  • 115.
    Participants of research Artezio– the Art of Technology Company overview: Founded: 2000 Headquartered: Moscow, Russian Federation Artezio is an ISO 9001:2008 certified software development and consulting company. Over the last thirteen years, Artezio has completed more than 500 projects for its international clients. Artezio's software development services allow its clients to deploy multi-platform applications, thus letting them leverage the power of modern software technologies. This is done with the highest degree of engineering skills in conjunction with clear and transparent communication processes. As a business consulting service provider, Artezio offers technology companies help and expertise in setting up and managing their own offshore/ nearshore software development centers. Since 2005, Artezio is a member and a major offshore division of LANIT group which is a $2.5B IT Services vendor with 5000+ employees. From its development centers Artezio delivers cost effective, high quality IT services to clients in North America, Europe, Middle East and Japan thus being one of the leading Russian offshore software developers. Development centers: Moscow, Saratov, Nizhny Novgorod (Russia); Minsk, Vitebsk, Mogilev (Belarus); Kharkov (Ukraine) Certification: ISO 9001:2008, Microsoft Gold Certified. Industry awards: IAOP Global Outsourcing 100 2006, 2010-1013; Global Services 100 2011, Software 500 2010-2013, the Black Book of Outsourcing 2005. Services: • Custom software development • System integration • Technology consulting • Software quality assurance and control • Offshore development center setup • Support and maintenance and operate • Business Analysis and Consulting • IT outstaffing Corporate solutions: Custom software: Mobile, Web and desktop applications; Multi-tier distributed solutions; SaaS, IaaS, PaaS; e-learning; CRM. Portal&Collaboration: JBoss; Liferay; Oracle; IBM; Microsoft SharePoint; NewsGator; Drupal. Integration platforms: IBM WebSphere ESB; Oracle Fusion Middleware; JBoss ESB; Apache ServiceMix; Spring Integration; BizTalk. BI: Oracle BI; Microsoft BI; Pentaho BI; JasperSoft. Document workflow: Microsoft SharePoint; IBM FileNet; Alfresco; Landocs. Business solutions: Microsoft Dynamics CRM; Microsoft Dynamics NAV. Mobile platforms: iOS, Windows Mobile/Phone, Android. Technological profile: Operation systems: Microsoft Windows; Linux; FreeBSD; IBM AIX; Sun Solaris; HP-UX. Development platforms: Java, J2EE; Microsoft.NET; Windows API; Cocoa; L.A.M.P. Programming languages: Java; C/C++; Objective C; C#, VB.Net; PHP/Perl/Python; Scala. Application servers: IBM WebSphere; Oracle AS, WebLogic Server; JBoss AS; Apache Tomcat; Microsoft IIS. Databases: Oracle; Microsoft SQL Server; IBM DB2, Informix; MySQL; PostgreSQL. Methodology: WF, RAD, RUP, Agile (SCRUM). In-house software products: iVizart – cloud on-line visualization tool; Artezio Kanban Board – plugins to simplify project management in Attlasian JIRA and MS Outlook; MinutesPad – professional mobile app for meeting minutes management; Travel Stories – travel planning mobile app; iLikeSlide – app to create and demonstrate Instagram slideshows. Industry focus: Core: Healthcare/Pharmaceuticals/Bio-tech/Life Sciences, Finance/Banking, Telecommunications, Hi-tech. Emerging: Transportation/Logistics, Retail, Entertainment/Media, Education, Governmental, Gas and Oil. http://www.artezio.com, http://www.artezio.ru info@artezio.com, sales@artezio.com Phone: +7 495 981-0531 Fax: +7 495 232-2683 115
  • 116.
    Elite Software R&DServices Since 1990 Company overview: Founded: 1990 Headquartered: Moscow, Russia Auriga (www.auriga.com), a software R&D services provider, enjoys one of the highest customersatisfaction ratings worldwide (top 20 across outsourcing industries and #1 in engineering services). The list of services provided covers all aspects of software product engineering and a broad range of knowledge areas from embedded and mobile software to enterprise and Web apps. Due to the appropriate size of the company for software R&D tasks, its client list consists of both established industry leaders and fast-growing start-ups, including IBM, Draeger Medical, Datascope, Chrysler, Barclays, Sberbank Russia, Yandex, LynuxWorks, Pigeon Point Systems, and many others. Founded in 1990, Auriga was the first Russian company to provide software R&D offshore/ nearshore services to EU/US customers. In its work, Auriga focuses on soft factors — communications, flexibility, mindset, and culture — in addition to technology expertise. The company has been consistently included in the Global Services 100, Global Outsourcing 100, and other global industry ratings. In 2011, Auriga was named #1 Engineering Services Outsourcing (ESO) provider worldwide by Datamonitor, ahead of such names as Wipro, Siemens, Capgemini, IBM, and others. Engineering Locations: 4 development centers in Russia (2 in Moscow, N. Novgorod, Rostov-on-Don), +1 in EU (Vilnius, Lithuania) Industry Standards: CMMI Level 4, ISO 9001, SPICE, DO-178B, ISO 13485 Domain Verticals: high-tech, Telecom, Mobile, Healthcare, Finance, Information security, Enterprise, Computer SW, Education, Government, Automotive and more Major Clients: IBM, Draeger Medical, Chrysler, Sberbank Russia, Yandex, LynuxWorks, Pigeon Point Systems, HomeCredit, IBM, CROC, iMind, onMobile, etc. Services: • Software Product Engineering and ADM • Custom Software Development • Product Maintenance • Re-engineering and Porting • Customization and Integration Technologies & Platforms: • Embedded devices (ARM, PowerPC, Intel, FPGA…) • Real-time systems (VxWorks, QNX, ThreadX, pSOS, eCos, LynxOS) • Linux (server, desktop and embedded), UNIX, Windows internals. • Mobile (Android, iOS, Symbian, RIM BlackBerry, Tizen, Windows Phone) and Connectivity (GSM, 3G, GLONASS, Bluetooth, WiFi, WiMax) • Enterprise applications: Workflow, document and content management (EMC Documentum and other), CRM systems. • Web services, high loaded distributed applications • .Net and Java platforms for portals (SharePoint, Liferay, IBM WebSphere), web and desktops application development • Databases (MS SQL, Oracle, DB2, Sybase, MySQL) • Multimedia streaming: multiplexing/de-multiplexing, realtime transcoding, optimization for mobile devices, face recognition • Geolocation and Geopositioning (LBS, GPS, GSM, NFC, SS7) • Software Testing and QA • Product Support • Technology Research and Consulting Awards: • In Global Outsourcing 100 (rating by IAOP) since 2008. In 2013 listed among best in healthcare, high-tech industries, R&D services, Russia region. • In Global Services 100 (by Global Services Media and neoIT) since 2006. The company is ranked among the “Top 10 Service Providers: Eastern Europe”. • In The Black Book of Outsourcing (by Datamonitor) с 2006. In 2011 Auriga is ranked the No. 1 Engineering Services Outsourcing (ESO) provider worldwide. In 2010 Auriga was named #15 in the prestigious “Global Top 50 Vendors” list. In previous years the company is named No. 3 in the list of IT Outsourcing Vendors in Central/Eastern Europe and No. 6 in the list of Global Software QA & Testing. • Auriga is included in overall Top 20 of software R&D service providers and in Top 10 among the companies serving Software industry, in a 2009 ranking of service providers in India, China, Russia, Ukraine & CEE by Zinnov Management Consulting, a leading management consulting firm • Microsoft Silver Partner in Application Development since 2010 http://www.auriga.com info@auriga.com 92 Potter Rd, Ste. 1 116 Wilton, NH 03086, USA Phone: +1 (866) 645-1119 Fax: +1 (603) 386-6097
  • 117.
    Participants of research Founded: 1996 ConfirmitLtd. Company overview: Headquartered: Oslo, Norway Confirmit is founded in 1996, the world’s leading software vendor for Voice of the Customer, Voice of the Employee, and Market Research. Using the feedback received from customers and employees, helps to streamline business processes and make targeted investments to improve customer loyalty and increase profits. 10 offices placed in Norway, the UK, Russia, Germany, USA and Canada. Customers include Barnes Research, Best Buy, British Airways, British Standards Institute (BSI), Dow Chemical, Farmers Insurance, GlaxoSmithKline, Halifax Bank of Scotland, Hoffman LaRoche, HSBC, Ipsos, Marketo, Nasdaq, Nielsen, Office Depot, The NPD Group, Royal College of Surgeons, Symantec, Wells Fargo, WorldOne, etc. Development centers: Moscow, Yaroslavl Expertise: Voice of the Customer, Market Research Employees: 300 Industry: Software development Programming languages: C#, JScript Technology: Scrum Web-server: IIS OS: Microsoft Windows Server Awards: • 2013 TMC Labs Innovation Award from CUSTOMER Magazine • 2013 CRM Excellence Award • 2012 Product of the Year Award from CUSTOMER magazine Data base: MS SQL Server • 2012 Customer Magazine Innovation Award • 2012 TMC Labs Innovation Award • 2012 CRM Excellence Award, Customer Interaction Solutions • 2012 Service Leaders Enterprise Feedback Management • Leader in The Forrester Wave™: EFM Vendors, Market Insights Platform Providers, Q3 2011 www.confirmit.ru Ru.info@confirmit.com +7 495 7855185 117
  • 118.
    Global presence: USA, EU,Russia First Line Software Company overview: First Line Software is a premiere provider of custom software development and technology enablement services to industry leaders and growth companies around the world. We maximize business value for clients by coupling our highly effective development processes and technology talent with a comprehensive professional services portfolio, helping our customers accommodate new business and open up new markets. First Line’s customers benefit from our almost two decades of experience and deep expertise in building, operating and growing highly productive software development teams. We serve a variety of clients from different industries and geographies, from North America and Europe to Southeast Asia. Although we specialize in helping software product vendors, we can work with any firm whose business is enabled by or greatly relies on software Services: • Product development: technology • Technology enablement: integration, • QA and testing: Test process audit, research and selection, product implementation and customization test coverage analysis, test strategy design, specification and mock-ups, services development, test execution, test prototyping, full cycle development, • Custom application development: automation component design and integration, feasibility and requirements analysis performance engineering, customizafor business case, application design, tion and enhancement, porting and development, and implementation, migration, deployment, support and systems integration/consolidation, remaintenance engineering, performance tuning and porting services Areas of expertise: • ECM • WCM • BPM • Loyalty & digital marketing 118 • Cloud computing • Enterprise portals • Business Intelligence www.firstlinesoftware.com sales@firstlinesoftware.com +1 (877) 737-7178
  • 119.
    Participants of research Founded: 1993 EPAMSystems, Inc Company overview: Global headquarters: Newtown, PA, USA EPAM Systems, Inc. (NYSE:EPAM) is a leading global software engineering and IT consulting provider with software development centers throughout Central and Eastern Europe. Headquartered in the United States, EPAM employs over 9,000 IT professionals and provides services to clients worldwide using a global delivery model through its client facing and delivery operations in the United States, Belarus, Hungary, Russia, Ukraine, UK, Germany, Kazakhstan, Sweden, Switzerland, Poland, and Canada. EPAM’s core competencies include complex software product engineering for leading global software and technology vendors, as well as development, testing, maintenance, and support of mission critical business applications and vertically oriented IT consulting services for Forbes Global 2000 corporations. The company has always focused on providing distributed application development services across multiple sites. As such, our entire core processes and systems (quality systems, management processes, software development tools, build management, etc.) have been designed, implemented, and proven over the last 18 years to support this delivery model. Certified as compliant with ISAE 3000 Type 2 and CMMI Level 4 standards, EPAM’s experience is backed by financial strength, security & IPR protection, maximizing quality, efficiency and scalability of the company operations while minimizing risks. Development centers: Russia, Ukraine, Belarus, Poland, Hungary, Kazakhstan IT Headcount: 9000+ Services: • Software product engineering and custom development • Project-based technology consulting • Application Testing, Maintenance and Support • Application Migration and Reengineering Practice areas: • ISVs and Technologies • Banking & Financial Services • Business Information & Media • Travel & Consumer • Emerging Verticals Technology focus: • SAP NetWeaver (xApps, Web Dynpro, EP, BW, BI, XI, MDM) • Business Intelligence (IBM, Microsoft, Oracle) • E-Commerce (ATG) • Content Management (Adobe CQ, EMC Documentum, OpenText, Microsoft SharePoint) • Mobile (iOS, Android, Blackberry, Windows Mobile) • Cloud (VMware, HP, Microsoft, Amazon) • NET (ASP.NET, Win Forms, WPF, Silverlight) • Java EE (SOA, ESB, Web & Rich Client Applications, Grid) • DBMS (Oracle, MS SQL Server, Sybase, MySQL) • Embedded SW development (OSE, VxWorks, LynxOS, Reliant (pSOS), QNX, Linux, HP-UX, Solaris, Windows NT 4.0 Embedded) Partial customer list: Adidas, The Coca-Cola Company, Viacom/MTV Networks, Expedia, Schlumberger, Renaissance Capital, Moscow Exchange, SAP, Microsoft, Oracle, UBS AG, Sephora Awards Forbes: EPAM is ranked #6 on the Forbes “America’s 25 Fastest-Growing Tech Companies” The 2013 Global Outsourcing 100— EPAM included in the Top 30 outsourcing providers in IAOP’s (International Association of Outsourcing Professionals) list. CRN 2013 Solution Provider 500: EPAM has been recognized by UBM Tech Channel as a part of CRN’s 2013 Solution Provider 500 list, which identifies the top technology integrators in the U.S.A. and Canada www.epam.com www.epam.com 41 University Drive Suite 202 Newtown (PA), 18940, USA 119
  • 120.
    Founded: 1991 ICL Group Company overview: Headquartered: Kazan, RussianFederation Global Delivery Centre (GDC) – is a business unit of ICL group of companies delivering comprehensive outsourcing services in application development, support and maintenance and remote infrastructure management for international and global customers. GDC employs more than 700 specialists, has over 100 Customer, and completed over 250 major projects. Our services help Customers achieve their business goals –increase enterprise growth, reduce enterprise costs, improve business processes, implement and update business applications, update IT infrastructure, improve enterprise efficiency, business continuity and security. GDC adopted Fujitsu methodologies and processes in providing outsourcing services and is preferred supplier of services to Fujitsu. Development centers: Kazan, Voronezh Certifications: ISO 9001:2008, ISO 27001, ISAE 3402 Type II (SAS70) Supported industries: Retail, Logistics, Manufacturing, Financial services, Automotive, Telecommunications. Provided services and technical expertise Application Development and Integration • Bespoke development using Java (J2SE, J2EE, J2ME), Microsoft (MS .Net Framework, MOSS, MSF), Oracle (Oracle Database and Application Server, BI, Portal, SOA, BPEL, RAC) and Mobile (iOS SDK, Cocoa Touch, Objective-C, Android SDK, Windows Phone 7/8, Silverlight) Technologies • Application Re-design and reengineering (SOA, Web-services), legacy modernization (old ORACLE and MS, PHP, Cobol, Progress, Delphi) • Application Integration using enterprise solutions (Sonic ESB, Sonic MQ, Apache Camel, MS BizTalk, Azure) • Independent testing (ISEB-certified team providing test management, test planning and design, test data and environment preparation, test automation) Complex Remote Infrastructure Management and Implementation • Design and implementation of infrastructure solutions • Managed Data Center • Managed Server (UNIX, WINTEL, E-Mail, Enterprise Management, Virtualization, Databases, IT security, etc) • Managed Storage (NetApp, EMC, Backup/Recovery, etc) • Managed Networks (LAN, WAN, VPN, DSL, Networ Security etc) • Managed Workplace (Remote Desktop Management, Software Delivery, Image Management, Application Packaging, Virtualization and Testing) • Multilingual Service Desk Application Management • Application transition, support and maintenance • Reengineering, replatforming, application innovation Business Process Automation • Automated process discovery (Fujitsu APD tool) • ITSM consulting & automation (e.g. ServiceNow, OTRS) • BP consulting & automation (e.g. Business Studio, Nintex) www.icl.ru/gdc info@gdc-services.com 34 Sibirsky trakt, Kazan, 420029, Russia Tel. (843) 2795294 120
  • 121.
    Participants of research Foundationdate: May 2003 ISS Art, LLC New Vision – Best Solution Company overview: Headquarter: Omsk, Siberia, Russian Federation Information Service Systems Art, LLC has been rendering custom software development and support services in Russia and abroad for more than 10 years. We constantly improve our processes to achieve customers’ business goals within shorter terms and optimal budget. ISS Art believes its important task is to build close and trust-based relations with its partners and customers, which allows performing quality product as a result complying with the customer’s requirements. Our tools are absolutely clear for the customer’s representative at any stage of the project. We fundamentally observe laws and ethical business practices. We also care about employees’ professional growth. The company provides a teaching program enabling the employees to improve their skills and increase the quality of product. As a result comes a high quality product developed using modern technologies and business processes. The reward for our efforts is 75% repeat customers. Our aim is to ensure your project’s success. Development centers: Omsk, Krasnoyarsk (Russian Federation) Quality standards: ISO 9001:2008 Industry focus: IT, social sphere, education, media Founder: NPO “Siberian IT-cluster” www.itsiberia.ru, Social media “ISS Art Media” www.issartmedia.ru Services: • Custom software development (architecture design, development, integration and maintenance) • QA services • IT consulting • Dedicated development centers Area of expertise: • Information systems • Mobile solutions (iOS, Android) • Web and desktop applications • Science-intensive projects (R&D) Technologies: • Desktop Applications – .NET, • Mobile Applications – iOS, C++, Java Android, Windows Mobile, • Web Applications – PHP, Java, BlackBerry, Bada ASP.NET; Javascript, XHTML, • Databases – MS SQL, MySQL, HTML 5, CSS; PostgreSQL, NoSQL. www.issart.com info@issart.com Tel +7 3812 909 808 +1 (415) 729-3933 121
  • 122.
    Founded: 1991 Reksoft Company overview: Headquartered: St. Petersburg, RussianFederation Reksoft is a software engineering service provider headquartered in St. Petersburg, Russia, and having local offices in Germany and Sweden. More than 20 years Reksoft delivers high quality software engineering and integration services and end-to-end solutions for telecom, financial & banking, public and cross-industrial sector. The company counts more than 380 employees. Citi Bank, Ascom, Aastra Telecom, Comverse, Dirol Cadbury, Fujitsu Technology, FXDD, Infor, Mavenir Systems, Mazda, Philip Morris, Sicap, Springer Business+Science Media, StoraEnso, Swisscom Mobile, Tieto and T-Systems are among Reksoft’s clients. Development centers: St. Petersburg, Voronezh Offices: Moscow (Russia), Munich (Germany), Stockholm (Sweden) Employees: 400+ Recognition: The 2012 Global Services 100 list, the 2012 top 100 Russian employers list by HeadHunter Services: • Software Engineering • Enterprise application services (devel- • Dedicated development centers opment, support, migration & integration, application management) Industry expertise: In more than 20 years of business, we have accumulated software development experience across a wide range of sectors, including high technology, telecommunications, financial services, media, hospitality and travel and manufacturing. Quality: Reksoft appraised at Level 5 of the CMMI Institute’s Capability Maturity Model Integration (CMMI). All business units took part in appraisal: departments of financial, telecom, public sector and cross-industrial projects Reksoft is the first company from Russia and CIS rated at maturity level 5 according to the CMMI-DEV v1.3 model. Appraisal details available at https://sas.cmmiinstitute.com/pars/pars_detail. aspx?a=20167. Partnership: Reksoft collaborates with Microsoft, Oracle, EMC, IBM, Adobe and other global IT companies. 122 www.reksoft.com rfi@reksoft.com
  • 123.
    Participants of research Wethank participants of research Adept www.gk-adept.ru info@gk-adept.ru +7(831) 464-9777 Year of Аoundation Headcount Programming Languages 2002 20 Nizhny Novgorod, Russia C++ The group of companies Adept is a successful Russian IT company - a leading developer and supplier of software for the construction industry - provides a full range software services, from development and implementation to training and consulting. Today Adept employs more than 130 professionals, has offices in Moscow, St. Petersburg and Nizhny Novgorod and is connected with all major Russian cities trough more than 130 authorized distributors. Alditek www.alditech.ru web@alditech.ru +7(496) 773-6220 Year of Аoundation Headcount Programming Languages 2006 15 Puschino, Russia C, C++, VHDL, Verilog ALDITECH Limited offers its customers a completed cycle of hardware and software development: from technical specifications development prior to real sample of the developed product release. Major activities are: Research and Development; FPGA design and electronic circuit design; Mathematical modeling; Embedded and application software development; Machine vision and image processing; Biotechnology systems development; PCB design. ALT Linux www.altlinux.ru org@altlinux.ru +7(495) 662-3883 Moscow, Russia Year of Аoundation Headcount Programming Languages 2001 37 PHP, Python, Python, Scheme ALT Linux operation systems ALT Linux releases operation systems since the day of its foundation in 2001. before the foundation its developers developed free operation systems, for instance, within the IP Labs Linux Team project. This is how you can explain success of a new company which managed to join efforts of over 150 dvelopers from across the planet.Operation systems by ALT Linux are result of collaboration of its developers and users. ANCUD www.ancud.ru marketing@ancud.ru +7(499) 731-0000 Year of Аoundation Headcount Programming Languages 1991 80 Moscow, Russia C++, C ANCUD Limited Liability Company is a well-known Russian designer and manufacturer of hard- and software for cryptographic protection of information. It was established in 1991. ANCUD engages in a full Hi-Tech product cycle from development of its own component base to providing complex solutions. Main Activities: Design of encryption hardware and software for cryptographic protection of information; Design and manufacturing user acceess control system; Custom design of microprocessor components and electronic hardware. APM Research and Development Centre LLC www.apm.ru com@apm.ru +7(498) 600-2530 Year of Аoundation Headcount Programming Languages 1992 30 Korolev, Russia C++, .NET Research and Software Development Center APM was founded in 1992 and specializes in software development for machine elements and units, mechanisms, structures design. The main product of our company is CAD/CAE software system APM WinMachine intended for machine elements calculation and design. Our software contains methods for strength, stiffness, longevity calculation. Some of methods, implemented in WinMachine for non-ideal machine element calculation have no analogues in the world. 123
  • 124.
    Arcadia, ZAO www.arcadia.spb.ru info@arcadia.spb.ru +7(812) 610-5955 Yearof Аoundation Headcount Programming Languages Saint Petersburg, Russia 1993 195 MS .NET, С#, MS SQL, C, C++, Objective-C, Java, MS Silverlight, HTML5, MS SharePoint, Android, iOS Custom development of business applications, re-engineering of legacy software and data migration; dedicated teams (offshore/nearshore development centers). Vertical expertise: education & e-learning, HRM, workflow & business process automation (BPA), ECM, financials & accounting, insurance automation, pharmaceutical data warehousing, information security. Our engineers have great experience in development of large-scale, high-performance information systems — desktop solutions, web applications (RIA, intranet, collaboration portals), and mobile apps (Android, iOS, Windows Phone) for business. ASV www.asv.ru info@asv.ru +7(342) 222-4444 Year of Аoundation Headcount Programming Languages 1994 30 Perm, Russia C++, Java Created in 1994, JSC ASV is Russia's leading developer of highly technological solutions for the telecommunication business automation. Over 50 Russian telecommunication companies are quite successfully using JSC ASV's solutions, profiting from their reliability, scalability, availability, low operating costs and simplicity of servicing. JSC ASV has been able to develop a unique technology to implement and support its own solutions, thus being able to make more than 50 installations in the lines of three regions in the Republic of Kazakhstan in 1998, including the largest city of Alma-Ata, in Kazakhtelecom JSC. Asys Soft www.asys.ru asys@asys.ru +7(499) 645-5364 Year of Аoundation Headcount Programming Languages 1996 10 Zelenograd, Russia C#, PHP, Java ASys has been developing information systems for enterprise management for more than 15 years. Over this period the company has worked out a specific approach to information systems building on the basis of a single model that is able to reflect any kind of activity in an organization. ASys creates information systems on the basis of a single model. These information systems allow gradual elimination of 'information system zoos'. In the nearest future you will be able to build business models of your operations and manage them on the basis of ASys platform. Autosoft www.autosoft.ru info@autosoft.ru +7(343) 267-2938 Year of Аoundation Headcount Programming Languages 1997 15 Yekaterinburg, Russia .NET, PHP, Delphi AutoSoft Company, Ltd. is one of the leading developers of the specialized software for business-processes automation at the enterprises of automobile and allied industries. AutoSoft carries out the activity in the market of computer technologies for the domestic autoindustry since 1997 year, being one of the pioneers in this area. For this time the company saves up a wide experience which helps it with goals achievement, namely: in development of high-quality products and competent, fast introduction of the systems on the various enterprises. Bee Pitron www.beepitron.com all@beepitron.com +7(812) 740-1800 Year of Аoundation Headcount Programming Languages 1993 Saint Petersburg, Russia 214 Engineering and manufacturing of EWIS for transportation. Implementation of PLM (Dassault), CAM, project management systems (1C ERP) 124
  • 125.
    Participants of research Capital-Soft www.mmtt.ru e@mmtt.ru +7(495)766-0867 Year of Аoundation Headcount Programming Languages 2008 5 Moscow, Russia C++, Delphi Capital-Soft is a successor to Management Technology company, established in mid-2001 by a team of professionals in the field of accounting and software development in order to develop a range of commercial software solutions for accounting management. We offer a retail product that helps small and medium-sized companies to solve most of the problems in the area of accounting management. The application "Capital" is designed to maintain a unified automated records of all transactions and actual cash flows. CN-Software www.cn-software.com support@cn-software.com +7(816) 260-3500 Year of Аoundation Headcount Programming Languages 2005 15 Veliky Novgorod, Russia Java, C, PHP CN-Software Ltd. was registered in August, 2005; however, the history of our company (known as CN-Software.com) started in 2002, when the first copies of CNSearch - the search system for web-sites - had been sold. That was the time when the core of our team, aimed at web-site software development, formed. Later, the number of our software products increased. Some of our developments are now presented as software products. Compass www.compas.ru market@compas.ru +7(812) 327-7429 Year of Аoundation Headcount Programming Languages 1991 80 Saint Petersburg, Russia C++, C#, .NET Compass company is one of the leading Russian software vendors. It develops ERP system of the same name. Company suggests licenсes of ERP system "Compass" and its separate subsystems (CRM< HRM). Besides it suggests services of software implementation and suppport, development of specialized sotware applications and industry solutions for operation of business. Company implemented hundreds of solutions during the time of its existance since 1991. COMPETENTUM www.competentum.ru info@competentum.ru +7(495) 514-1100 Year of Аoundation Headcount Programming Languages 1993 100 Dolgoprudny, Russia C#, Javascript, HTML5 Competentum is a group of international companies that operates in the global e-Learning market in Russia, Europe and the USA. We offer a full set of innovative proprietary e-Learning products as well as high-level consulting, software and e-content development services for both academic education and professional training. Comtec - systems for business Co Ltd. www.comtec.ru comtec@comtec.ru +7(495) 544-2552 Year of Аoundation Headcount Programming Languages 1990 14 Moscow, Russia Sybase PowerBuilder, C++ Comtec Systems for Business, Ltd. specializes in the development and implementation of enterprise management systems. The 9th generation of the product named Comtec for Business is a full-fledged ERP-system that inherits all the advantages of the previous versions and adds new services and functions for the customers. Based on clientserver architecture it is aimed at ERP solutions for SMB in various activities - manufacturing, retail, wholesale trade and service. It is oriented on top managers, accountants, warehousemen, sales managers, analysts. 125
  • 126.
    CSI International Software www.trace.ru csi-software@trace.ru +7(812)252-0412 Year of Аoundation Headcount Programming Languages 1997 10 Saint Petersburg, Russia Java CSI International Software Ltd. Is software developer company working in the field of bespoke solutions for Software projects. Our company started its business activity in 1997. The main directions of our activity are Internet catalogues & directories; E-commerce; Portal solutions; Transport logistics; Interactive Internet services; Vehicle Tracking Systems; Corporate Informational Systems; CRM systems; Internet Mapping Service; Mobile solutions; Security systems. DataArt® www.dataart.com info@dataart.com +1(212) 378-4108 Year of Аoundation Headcount Programming Languages 1997 850 New York, USA .Net, Java, C++, iOS, Android DataArt is a custom software development firm that builds advanced solutions for the financial services, healthcare, hospitality and other industries. Combining domain knowledge with offshore cost advantages and resource flexibility, DataArt develops industry-defining applications, helping clients optimize time-to-market and minimize software development risks in mission-critical systems. With an unrivaled talent pool of highly skilled software engineers in New York, London, Russia and Ukraine, DataArt provides the technical skill, accountability and industry knowledge. Digital Design www.digdes.ru info@digdes.com +7(812) 346-5583 Saint Petersburg, Russia Year of Аoundation Headcount Programming Languages 1992 377 C#, Objective C , Java, VB Script, JavaScript Digital Design renders full range of services for business automation, including mobile solutions, electronic content management systems, corporate portals, infrastructure solutions, custom software development. e-Legion www.e-legion.com sales@e-legion.com +7(812) 324-2724 Year of Аoundation Headcount Programming Languages 2005 70 Saint Petersburg, Russia Java, C# e-Legion is a Russian company founded on November 2, 2005. The company provides software development services with a 7-year experience in this field. The company’s primary business activity is software development for the following mobile operating systems: iOS, Android, Windows Phone and Windows 8. Also we work with web-development and business processes integrated automation. e-Legion has accomplished various projects for such companies as Yandex, Mail.Ru Group, BMW, KFC, Stanford University, Ginza Project, i-Free, Reget Software, Solaris Development and others. EMC / Russia COE www.russia.emc.com/CoE maria.melnichenko@emc.com +7(812) 325-4633 Year of Аoundation Headcount Programming Languages 2007 275 Saint Petersburg, Russia C, С++, С#, Java, .Net EMC builds information infrastructures and virtual infrastructures to help people and businesses around the world unleash the power of their digital information. EMC offerings in backup and recovery, enterprise content management, unified storage, big data, enterprise storage, data federation, archiving, security, and deduplication help customers move to and build IT trust in their next generation of information management and enable them to offer IT-as-a-Service as part of their journey to cloud computing Enterra Holdings, Inc www.enterra.ru salesteam@enterra-inc.com +7(385) 256-7295 Barnaul, Russia Year of Аoundation Headcount Programming Languages 2001 80 .NET, C#, Java, PHP, C++, Objective C, Delphi Enterra is a software development company that provides high-end application development and design as well as product engineering based on technical expertise of over 60 software developers in our staff. Enterra representative offices in USA (Tampa), Germany (Schwetzingen), Russia (Moscow, Barnaul) provide you with the confidence and simple way of work with us in your area. Our development centers in Russia and Ukraine staffed with technical professionals provide you with top quality software that meets your specification. 126
  • 127.
    Participants of research ETNASoftware www.etnasoft.com info@etnasoft.com +1(855) 779-7171 Year of Аoundation Headcount Programming Languages 2002 140 New York, USA C#, Java, C++ ETNA Software is a technology solutions provider for financial markets and has been operating internationally for more than ten years. ETNA Software creates custom trading software for all asset classes and technical analysis systems for financial market start-ups, technology firms, retail brokers, market makers, exchanges and individual traders. Leveraging nearshore or offshore outsourcing allows company clients to optimize project budgets, reduce expenses and maximize both, fiscal and organizational goals. Major company clients are Saxo Bank, SogoTrade and ChoiceTrade eVelopers Corp www.evelopers.com info@evelopers.com +7(812) 324-3211 Saint Petersburg, Russia Year of Аoundation Headcount Programming Languages 1999 60 J2EE, JavaScript, HTML, Ext-JS, Ext-GWT, GWT, PHP, JQuery, DoJo, Flash, Flex eVelopers™ is a software development, consulting and outsourcing company. We serve customers worldwide by designing and building complex solutions that integrate with back end systems, using open source components when appropriate. Founded in 1999 as California Corporation, eVelopers maintains presence in Silicon Valley and a global development center in St. Petersburg, Russia. Businesses and organizations of all sizes, including Fortune 500 companies use eVelopers as extension of their IT team to become cost effective and more responsive. Exigen Services www.exigenservices.com info@exigenservices.com +7(812) 702-5115 San Francisco, USA Year of Аoundation Headcount Programming Languages 2000 1500 Java/ JavaEE, .Net, C#, C++, PHP Exigen Services is a global IT company that provides core systems transformation services to clients in the Insurance, Financial Services, Telecom and Media industries as well as offshore development services to Commercial Software Solution providers. Together, Exigen Services and its clients manage project risk and focus on maximizing the value delivered throughout the project lifecycle. Centers of Excellence for industries and technologies and a global network of delivery teams are located across Eastern Europe, Baltic states, Russia, China and the U.S. IBA Group www.ibagroupit.com info@ibagroupit.com +375(17) 217-3952 Year of Аoundation Headcount Programming Languages Prague, Czech Republic 1993 2705 Enterprise applications, SAP, Mainframe and Multiplatform C++, VC++, Java, Cobol, PL/1, RPG/400, ABAP/4, Fortran, Forth, Basic, Pascal, Smalltalk, Lisp, PLX, ADA, Prolog, Modula, Natural, Assemblers for different platforms.Scripting Languages Lotus/Java/VB Scripts, Unix Shell, REXX, Perl, PHP, and JCL. IBA Group is one of the largest IT service providers in Eastern Europe performing onshore, near–shore and offshore projects with 2,500+ professionals. Headquartered in Prague, Czech Republic, IBA Group has offices in the US, Great Britain, Germany, Cyprus, Bulgaria, Russia, and Ukraine and software development centers in the Czech Republic, Belarus, and Kazakhstan. IBA was founded in 1993 as a software development company located in Minsk, Belarus. Today, IBA is an international group that serves customers in more than 40 countries across diverse markets and industries. IFS www.ifs-company.com sales@ifs-company.com +7(843) 200-0548 Year of Аoundation Headcount Programming Languages 2010 12 Kazan, Russia C#, C++, .NET, PHP IFS Company is your safe and reliable partner in IT services and software development. We have rich experience in software for retail brokerage companies, we know the brokers’ needs and needs of their clients. Our goal is to help our customers to grow by improvement and upgrade their IT frontend and backend tools. 127
  • 128.
    InfoShell www.infoshell.ru info@shell.ru +7(495) 792-9235 Year ofАoundation Headcount Programming Languages 2009 25 Saint Petersburg, Russia PHP, Java InfoShell provides iPhone (iPad), Android, Windows phone and BlackBerry applications development. We create software of any complexity: Information applications; Promotional applications; Games and entertainment systems; Comprehensive solutions: website integration, intranet integration; Integration with CRM, ERP and accounting systems; Development of business management systems for iPad tablets; Any other application based on your ideas. InfoWatch www.infowatch.com info@infowatch.ru +7(495) 229-0022 Moscow, Russia Year of Аoundation Headcount Programming Languages 2003 150 С++, С#, C, PL, SQL, perl, bash InfoWatch is a group of innovative technology companies focused on developing and providing cutting-edge comprehensive technologies and services dedicated to Data Loss Prevention & Protection, Intellectual Property Protection, Customer Experience and Reputation Management, as well as Risk Management and Compliance solutions. Inostudio Solutions www.inostudio.com info@inostudio.com +7(863) 432-0318 Year of Аoundation Headcount Programming Languages Taganrog, Russia 2006 71 ASP.NET, MSSQL, iOS, C#, PHP, Android, Oracle, MySQL, Sharepoint, Windows Phone Inostudio Solutions is a professional software development company. We adhere to international standards and provide clients with high-quality products. Three facts about us: 1. We always act as partners suggesting the best solutions, minimizing costs, making things going right, working on solving your business problems not just creating software. 2. We are always around and ready to help you: no communication gaps, disappearances and misunderstandings. 3. We have very professional team and create reliable software providing a lifetime warranty for our software products. Inotech www.inotechgroup.ru info@inotechgroup.ru +7(812) 314-7694 Year of Аoundation Headcount Programming Languages 2000 15 Saint Petersburg, Russia Delphi Inotech company, software developer for telecom operators, was created in 2000. We are engaged in the implementation of integrated OSS / BSS solutions, system and application software, supplies the equipment, commissioning works, maintenance and development of products, staff training, audit and consulting on telecom market. The main product of the company is replicable, universal, converged automated billing system Platex® of the high functional level. Inside www.inside.ru info@inside.ru +7(495) 542-8808 Moscow Year of Аoundation Headcount Programming Languages 1997 50 PHP, Html, Css, Javascript, Ajax, jQuery, Perl, C The Internet agency "Inside" – is a leading developer of solutions in the area of software development, corporate style, web design, online advertising, e-commerce. Since 1997 our staff is a well-organized team of professional analysts, marketers, managers, artists, designers, programmers, translators and copywriters. Projects with real return are our profession, we are not limited in the development of a web resource on the Internet market, we are focused on longterm services for large corporate clients. 128
  • 129.
    Participants of research KBPanorama www.gisinfo.ru kb@gisinfo.ru +7(495) 739-0245 Moscow, Russia Year of Аoundation Headcount Programming Languages 1991 50 C++, C, C#, Java, Delphi, Perl, .NET, PHP Closed joint-stock company KB "Panorama" is formed in 2001 by association of the existing enterprises and divisions with the group of software developers "Panorama" known since 1991. The main activity of Joint-Stock Company KB "Panorama" is the development of geoinformation systems and technologies that are used by federal agencies, municipal services, agencies working with the land and real estate, road organizations, committees on architecture and construction, etc. Result of long-term activity of our company – more than 18 thousand users across Russia and abroad. Kentor www.kentor.ru spb@kentor.se +7(812) 325-1300 Year of Аoundation Headcount Programming Languages 1983 33 Stockholm, Sweden С#, Java, .Net, Oracle Kentor provides custom software development and IT consulting for the clients in the areas of telecommunications and electronic commerce, government and public organizations. High quality of our services is confirmed by the feedbacks from our customers, many of whom have been cooperating with us for more than 10 years. Our employees are Certified Java, Oracle and Microsoft developers and the company is Oracle Certified Partner and Microsoft Gold Certified Partner. Totally we employ 230 persons working in our offices in Stockholm, Gothenburg, Oslo and St. Petersburg. Krug-Soft www.krugsoft.ru krugsoft@krugsoft.ru +7(841) 249-9775 Year of Аoundation Headcount Programming Languages 2011 60 Penza, Russia C#, C++, Java, .NET, PHP KRUG-Soft, is a software development company in the «KRUG» Group оf Companies. Nowadays many people associate the Group of companies «KRUG» with reliability of complex automation systems, with high responsibility in relations with partners and customers, economic stability of business. Luxoft www.luxoft.com russia@luxoft.com +7(495) 967-8030 Moscow Year of Аoundation Headcount Programming Languages 2000 5754 C, C++, C#, Java, PL/1, Python, Perl, PHP, Ruby, ASP. NET, Assembler, Flex, Visual Basic, scripting languages, COBOL, HTML, J2ME, JavaScript, JSP, PL/SQL Luxoft, a member of the IBS Group, is an emerging global leader in application and product engineering outsourcing services for enterprise IT organizations and software vendors. Luxoft builds lasting partnerships with its clients, such as Boeing, Deutsche Bank, UBS, Dell, IBM, Sabre and other global leaders, based on the culture of engineering excellence, innovation, and deep domain expertise. Luxoft offers global delivery capability through its network of state-ofthe-art delivery centers in North America, Central & Eastern Europe, and Asia. Mallenom Systems www.mallenom.ru info@mallenom.ru +7(820) 220-1635 Year of Аoundation Headcount Programming Languages 1999 25 Cherepovets, Russia C#, .NET, Java Mallenom was established in 1999. We deal with: Optic-electronic traffic and registration control in transport; Industrial quality control; Decision support systems. We develop complex computer vision and analytic systems for automatization of various engineering processes and managerial decision support. Most developments of the company are applied in difficult production areas, on motor and railways, in offices and institutions. 129
  • 130.
    Mapilab www.mapilab.com info@mapilab.com +7(401) 299-1366 Year ofАoundation Headcount Programming Languages 2003 30 Kaliningrad, Russia .NET The MAPILab company was founded in 2003 and has managed to take the leading position on the market of software products for Microsoft Outlook since then. Today it offers more than 30 products within a wide range - there are utilities for work automation and productivity improvement, components for developers, tools for teamwork. An important trend in the work of the company is developing software products for Microsoft Exchange Server. We create truly unique and high-quality solutions that take a firm position on the market of server extension software. Monitor Soft www.monitorsoft.ru monitor@monitorsoft.ru +7(495) 556-4595 Year of Аoundation Headcount Programming Languages Zhukovsky, Russia 1993 58 C++, C#, Java, Perl. Delphi, PHP Monitor Soft, Ltd. develops and provides the aeronautical fixed telecommunication systems AFTN, flight navigation services, as well as the systems of fast-acting airport management and air traffic planning. In the development of the products specialists apply the advanced methods and programming techniques, implement integrated use of various hardware, produced both by global manufacturers and their own development. All these advantages along with the opportunities granted by the usage of the Internet and the Intranet, modern digital ground and satellite communication systems allow to create the distributed management information systems. Movavi www.movavi.com job@movavi.com +7(383) 363-2201 Year of Аoundation Headcount Programming Languages 2004 50 Novosibirsk, Russia C++ MOVAVI Inc. is an independent software developing company specializing in video area. We combine the high-level skills and wide experience of our technical professionals with the efficient approach to the market. We work to solve the present-day needs of our customers by providing the quality video products and support services. Nautsilus www.nautsilus.ru info@nautsilus.ru +7(495) 939-5872 Year of Аoundation Headcount Programming Languages 1990 10 Moscow, Russia C, Java NAUTSILUS, Ltd. is an independent privately owned company established in 1990 by a strong team of real-time software engineers. The business area includes process automation software development under QNX (and Linux too), system integration, and industrial/building automation application implementation. Neolant www.neolant.ru info@neolant.ru +7(499) 999-0000 Moscow, Russia Year of Аoundation Headcount Programming Languages 2004 312 C#, .NET, C++, Java, Delphi, Visual Basic The group of companies NEOLANT is the supplier of solutions for the enterprises of fuel-energy complex and state sector. Areas of company’s activities: Development and implementation of information systems to decision-making support based on the integration of technologies: PLM, BIM, GIS, CAD, PDM, PM; Engineering and information support of oil-and-gas and nuclear objects on different life cycle stages; Permanent search for innovative solutions. Netris www.netris.ru info@netris.ru +7(495) 950-5525 Year of Аoundation Headcount Programming Languages 2006 40 Moscow, Russia Java, C++ Netris is the leader in software development and systems integration for service providers, banking institutions and contact-centers. The company’s staff consists of highly skilled programmers and engineers, who implement the goals set by customers in a professional manner. It is the high level of professionalism and the focus and dedication of Netris employees which gives the company a market leadership position and competitive edge. 130
  • 131.
    Participants of research NicotechInternational www.nicotech.ru info@nicotech.ru +7(499) 500-3829 Year of Аoundation Headcount Programming Languages 1991 41 Moscow, Russia Java, ABAP, .NET, C#, PHP Nicotech provides to its customers (ISVs, Business clients and Pubic organizations) commercially effective IT and software product development services based on the cutting-edge technologies which help to bring agility, innovation and productivity to our clients. Norsi-Trans www.norsi-trans.ru info@norsi-trans +7(499) 238-8153 Year of Аoundation Headcount Programming Languages 1996 100 Moscow, Russia C++, C#, Java Innovative company involved in development, production and sale of computer information system for collection, analysis, recording, and processing of telecommunication network data. The Company has been working in this area since 1996 along with a number of leading domestic and foreign vendors, and markets hardware and software systems which ensure completion of tasks faced by telecommunication network systems. Novel Software Systems www.nprog.ru info@nprog.ru +7(383) 332-1676 Year of Аoundation Headcount Programming Languages 2006 10 Novosibirsk, Russia Java, Perl Novel Software Systems company based in A.P. Ershov Institute of Informatics Systems develops high-quality informatics solutions for the scientific community. We provide a wide range of software development services and readyto-implement products. Our company specializes in intelligent software development for analysis and recognition of signals, images and genetic texts. Novosoft www.novosoft.ru info@novosoft.ru +7(383) 330-3474 Year of Аoundation Headcount Programming Languages 1992 35 Novosibirsk, Russia C++, Oracle, Java Novosoft LLC is a large international company with a major development unit in Novosibirsk, Russia. We provide highquality, offshore software development services and Web design solutions at excellent rates. Besides, we are selling our program products for improvement of customer's business. Optical Recognition Objectives www.magtoapp.ru info@magtoapp.ru +7(499) 638-8659 Year of Аoundation Headcount Programming Languages 2003 15 Samara, Russia iOS, Ruby, Android Optical Recognition Objectives LLC is focused on development of technology and software for pattern recognition to match the market needs in applications for human face and other complex objects recognition. The Company made outstanding pattern recognition technology GABITUS based on the novel artificial neural network model. GABITUS is the core engine for existing and upcoming Company products. Oracle Development SPB LLC www.oracle.com/ru grigori.labzovsky@oracle.com +7(812) 334-6000 Year of Аoundation Headcount Programming Languages 1999 321 Saint Petersburg, Russia Java, C++, C Oracle provides the world's most complete, open, and integrated business software and hardware systems. Its product strategy provides flexibility and choice to customers across their IT infrastructure. The St. Petesrburg Development Center (SPBDC) specializes in creating computer software, engineering environment tools, and providing infrastructure solutions. 131
  • 132.
    PITERSOFT, LLC www.piter-soft.ru info@piter-soft.ru +7(812) 333-0860 Yearof Аoundation Headcount Programming Languages 2005 14 Saint Petersburg, Russia 1С PiterSoft presents products and services in the region of business-process automation, development and implementation of software, electronic document circulation systems, management technologies based on «1C:Enterprice» using process management technologies. «PiterSoft» is a partner of «1C». It has status «Manufacturing competence center». The company works with more than 60 partners, distributing «PiterSoft: Process management» software. It is the member of audit-consulting group «SPG». PROGNOZ www.prognoz.ru prognoz@prognoz.ru +7(342) 240-3663 Perm, Russia Year of Аoundation Headcount Programming Languages 1991 1619 C, C++, C#, JavaScript, Fore (proprietary), ASP.NET, Java, Flash, Web Services PROGNOZ is an international company that has been working in the IT market since 1991. Today, we are one of the top Business Intelligence software vendors in Russia. PROGNOZ Platform, our flagship solution, is designed to develop modern Business Intelligence and decision support systems to fit the needs of industrial enterprises, national and regional governments, banks, and financial sector participants. QarkSoft www.qarksoft.ru inbox@qarksoft.com +7(383) 380-2263 Novosibirsk, Russia Year of Аoundation Headcount Programming Languages 2012 6 Scala, Java, C#, Nemerle, C++ Company QarkSoft - is a highly skilled team of programmers with extensive experience of working together. We love and know how to program. We are pleased to take on the programming tasks in your projects and are ready to implement your ideas.Why us? Quality(We always test multiple times developing solutions), 100% satisfaction guarantee terms(we guarantee the execution of the project on time),we do not have layer of ineffective managers, full transparency of Customer-Contractor collaboration. We are good at: Unified communications, Traffic management,Mobile app. Quorus ACS www.quorus.ru market@quorus.ru +7(343) 272-1092 Year of Аoundation Headcount Programming Languages 1989 Yekaterinburg, Russia 100 Quorus ACS is the most experienced and skilled system integrator of information solutions independently from its complexity. Quorus` partners are banks, industrial and state enterprises. "Quorus ACS" specialises on computational, telecommunicationsand engineering designing and implementation; sevcice, IT consulting and audit. RITG www.ritg.ru cto@ritg.ru +7(842) 246-2226 Ulyanovsk Year of Аoundation Headcount Programming Languages 2006 35 С#, ASP.NET, PHP, C++, Java, J2EE, Objective C, 1C-Bitrix Holding «Russian IT Group» was founded in 2006. Since the beginning, holding promotes advanced information technologies to Russian and international markets. Our team is a fast growing player on the World IT-market. Our mission is to improve the quality of information technologies used in your company to the level of highest international standards. We are looking forward to make the business of our customers dynamic, informative and flexible with the help of development and implementation of effective and innovative solutions to improve the efficiency and competitiveness of customers 132
  • 133.
    Participants of research RusWizards www.ruswizards.com info@ruswizards.com +7(929) 820-6238 Year of Аoundation Headcount Programming Languages Taganrog, Russia 2009 40 .NET, C#, Java, PHP, Ajax, Objective C Rus Wizards is a software developing company that holds a Microsoft certificate in Data Management and Business Intelligence Solutions and has proficiency certificates for MS SQL Server 2005 DBA/DBD, ASP.NET 4.0 and MVC. The company develops mobile applications for iPhone/iPad, Android and Blackberry. Rus Wizards proficiency lies in DB solutions, Web solutions, Reporting solutions and Mobile apps. SCANEX R&D Center www.scanex.ru scanex@scanex.ru +7(495) 739-7385 Year of Аoundation Headcount Programming Languages 1989 200 Moscow, Russia C++, C#, Java, Perl SCANEX Research and Development Center is the leading Russian company on the remote sensing market that offers a complete set of services ranging from acquisition to thematic processing of Earth observation images from space. Today, ScanEx is the only Russian company that has signed license agreements with the top world remote sensing Operators for direct data acquisition from SPOT, FORMOSAT, EROS, UK-DMC2, RADARSAT satellites series to UniScan™ ground stations, enabling regular near real-time monitoring of territories of Russia and the CIS countries with spatial resolution from hundreds to less than one meter. Sibers www.sibers.ru info@sibers.ru +7(383) 330-6626 Year of Аoundation Headcount Programming Languages 1998 130 Novosibirsk PHP, .NET Sibers is a software development offshore center. It is one of the largest players representing Russia on this market. At present the company is in Top Three companies on the online service marketplace called Elance, which is providing hundreds of offshore software companies with various projects. To support the its intentions, Sibers has been able to build teams of different scale with diverse exchange rates. Sibers team consists of CS-major graduates, experienced scientists and IT professionals with BS/MS from top Russian universities. Sigma Technology www.iosotech.com company@iosotech.ru +7(495) 761-2487 Year of Аoundation Headcount Programming Languages 2001 9 Moscow, Russia .NET, Fortran SIGMA Technology is a software company in the private sector which operates in the field of numerical optimization for complex technical systems. The company is located in Moscow (Russia). The main goals are: Development of optimization strategy and software (IOSO Technology algorithms family) as well as Real-life optimization problems solution in cooperation with other companies. SIGMA Technology was founded in 2001 on the basis of IOSO Technology Center. Developments of the company are based on 25 year operational experience in the fields of Turbomachinaryand Aerospace. SimbirSoft www.simbirsoft.com info@simbirsoft.com +7(842) 244-6691 Ulyanovsk Year of Аoundation Headcount Programming Languages 2001 95 Java, C++, .NET (C#), PHP, Android, iOS, WinPhone, Ruby, Python Founded in 2001 SimbirSoft Ltd. provides custom software development and testing services for the companies from the USA, the Russian Federation, Japan and European countries. The company has a big experience in developing document workflow and project management systems, CRM, cloud systems, financial and statistics products, web and mobile applications as well as IT-consulting services. The key technological competences are Java, C++, .NET (C#), PHP, Ruby, Android, iOS, WinPhone. 133
  • 134.
    Smart-soft.ltd www.smart-soft.ru info@smart-soft.ru +7(495) 615-5057 Year ofАoundation Headcount Programming Languages Kolomna, Russia 2003 28 C++, C, Java, Delphi, Visual Basic Founded in 2003, Smart-Soft is a privately owned Russian software development company specializing in Internet technology solutions. Smart-Soft has a range of software products that allow businesses to connect, collaborate and communicate securely and to resolve the problems that can arise when using the Internet. Soft-Consult Ltd. www.soft-consult.ru postmaster@soft-consult.ru +7(812) 534-8481 Saint Petersburg, Russia Year of Аoundation Headcount Programming Languages 2001 15 C#, C, C++, VB.NET, Java, JavaScript, Soft-Consult provides consulting services in IT and software development, covering a wide amount of customers’ needs, beginning with auditing and ending with developing of complex information systems. The major lines of our activities are the following: Developing document management systems; Developing geographic information systems; Developing distributed systems for business processes automation; Developing computer‑integrated telephony applications; Developing mobile applications. SoftDev SPb www.softdev.spb.ru gkovaleva@softdev.spb.ru +7(812) 325-7422 Saint Petersburg, Russia Year of Аoundation Headcount Programming Languages 1994 55 C++, C#, Java, Perl, .NET, PHP, Visual Basic Headquartered in St.Petersburg, Russia, SoftDev SPb has been rendering services to its customers for over 18 years. Extensive experience of working with companies worldwide enabled our company to amass a wealth of industry-specific knowledge, which, combined with proficiency in various programming technologies, makes SoftDev the perfect choice for outsourcing even the most complex software development tasks. SoftReactor www.softreactor.ru info@softreactor.ru +7(812) 336-6066 Year of Аoundation Headcount Programming Languages 2010 7 Saint Petersburg, Russia PHP, Java, Perl, flex SoftReactor is a Saint-Petersburg based software development company founded in 2010 and is growing since that time. Specialization of the company includes Internet applications, Web development, Mobile applications, Web programming, Business automation, Geoinformation technologies, Social network applications and Internet solutions. Speech technology center www.speechpro.ru stc-spb@speechpro.com +7(812) 325-8848 Saint Petersburg, Russia Year of Аoundation Headcount Programming Languages 1990 356 C#, C++, Java, C, Python, PHP, Matlab Speech Technology Center (STC) is an international leader in speech technology and multimodal biometrics. It has over 20 years of research, development and implementation experience in Russia and internationally. STC is leading global provider of innovative systems in high-quality recording, audio and video processing and analysis, speech synthesis and recognition, and real-time, voice and facial biometrics solutions. STC innovations are used in both public and commercial sectors, from small expert laboratory Tecom Group www.tecomgroup.ru info@tecomgroup.ru +7(831) 432-6687 Year of Аoundation Headcount Programming Languages 1992 250 Nizhny Novgorod, Russia C, C++, C# Tecom is headquartered in Melbourne, FL (USA). The company’s engineering centers are located in Nizhny Novgorod (Russia) and Arzamas (Nizhny Novgorod region). Our Quality Management System is certified in accordance with ISO 9001-2001 and CMM Level 3 standards. Main business activities of the company: Software and hardware design, development, testing and maintenance in networking, telecommunications, broadcasting, microwave communications and embedded systems; Implementation and system integration of software and hardware systems in broadcasting, telecommunications and ERP; IT consulting. 134
  • 135.
    Participants of research Teknavo www.teknavo.com info@teknavo.com +7(812)336-3612 Year of Аoundation Headcount Programming Languages 2006 London, UK С++, Java Teknavo designs, builds and manages front office technology applications for the financial services sector. We focus on two important areas: We leverage our in-depth knowledge of the industry and its technical challenges and have access to the best practitioners both on- and offshore. From the ground up, we build custom-made onshore/offshore organizations with a flexible workforce model that augments the existing in-house technology capability, operating in sync with, rather than at odds with, your current operations. Titan - information service www.speereo.com spr-feedback@speereo.com +7(812) 327-4455 Year of Аoundation Headcount 1998 Saint Petersburg, Russia Programming Languages C++, MS Titan - Information Service JSC is an owner and developer of Speereo continuous speech recognition system. Since 2002 Company has been developing mobile applicaitons and systems enhanced with speech recognition. Speereo Speech Recognition possesses some unique features that set it apart from competition. Since 2011 Company started a new project: universal remote with voice recognition that allows users to control misc. devices with voice commands. UniPro www.unipro.ru marketing@unipro.ru +7(383) 332-6061 Year of Аoundation Headcount Programming Languages 1992 70 Novosibirsk, Russia C++, Java Founded in 1992, UniPro started with 16 specialists participating in Sun Microsystems projects. Since then, UniPro has steadily grown and has become a reliable partner in the IT offshore outsourcing market. Now it's a full service IT company, having successfully completed more than 60 projects in a wide range of technologies. We deliver our clients the best IT solutions through the world-famous creativity of Russian software developers, backed up by their excellent educational background and the Russian R&D tradition. Unisoft Plus www.unisoftplus.com contact@unisoftplus.ru +7(383) 363-7001 Year of Аoundation Headcount Programming Languages 1990 16 Novosibirsk, Russia C# Unisoft plus is an independent software development and research company that works in the international market since 1994. Unisoft plus offers tailor-made software development in two broad categories: Business applications including e-business + Technical and scientific applications AND Reengineering and porting of existing legacy software to new platforms/environments + Development of off-the-shelf software. Wave Access www.wave-access.com info@wave-access.ru +7(812) 326-8626 Year of Аoundation Headcount Programming Languages Saint Petersburg, Russia 2000 100 C#, C++, .NET, Java, JavaScript, Perl WaveAccess is a software company developing business solutions since 2000. Headquartered in the USA with offices in the UK, Russia and the Ukraine. Today, WaveAccess is a provider of advanced automation technologies for businesses all over the world. At Wave Access we develop custom software for Internet Enterprise, Medical markets and Microsoft Dynamics CRM. WebSoft Development www.websoft.ru websoft@websoft.ru +7(495) 514-0436 Year of Аoundation Headcount Programming Languages 1999 50 Moscow, Russia C++, C#, Java, JavaScript WebSoft, founded in 1999, is the leading Russian independent software vendor that develops a comprehensive suite of software products for e-Learning and humal capital management. Our software supports the processes of e-Learning, authoring electronic content, employee assessment, testing, competency management, knowledge management, talent management, career development, and personnel recruitment. 135
  • 136.
    Yumasoft www.yumasoft.com info@yumasoft.com +7(812) 334-0805 Year ofАoundation Headcount Programming Languages 2003 25 Saint Petersburg, Russia C# Yumasoft is a well-known, growing outsourcing software development company that has been in this business since 2003. Our main development centers are in Russia and Belarus with a team of more than 60 highly educated and experienced software engineers, who are ready to take on even the most complex projects and who deliver top quality software products and solutions, maintenance, and support. Our experience, expertise, and competence have made us one of the most reputable software development companies in Europe and the US. Dom Programm www.domprog.com info@domprog.com +7(812) 320-2136 Year of Аoundation Headcount Programming Languages 2001 14 Saint Petersburg, Russia C#, .NET, PHP Dom Programm Ltd. specializing in the development of corporate proprietary products; classical applications; clientserver solutions, and applications to work with databases; WEB sites development of several level of complexity. We use service oriented architecture approach (SOA), cloud computing, and Software as a Service (SaaS) paradigm; technologies based on modern protocols, data presentations and transformation. We develop in Windows, Linux with MS Visual Studio, Eclipse, Netbeans as development tools. We use C# in .NET and PHP + MySQL with the use of HTML5, CSS3, Ajax. 136
  • 137.
    RUSSOFT Association Birzhevaya line16, suite 411, St. Petersburg, 199034, Russia contact@russoft.org www.russoft.org Editor-in-Chief Valentin Makarov Analytics Dmitry Zhelvitsky 137