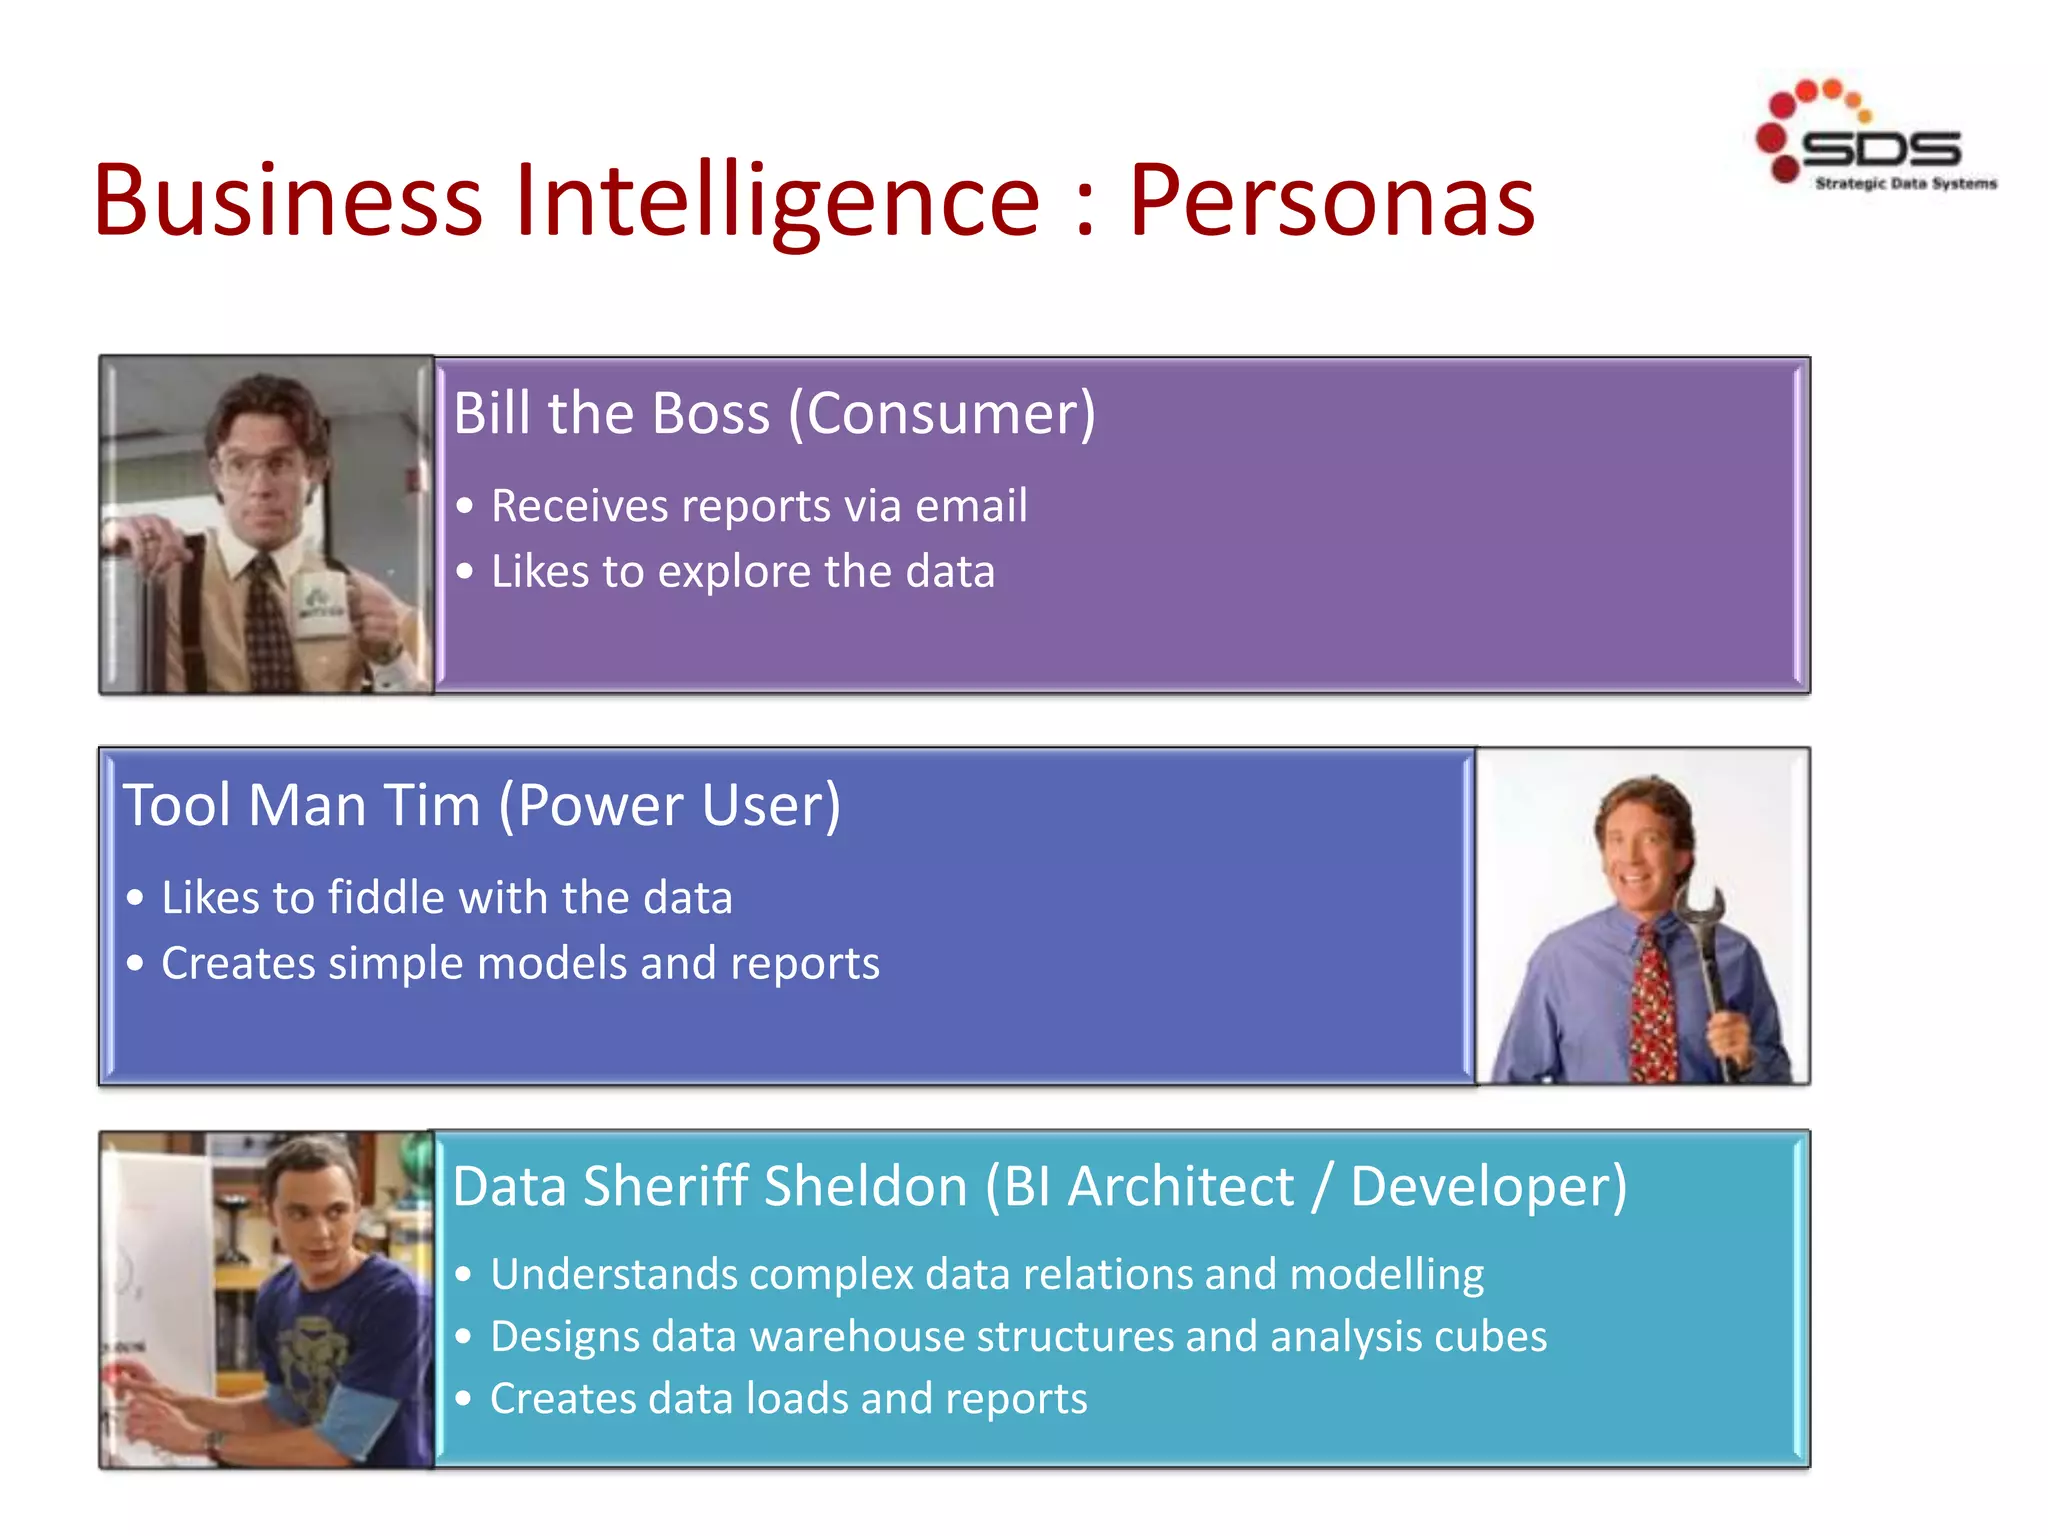
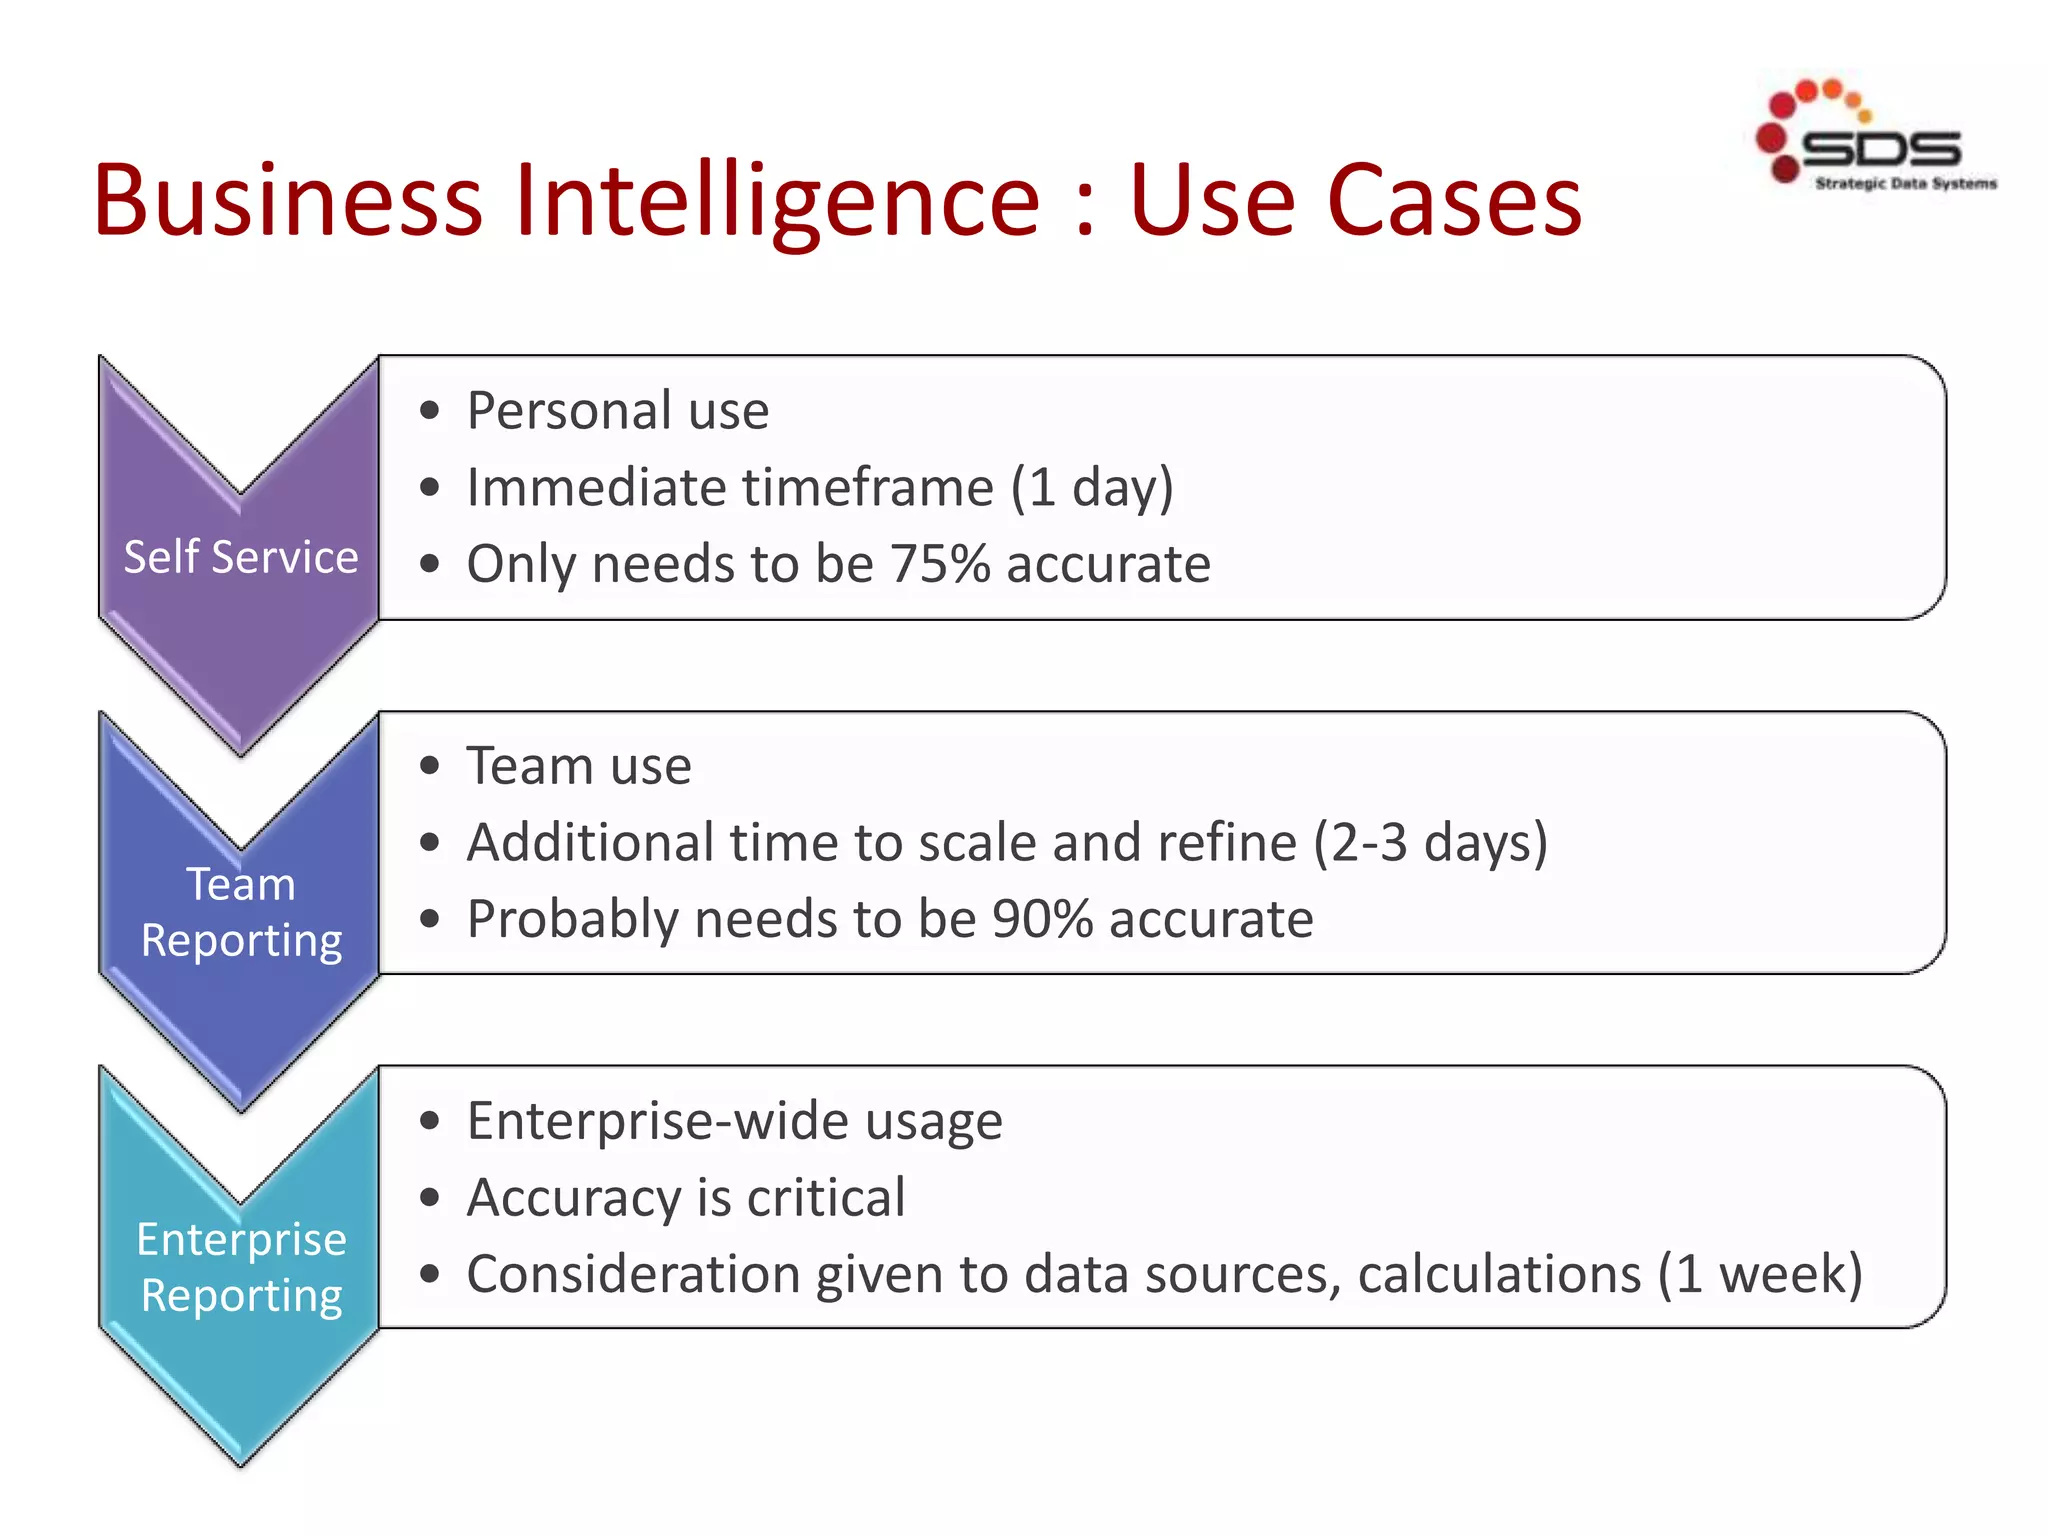
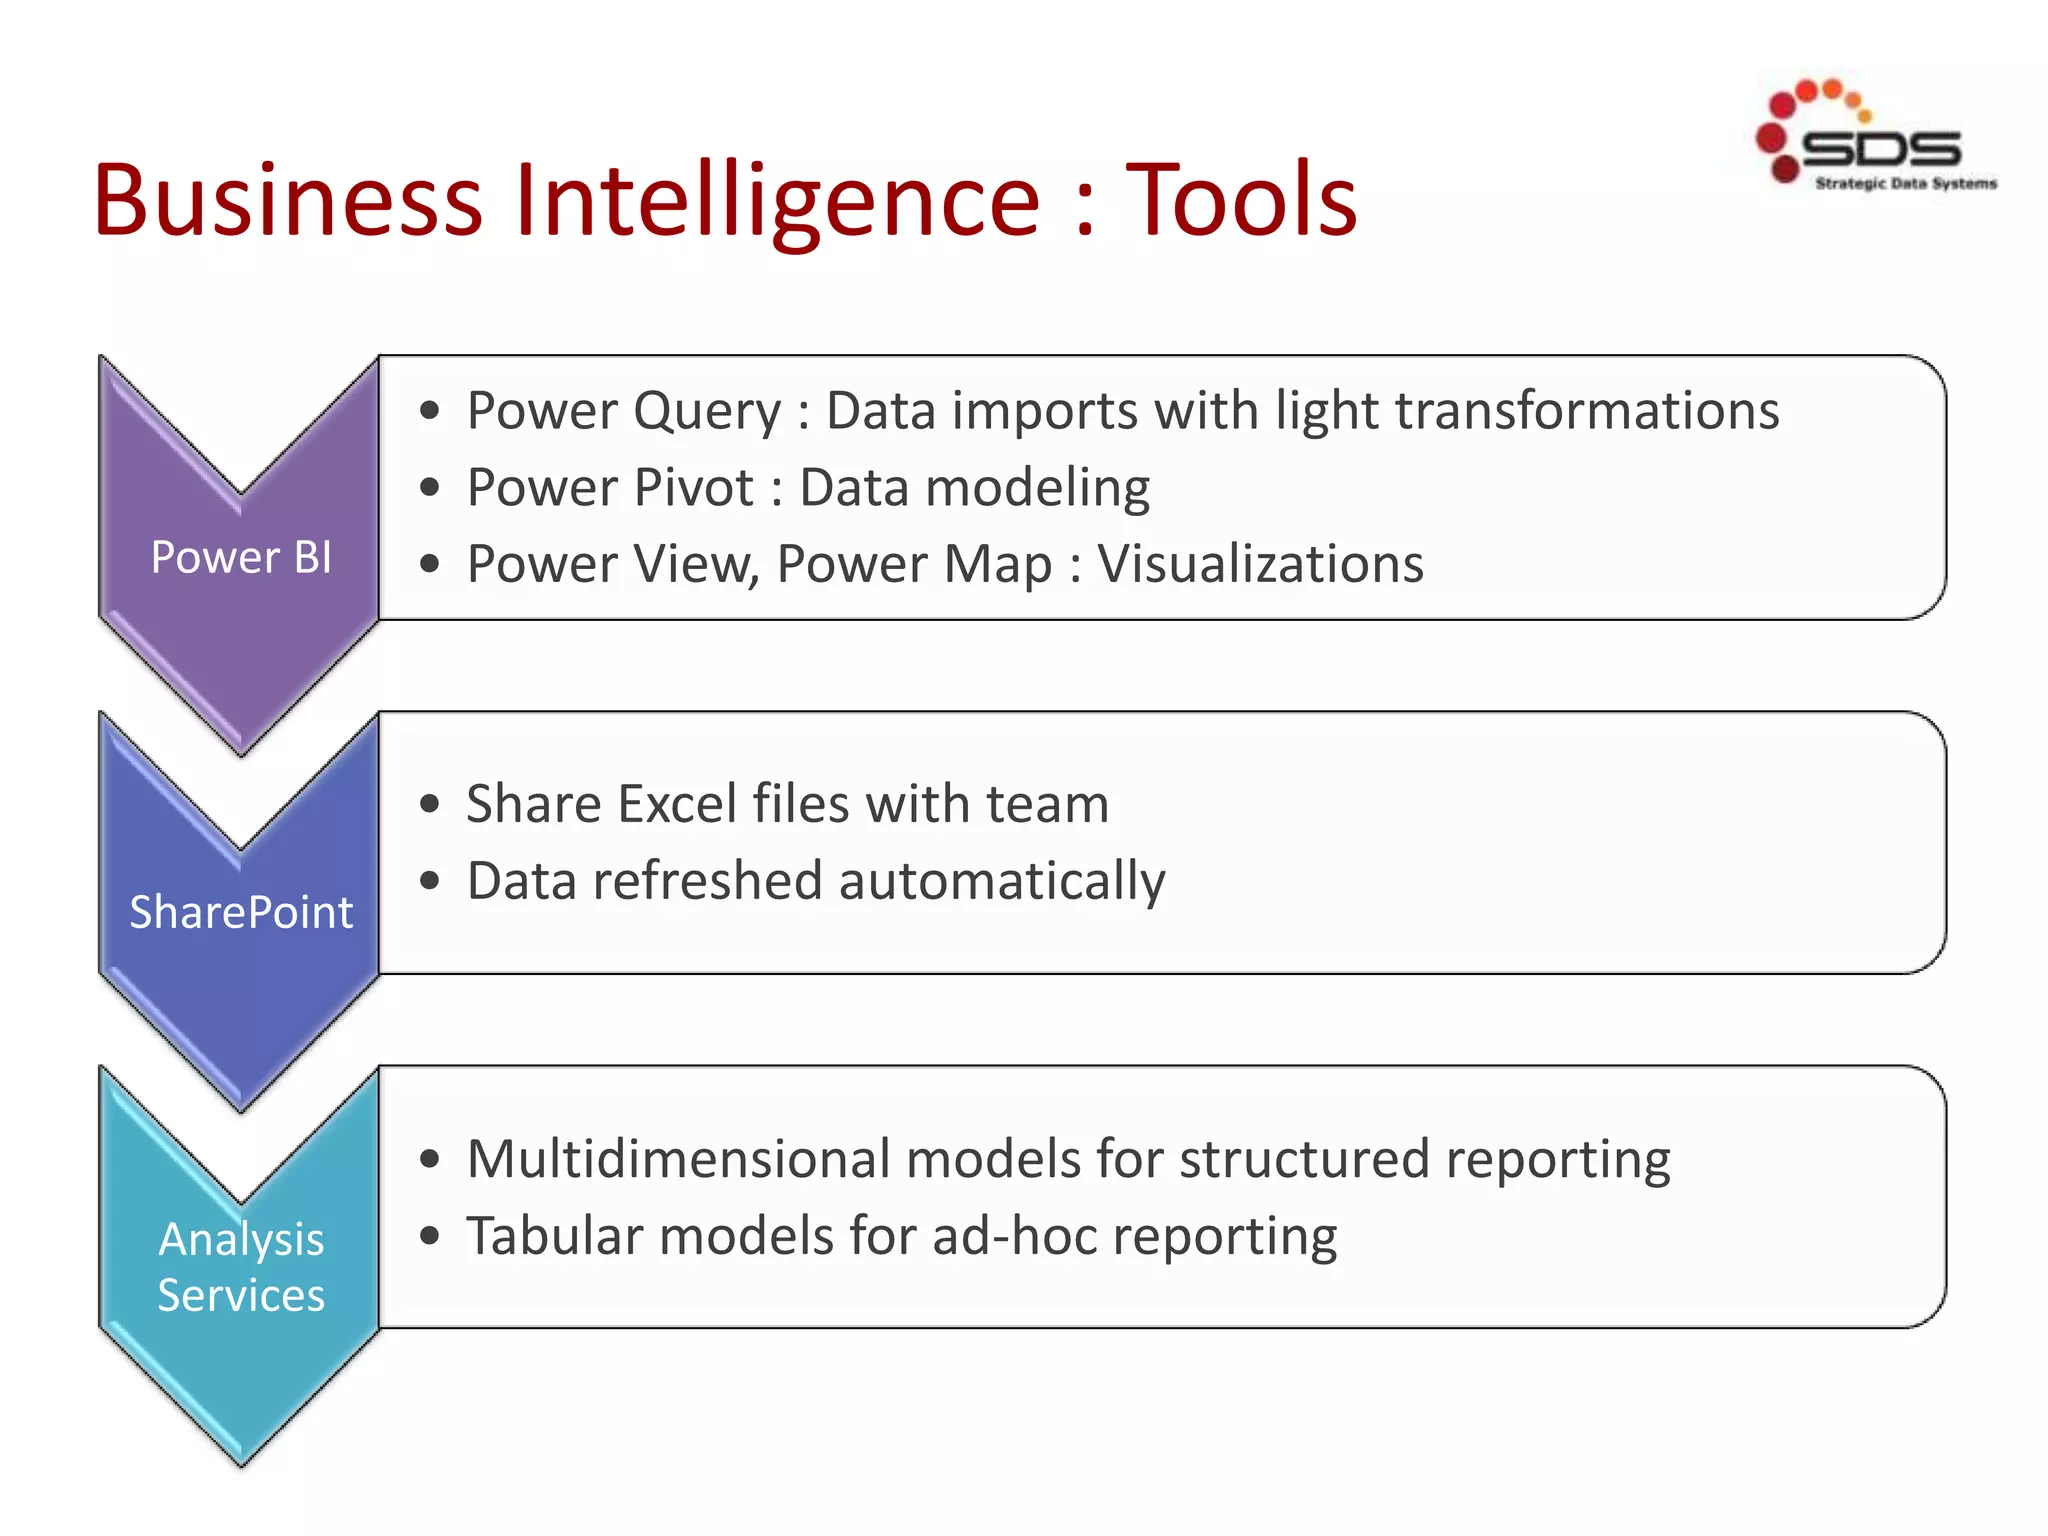
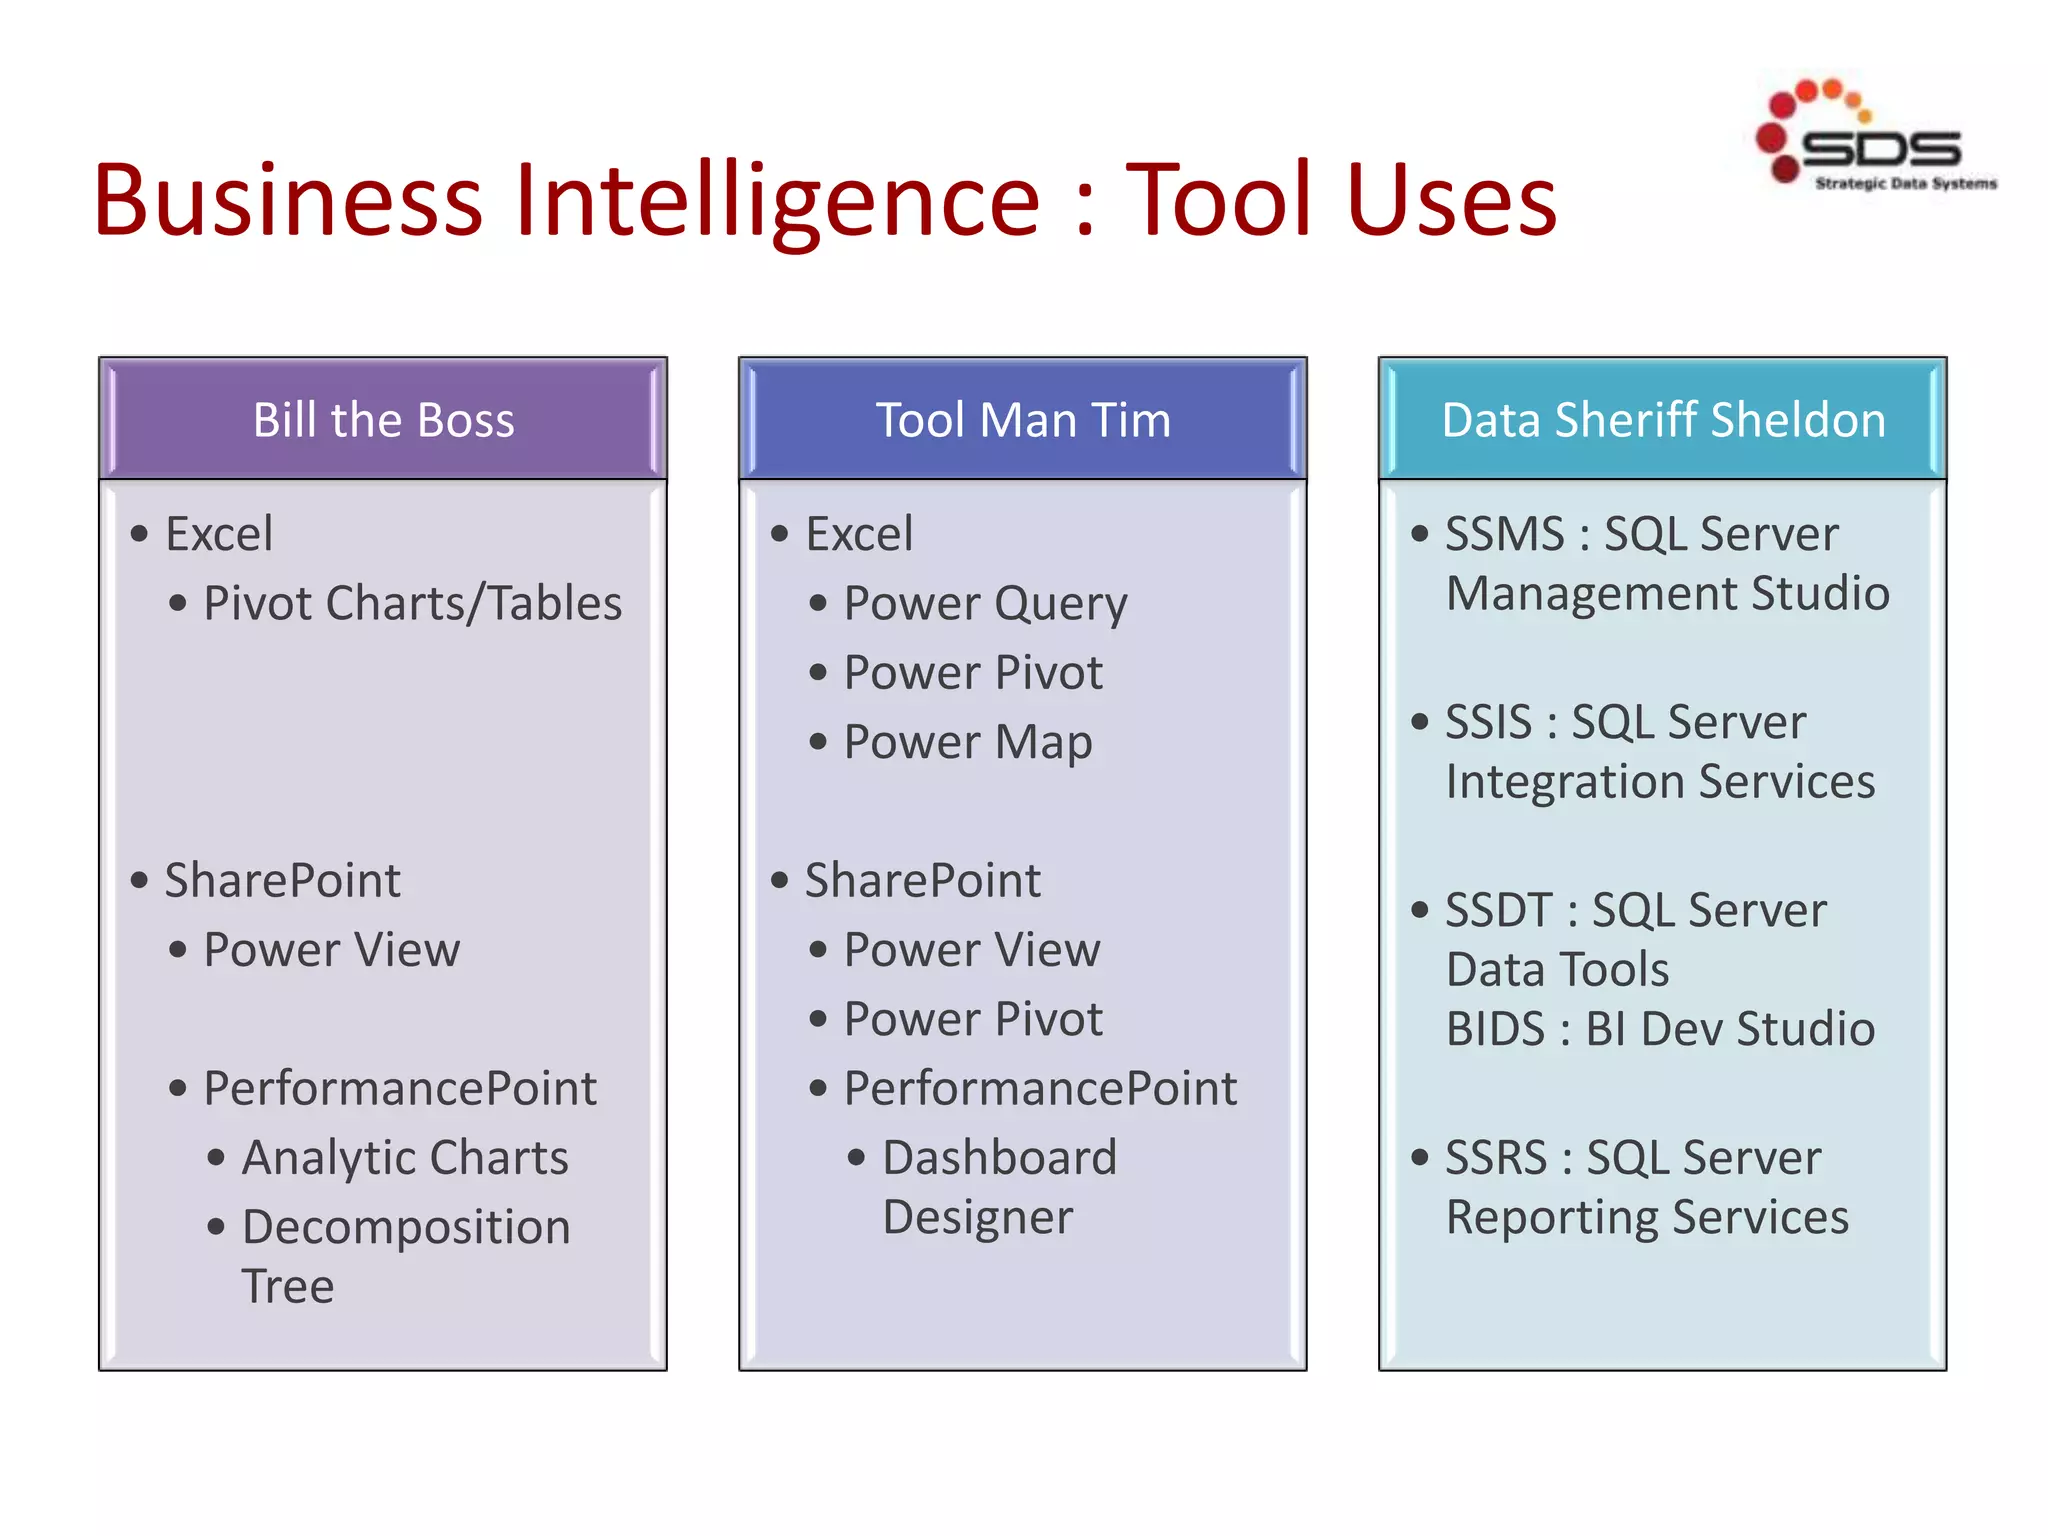
This document provides an overview of business intelligence tools and concepts. It discusses self-service, team, and enterprise reporting use cases and the associated tools like Power BI, SharePoint, and SQL Server Analysis Services. It profiles different types of BI users and the tools that would suit each persona. The document also covers data modeling in PowerPivot and report visualization with Power View and SQL Server Reporting Services.

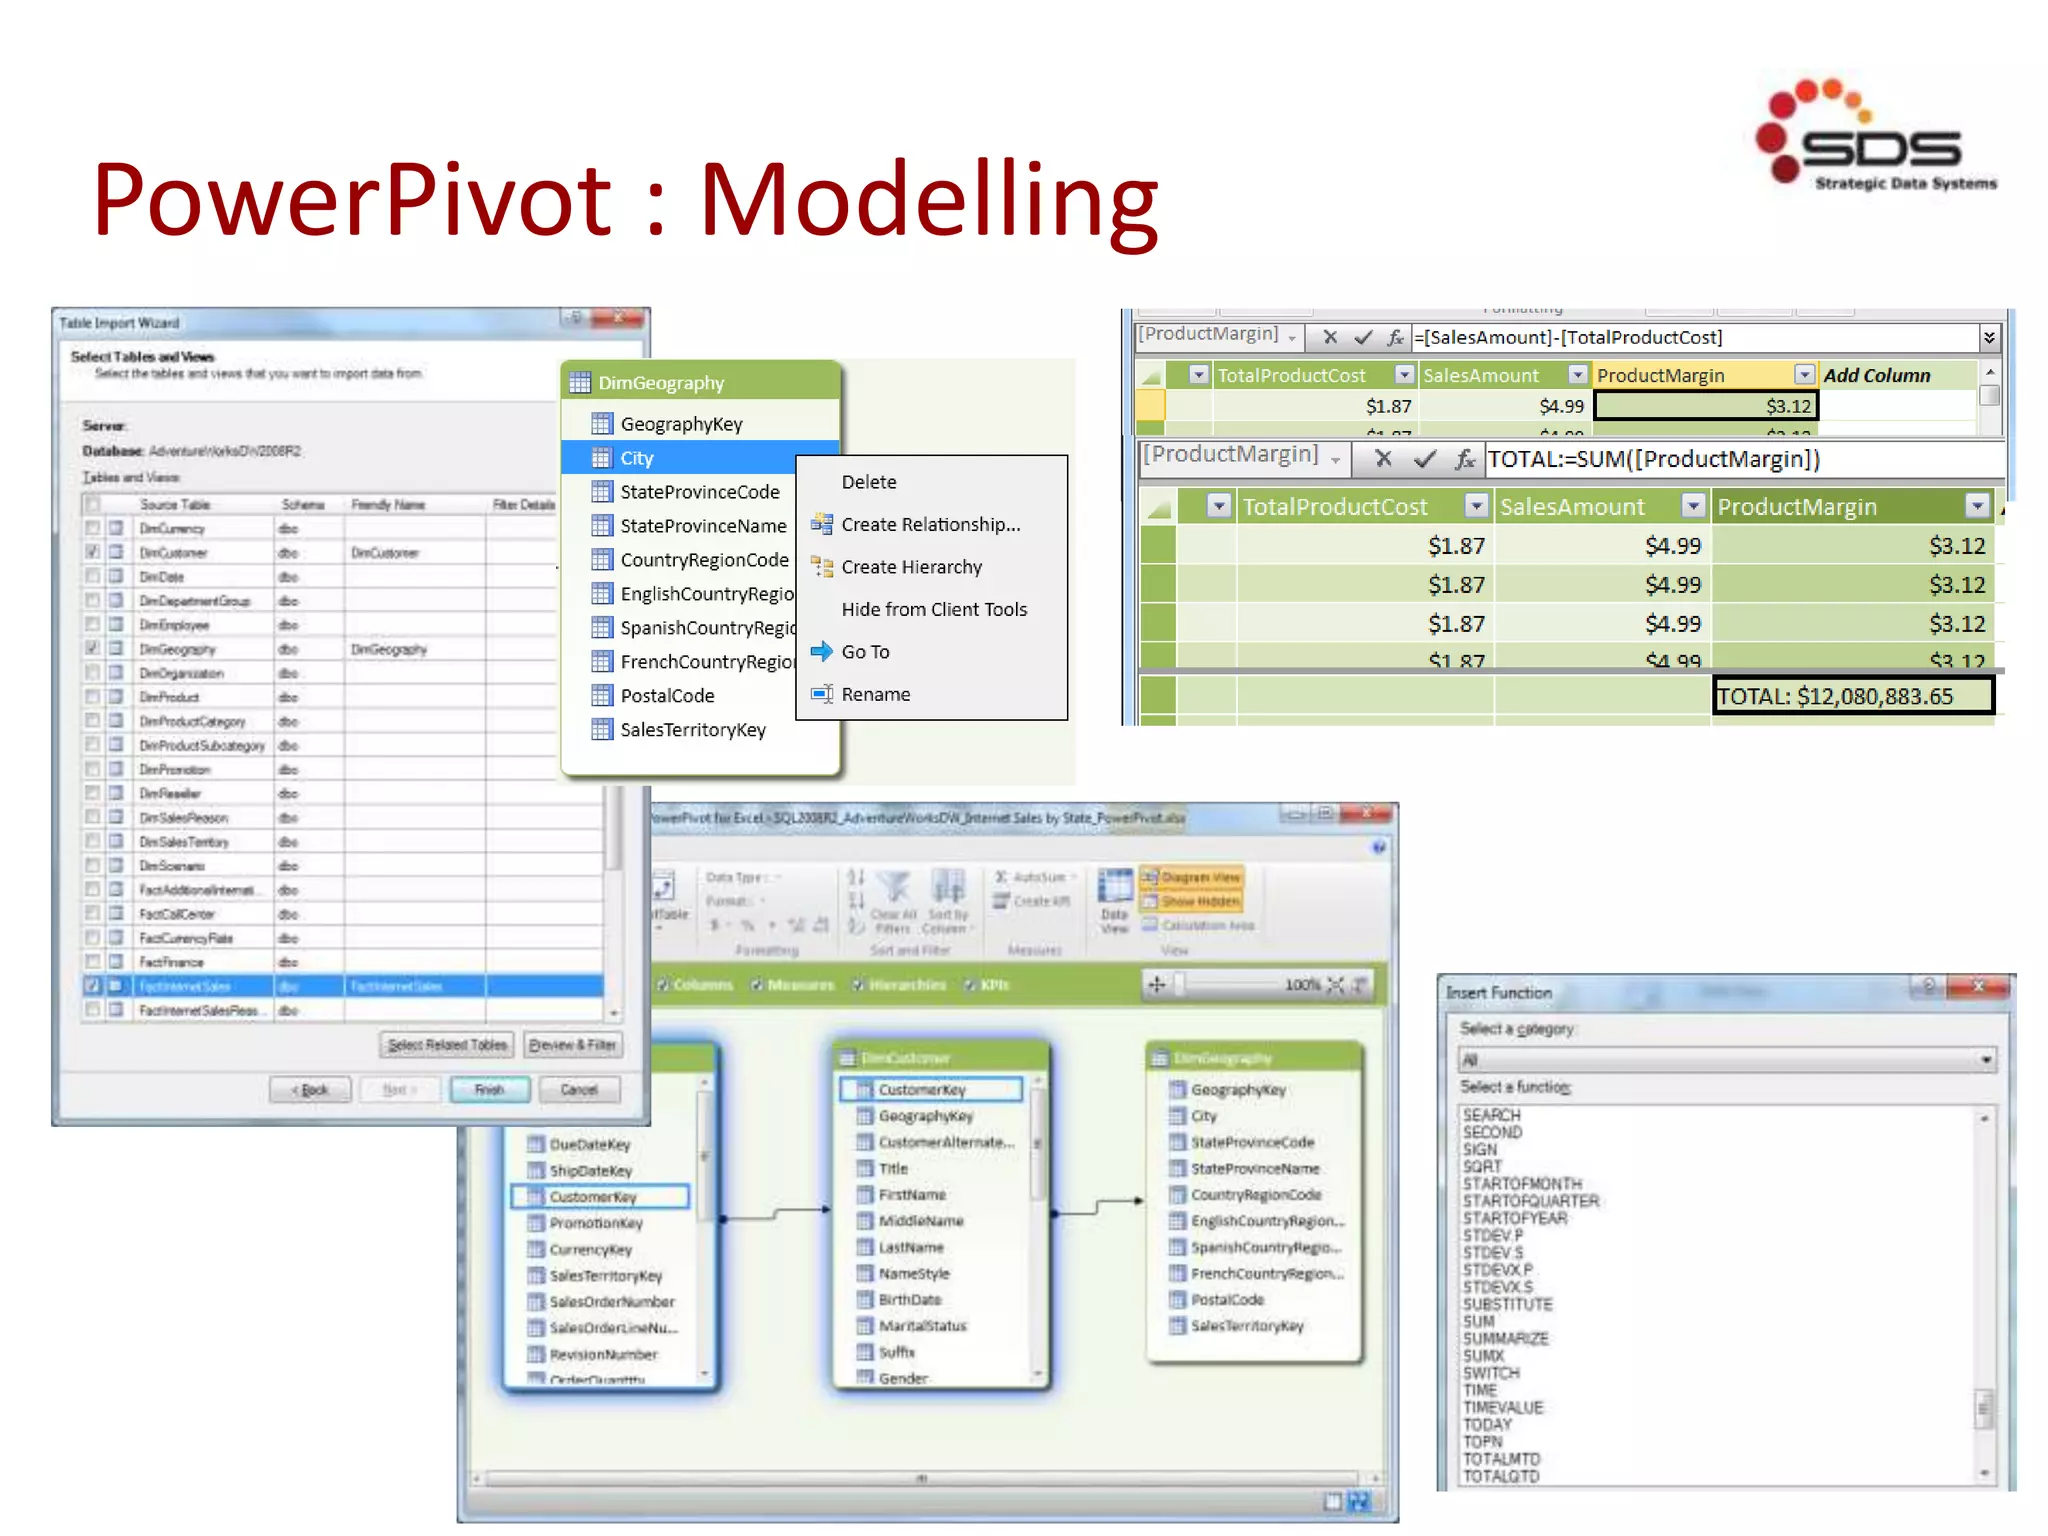
![PowerPivot
Software Requirements
• SharePoint : Enterprise (Excel Services)
– Excel Services Application
– PowerPivot Service Application
– Secure Store Service
– Claims to Windows Token Service
• SQL : Dev, Eval, Business Intelligence, Enterprise
– RS in SharePoint [Integrated] mode
– Analysis Services : SQL Server PowerPivot for SharePoint](https://image.slidesharecdn.com/spsaturday-chicago-2014-decoding-the-business-intelligence-alphabet-soup-140519212232-phpapp02/75/SharePoint-Saturday-Chicago-2014-Decoding-the-Business-Intelligence-Alphabet-Soup-22-2048.jpg)