The Harmonized World Soil Database (HWSD), A Global Soil Information System, Freddy Nachtergaele and Harrij van Velthuizen
•
1 like•1,781 views

http://www.fao.org/globalsoilpartnership This presentation was made during the GSP/E-SOTER Global Soil Information workshop that took place at the FAO HQ, Rome , Italy from 20-23 March 2012. This presentation was made on the first day by Freddy Nachtergaele & Harrij van Velthuizen, and it presents The Harmonized World Soil Database (HWSD) A Global Soil Information System. ©FAO: http://www.fao.org

Recommended
More Related Content
What's hot
What's hot (20)
Similar to The Harmonized World Soil Database (HWSD), A Global Soil Information System, Freddy Nachtergaele and Harrij van Velthuizen
Similar to The Harmonized World Soil Database (HWSD), A Global Soil Information System, Freddy Nachtergaele and Harrij van Velthuizen (20)
More from FAO
More from FAO (20)
Recently uploaded
Recently uploaded (20)
The Harmonized World Soil Database (HWSD), A Global Soil Information System, Freddy Nachtergaele and Harrij van Velthuizen
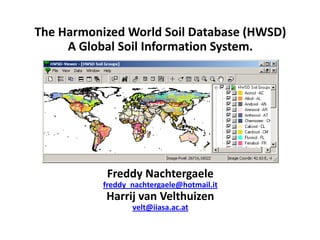
- 1. The Harmonized World Soil Database (HWSD) A Global Soil Information System. Freddy Nachtergaele freddy_nachtergaele@hotmail.it Harrij van Velthuizen velt@iiasa.ac.at
- 2. INTRODUCTION The Food and Agriculture Organization of the United Nations (FAO) and the International Institute for Applied Systems Analysis (IIASA) took the initiative of combining the regional and national updates of soil information with the information already contained within the 1:5 M scale digital FAO-UNESCO Digital Soil Map of the World (DSWM) into a new Harmonized World Soil Database (HWSD) This approach was actively supported by the European Soils Bureau Network (ESBN), ISRIC_World Soils and the Chinese Academy of Sciences. A first version of HWSD was published in 2008. The present version (v1.2) contains geographical expansions and incorporation of new and more detailed data and corrections for a number of soil parameters, notably for Soil Bulk Density values.
- 3. APPROACH 1. HWSD uses as a basis soil legacy data and maps. It harmonizes this information by using a standard grid and a single reference soil classification. 2. HWSD derives soil characteristics based on actually measured soil properties for each soil type in the mapping unit, using statistical techniques (pedo/taxon transfer functions). 3. HWSD makes optimum use of legacy soil data and has relied for collecting these on national soil institutes and international organizations. FAO has a track record of providing technical assistance to member countries to improve their exsisting national soil datasets. 4. HWSD estimates a large number of soil properties (20) both for top- and subsoil. In addition it gives soil structural and soil management information (soil phases) and contains a number of associated datasets. 5. HWSD is an operational global soil database, although not all regions are yet covered with the same reliability. All data, the manual and results are freely available on the internet: http://www.iiasa.ac.at/Research/LUC/External-World-soil-database/HTML/ 6. A new on-line HWSD viewer is being developed by ISRIC with other partners.
- 4. ACHIEVEMENTS TO DATE 1. The HWSD already constitutes improvements for about 60% of the land area as compared to the FAO/UNESCO Soil Map of the World. 2. The Global Earth Observation System of Systems (GEOSS), has identified an improved HWSD as an intermediate product to be completed in the short term. (GEO 2009-2011 Work plan, 2009). 3. The HWSD is used to refine global land degradation findings (GLADIS), and is an essential layer in the global land evaluation approach for food security as undertaken by FAO/IIASA with Global Agro-ecological zoning (GAEZ). 4. HWSD has already provided improved estimates of soil moisture storage capacities and soil organic carbon pools in support of climate change studies. 5. HWSD is likely to remain for some time to come the only available global soil database. Further improvements both geographically as quality wise are still required.
- 5. Application: Soil moisture holding capacity (Source: Vincent van Engelen, ISRIC)
- 6. Application: Soil Suitability for rainfed agriculture ( at low input)
- 7. LEGACY SOIL DATA SOURCES Legacy Soil Maps/Spatial databases •(1) The European Soil Database (ESDB) extended with information of the Northern Circumpolar soil map at 1:1 M scale. This database is considered of moderate reliability with an adequate scale but often lacking soil profile information. •(2) The new Soil Map of China at scale 1:1 M produced by the Chinese Academy of Sciences. The database is considered of moderate reliability for the same reasons as the one above. •(3) The SOTER databases mainly for Eastern, Central and Southern Africa, South America and the Caribbean and parts of Asia. National SOTER databases such as available for Senegal, Tunisia etc…This part is considered of moderate to high reliability. •(4) For the areas not covered by the above, mainly West Africa, North America, South Asia and Australia, the FAO/UNESCO Digital Soil Map of the World was re-interpreted. This part of the database is considered of relatively low reliability. Soil profiles All profiles collected in the WISE database (ISRIC), the ones included in the national and regional SOTER products, those of the European Soil Database (JRC) and the National China soil profile dataset have been used (more than 12 000 soil profiles in total)
- 8. Main Legacy Soil Data sources in HWSD ESDB CHINA SOTWIS DSMW No Data
- 9. Structure of the Relational Database • As the product has as its main aim to be of practical use to environmental modelers and serves perspective studies for agriculture through agro-ecological zoning, food security planning and climate change impacts (among others), a raster map with resolution of about 1 km (30 arc seconds by 30 arc seconds) was retained as the basic unit allowing easy integration with other environmental databases. • The database consists of 21600 rows and 43200 columns, of which 221 million grid cells cover the globe’s land territory. Over 16000 different soil mapping units are recognized, which are linked to harmonized attribute data which are of five kinds: General information on the soil mapping unit composition; Information related to soil phases; Physical and chemical characteristics of topsoil (0-30 cm) and subsoil (30-100 cm). Derived soil information Interpreted and related soil information • Use of this standardized structure allows linkage of the attribute data with GIS to display or query the composition in terms of soil units and the value of selected soil parameters. A viewer is an integral part of the HWSD, making it also accessible to non-GIS users. ISRIC and partners are developing a new on-line viewer.
- 10. 30 arc sec Grid Morphological soil information Chemical soil properties Physical soil properties Derived soil properties Soil depth Organic Carbon Sand fraction CEC clay fraction Presence of Gelic properties pH(H2O) Silt fraction Base saturation Presence of Vertic properties CEC soil Clay fraction ESP Other Soil Phase information Total Exchangeable Bases Bulk Density USDA Texture Class Soil Drainage class Calcium carbonate Reference Bulk Density Gypsum •ECe 5 min Grid Derived Soil Qualities for Agriculture Soilscape Land Cover and Land Use Population Nutrient availability, Slope % Rain-fed Cultivated land Rural population Nutrient retention capacity, Slope Aspect Irrigated Cultivated land Urban Population Rooting conditions Forest Land Oxygen Availability Pasture Land Excess Salts Barren/Slightly Veg. land Toxicity Open Water Workability Urban land Content of the database: soil & related properties
- 11. Example of derived information included in HWSD (Soil Nutrient availability)
- 12. From Soil Unit to soil property estimates: Pedo- & Taxo-transfer functions The mapping unit information in the Digital Soil Map of the World has been linked to respectively topsoil and subsoil parameters derived from the WISE soil profile database (Batjes et al., 1997 and Batjes, 2002). This linkage was established through the soil unit classification (that is why the term taxo-transfer is used) further subdivided by three topsoil texture classes and the depth class. For each combination occurring in the regional cluster MEDIAN values for each property were determined and associated with the Soil Unit in the mapping unit. The number of profiles in the regional cluster in the WISE database determines the reliability of the estimate (wnen n>30 = high reliability)
- 13. Pedo- and Taxo-transfer functions (2) In the SOTER-derived part of the database (SOTWIS) use is made of the typical soil profiles contained in the mapped SOTER units in the countries complemented with the soil properties from the WISE database for the same regional cluster where soil property information is missing. As in the for DSMW, MEDIAN values (after outliers have been eliminated) are used to estimate missing soil properties within the mapping unit. In the European Soil Database pedo-transfer functions were used that derived values for soil properties not measured from measured ones and ancillary information (for instance: parent material). Soil property estimates are of a higher reliability in SOTER areas than in other geographical areas because the proportion of measured profile information is significantly higher. This is illustrated in the next slide where the proportion of the synthetic profile information used in the country is mapped.
- 14. Proportion of synthetic profiles used in SOTWIS Example Senegal
- 15. HWSD Development options (1) The HWSD is the only currently available digital global soil database and will remain so for some time to come, but improvement are required in the quality and quantity of the present data, their geographical coverage and the harmonization process. (1) Improved Geographical coverage (a) A large part of the HWSD coverage that still uses the FAO digital soil map of the world (40%) is located in the industrial world. A commitment of these countries (the largest being Canada, USA, Mexico and Australia) to produce data in the required format would result in significantly enhanced product. This could be undertaken at low cost for instance in universities using the existing excellent national soil databases. (b) Updates in West Africa; Asia, North Africa and the Middle-East are required (largest countries: India, Iran, Nigeria, Saudi Arabia). This would require modest investments and resources channeled to national institutes to produce the required data in the required format. (c) Improvements in soil units as well as in soil properties in all areas would benefit from new SOTER products such as eSOTER and other SOTER products planned in the future.
- 16. HWSD Development options (2) (2) Improved Quality of Soil Property predictions The overall accuracy of taxo-transfer and pedo-transfer functions can be improved by (1) increasing the number of soil profiles used in the prediction and by (2) correcting the soil property predictions for local conditions as done in SOTER. In this respect the ongoing efforts of Globsoil.net project in the systematic collection of soil profile data and the ongoing SOTER studies, which include soil profile data are of particular interest. A mechanism to exchange information between the three approaches should be established. Nevertheless, one should warn against high expectations of users in the achievable accuracy of soil data: Soils are dynamic systems and their properties vary considerably in space and time. It is therefore unrealistic to expect an extremely high accuracy, whatever approach is taken. Also inter and across laboratory analytical results show a high variability
- 17. HWSD Development options (3) (3) Improved Harmonization Harmonization of the units and boundaries can be improved mainly by using the latest soil classification scheme (at the moment the World Reference Base) as a standardized approach. This is not a simple exercise as it would require a systematic re-classification of soil profiles and soil types in WRB and the consequent statistical re-analysis of soil properties in order to develop new taxo-transfer functions. Harmonization of soil laboratory methods and quality control is another issue that may need to be tackled in the long run in order to improve harmonization. These harmonization issues will benefit from the findings and recommentdations of the Global Soil Partnership.
- 18. Thank you