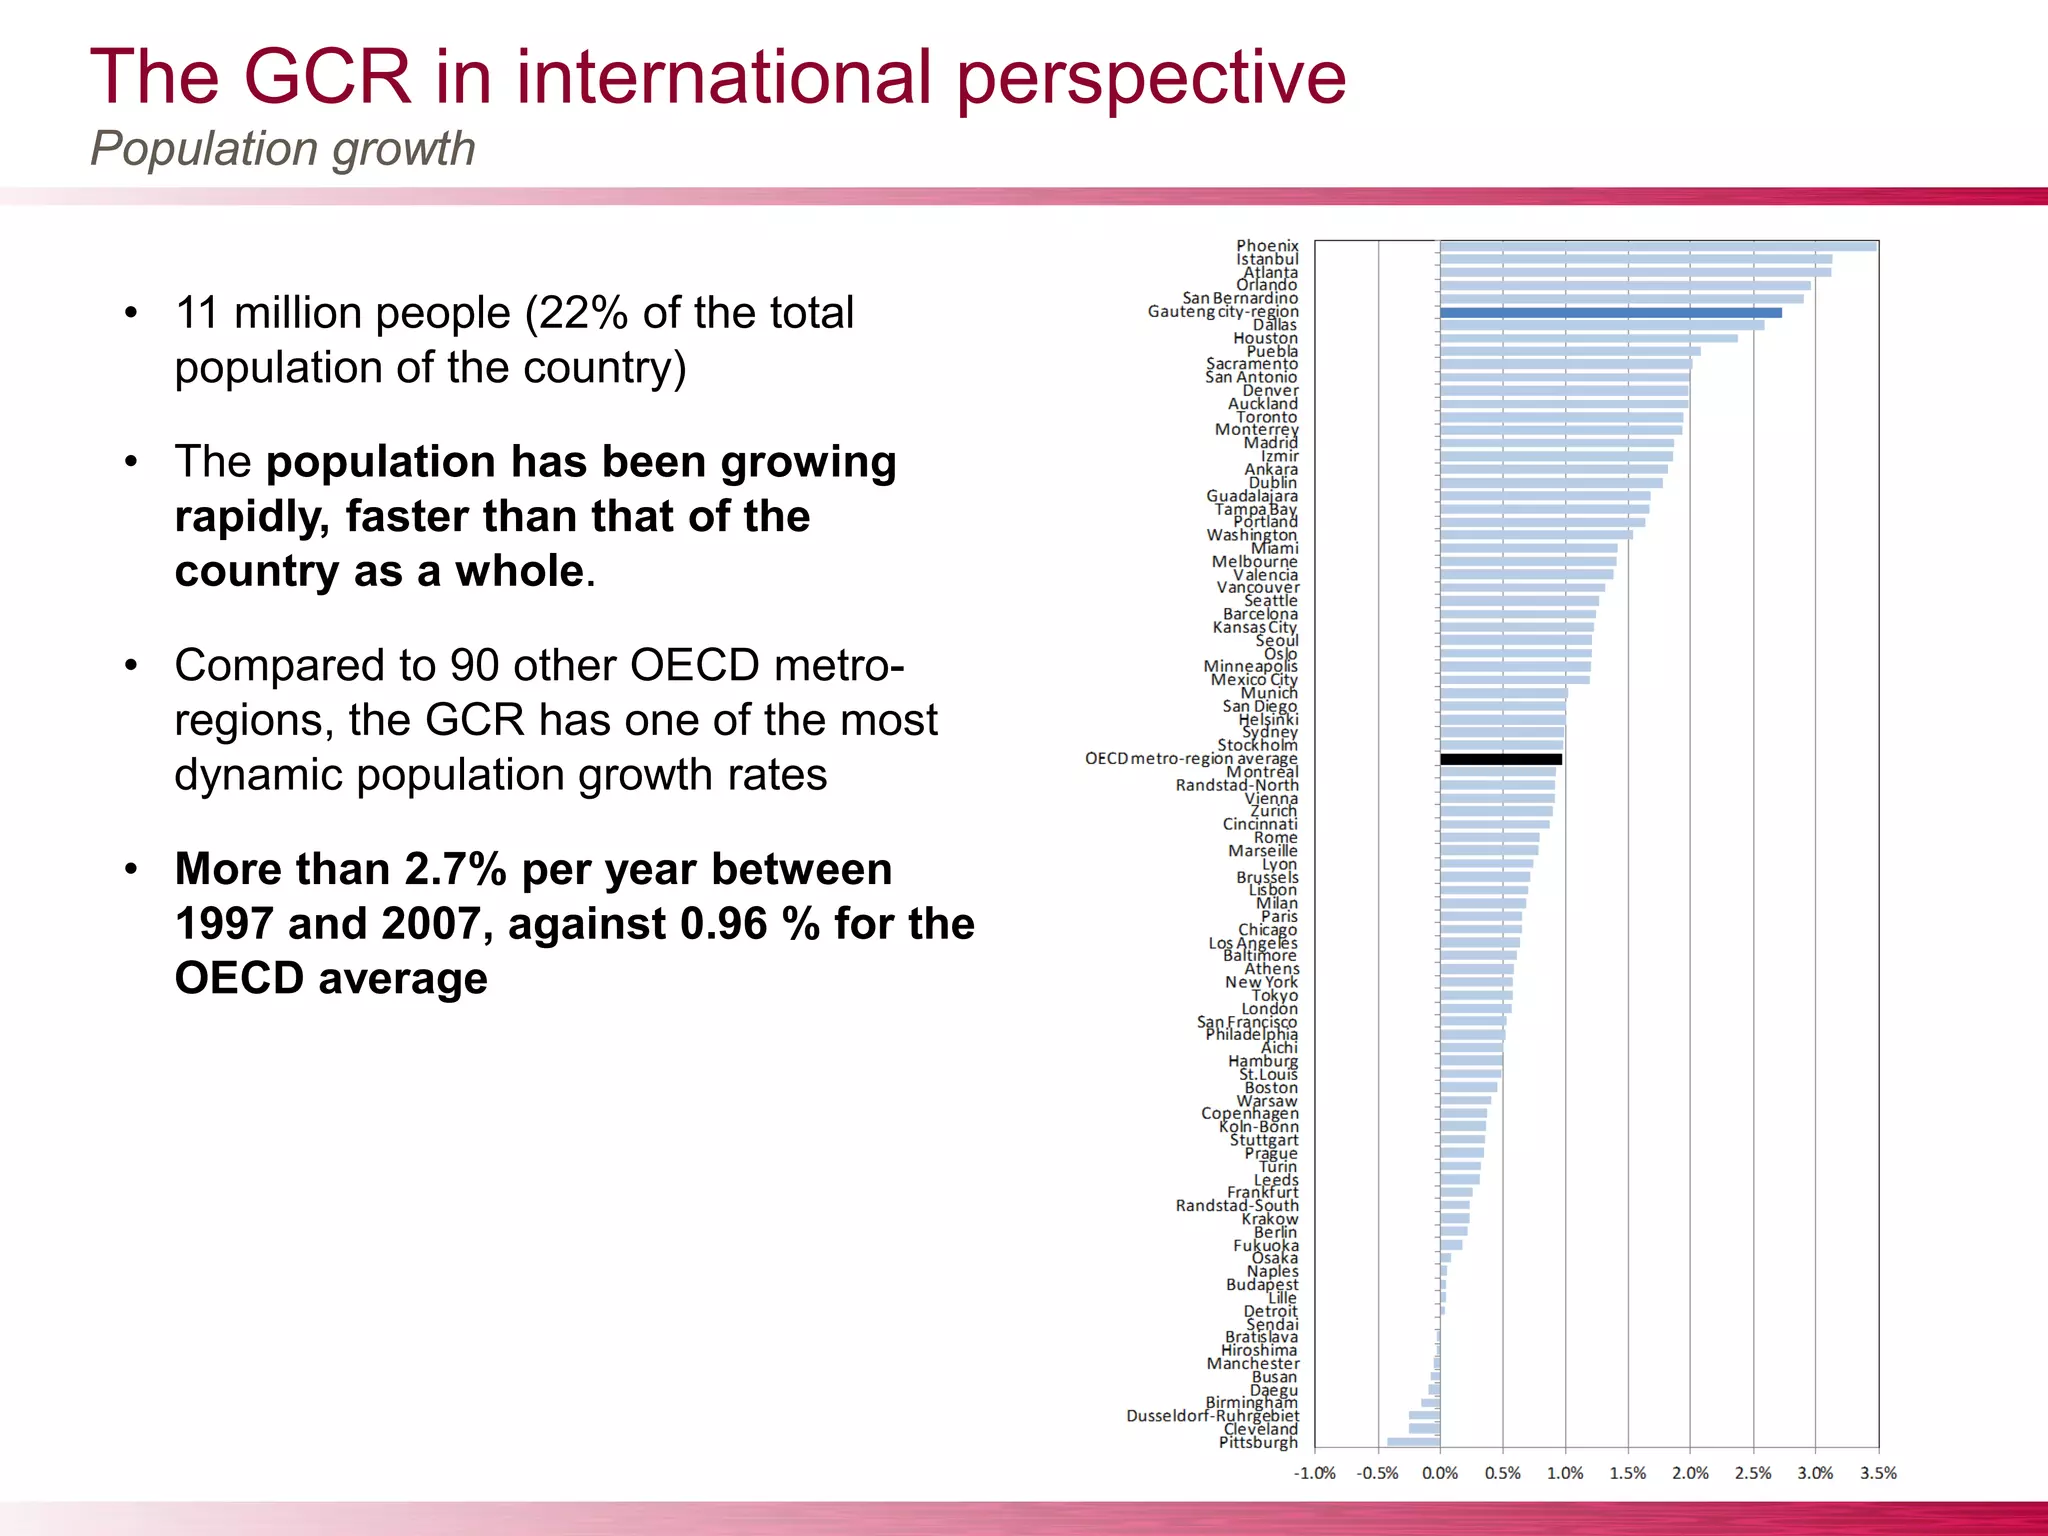
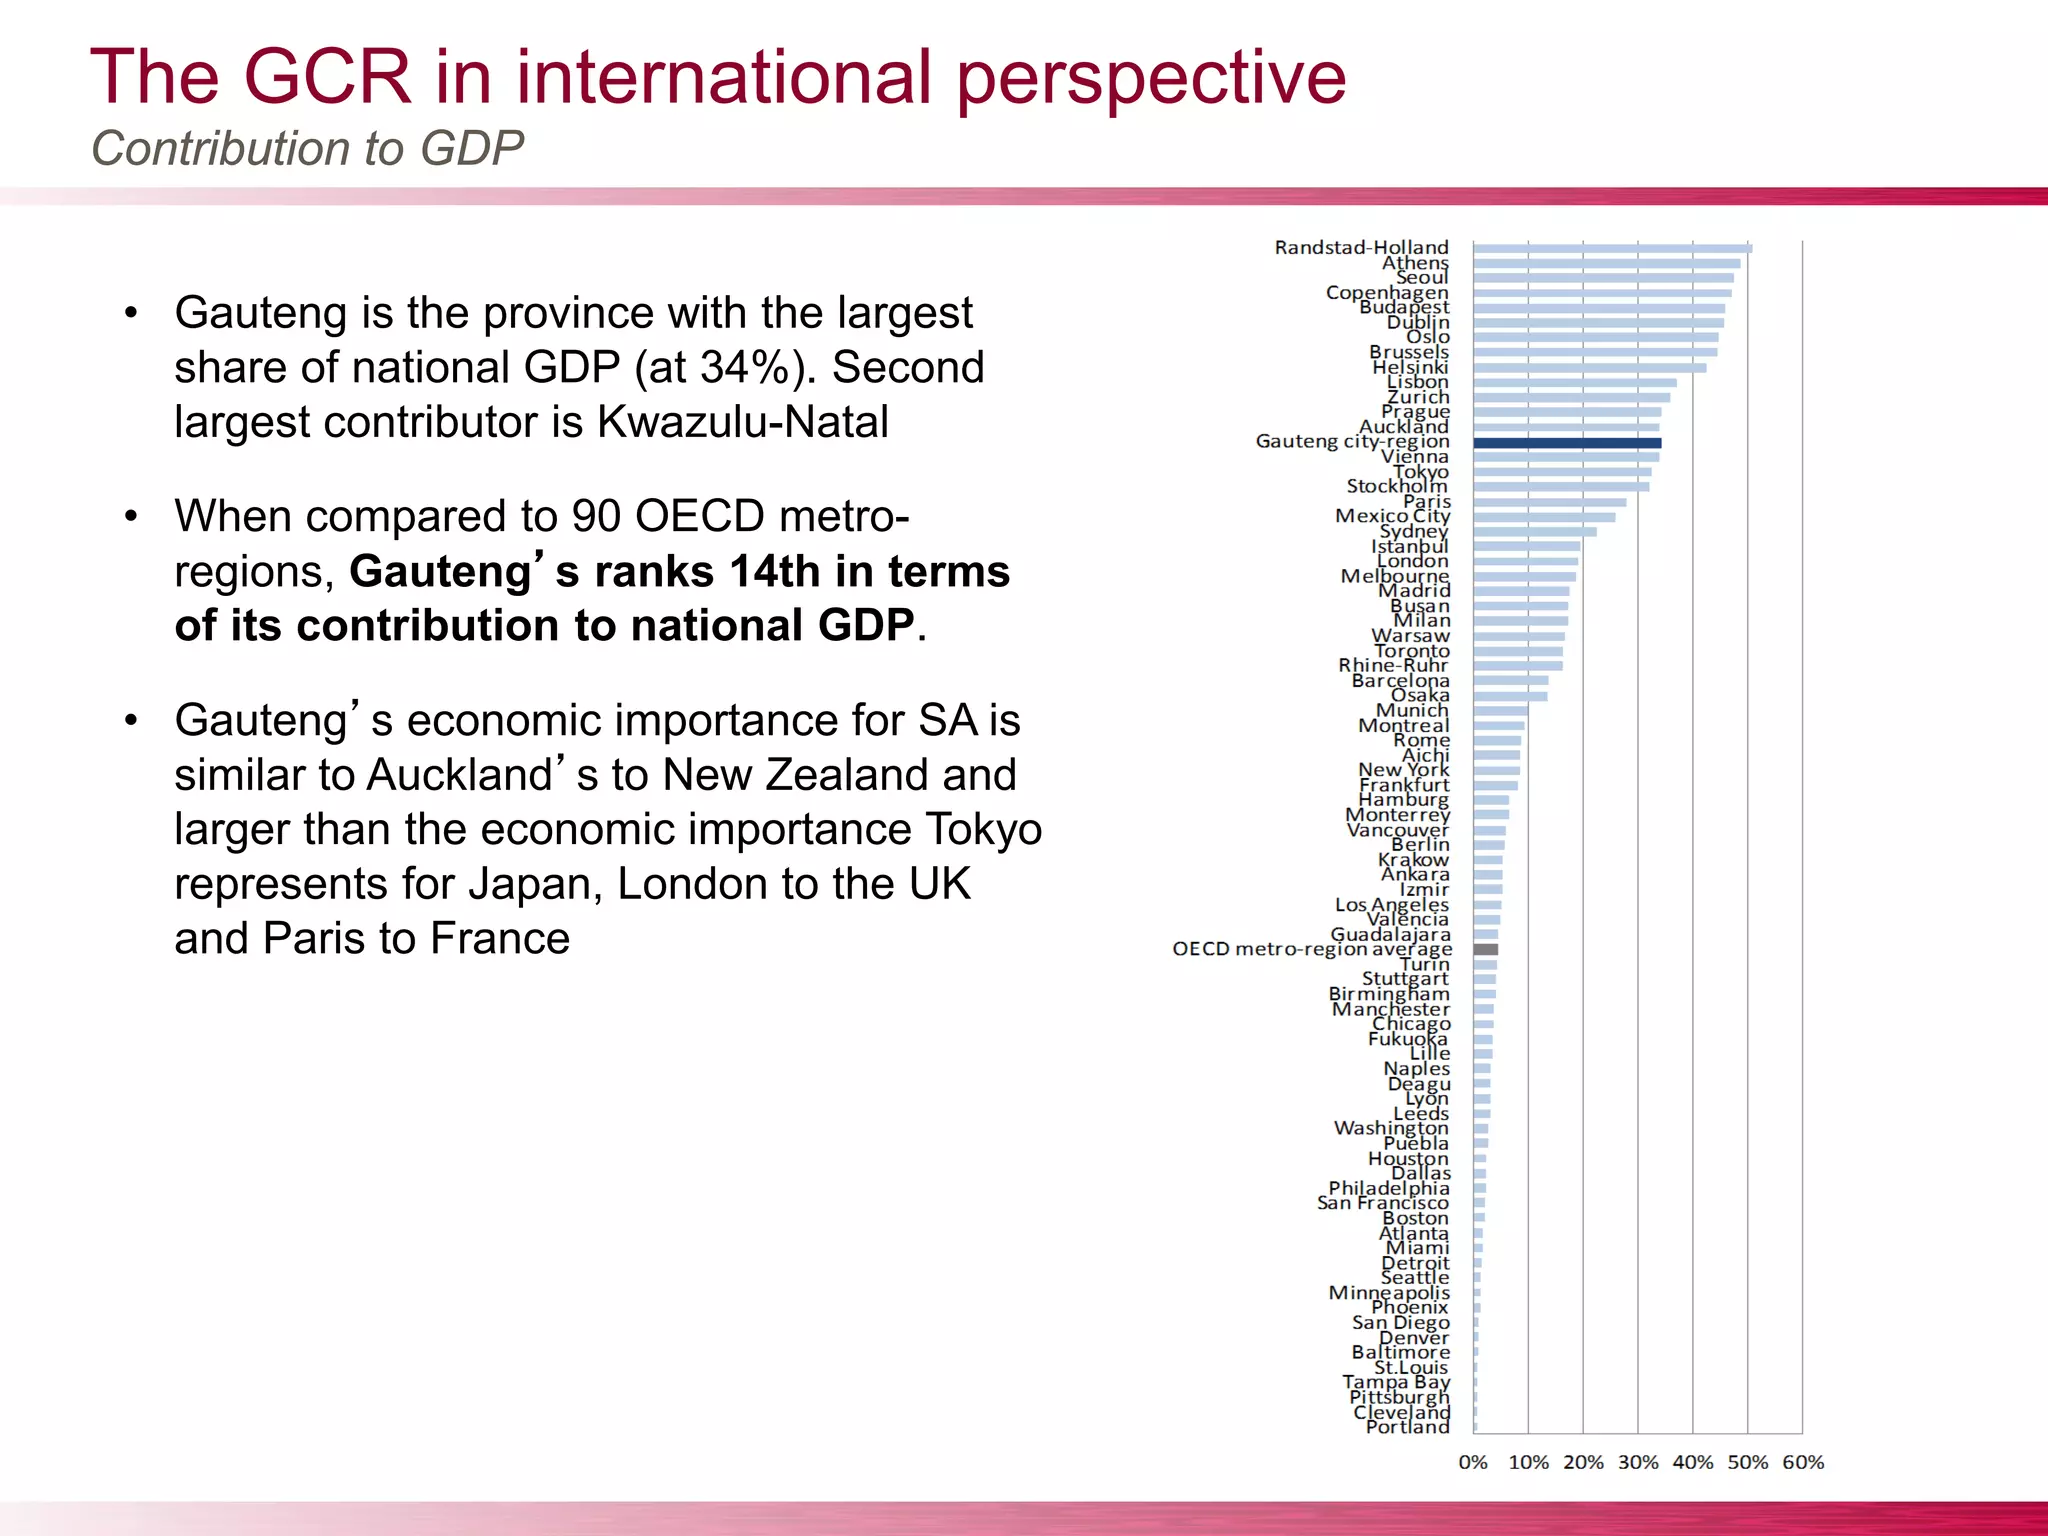
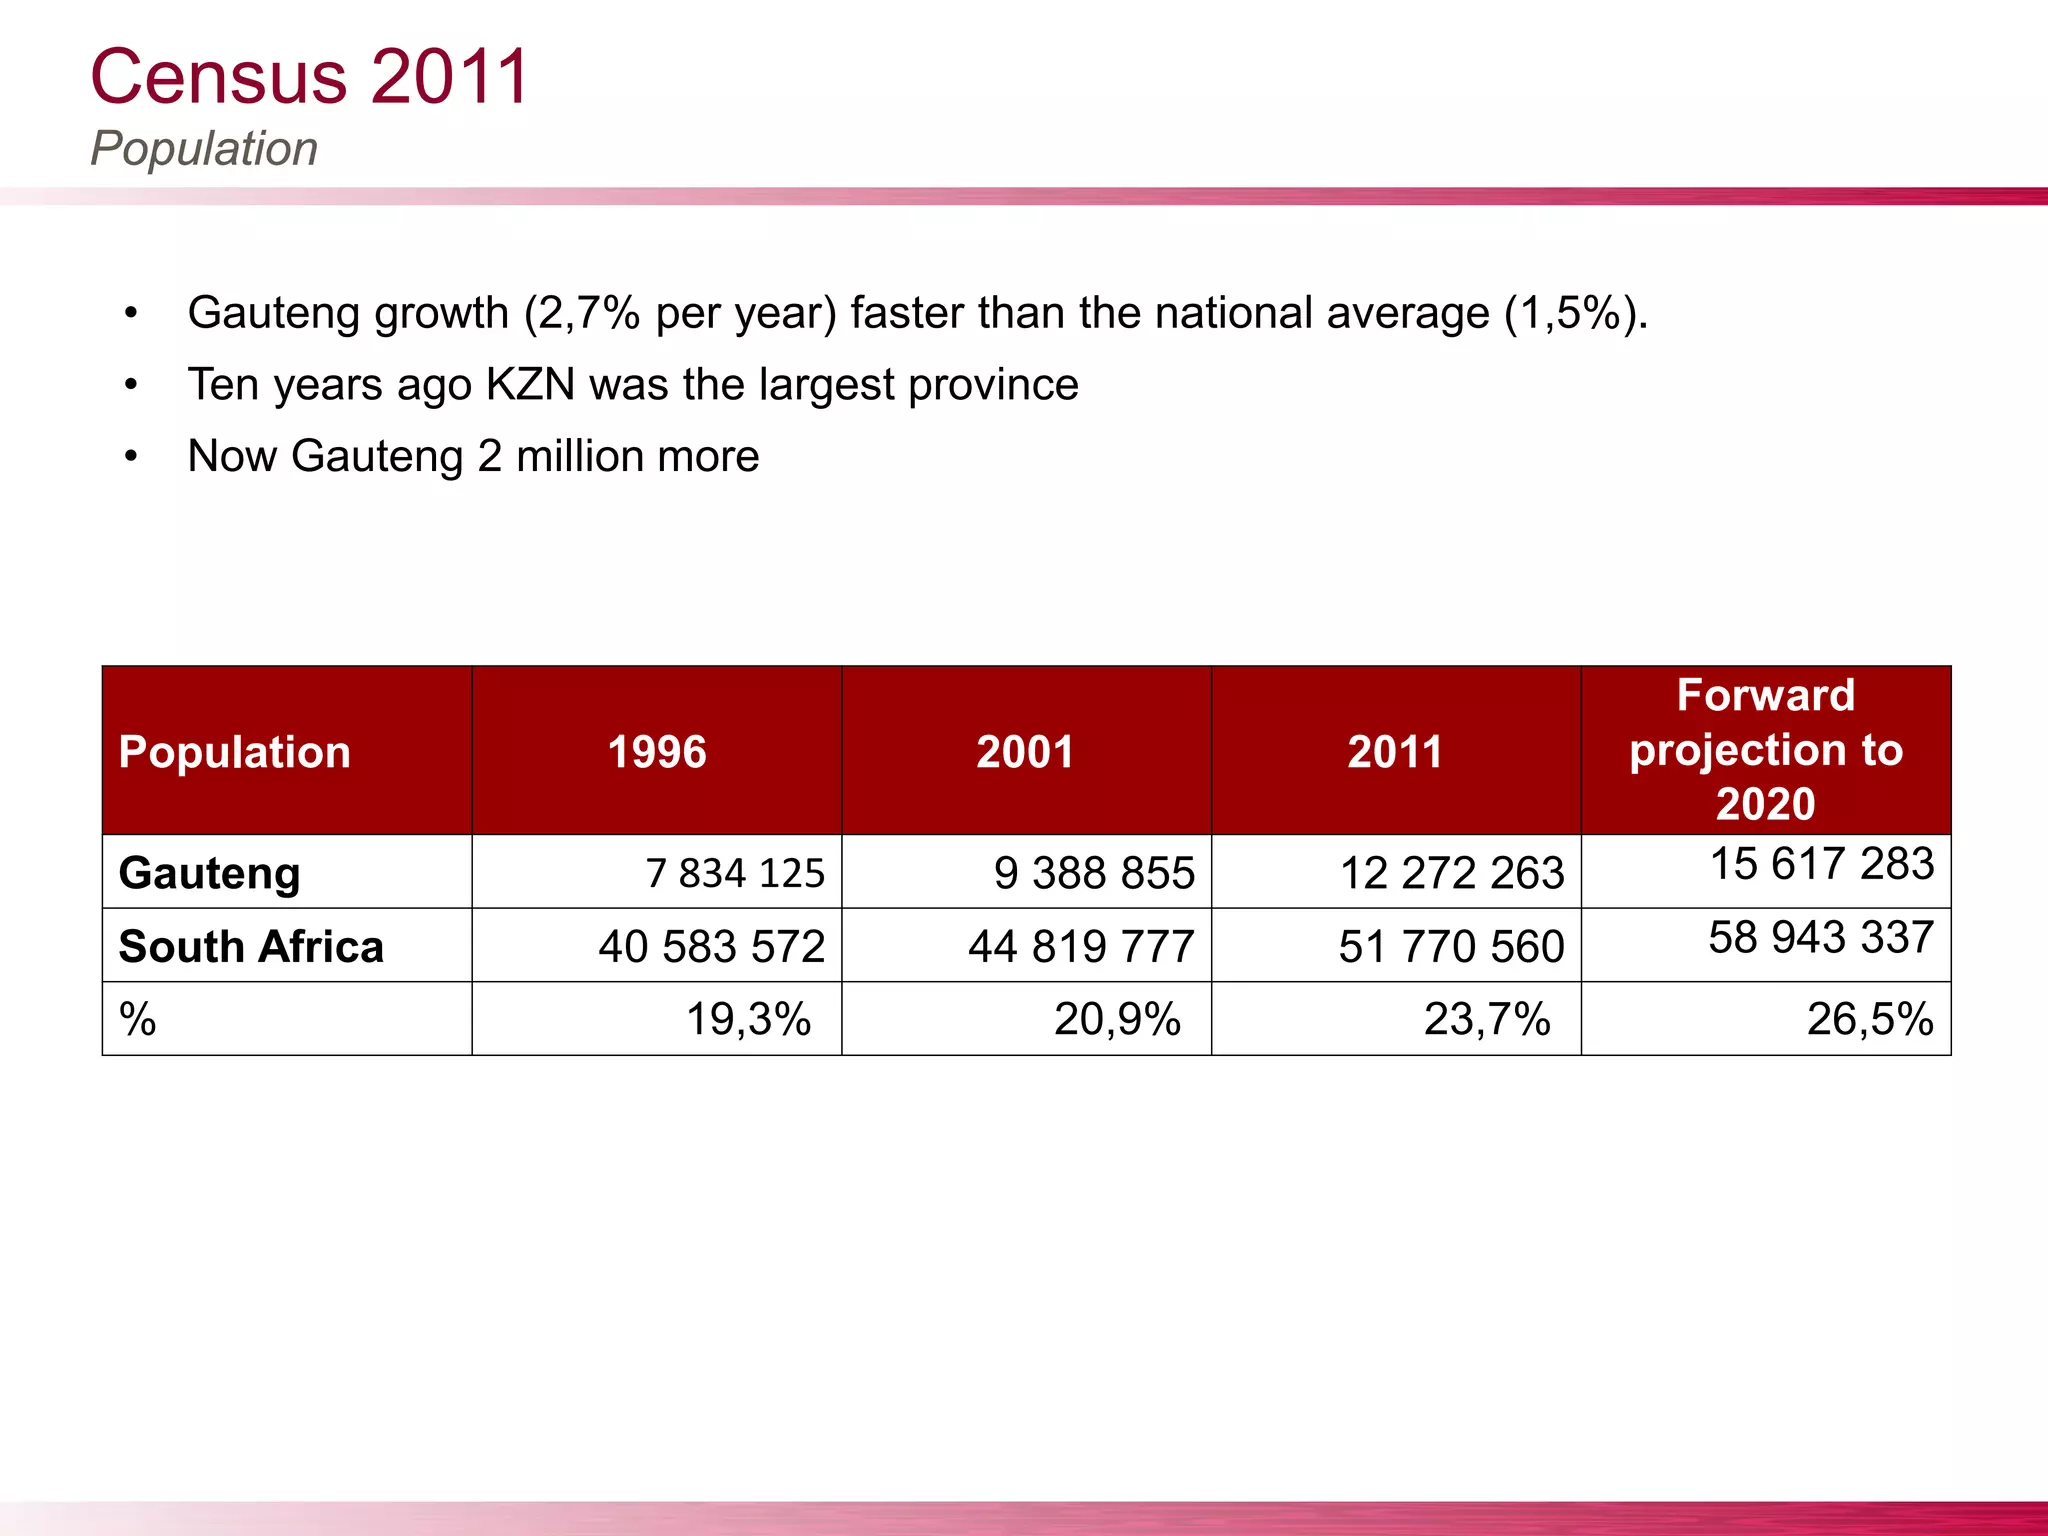
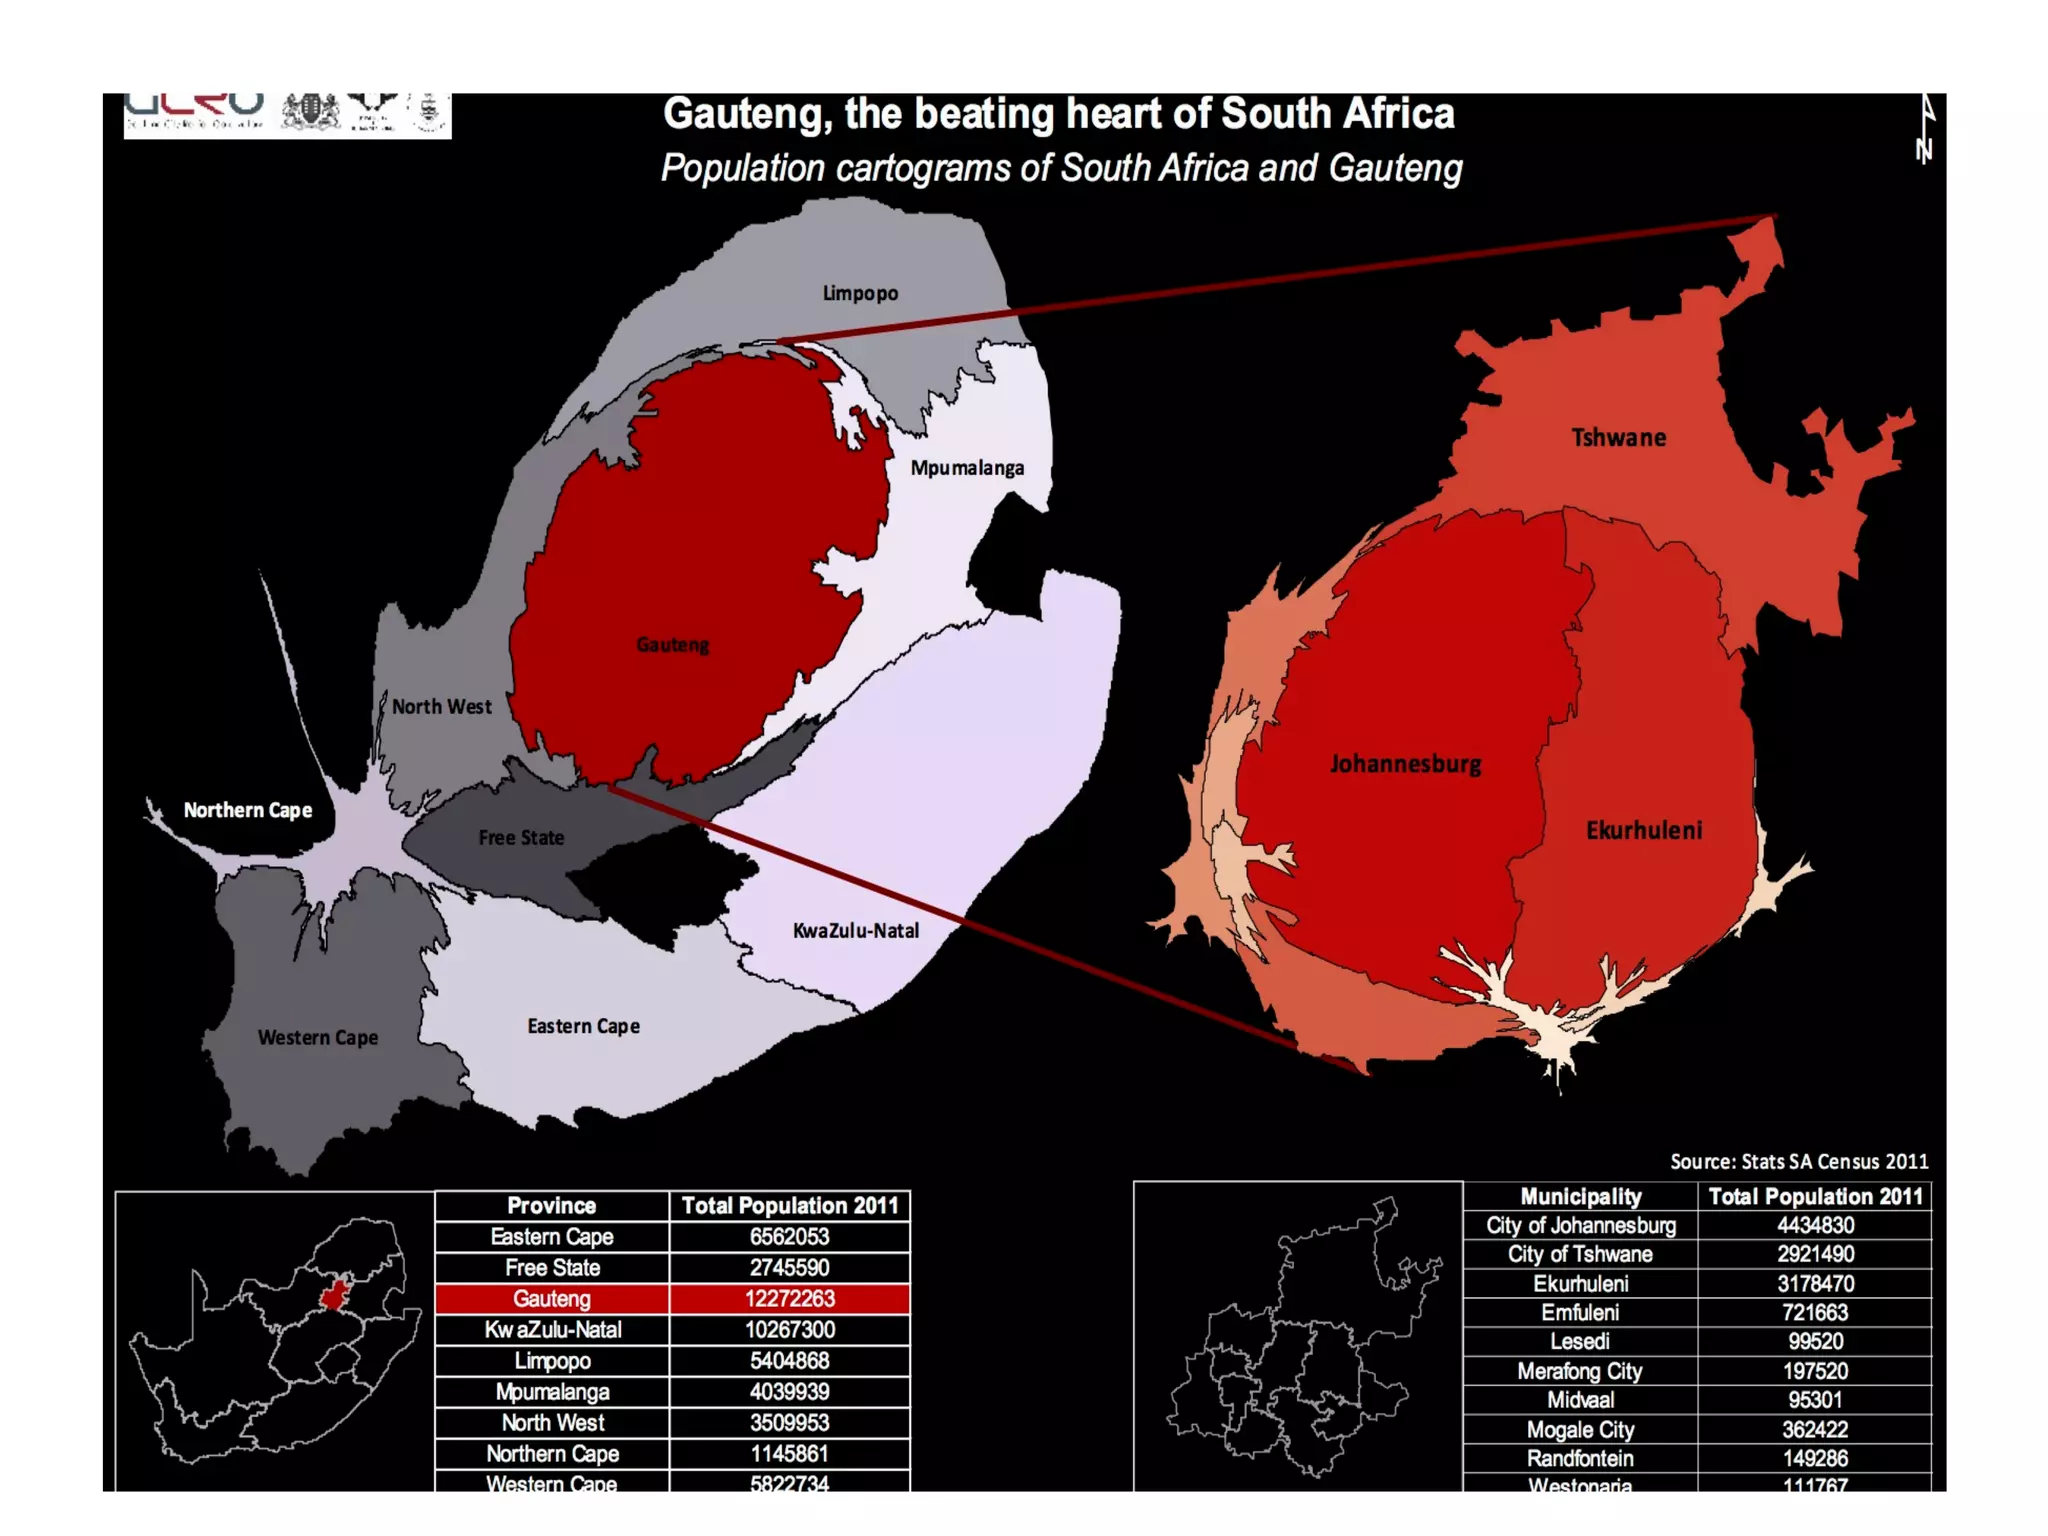
The Gauteng City-Region
Professor David Everatt, Executive Director, GCRO
ESRI Conference, Drakensburg
Quick introduction to the GCRO
• Collect and store data, surveys
• Develop indicators
• GIS analysis and visualisation, websites
Data, indicators and
benchmarks
• Connect government to academic expertise (or vice versa)
Government –
academia portal
• Academic publications
• Hosting of seminars ,colloquia
Academic
contribution
• Become leading research centre
Medium to long
term research
• Open ended sharing data and info between partners
• All universities , all spheres of government, local and international research ,
Urban observatories around the world
Partnership and
networks
• Direct assistance to government
On request policy
work
The changing urban form
The GCR in the national space economy
Location and size
The GCR in the national space economy
Location and size
Initial view
Overview
AfriGIS BizCount
The space economy
The GCR in the national space economy
Location and size
• Gauteng represents 36% of national GDP. The wider city-region represents 43%
The GCR in the national space economy
Location and size
• Gauteng is about 2% of the national land surface, and within this 17% is ‘urban’
• 11 million people (22% of the total
population of the country)
• The population has been growing
rapidly, faster than that of the
country as a whole.
• Compared to 90 other OECD metro-
regions, the GCR has one of the most
dynamic population growth rates
• More than 2.7% per year between
1997 and 2007, against 0.96 % for the
OECD average
Population growth
The GCR in international perspective
• Some aspects of our population seem unique, e.g. low ratio of 65+ to those 15-64
• OECD average 2008: 20,0%
• Gauteng 2008: 6,1%
• Gauteng 2011: 6,9%
Old age dependency rate
The GCR in international perspective
• Gauteng is the province with the largest
share of national GDP (at 34%). Second
largest contributor is Kwazulu-Natal
• When compared to 90 OECD metro-
regions, Gauteng’s ranks 14th in terms
of its contribution to national GDP.
• Gauteng’s economic importance for SA is
similar to Auckland’s to New Zealand and
larger than the economic importance Tokyo
represents for Japan, London to the UK
and Paris to France
Contribution to GDP
The GCR in international perspective
• Reasonably impressive growth in GDP
• OECD average 2001-2007: 2,2%
• Gauteng 2001-2007: 5,1%
• Gauteng 2001-2010: 4,1%
Average annual % change in GDP (constant prices)
The GCR in international perspective
• Although Gauteng is one of the provinces
with the lowest unemployment rate in South
Africa, its unemployment rate is the
highest across OECD metro-regions, an
issue which the economic crisis has only
amplified.
Unemployment
The GCR in international perspective
• Further, Gauteng’s employment has expanded much faster than other regions
• OECD average 2001-2009: 0,7%
• Gauteng 2001-2009: 3,8%
• Gauteng 2001-2011: 3,7%
Average annual % change in employment
The GCR in international perspective
• Gauteng growth (2,7% per year) faster than the national average (1,5%).
• Ten years ago KZN was the largest province
• Now Gauteng 2 million more
Population
Census 2011
Population 1996 2001 2011
Forward
projection to
2020
Gauteng 7 834 125 9 388 855 12 272 263 15 617 283
South Africa 40 583 572 44 819 777 51 770 560 58 943 337
% 19,3% 20,9% 23,7% 26,5%
Gauteng’s population increased by 2.9 million people from 2001 to 2011
Total population = 12.3 million people
Gauteng’s population as a share of the nation’s
Census 2011
• OECD average 2008: 5 041 771
• Gauteng 2008: 10 784 862
Population
Census 2011
We’re getting better … but still live apart
Population
by race
South Africa
Census 2011
Gauteng
Census 2011
Gauteng
GCRO Quality of
Life Survey 2011
African 79,2% 77,4% 77,4%
Coloured 8,9% 3,5% 3,4%
Indian/Asian 2,5% 2,9% 3,3%
White 8,9% 15,6% 15,9%
Other 0,5% 0,7% NA
Total 100% 100% 100%
Census by race (watch those ‘minorities’)
Where we live
• Population pyramid shows greater proportions in the 20-34 age groups
• Lower proportions in older groupings
• A typical signature of a region where a key population dynamic is migration
Population
Census 2011
Density
Census 2011
Trends that need deeper exploration
• Population growth in some municipalities much slower
Population 1996 2001 2011 2001-2011
City of Cape Town 2562280 2892240 3740030 29,3%
City of Johannesburg 2638470 3226060 4434830 37,5%
City of Tshwane 1792360 2142320 2921490 36,4%
Ekurhuleni 2026980 2481760 3178470 28,1%
Emfuleni 597285 657949 721663 9,7%
Lesedi 66206 71868 99520 38,5%
Midvaal 53353 64271 95301 48,3%
Merafong City 209727 210481 197520 -6,2%
Mogale City 226446 295505 362422 22,6%
Randfontein 107711 128842 149286 15,9%
Westonaria 115592 109799 111767 1,8%
Core & periphery or more complex?
Gauteng
Census 1996
Gauteng
Census 2001
Gauteng
Census 2011
Gauteng
GCRO Quality
of Life Survey
2011
None 9,7% 8,7% 3,7% 2,8%
Primary only 18,3% 17,1% 10,8% 13,5%
Secondary
incomplete
39,3% 34,2% 33,0% 32,9%
Matric 22,8% 27,7% 34,4% 30,8%
More 9,9% 12,3% 18,1% 20,0%
Total 100% 100% 100% 100%
% of 20 years+ by highest level of education achieved
3. Education
3. Housing
Formal vs informal
household
Gauteng
Census 1996
Gauteng
Census 2001
Gauteng
Census 2011
Gauteng
GCRO Quality of
Life Survey 2011
Formal 74,8% 74,4% 79,8% 87,7%
Informal & traditional 24,8% 25,2% 19,3% 12,2%
Other 0,3% 0,3% 0,9% 0,1%
Total 100% 100% 100% 100%
0
2
4
6
8
10
12
14
Tshwane
Ekurhuleni
Johannesburg
Mogale City
Randfontein
Westonaria
Merafong City
Emfuleni
Midvaal
Lesedi
2009
2011
Housing as the single biggest perceived problem decreased from 2009 to 2011
among the sample respondents:
* For evaluation purposes the 2011 municipal boundaries are used (2009 data for Kungwini and Nokeng is thus combined with
that of Tshwane); : ‘0 percent position’
Percent
What is the main problem facing your community?
Access to piped water
Access to toilets
Access to
piped water
Gauteng
Census
1996
Gauteng
Census
2001
Gauteng
Census
2011
QoL 2011
Gauteng 96,2% 97,1% 98,2% 97,0%
South Africa 80,3% 84,5% 91,2%
Access to
toilet
facility
Gauteng
Census
1996
Gauteng
Census
2001
Gauteng
Census
2011
QoL 2011
Access to a
flush toilet
95,2% 94,2% 96,3% 96,2%
Bucket
toilet
2,4% 2,2% 1,8% 2,4%
No toilet 2,4% 3,6% 1,9% 1,4%
Total 100% 100% 100% 100%
Electricty
South African & GCR trends
Gauteng city-region urban and other
South African & GCR trends
Gauteng city-region settlement type
South African & GCR trends
GCR hotspot density analysis of businesses
South African & GCR trends
Gauteng’s green infrastructure network
South African & GCR trends
Gauteng’s grey vs. green infrastructure
Satisfaction with dwelling
Satisfaction with water
Satisfaction with sanitation
Satisfaction with waste removal
Satisfaction with energy sources
Satisfaction with roads
Satisfaction with cost of municipal services
Satisfaction with billing of services
Community
‘What is the main health problem facing your
community?’
2009, HIV/AIDS,
49
2009, Alcohol, 11
2009, Drugs, 82009, High BP, 72009, TB, 6
2009, Diabetes, 42009, Teen preg, 4
2011, HIV/AIDS,
28
2011, Alcohol, 16
2011, Drugs, 11
2011, High BP, 72011, TB, 8
2011, Diabetes, 42011, Teen preg, 5
2009
2011
Household access to communications
0.0%
20.0%
40.0%
60.0%
80.0%
100.0%
Ekurhuleni
Emfuleni
Johannesb
urg
Lesedi
Merafong
MidvaalMogale
Randfontei
n
Tshwane
Westonari
a
Total
Cellphone
Television
Radio/music system
PC/laptop
Landline
Internet
Values & attitudes
68 69
58 55 56 56
40 41
12 10
11 17 14
19
17
22
20 21
32 28 30
25
43
37
0%
10%
20%
30%
40%
50%
60%
70%
80%
90%
100%
African
2009
African
2011
Coloured
2009
Coloured
2011
Indian
2009
Indian
2011
White
2009
White
2011
Disagree
Neutral
Agree
We are
failing to
build non-
racialism in
Gauteng
Blacks and whites will never really trust each other
Indians do not deserve to benefit from affirmative action
22
15
20 22
29
18
20
27
49
67
59
51
0
10
20
30
40
50
60
70
80
90
100
African Indian Coloured White
Disagree
Neutral
Agree
Note how
African and
white
respondents
least likely to
disagree, most
likely to agree
or sit in the
‘neutral’
category
Coloureds are helping to build the new South Africa
36
42
57
51
29
30
21
27
35
28
23 22
0%
10%
20%
30%
40%
50%
60%
70%
80%
90%
100%
African Indian Coloured White
Disagree
Neutral
Agree
When the
question is
about
coloureds,
Indians and
Africans are
hostile while
whites support
as playing a
positive role in
SA
‘Corruption is main threat to our democracy’
Total, Strongly
agree, 36
Total, Agree, 48
Total, Neutral, 9
Total, Disagree, 6
Total, Strongly
disagree, 1
African, Strongly
agree, 36
African, Agree, 49
African, Neutral, 8 African, Disagree,
6
African, Strongly
disagree, 1
Coloured, Strongly
agree, 37
Coloured, Agree,
48
Coloured, Neutral,
9 Coloured,
Disagree, 5 Coloured, Strongly
disagree, 1
Indian, Strongly
agree, 33
Indian, Agree, 51
Indian, Neutral,
10
Indian, Disagree, 5
Indian, Strongly
disagree, 0
White, Strongly
agree, 40 White, Agree, 41
White, Neutral, 11
White, Disagree, 7
White, Strongly
disagree, 1
Total
African
Coloured
Indian
White
Satisfaction (or not!) with government 09/11
Satisfied 09,
National, 57
Satisfied 09,
Provincial, 50
Satisfied 09, Local
govt, 40
Satisfied '11,
National, 39
Satisfied '11,
Provincial, 34
Satisfied '11, Local
govt, 33
Neither 09,
National, 19
Neither 09,
Provincial, 21
Neither 09, Local
govt, 20
Neither '11,
National, 19
Neither '11,
Provincial, 22 Neither '11, Local
govt, 19
Dissatsfied 09,
National, 24
Dissatsfied 09,
Provincial, 29
Dissatsfied 09,
Local govt, 40Dissatisfied '11,
National, 37
Dissatisfied '11,
Provincial, 44
Dissatisfied '11,
Local govt, 48
Satisfied 09
Satisfied '11
Neither 09
Neither '11
Dissatsfied 09
Dissatisfied '11
Batho Pele
• Only 19% believe public
servants act according to
Batho Pele principles
(explained to respondent)
down from 27% in 2009
• Only 16% of residents in
informal settlements
• 18,2% in Johannesburg
• 51% do not think public
servants act according to
Batho Pele (57% in 2009) –
remainder do not interact
• 51,3% in Johannesburg
Corruption
• 10% had ever been
asked to pay a bribe by a
public servant
• 8% of Africans, 16% of
Asian/Indians and 18% of
whites had been asked
for a bribe
• Migrants were not more
likely to have been asked
to pay a bribe than non-
migrants
• 10,8% asked to pay a
bribe in Johannesburg
Batho Pele and Corruption
Economy, income
etc
Employment destinations
A mobile GCR
Migration & migrants
Migration to Gauteng
Origins of internal migrants to GP (all origin points)
Origins of internal & cross border migrants
Provinces of origin of
internal migrants (%)
Region of origin of cross
border migrants (%)
76%
12%
7%
3% 1% 1% 0.30%
0%
10%
20%
30%
40%
50%
60%
70%
80%
29%
19%
13%
12% 12%
9%
3% 3%
0%
5%
10%
15%
20%
25%
30%
35%
Attitudes to cross border migrants & migration
Attitudes to migration policy
Attitudes to migrants
• 2.3 % identified ‘foreigners’
as the biggest/second
biggest problem facing their
community (0.5% 1st
mention, 1.8% 2nd mention)
– Compares to 2.7% in 2009
– 18th in importance for 1st
mention and 14th in
importance for 2nd mention
• Attitudes to policy
consistent across all groups
– BUT when asked to name
biggest problem in
community the most
educated, whites, Indians,
and those living in informal
housing were most likely to
name ‘foreigners’
32%
21%
47%
Send
foreigners
home
Let
foreigners
stay
Only allow
legal
foreigners
Quality of Life
QoL dimensions – means (2009/2011)
Health, 2009, 0.72
Health, 2011, 0.72
Infrastructure, 2009,
0.78
Infrastructure, 2011,
0.78
Dwelling, 2009, 0.71
Dwelling, 2011, 0.78
Family, 2009, 0.7
Family, 2011, 0.69
Community, 2009,
0.65
Community, 2011,
0.64
Connectivity, 2009,
0.62
Connectivity, 2011,
0.64
Global, 2009, 0.56
Global, 2011, 0.53
Security, 2009, 0.56
Security, 2011, 0.58
Socio-political, 2009,
0.53
Socio-political, 2011,
0.48
Work, 2009, 0.43
Work, 2011, 0.42
Work
Socio-political
Security
Global
Connectivity
Community
Family
Dwelling
Infrastructure
Health
2009 mean: 6.24 2011 mean: 6.25
QoL means by municipality
Randfontein,
Category 1, 6.45
Midvaal,
Category 1, 6.42
Tshwane,
Category 1, 6.33
Johannesburg,
Category 1, 6.32
Lesedi, Category
1, 6.27
Merafong City,
Category 1, 6.22
Mogale City,
Category 1, 6.22
Emfuleni,
Category 1, 6.21
Ekurhuleni,
Category 1, 6.10
Westonaria,
Category 1, 5.77
Westonaria
Ekurhuleni
Emfuleni
Mogale City
Merafong City
Lesedi
Johannesburg
Tshwane
Midvaal
Randfontein
Some conclusions
o Mood is very low. This is natural between elections, as part of national (and
provincial and local) mood cycles, but equally clearly, there is a substantial loss of
faith in politicians and a belief that corruption is the biggest threat facing
democracy in Gauteng
o Delivery looks very positive, if uneven across municipalities. Delivery of services
can always be improved; but – despite the rash of protests – does not seem to be
a major problem.
o What we seem to be missing is the energy or spirit or vision that holds
together our varied and cosmopolitan population – G2055?
o We need to make brave commitments re Gauteng. Basic needs messages will
not resonate sufficiently, any more. Commitments about the last RDP house, the
end of racial classification, the sign-posts that tell us when Gauteng will be
‘normal’ – this is what people want.
o Clearly, we face challenges – but they are of the more intangible, less easy to
resolve, type. Basic service delivery alone may not be the answer.
o Gauteng has delivered on the RDP. But what next?
Thank you

The Gauteng City Region keynote address

  • 1.
    The Gauteng City-Region ProfessorDavid Everatt, Executive Director, GCRO ESRI Conference, Drakensburg
  • 2.
    Quick introduction tothe GCRO • Collect and store data, surveys • Develop indicators • GIS analysis and visualisation, websites Data, indicators and benchmarks • Connect government to academic expertise (or vice versa) Government – academia portal • Academic publications • Hosting of seminars ,colloquia Academic contribution • Become leading research centre Medium to long term research • Open ended sharing data and info between partners • All universities , all spheres of government, local and international research , Urban observatories around the world Partnership and networks • Direct assistance to government On request policy work
  • 3.
  • 4.
    The GCR inthe national space economy Location and size
  • 5.
    The GCR inthe national space economy Location and size
  • 6.
  • 7.
  • 8.
    The GCR inthe national space economy Location and size • Gauteng represents 36% of national GDP. The wider city-region represents 43%
  • 9.
    The GCR inthe national space economy Location and size • Gauteng is about 2% of the national land surface, and within this 17% is ‘urban’
  • 10.
    • 11 millionpeople (22% of the total population of the country) • The population has been growing rapidly, faster than that of the country as a whole. • Compared to 90 other OECD metro- regions, the GCR has one of the most dynamic population growth rates • More than 2.7% per year between 1997 and 2007, against 0.96 % for the OECD average Population growth The GCR in international perspective
  • 11.
    • Some aspectsof our population seem unique, e.g. low ratio of 65+ to those 15-64 • OECD average 2008: 20,0% • Gauteng 2008: 6,1% • Gauteng 2011: 6,9% Old age dependency rate The GCR in international perspective
  • 12.
    • Gauteng isthe province with the largest share of national GDP (at 34%). Second largest contributor is Kwazulu-Natal • When compared to 90 OECD metro- regions, Gauteng’s ranks 14th in terms of its contribution to national GDP. • Gauteng’s economic importance for SA is similar to Auckland’s to New Zealand and larger than the economic importance Tokyo represents for Japan, London to the UK and Paris to France Contribution to GDP The GCR in international perspective
  • 13.
    • Reasonably impressivegrowth in GDP • OECD average 2001-2007: 2,2% • Gauteng 2001-2007: 5,1% • Gauteng 2001-2010: 4,1% Average annual % change in GDP (constant prices) The GCR in international perspective
  • 14.
    • Although Gautengis one of the provinces with the lowest unemployment rate in South Africa, its unemployment rate is the highest across OECD metro-regions, an issue which the economic crisis has only amplified. Unemployment The GCR in international perspective
  • 15.
    • Further, Gauteng’semployment has expanded much faster than other regions • OECD average 2001-2009: 0,7% • Gauteng 2001-2009: 3,8% • Gauteng 2001-2011: 3,7% Average annual % change in employment The GCR in international perspective
  • 16.
    • Gauteng growth(2,7% per year) faster than the national average (1,5%). • Ten years ago KZN was the largest province • Now Gauteng 2 million more Population Census 2011 Population 1996 2001 2011 Forward projection to 2020 Gauteng 7 834 125 9 388 855 12 272 263 15 617 283 South Africa 40 583 572 44 819 777 51 770 560 58 943 337 % 19,3% 20,9% 23,7% 26,5%
  • 18.
    Gauteng’s population increasedby 2.9 million people from 2001 to 2011 Total population = 12.3 million people Gauteng’s population as a share of the nation’s Census 2011
  • 19.
    • OECD average2008: 5 041 771 • Gauteng 2008: 10 784 862 Population Census 2011
  • 20.
    We’re getting better… but still live apart
  • 21.
    Population by race South Africa Census2011 Gauteng Census 2011 Gauteng GCRO Quality of Life Survey 2011 African 79,2% 77,4% 77,4% Coloured 8,9% 3,5% 3,4% Indian/Asian 2,5% 2,9% 3,3% White 8,9% 15,6% 15,9% Other 0,5% 0,7% NA Total 100% 100% 100% Census by race (watch those ‘minorities’)
  • 22.
  • 23.
    • Population pyramidshows greater proportions in the 20-34 age groups • Lower proportions in older groupings • A typical signature of a region where a key population dynamic is migration Population Census 2011
  • 24.
  • 25.
    Trends that needdeeper exploration • Population growth in some municipalities much slower Population 1996 2001 2011 2001-2011 City of Cape Town 2562280 2892240 3740030 29,3% City of Johannesburg 2638470 3226060 4434830 37,5% City of Tshwane 1792360 2142320 2921490 36,4% Ekurhuleni 2026980 2481760 3178470 28,1% Emfuleni 597285 657949 721663 9,7% Lesedi 66206 71868 99520 38,5% Midvaal 53353 64271 95301 48,3% Merafong City 209727 210481 197520 -6,2% Mogale City 226446 295505 362422 22,6% Randfontein 107711 128842 149286 15,9% Westonaria 115592 109799 111767 1,8%
  • 26.
    Core & peripheryor more complex?
  • 27.
    Gauteng Census 1996 Gauteng Census 2001 Gauteng Census2011 Gauteng GCRO Quality of Life Survey 2011 None 9,7% 8,7% 3,7% 2,8% Primary only 18,3% 17,1% 10,8% 13,5% Secondary incomplete 39,3% 34,2% 33,0% 32,9% Matric 22,8% 27,7% 34,4% 30,8% More 9,9% 12,3% 18,1% 20,0% Total 100% 100% 100% 100% % of 20 years+ by highest level of education achieved
  • 28.
  • 29.
    3. Housing Formal vsinformal household Gauteng Census 1996 Gauteng Census 2001 Gauteng Census 2011 Gauteng GCRO Quality of Life Survey 2011 Formal 74,8% 74,4% 79,8% 87,7% Informal & traditional 24,8% 25,2% 19,3% 12,2% Other 0,3% 0,3% 0,9% 0,1% Total 100% 100% 100% 100%
  • 30.
    0 2 4 6 8 10 12 14 Tshwane Ekurhuleni Johannesburg Mogale City Randfontein Westonaria Merafong City Emfuleni Midvaal Lesedi 2009 2011 Housingas the single biggest perceived problem decreased from 2009 to 2011 among the sample respondents: * For evaluation purposes the 2011 municipal boundaries are used (2009 data for Kungwini and Nokeng is thus combined with that of Tshwane); : ‘0 percent position’ Percent What is the main problem facing your community?
  • 32.
  • 33.
    Access to toilets Accessto piped water Gauteng Census 1996 Gauteng Census 2001 Gauteng Census 2011 QoL 2011 Gauteng 96,2% 97,1% 98,2% 97,0% South Africa 80,3% 84,5% 91,2% Access to toilet facility Gauteng Census 1996 Gauteng Census 2001 Gauteng Census 2011 QoL 2011 Access to a flush toilet 95,2% 94,2% 96,3% 96,2% Bucket toilet 2,4% 2,2% 1,8% 2,4% No toilet 2,4% 3,6% 1,9% 1,4% Total 100% 100% 100% 100%
  • 34.
  • 35.
    South African &GCR trends Gauteng city-region urban and other
  • 36.
    South African &GCR trends Gauteng city-region settlement type
  • 37.
    South African &GCR trends GCR hotspot density analysis of businesses
  • 38.
    South African &GCR trends Gauteng’s green infrastructure network
  • 39.
    South African &GCR trends Gauteng’s grey vs. green infrastructure
  • 40.
  • 41.
  • 42.
  • 43.
  • 44.
  • 45.
  • 46.
    Satisfaction with costof municipal services
  • 47.
  • 48.
  • 49.
    ‘What is themain health problem facing your community?’ 2009, HIV/AIDS, 49 2009, Alcohol, 11 2009, Drugs, 82009, High BP, 72009, TB, 6 2009, Diabetes, 42009, Teen preg, 4 2011, HIV/AIDS, 28 2011, Alcohol, 16 2011, Drugs, 11 2011, High BP, 72011, TB, 8 2011, Diabetes, 42011, Teen preg, 5 2009 2011
  • 50.
    Household access tocommunications 0.0% 20.0% 40.0% 60.0% 80.0% 100.0% Ekurhuleni Emfuleni Johannesb urg Lesedi Merafong MidvaalMogale Randfontei n Tshwane Westonari a Total Cellphone Television Radio/music system PC/laptop Landline Internet
  • 51.
  • 52.
    68 69 58 5556 56 40 41 12 10 11 17 14 19 17 22 20 21 32 28 30 25 43 37 0% 10% 20% 30% 40% 50% 60% 70% 80% 90% 100% African 2009 African 2011 Coloured 2009 Coloured 2011 Indian 2009 Indian 2011 White 2009 White 2011 Disagree Neutral Agree We are failing to build non- racialism in Gauteng Blacks and whites will never really trust each other
  • 53.
    Indians do notdeserve to benefit from affirmative action 22 15 20 22 29 18 20 27 49 67 59 51 0 10 20 30 40 50 60 70 80 90 100 African Indian Coloured White Disagree Neutral Agree Note how African and white respondents least likely to disagree, most likely to agree or sit in the ‘neutral’ category
  • 54.
    Coloureds are helpingto build the new South Africa 36 42 57 51 29 30 21 27 35 28 23 22 0% 10% 20% 30% 40% 50% 60% 70% 80% 90% 100% African Indian Coloured White Disagree Neutral Agree When the question is about coloureds, Indians and Africans are hostile while whites support as playing a positive role in SA
  • 55.
    ‘Corruption is mainthreat to our democracy’ Total, Strongly agree, 36 Total, Agree, 48 Total, Neutral, 9 Total, Disagree, 6 Total, Strongly disagree, 1 African, Strongly agree, 36 African, Agree, 49 African, Neutral, 8 African, Disagree, 6 African, Strongly disagree, 1 Coloured, Strongly agree, 37 Coloured, Agree, 48 Coloured, Neutral, 9 Coloured, Disagree, 5 Coloured, Strongly disagree, 1 Indian, Strongly agree, 33 Indian, Agree, 51 Indian, Neutral, 10 Indian, Disagree, 5 Indian, Strongly disagree, 0 White, Strongly agree, 40 White, Agree, 41 White, Neutral, 11 White, Disagree, 7 White, Strongly disagree, 1 Total African Coloured Indian White
  • 56.
    Satisfaction (or not!)with government 09/11 Satisfied 09, National, 57 Satisfied 09, Provincial, 50 Satisfied 09, Local govt, 40 Satisfied '11, National, 39 Satisfied '11, Provincial, 34 Satisfied '11, Local govt, 33 Neither 09, National, 19 Neither 09, Provincial, 21 Neither 09, Local govt, 20 Neither '11, National, 19 Neither '11, Provincial, 22 Neither '11, Local govt, 19 Dissatsfied 09, National, 24 Dissatsfied 09, Provincial, 29 Dissatsfied 09, Local govt, 40Dissatisfied '11, National, 37 Dissatisfied '11, Provincial, 44 Dissatisfied '11, Local govt, 48 Satisfied 09 Satisfied '11 Neither 09 Neither '11 Dissatsfied 09 Dissatisfied '11
  • 57.
    Batho Pele • Only19% believe public servants act according to Batho Pele principles (explained to respondent) down from 27% in 2009 • Only 16% of residents in informal settlements • 18,2% in Johannesburg • 51% do not think public servants act according to Batho Pele (57% in 2009) – remainder do not interact • 51,3% in Johannesburg Corruption • 10% had ever been asked to pay a bribe by a public servant • 8% of Africans, 16% of Asian/Indians and 18% of whites had been asked for a bribe • Migrants were not more likely to have been asked to pay a bribe than non- migrants • 10,8% asked to pay a bribe in Johannesburg Batho Pele and Corruption
  • 58.
  • 59.
  • 60.
  • 61.
  • 62.
  • 63.
    Origins of internalmigrants to GP (all origin points)
  • 64.
    Origins of internal& cross border migrants Provinces of origin of internal migrants (%) Region of origin of cross border migrants (%) 76% 12% 7% 3% 1% 1% 0.30% 0% 10% 20% 30% 40% 50% 60% 70% 80% 29% 19% 13% 12% 12% 9% 3% 3% 0% 5% 10% 15% 20% 25% 30% 35%
  • 65.
    Attitudes to crossborder migrants & migration Attitudes to migration policy Attitudes to migrants • 2.3 % identified ‘foreigners’ as the biggest/second biggest problem facing their community (0.5% 1st mention, 1.8% 2nd mention) – Compares to 2.7% in 2009 – 18th in importance for 1st mention and 14th in importance for 2nd mention • Attitudes to policy consistent across all groups – BUT when asked to name biggest problem in community the most educated, whites, Indians, and those living in informal housing were most likely to name ‘foreigners’ 32% 21% 47% Send foreigners home Let foreigners stay Only allow legal foreigners
  • 66.
  • 67.
    QoL dimensions –means (2009/2011) Health, 2009, 0.72 Health, 2011, 0.72 Infrastructure, 2009, 0.78 Infrastructure, 2011, 0.78 Dwelling, 2009, 0.71 Dwelling, 2011, 0.78 Family, 2009, 0.7 Family, 2011, 0.69 Community, 2009, 0.65 Community, 2011, 0.64 Connectivity, 2009, 0.62 Connectivity, 2011, 0.64 Global, 2009, 0.56 Global, 2011, 0.53 Security, 2009, 0.56 Security, 2011, 0.58 Socio-political, 2009, 0.53 Socio-political, 2011, 0.48 Work, 2009, 0.43 Work, 2011, 0.42 Work Socio-political Security Global Connectivity Community Family Dwelling Infrastructure Health
  • 68.
    2009 mean: 6.242011 mean: 6.25
  • 69.
    QoL means bymunicipality Randfontein, Category 1, 6.45 Midvaal, Category 1, 6.42 Tshwane, Category 1, 6.33 Johannesburg, Category 1, 6.32 Lesedi, Category 1, 6.27 Merafong City, Category 1, 6.22 Mogale City, Category 1, 6.22 Emfuleni, Category 1, 6.21 Ekurhuleni, Category 1, 6.10 Westonaria, Category 1, 5.77 Westonaria Ekurhuleni Emfuleni Mogale City Merafong City Lesedi Johannesburg Tshwane Midvaal Randfontein
  • 71.
    Some conclusions o Moodis very low. This is natural between elections, as part of national (and provincial and local) mood cycles, but equally clearly, there is a substantial loss of faith in politicians and a belief that corruption is the biggest threat facing democracy in Gauteng o Delivery looks very positive, if uneven across municipalities. Delivery of services can always be improved; but – despite the rash of protests – does not seem to be a major problem. o What we seem to be missing is the energy or spirit or vision that holds together our varied and cosmopolitan population – G2055? o We need to make brave commitments re Gauteng. Basic needs messages will not resonate sufficiently, any more. Commitments about the last RDP house, the end of racial classification, the sign-posts that tell us when Gauteng will be ‘normal’ – this is what people want. o Clearly, we face challenges – but they are of the more intangible, less easy to resolve, type. Basic service delivery alone may not be the answer. o Gauteng has delivered on the RDP. But what next?
  • 72.