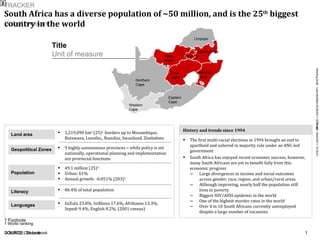
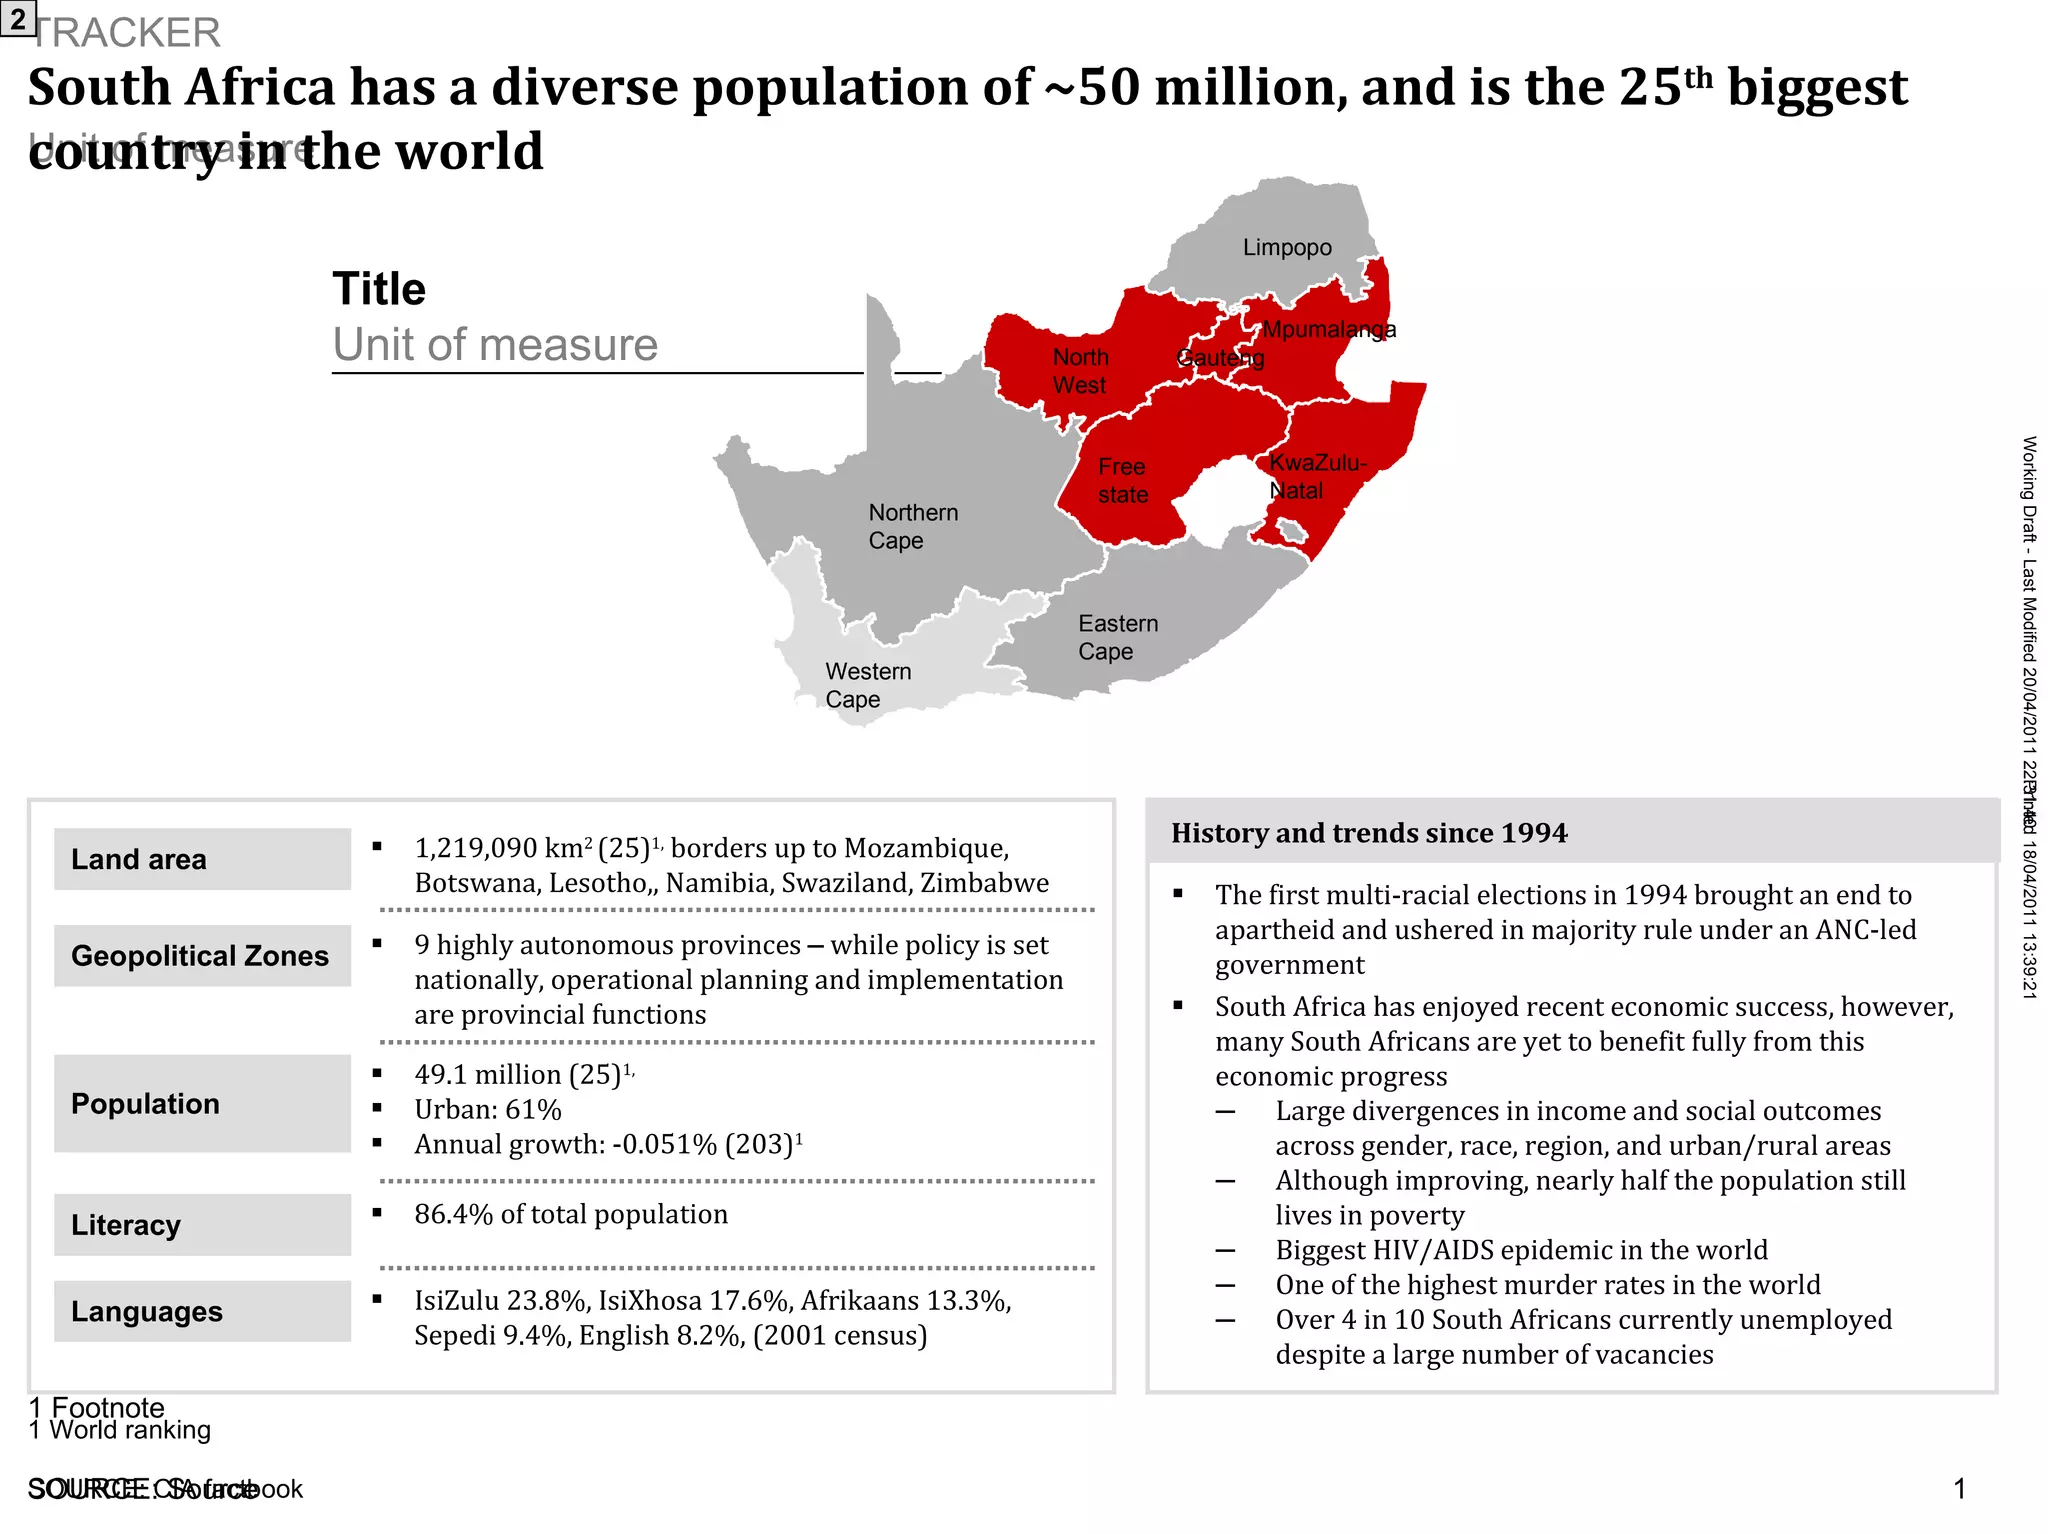
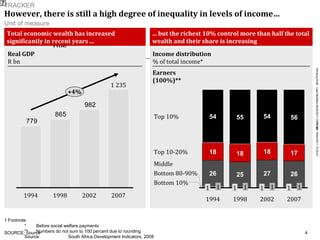
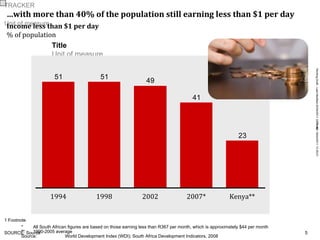
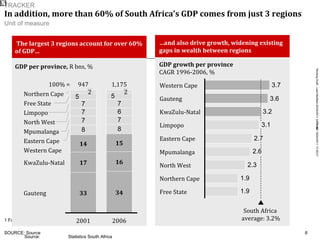
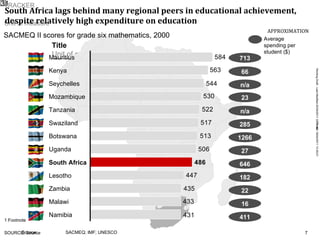
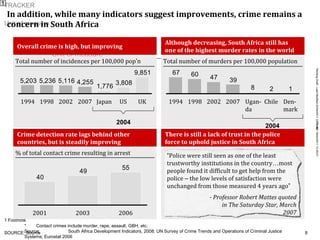
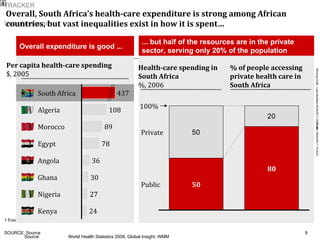
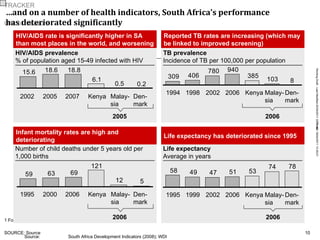
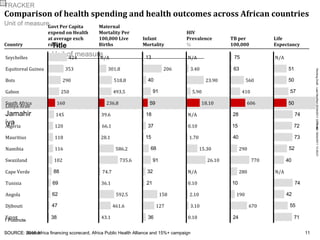
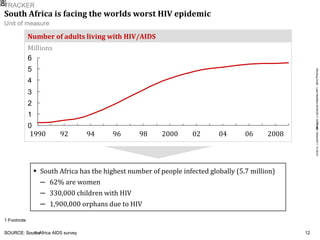
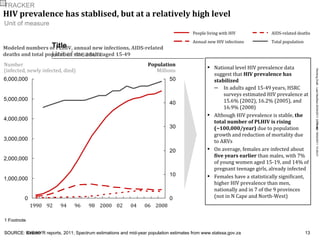
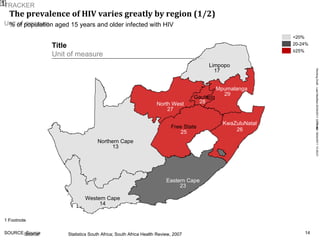
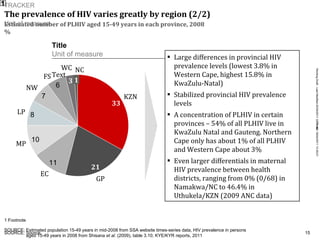
South Africa has a diverse population of ~50 million, and is the 25 th  biggest country in the world   2 SOURCE: CIA factbook 9 highly autonomous provinces  –  while policy is set nationally, operational planning and implementation are provincial functions Geopolitical Zones 49.1 million (25) 1,  Urban: 61% Annual growth: -0.051% (203) 1 Population History and trends since 1994 The first multi-racial elections in 1994 brought an end to apartheid and ushered in majority rule under an ANC-led government South Africa has enjoyed recent economic success, however, many South Africans are yet to benefit fully from this economic progress Large divergences in income and social outcomes across gender, race, region, and urban/rural areas Although improving, nearly half the population still lives in poverty Biggest HIV/AIDS epidemic in the world One of the highest murder rates in the world Over 4 in 10 South Africans currently unemployed despite a large number of vacancies IsiZulu 23.8%, IsiXhosa 17.6%, Afrikaans 13.3%, Sepedi 9.4%, English 8.2%, (2001 census) Languages 86.4% of total population Literacy 1 World ranking 1,219,090 km 2  (25) 1,  borders up to Mozambique, Botswana, Lesotho,, Namibia, Swaziland, Zimbabwe Land area KwaZulu-Natal Eastern Cape Free state North West Gauteng Mpumalanga Limpopo Northern Cape Western Cape
Since free elections in 1994, South Africa has experienced sustained growth…   Real GDP* R billions Sound economic growth CAGR 2002-07 of 4.7% for South Africa vs. 10.8% for China and 2.3% for the US Working age population (15-65 years) Millions 1994 1998 2002 1 175 2006 1 235 2007 1994 1998 2002 2006 2007 Since 2002, South Africa has experienced the most sustained expansion of the economy in the last 50 years Unemployment rate % Labor productivity per employee* R 000s 1994 1998 2007 2006 2002 Working age population is 65% of total population,  comparable to the US and Chile with 68% Unemployment levels extremely high  (23% vs. 4% in the US) Labor productivity per employee has decreased since 1994 but increased since 2002 2007 2006 2002 1998 1994 57 Labor force participation rate % Increasing and stable labor force participation since 2002,  but still low compared to US: 75% 1994 1998 2002 2006 2007 * Calculated as real GDP output divided by labour force Source: Statistics South Africa
… at a more rapid rate than most developed economies   6 12.3 34.7 4.7 Nigeria China Kenya South Africa Brazil Malaysia Chile South Korea 12.6 Denmark 28.3 USA 45.6 7.0 13.8 13.9 20.1 37.4 GDP per capita* 2000 Annual real growth rate (CAGR) 2000-07 GDP per capita* 2007 GDP per capita in US$ 000s, CAGR, %  * Constant 2000 prices at PPP Source: Global Insight
However, there is still a high degree of inequality in levels of income…   7 Total economic wealth has increased significantly in recent years ... ... but the richest 10% control more than half the total wealth and their share is increasing * Before social welfare payments ** Numbers do not sum to 100 percent due to rounding Source: South Africa Development Indicators, 2008 Real GDP R bn Income distribution % of total income* Earners (100%)** +4% 2007 1 235 2002 1998 1994 Bottom 10% Bottom 80-90% Middle Top 10-20% Top 10% 2007 1 1 26 17 56 2002 1 1 27 18 54 1998 1 1 25 18 55 1994 1 1 26 18 54
… with more than 40% of the population still earning less than $1 per day   1994 1998 2002 2007* Kenya** Income less than $1 per day % of population * All South African figures are based on those earning less than R367 per month, which is approximately $44 per month  ** 1990-2005 average   Source: World Development Index (WDI); South Africa Development Indicators, 2008
In addition, more than 60% of South Africa’s GDP comes from just 3 regions   2 14 17 33 947 2001 2 15 16 34 1,175 2006 Northern Cape Free State Limpopo North West Gauteng Eastern Cape Western Cape KwaZulu-Natal 100% = Mpumalanga GDP per province,  R bns, % Source: Statistics South Africa The largest 3 regions account for over 60% of GDP… Eastern Cape Mpumalanga North West Northern Cape Weste r n Cape Gauteng KwaZulu-Natal Limpopo Free State South Africa  average: 3.2% GDP growth per province CAGR 1996-2006, % … and also drive growth, widening existing gaps in wealth between regions 3.1
South Africa lags behind many regional peers in educational achievement, despite relatively high expenditure on education   SACMEQ II scores for grade six mathematics, 2000 Source: SACMEQ; IMF; UNESCO Mauritius Kenya Seychelles Mozambique Tanzania Swaziland Botswana Uganda South Africa Lesotho Zambia Malawi Namibia 431 Average spending per student ($) 713 66 n/a 23 n/a 285 1266 27 646 182 22 16 411 APPROXIMATION
In addition, while many indicators suggest improvements, crime remains a concern in South Africa   % of total contact crime resulting in arrest Total number of murders per 100,000 population * Contact crimes include murder, rape, assault, GBH, etc. Source: South Africa Development Indicators, 2008; UN Survey of Crime Trends and Operations of Criminal Justice Systems; Eurostat 2006 1994 1998 2002 2007 Japan US UK 2001 2003 2006 1994 1998 2002 2007 Ugan-da Chile Den-mark Crime detection rate lags behind other countries, but is steadily improving There is still a lack of trust in the police force to uphold justice in South Africa Overall crime is high, but improving Although decreasing, South Africa still has one of the highest murder rates in the world Total number of incidences per 100,000 pop ’ n “ Police were still seen as one of the least trustworthy institutions in the country … most people found it difficult to get help from the police  –  the low levels of satisfaction were unchanged from those measured 4 years ago ”   - Professor Robert Mattes quoted in The Saturday Star, March 2007 1 2004 2004
Overall, South Africa’s health-care expenditure is strong among African countries, but vast inequalities exist in how it is spent…   4 Overall expenditure is good ... ... but half of the resources are in the private sector, serving only 20% of the population Source: World Health Statistics 2008; Global Insight; WMM Kenya  24 Nigeria  27 Ghana  30 Angola  36 Egypt  78 Morocco  89 Algeria  108 South Africa  437 Per capita health-care spending $, 2005 Health-care spending in  South Africa %, 2006 % of people accessing  private health care in  South Africa 100% Public Private 80 50
… and on a number of health indicators, South Africa’s performance  has deteriorated significantly   Infant mortality rates are high and deteriorating Life expectancy has deteriorated since 1995 TB prevalence Incidence of TB per 100,000 per population HIV/AIDS prevalence % of population aged 15-49 infected with HIV Number of child deaths under 5 years old per 1,000 births HIV/AIDS rate is significantly higher in SA than most places in the world, and worsening Reported TB rates are increasing (which may be linked to improved screening) Life expectancy Average in years Source: South Africa Development Indicators (2008); WDI Den- mark Malay- sia Kenya 2007 2005 2002 Den- mark Malay- sia Kenya 2006 2000 1995 Den-mark Malay-sia Kenya  2006 2002 1998 1994 Den-mark Malay-sia Kenya 2006 2002 1999 1995 2005 2006 2006 2006
Comparison of health spending and health outcomes across African countries   SOURCE: 2010 Africa financing scorecard, Africa Public Health Alliance and 15%+ campaign Egypt Djibouti Angola Tunisia Cape Verde Swaziland 102 Namibia 116 Mauritius 118 Algeria 120 Libiya Arab  Jamahiriya 145 South Africa 160 Gabon 250 Bots  290 Equitoreal Guinea 353 Seychelles 424 Govt Per Capita expend on Health  at average exch rate,  $ Maternal Mortality Per 100,000 Live Births Infant Mortality HIV Prevalence % TB per 100,000 Country Life Expectancy 43.1 461.6 592.5 36.1 74.7 735.6 586.2 28.1 66.1 39.6 236.8 493.5 518.8 301.8 N/A 127 158 206 0.10 3.10 2.10 0.10 N/A 26.10 15.30 1.70 0.10 N/A 18.10 5.90 23.90 3.40 N/A 670 190 280 770 290 606 410 560 N/A N/A
South Africa is facing the worlds worst HIV epidemic   8 SOURCE: South Africa AIDS survey South Africa has the highest number of people infected globally (5.7 million) 62% are women 330,000 children with HIV 1,900,000 orphans due to HIV 04 06 2008 1990 92 94 96 98 2000 02 Number of adults living with HIV/AIDS Millions
HIV prevalence has stablised, but at a relatively high level   National level HIV prevalence data suggest that  HIV prevalence has stabilized In adults aged 15-49 years, HSRC surveys estimated HIV prevalence at 15.6% (2002), 16.2% (2005), and 16.9% (2008) Although HIV prevalence is stable,  the total number of PLHIV is rising (~100,000/year)  due to population growth and reduction of mortality due to ARVs On average, females are infected about  five years earlier  than males, with 7% of young women aged 15-19, and 14% of pregnant teenage girls, already infected Females have a statistically significant, higher HIV prevalence than men, nationally and in 7 of the 9 provinces (not in N Cape and North-West) SOURCE: KYE/KYR reports, 2011; Spectrum estimations and mid-year population estimates from www.statssa.gov.za Number (infected, newly infected, died) Population Millions 2008 06 04 02 2000 98 96 94 92 1990 Annual new HIV infections AIDS-related deaths Total population People living with HIV Modeled numbers of PLHIV, annual new infections, AIDS-related deaths and total population size, adults aged 15-49
The prevalence of HIV varies greatly by region (1/2)   Western Cape Eastern Cape Northern Cape Free State KwaZuluNatal North West Gauteng Mpumalanga Limpopo 14 23 13 25 26 27 28 29 17 1 Source: Statistics South Africa; South Africa Health Review, 2007 % of population aged 15 years and older infected with HIV  <20% 20-24% ≥ 25%
Estimated number of PLHIV aged 15-49 years in each province, 2008 %   1 SOURCE: Estimated population 15-49 years in mid-2008 from SSA website times-series data, HIV prevalence in persons aged 15-49 years in 2008 from Shisana  et al.  (2009), table 3.10; K Y E/K Y R reports, 2011 NC 1 WC 3 FS NW LP MP EC GP 21 KZN 33 Large differences in provincial HIV prevalence levels (lowest 3.8% in Western Cape, highest 15.8% in KwaZulu-Natal)  Stabilized provincial HIV prevalence levels A concentration of PLHIV in certain provinces – 54% of all PLHIV live in KwaZulu Natal and Gauteng. Northern Cape only has about 1% of all PLHIV and Western Cape about 3% Even larger differentials in maternal HIV prevalence between health districts, ranging from 0% (0/68) in Namakwa/NC to 46.4% in Uthukela/KZN (2009 ANC data) Text The prevalence of HIV varies greatly by region (2/2)
Risk factors for HIV/AIDS in South Africa   SOURCE: K Y E/K Y R reports, 2011 Risk factors for HIV include Marital status  (married women have lower odds of HIV infec-tion than unmarried women, but for men this is not a factor) Lack of higher education  (men and women with tertiary education were significantly less likely to be HIV positive than those with no school education) Low economic status/deprivation Respondents working in the informal sector had overall the highest HIV prevalence among the different employment groups, with almost one third of African informal workers HIV positive In women, the greater the lack of money, the more likely they were HIV positive  Urban  informal  areas  are associated with highest HIV prevalence compared to urban formal/rural areas – in 2008, women living in urban  informal   areas were 57% more likely to be HIV infected than those in urban formal areas Uncircumcised males  – men who reported in the 2005 survey to have been circumcised before first sex were significantly less likely to be HIV positive
HIV prevalence is highest in informal urban settlements   3 SOURCE: HSRC survey data; K Y E/K Y R reports, 2011 HIV prevalence by area of residence (2002-08) Percent 14.7 12.3 16.0 15.3 27.1 23.7 11.2 11.5 Urban formal R u ral   formal Rural informal U r ban  in f o rmal 2005 2008 2002
Despite lack of a systematic baseline, incidence appears to be declining   SOURCE: K Y E/K Y R reports, 2011 An estimated 400,000 new infections in 2009 (of which 12% in children aged 0-14)  No single, agreed method for measuring incidence, with no systematic baseline against which to measure progress However, recent estimates are at the lower range (1.2-1.7) indicating that there may have been a reduction in incidence over the past 5 years Using one incidence estimation method, it was suggested that HIV incidence may have declined by 60% in young women aged 15-24 between the inter-survey periods 2002/05 and 2005/08 Estimated annual HIV incidence between 2002 and 2009 Year 2002-05 2005 2005 2005 2005-08 2009 2009 Age group 15+ 15-49 15-49 15+ 15+ 15+ 15-49 Method Model (synthetic cohort) BED assay Model (ASSA) Model (EPP) Model (synthetic cohort) Model (EPP) Model (MoT) Estimated annual HIV incidence Percent 2.0 2.4 2.2 1.4 1.3 1.2 1.7
Incidence varies widely across provinces   5 SOURCE: Gouws (2010) 2009 EPP estimates; K Y E/K Y R reports, 2011 Estimated number of new HIV infections in adults aged 15-49, 2009 WC (12,585) NW (29,106) NC (3,177) MP (28,809) LP (29,599) KZN (100,787) GP (68,618) FS (23,104) EC (47,464) Estimated annual HIV incidence Percent In KZN, HIV incidence remains high Based on recent results from the tonofovir trial which reported for sexually active women in KZN a HIV incidence rate of 9.1/100 person-years (placebo group) From the Africa Centre HIV cohort, very high life-time risks of HIV infection have been reported – life-time risk at age 55 is estimated at 78% for males, and 75% for females

Overall performance

  • 1.
    South Africa hasa diverse population of ~50 million, and is the 25 th biggest country in the world 2 SOURCE: CIA factbook 9 highly autonomous provinces – while policy is set nationally, operational planning and implementation are provincial functions Geopolitical Zones 49.1 million (25) 1, Urban: 61% Annual growth: -0.051% (203) 1 Population History and trends since 1994 The first multi-racial elections in 1994 brought an end to apartheid and ushered in majority rule under an ANC-led government South Africa has enjoyed recent economic success, however, many South Africans are yet to benefit fully from this economic progress Large divergences in income and social outcomes across gender, race, region, and urban/rural areas Although improving, nearly half the population still lives in poverty Biggest HIV/AIDS epidemic in the world One of the highest murder rates in the world Over 4 in 10 South Africans currently unemployed despite a large number of vacancies IsiZulu 23.8%, IsiXhosa 17.6%, Afrikaans 13.3%, Sepedi 9.4%, English 8.2%, (2001 census) Languages 86.4% of total population Literacy 1 World ranking 1,219,090 km 2 (25) 1, borders up to Mozambique, Botswana, Lesotho,, Namibia, Swaziland, Zimbabwe Land area KwaZulu-Natal Eastern Cape Free state North West Gauteng Mpumalanga Limpopo Northern Cape Western Cape
  • 2.
    Since free electionsin 1994, South Africa has experienced sustained growth… Real GDP* R billions Sound economic growth CAGR 2002-07 of 4.7% for South Africa vs. 10.8% for China and 2.3% for the US Working age population (15-65 years) Millions 1994 1998 2002 1 175 2006 1 235 2007 1994 1998 2002 2006 2007 Since 2002, South Africa has experienced the most sustained expansion of the economy in the last 50 years Unemployment rate % Labor productivity per employee* R 000s 1994 1998 2007 2006 2002 Working age population is 65% of total population, comparable to the US and Chile with 68% Unemployment levels extremely high (23% vs. 4% in the US) Labor productivity per employee has decreased since 1994 but increased since 2002 2007 2006 2002 1998 1994 57 Labor force participation rate % Increasing and stable labor force participation since 2002, but still low compared to US: 75% 1994 1998 2002 2006 2007 * Calculated as real GDP output divided by labour force Source: Statistics South Africa
  • 3.
    … at amore rapid rate than most developed economies 6 12.3 34.7 4.7 Nigeria China Kenya South Africa Brazil Malaysia Chile South Korea 12.6 Denmark 28.3 USA 45.6 7.0 13.8 13.9 20.1 37.4 GDP per capita* 2000 Annual real growth rate (CAGR) 2000-07 GDP per capita* 2007 GDP per capita in US$ 000s, CAGR, % * Constant 2000 prices at PPP Source: Global Insight
  • 4.
    However, there isstill a high degree of inequality in levels of income… 7 Total economic wealth has increased significantly in recent years ... ... but the richest 10% control more than half the total wealth and their share is increasing * Before social welfare payments ** Numbers do not sum to 100 percent due to rounding Source: South Africa Development Indicators, 2008 Real GDP R bn Income distribution % of total income* Earners (100%)** +4% 2007 1 235 2002 1998 1994 Bottom 10% Bottom 80-90% Middle Top 10-20% Top 10% 2007 1 1 26 17 56 2002 1 1 27 18 54 1998 1 1 25 18 55 1994 1 1 26 18 54
  • 5.
    … with morethan 40% of the population still earning less than $1 per day 1994 1998 2002 2007* Kenya** Income less than $1 per day % of population * All South African figures are based on those earning less than R367 per month, which is approximately $44 per month ** 1990-2005 average Source: World Development Index (WDI); South Africa Development Indicators, 2008
  • 6.
    In addition, morethan 60% of South Africa’s GDP comes from just 3 regions 2 14 17 33 947 2001 2 15 16 34 1,175 2006 Northern Cape Free State Limpopo North West Gauteng Eastern Cape Western Cape KwaZulu-Natal 100% = Mpumalanga GDP per province, R bns, % Source: Statistics South Africa The largest 3 regions account for over 60% of GDP… Eastern Cape Mpumalanga North West Northern Cape Weste r n Cape Gauteng KwaZulu-Natal Limpopo Free State South Africa average: 3.2% GDP growth per province CAGR 1996-2006, % … and also drive growth, widening existing gaps in wealth between regions 3.1
  • 7.
    South Africa lagsbehind many regional peers in educational achievement, despite relatively high expenditure on education SACMEQ II scores for grade six mathematics, 2000 Source: SACMEQ; IMF; UNESCO Mauritius Kenya Seychelles Mozambique Tanzania Swaziland Botswana Uganda South Africa Lesotho Zambia Malawi Namibia 431 Average spending per student ($) 713 66 n/a 23 n/a 285 1266 27 646 182 22 16 411 APPROXIMATION
  • 8.
    In addition, whilemany indicators suggest improvements, crime remains a concern in South Africa % of total contact crime resulting in arrest Total number of murders per 100,000 population * Contact crimes include murder, rape, assault, GBH, etc. Source: South Africa Development Indicators, 2008; UN Survey of Crime Trends and Operations of Criminal Justice Systems; Eurostat 2006 1994 1998 2002 2007 Japan US UK 2001 2003 2006 1994 1998 2002 2007 Ugan-da Chile Den-mark Crime detection rate lags behind other countries, but is steadily improving There is still a lack of trust in the police force to uphold justice in South Africa Overall crime is high, but improving Although decreasing, South Africa still has one of the highest murder rates in the world Total number of incidences per 100,000 pop ’ n “ Police were still seen as one of the least trustworthy institutions in the country … most people found it difficult to get help from the police – the low levels of satisfaction were unchanged from those measured 4 years ago ” - Professor Robert Mattes quoted in The Saturday Star, March 2007 1 2004 2004
  • 9.
    Overall, South Africa’shealth-care expenditure is strong among African countries, but vast inequalities exist in how it is spent… 4 Overall expenditure is good ... ... but half of the resources are in the private sector, serving only 20% of the population Source: World Health Statistics 2008; Global Insight; WMM Kenya 24 Nigeria 27 Ghana 30 Angola 36 Egypt 78 Morocco 89 Algeria 108 South Africa 437 Per capita health-care spending $, 2005 Health-care spending in South Africa %, 2006 % of people accessing private health care in South Africa 100% Public Private 80 50
  • 10.
    … and ona number of health indicators, South Africa’s performance has deteriorated significantly Infant mortality rates are high and deteriorating Life expectancy has deteriorated since 1995 TB prevalence Incidence of TB per 100,000 per population HIV/AIDS prevalence % of population aged 15-49 infected with HIV Number of child deaths under 5 years old per 1,000 births HIV/AIDS rate is significantly higher in SA than most places in the world, and worsening Reported TB rates are increasing (which may be linked to improved screening) Life expectancy Average in years Source: South Africa Development Indicators (2008); WDI Den- mark Malay- sia Kenya 2007 2005 2002 Den- mark Malay- sia Kenya 2006 2000 1995 Den-mark Malay-sia Kenya 2006 2002 1998 1994 Den-mark Malay-sia Kenya 2006 2002 1999 1995 2005 2006 2006 2006
  • 11.
    Comparison of healthspending and health outcomes across African countries SOURCE: 2010 Africa financing scorecard, Africa Public Health Alliance and 15%+ campaign Egypt Djibouti Angola Tunisia Cape Verde Swaziland 102 Namibia 116 Mauritius 118 Algeria 120 Libiya Arab Jamahiriya 145 South Africa 160 Gabon 250 Bots 290 Equitoreal Guinea 353 Seychelles 424 Govt Per Capita expend on Health at average exch rate, $ Maternal Mortality Per 100,000 Live Births Infant Mortality HIV Prevalence % TB per 100,000 Country Life Expectancy 43.1 461.6 592.5 36.1 74.7 735.6 586.2 28.1 66.1 39.6 236.8 493.5 518.8 301.8 N/A 127 158 206 0.10 3.10 2.10 0.10 N/A 26.10 15.30 1.70 0.10 N/A 18.10 5.90 23.90 3.40 N/A 670 190 280 770 290 606 410 560 N/A N/A
  • 12.
    South Africa isfacing the worlds worst HIV epidemic 8 SOURCE: South Africa AIDS survey South Africa has the highest number of people infected globally (5.7 million) 62% are women 330,000 children with HIV 1,900,000 orphans due to HIV 04 06 2008 1990 92 94 96 98 2000 02 Number of adults living with HIV/AIDS Millions
  • 13.
    HIV prevalence hasstablised, but at a relatively high level National level HIV prevalence data suggest that HIV prevalence has stabilized In adults aged 15-49 years, HSRC surveys estimated HIV prevalence at 15.6% (2002), 16.2% (2005), and 16.9% (2008) Although HIV prevalence is stable, the total number of PLHIV is rising (~100,000/year) due to population growth and reduction of mortality due to ARVs On average, females are infected about five years earlier than males, with 7% of young women aged 15-19, and 14% of pregnant teenage girls, already infected Females have a statistically significant, higher HIV prevalence than men, nationally and in 7 of the 9 provinces (not in N Cape and North-West) SOURCE: KYE/KYR reports, 2011; Spectrum estimations and mid-year population estimates from www.statssa.gov.za Number (infected, newly infected, died) Population Millions 2008 06 04 02 2000 98 96 94 92 1990 Annual new HIV infections AIDS-related deaths Total population People living with HIV Modeled numbers of PLHIV, annual new infections, AIDS-related deaths and total population size, adults aged 15-49
  • 14.
    The prevalence ofHIV varies greatly by region (1/2) Western Cape Eastern Cape Northern Cape Free State KwaZuluNatal North West Gauteng Mpumalanga Limpopo 14 23 13 25 26 27 28 29 17 1 Source: Statistics South Africa; South Africa Health Review, 2007 % of population aged 15 years and older infected with HIV <20% 20-24% ≥ 25%
  • 15.
    Estimated number ofPLHIV aged 15-49 years in each province, 2008 % 1 SOURCE: Estimated population 15-49 years in mid-2008 from SSA website times-series data, HIV prevalence in persons aged 15-49 years in 2008 from Shisana et al. (2009), table 3.10; K Y E/K Y R reports, 2011 NC 1 WC 3 FS NW LP MP EC GP 21 KZN 33 Large differences in provincial HIV prevalence levels (lowest 3.8% in Western Cape, highest 15.8% in KwaZulu-Natal) Stabilized provincial HIV prevalence levels A concentration of PLHIV in certain provinces – 54% of all PLHIV live in KwaZulu Natal and Gauteng. Northern Cape only has about 1% of all PLHIV and Western Cape about 3% Even larger differentials in maternal HIV prevalence between health districts, ranging from 0% (0/68) in Namakwa/NC to 46.4% in Uthukela/KZN (2009 ANC data) Text The prevalence of HIV varies greatly by region (2/2)
  • 16.
    Risk factors forHIV/AIDS in South Africa SOURCE: K Y E/K Y R reports, 2011 Risk factors for HIV include Marital status (married women have lower odds of HIV infec-tion than unmarried women, but for men this is not a factor) Lack of higher education (men and women with tertiary education were significantly less likely to be HIV positive than those with no school education) Low economic status/deprivation Respondents working in the informal sector had overall the highest HIV prevalence among the different employment groups, with almost one third of African informal workers HIV positive In women, the greater the lack of money, the more likely they were HIV positive Urban informal areas are associated with highest HIV prevalence compared to urban formal/rural areas – in 2008, women living in urban informal areas were 57% more likely to be HIV infected than those in urban formal areas Uncircumcised males – men who reported in the 2005 survey to have been circumcised before first sex were significantly less likely to be HIV positive
  • 17.
    HIV prevalence ishighest in informal urban settlements 3 SOURCE: HSRC survey data; K Y E/K Y R reports, 2011 HIV prevalence by area of residence (2002-08) Percent 14.7 12.3 16.0 15.3 27.1 23.7 11.2 11.5 Urban formal R u ral formal Rural informal U r ban in f o rmal 2005 2008 2002
  • 18.
    Despite lack ofa systematic baseline, incidence appears to be declining SOURCE: K Y E/K Y R reports, 2011 An estimated 400,000 new infections in 2009 (of which 12% in children aged 0-14) No single, agreed method for measuring incidence, with no systematic baseline against which to measure progress However, recent estimates are at the lower range (1.2-1.7) indicating that there may have been a reduction in incidence over the past 5 years Using one incidence estimation method, it was suggested that HIV incidence may have declined by 60% in young women aged 15-24 between the inter-survey periods 2002/05 and 2005/08 Estimated annual HIV incidence between 2002 and 2009 Year 2002-05 2005 2005 2005 2005-08 2009 2009 Age group 15+ 15-49 15-49 15+ 15+ 15+ 15-49 Method Model (synthetic cohort) BED assay Model (ASSA) Model (EPP) Model (synthetic cohort) Model (EPP) Model (MoT) Estimated annual HIV incidence Percent 2.0 2.4 2.2 1.4 1.3 1.2 1.7
  • 19.
    Incidence varies widelyacross provinces 5 SOURCE: Gouws (2010) 2009 EPP estimates; K Y E/K Y R reports, 2011 Estimated number of new HIV infections in adults aged 15-49, 2009 WC (12,585) NW (29,106) NC (3,177) MP (28,809) LP (29,599) KZN (100,787) GP (68,618) FS (23,104) EC (47,464) Estimated annual HIV incidence Percent In KZN, HIV incidence remains high Based on recent results from the tonofovir trial which reported for sexually active women in KZN a HIV incidence rate of 9.1/100 person-years (placebo group) From the Africa Centre HIV cohort, very high life-time risks of HIV infection have been reported – life-time risk at age 55 is estimated at 78% for males, and 75% for females