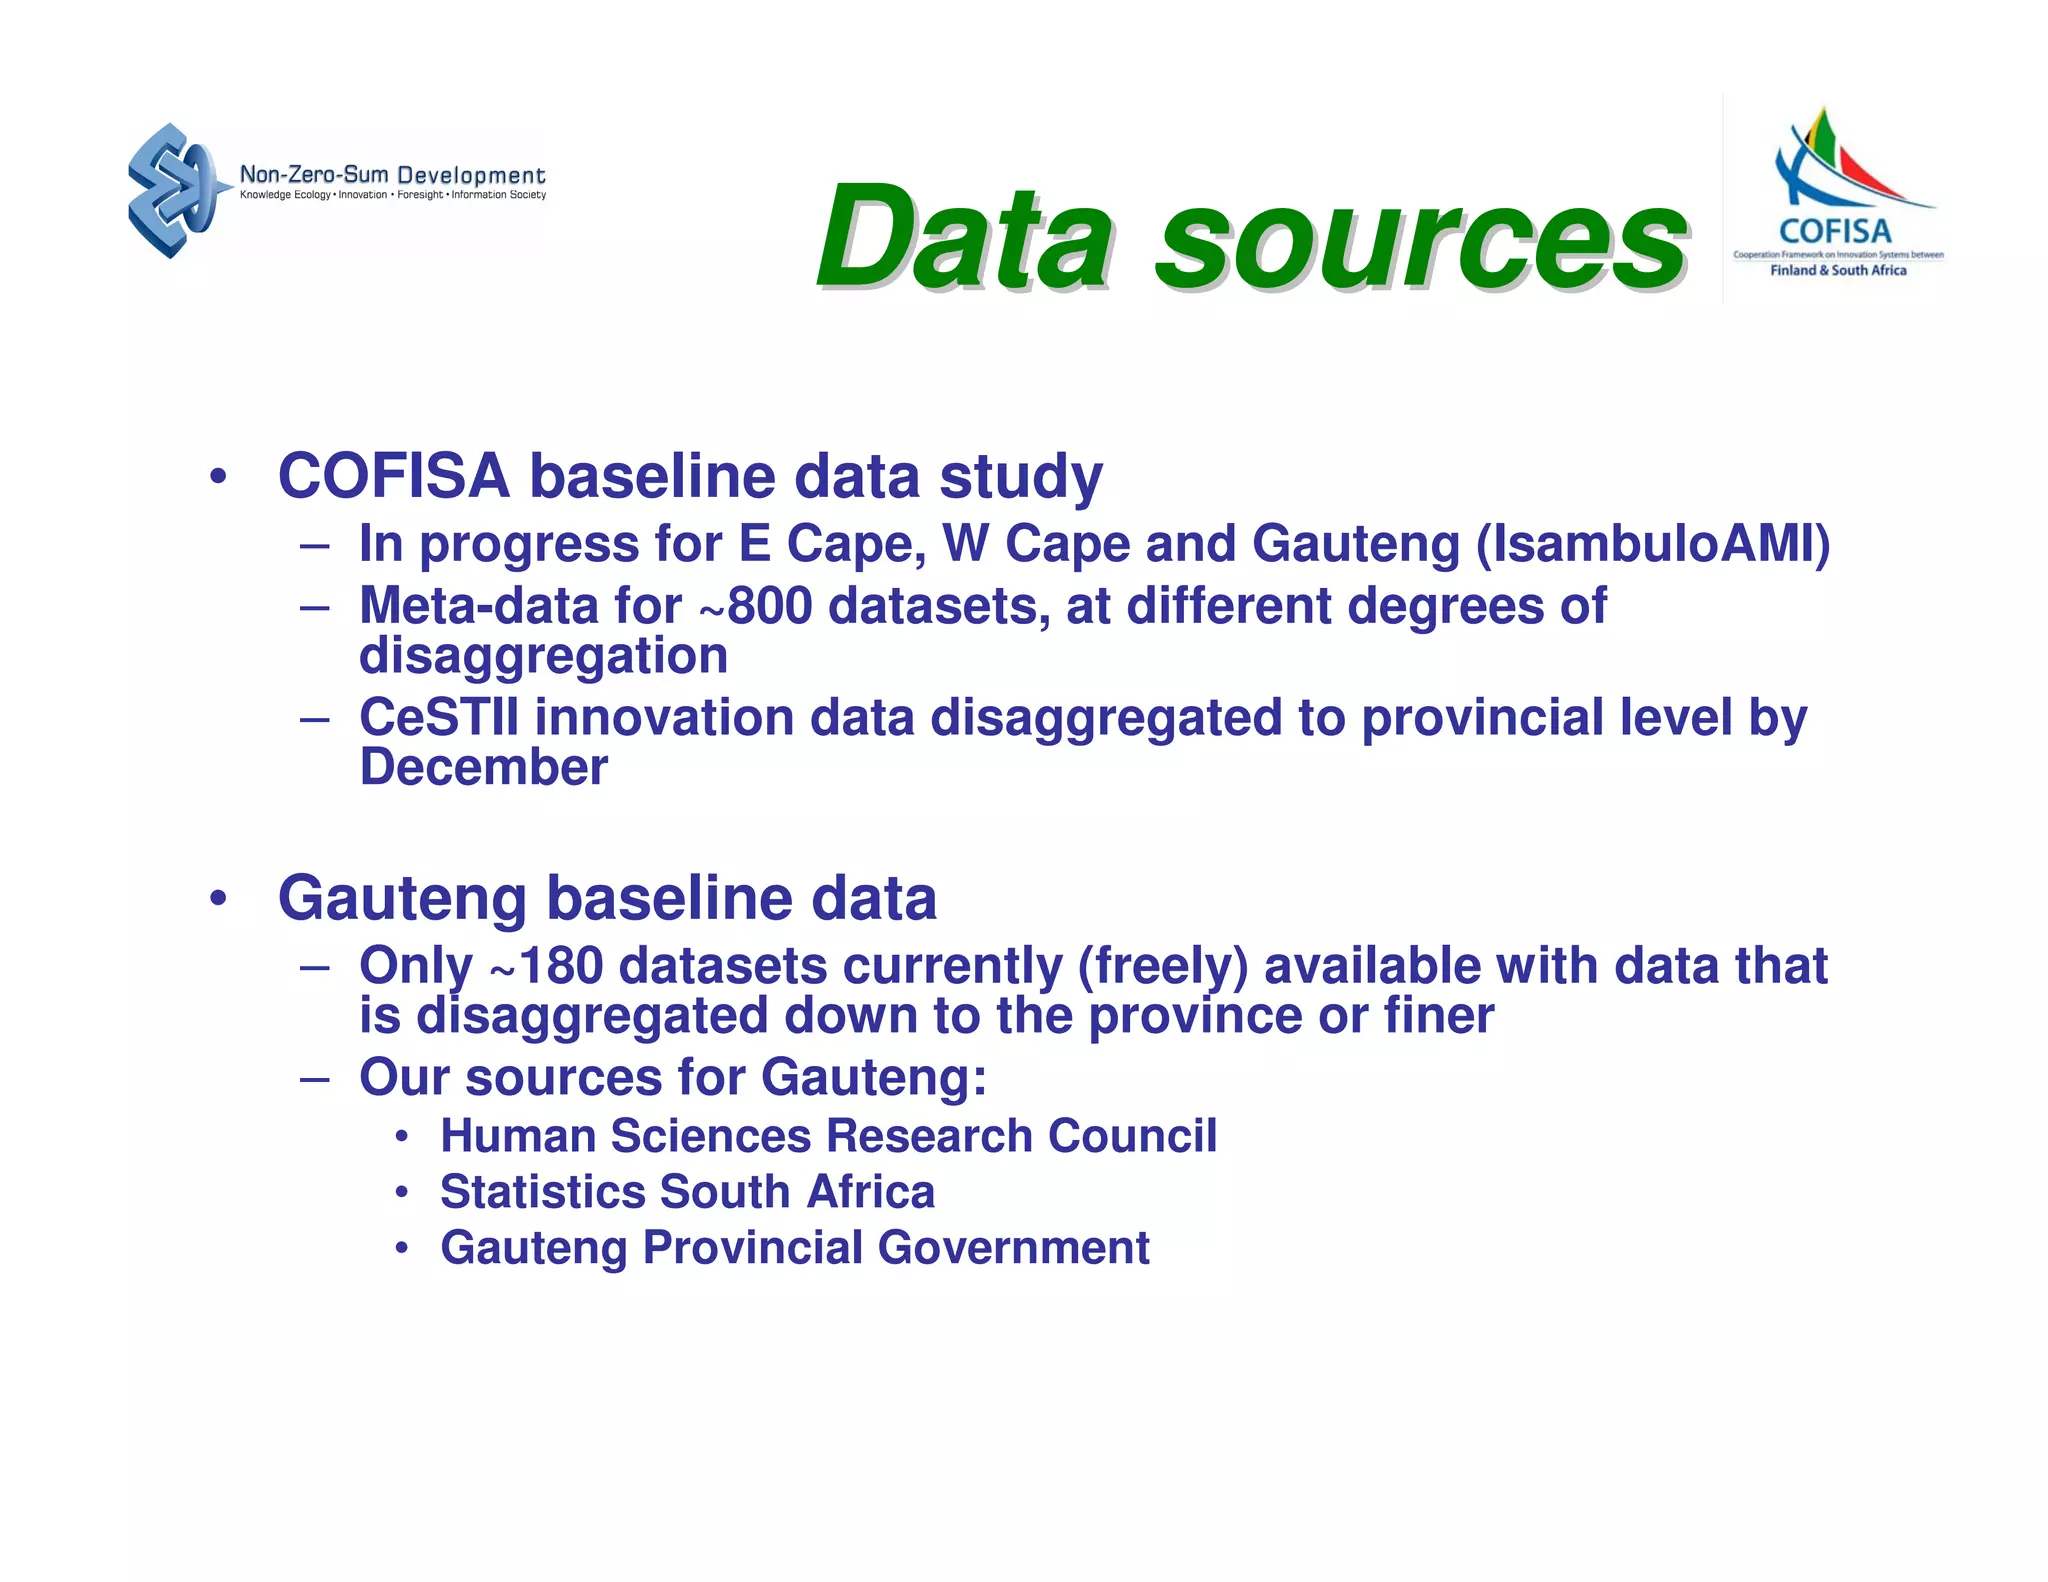
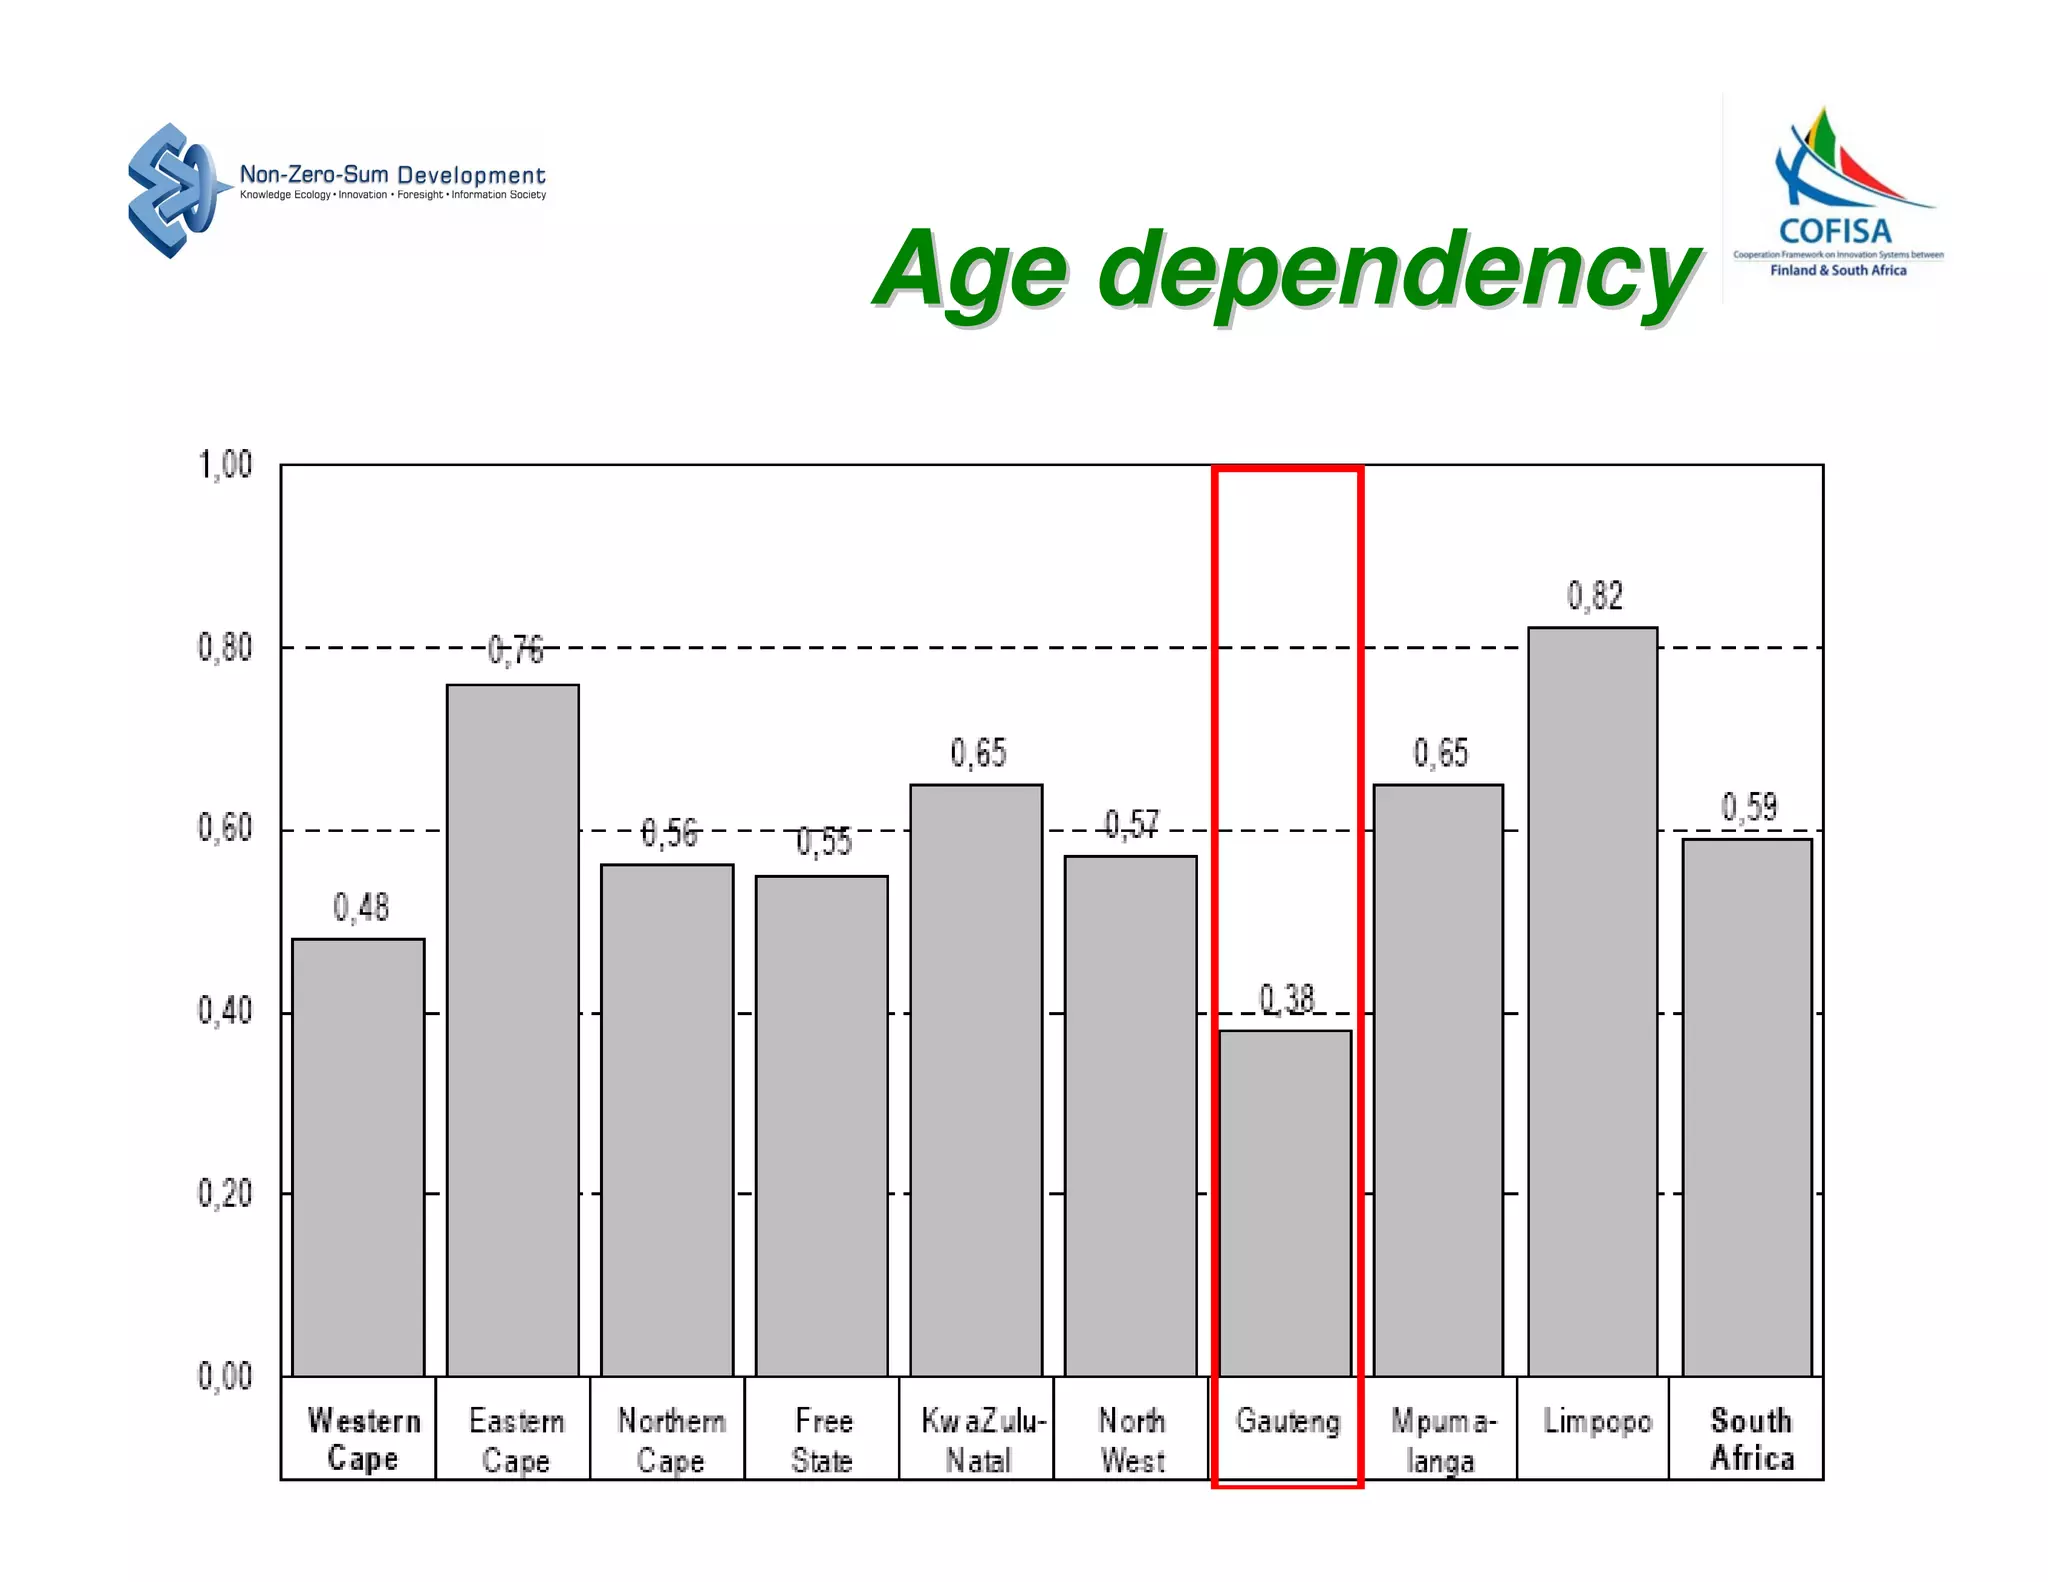
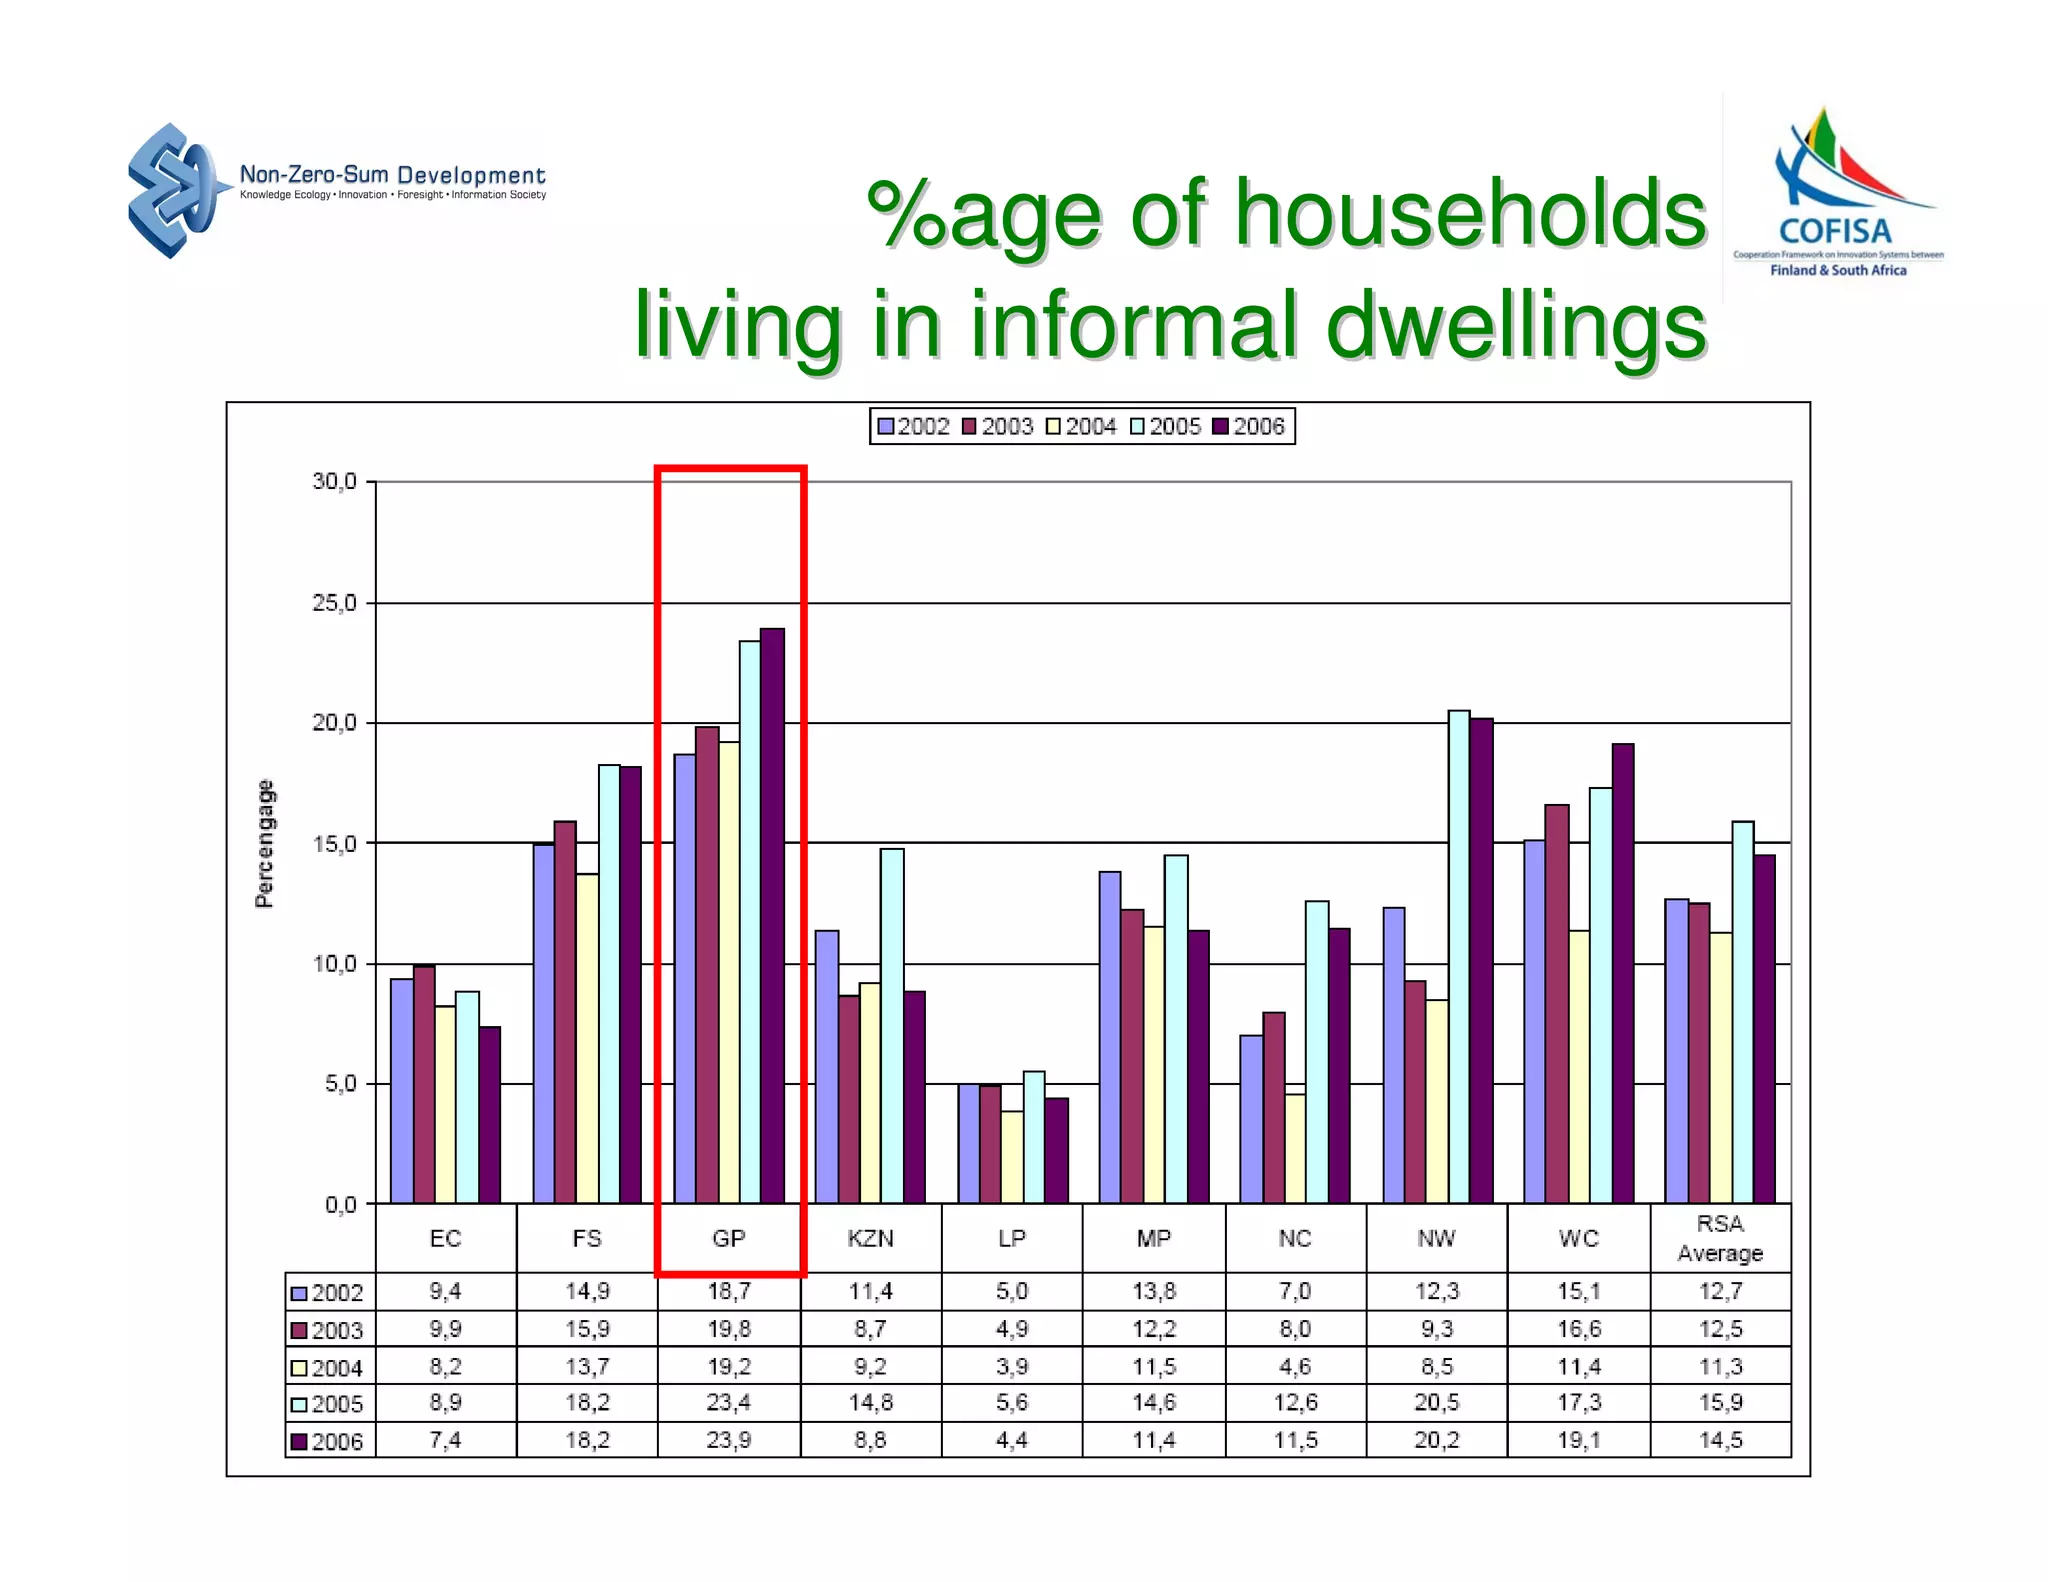
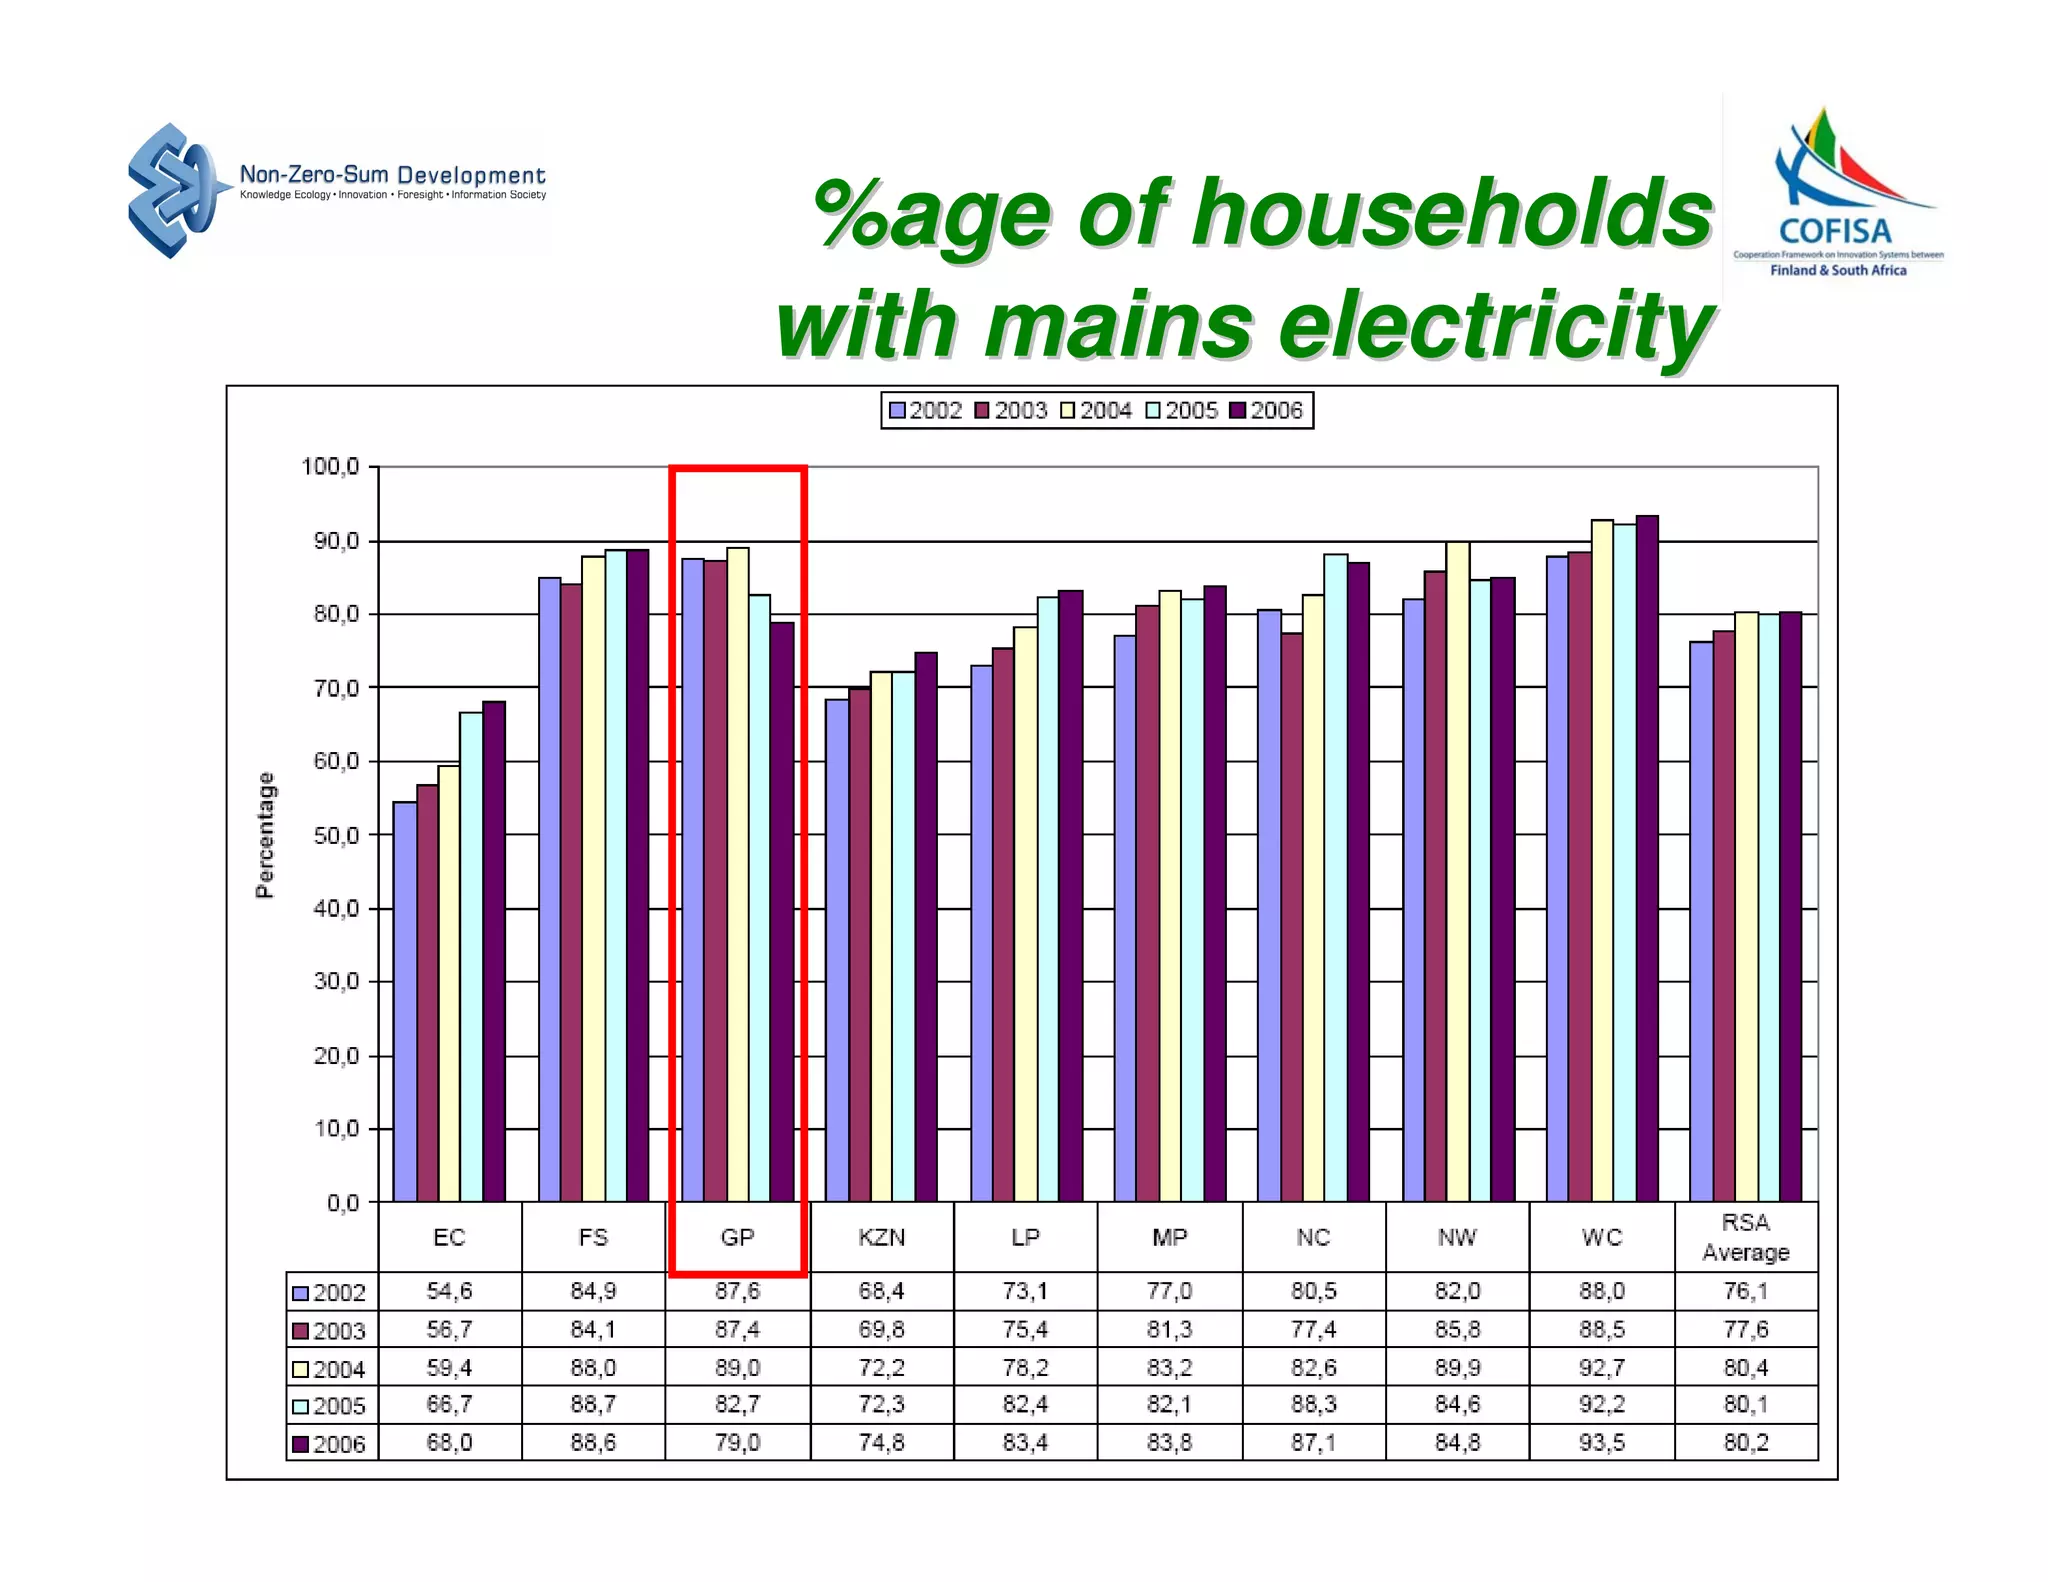
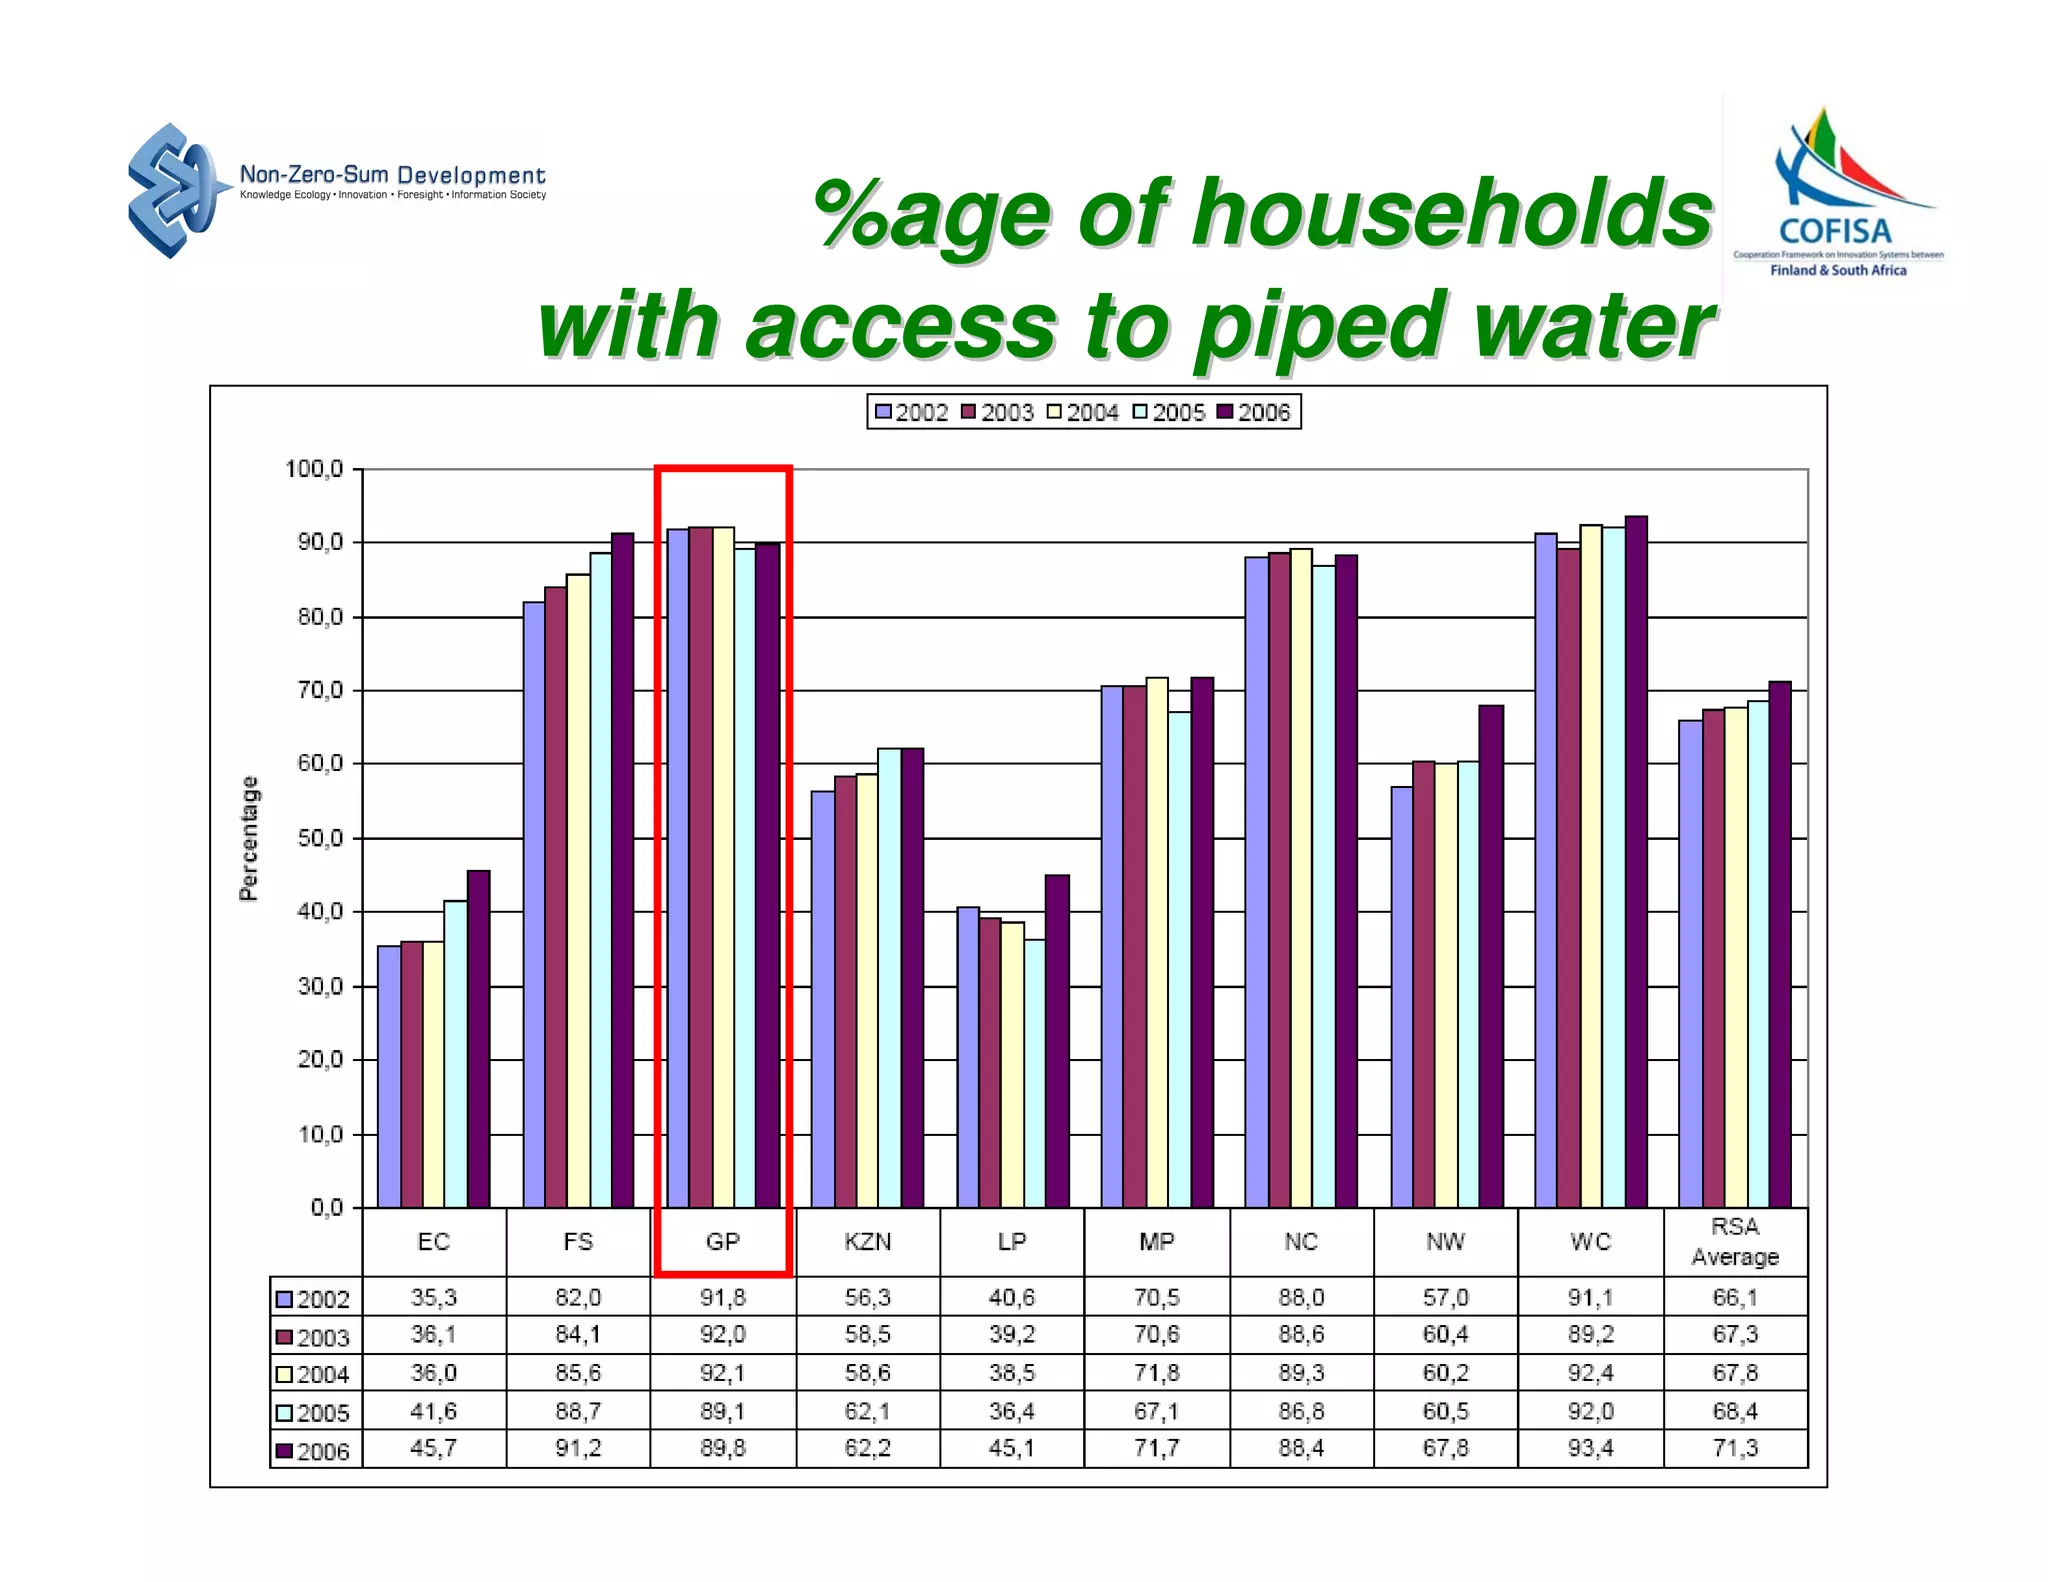
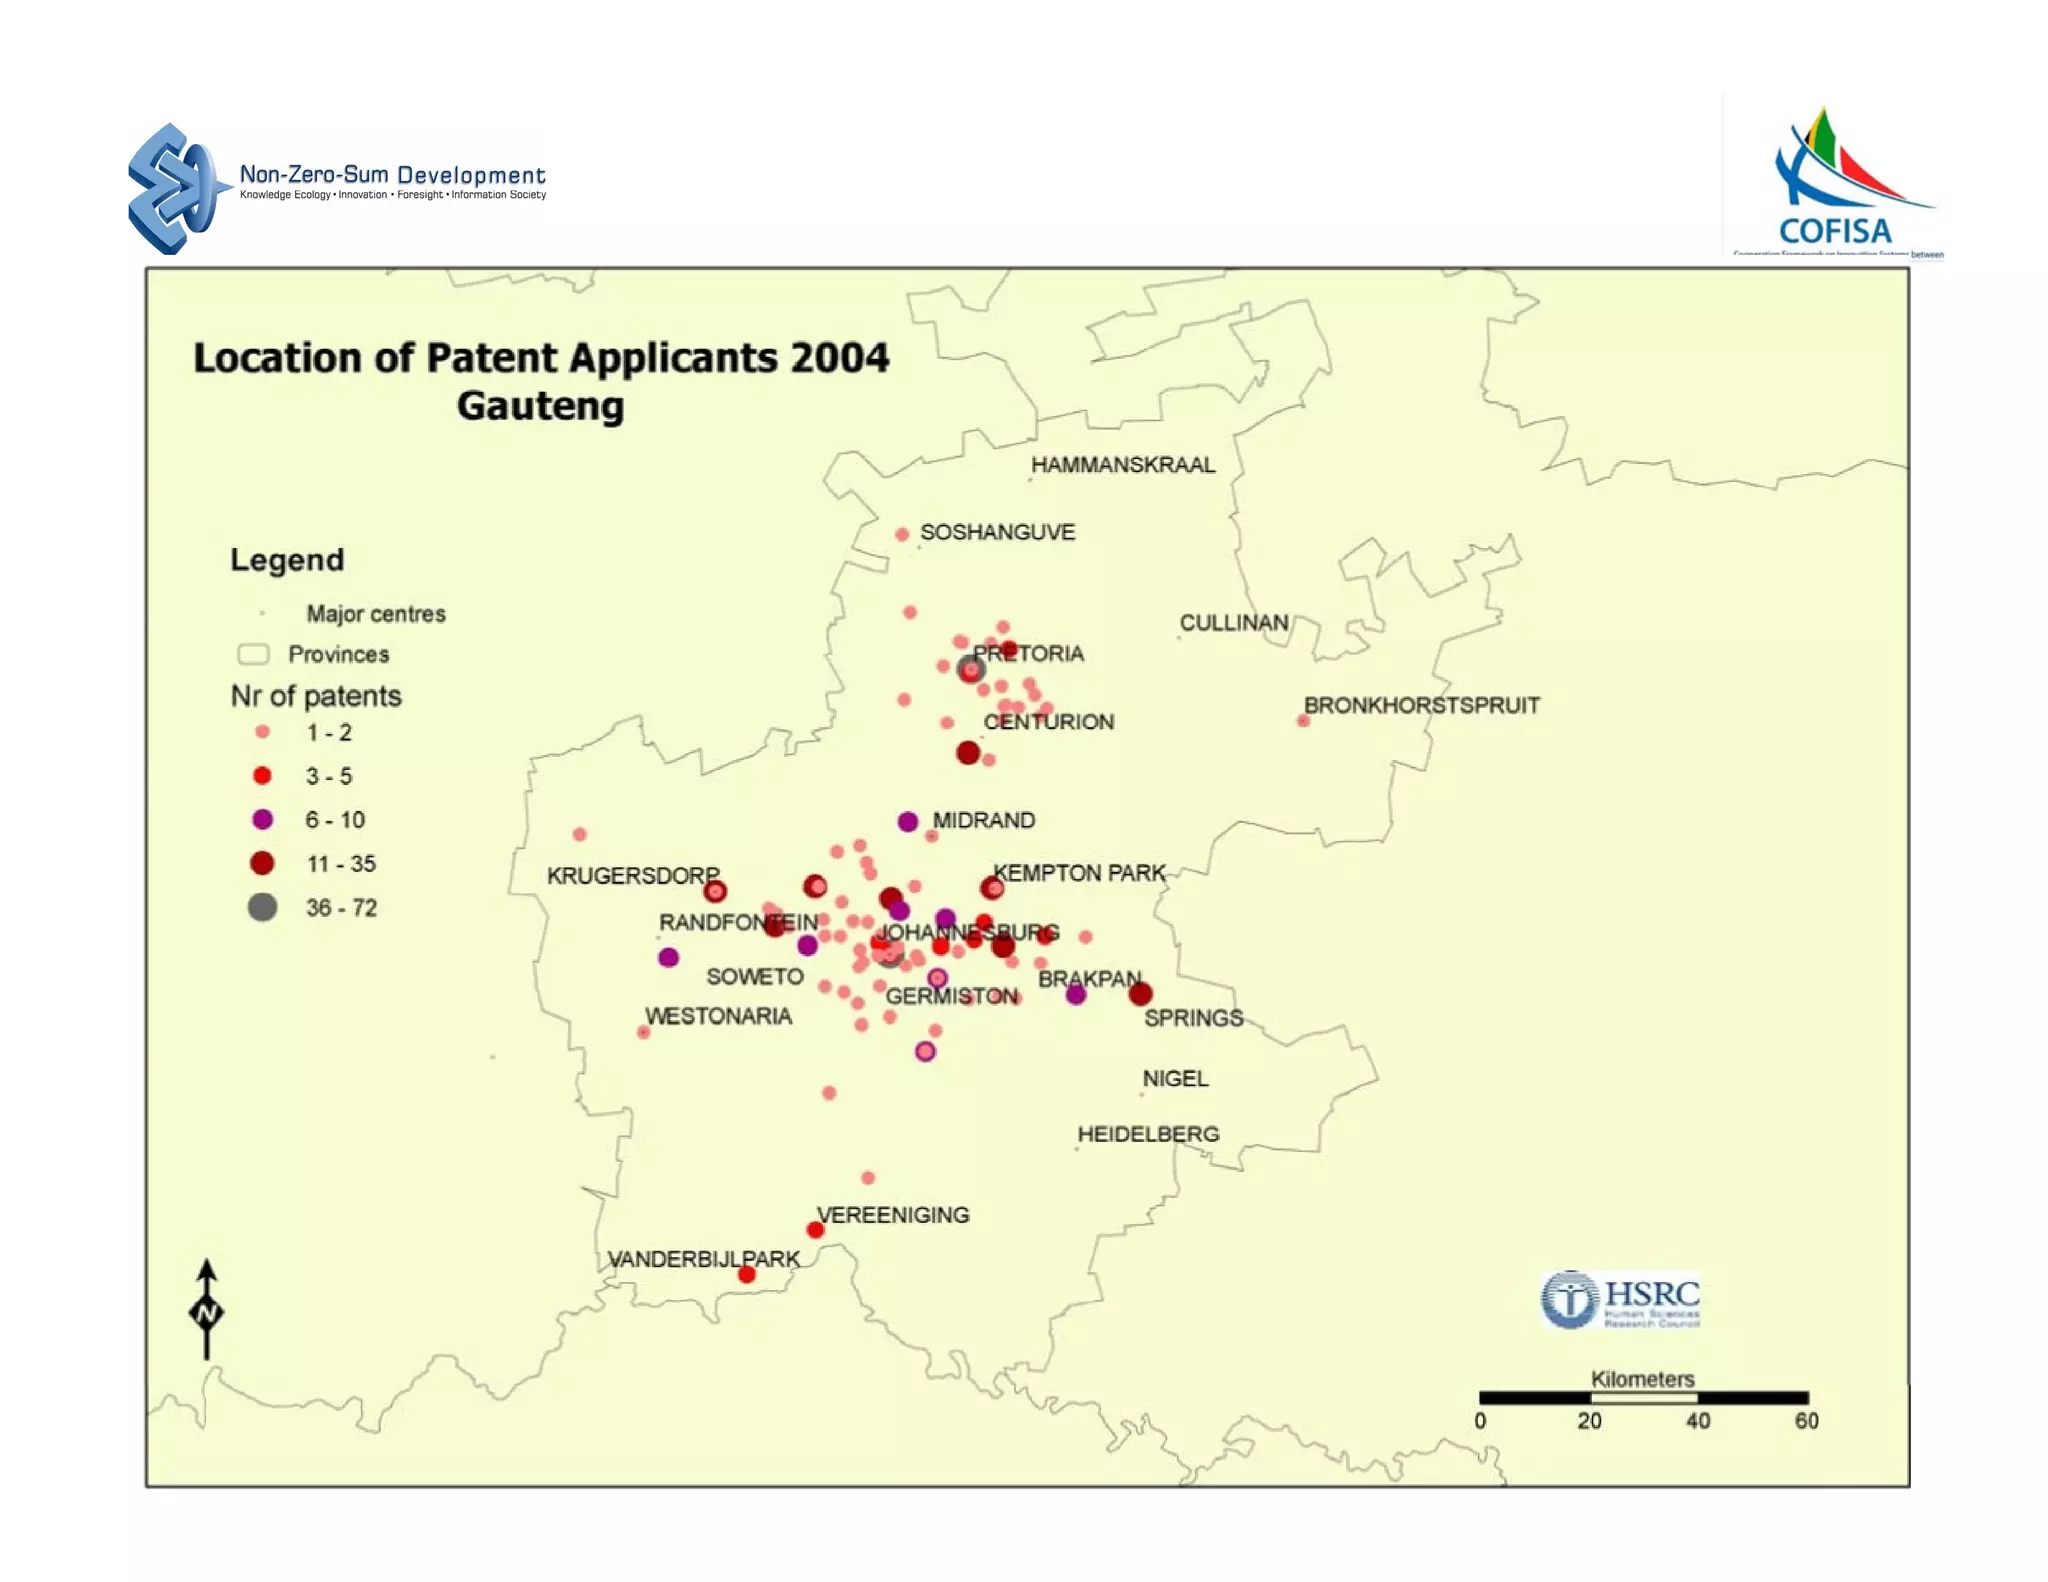
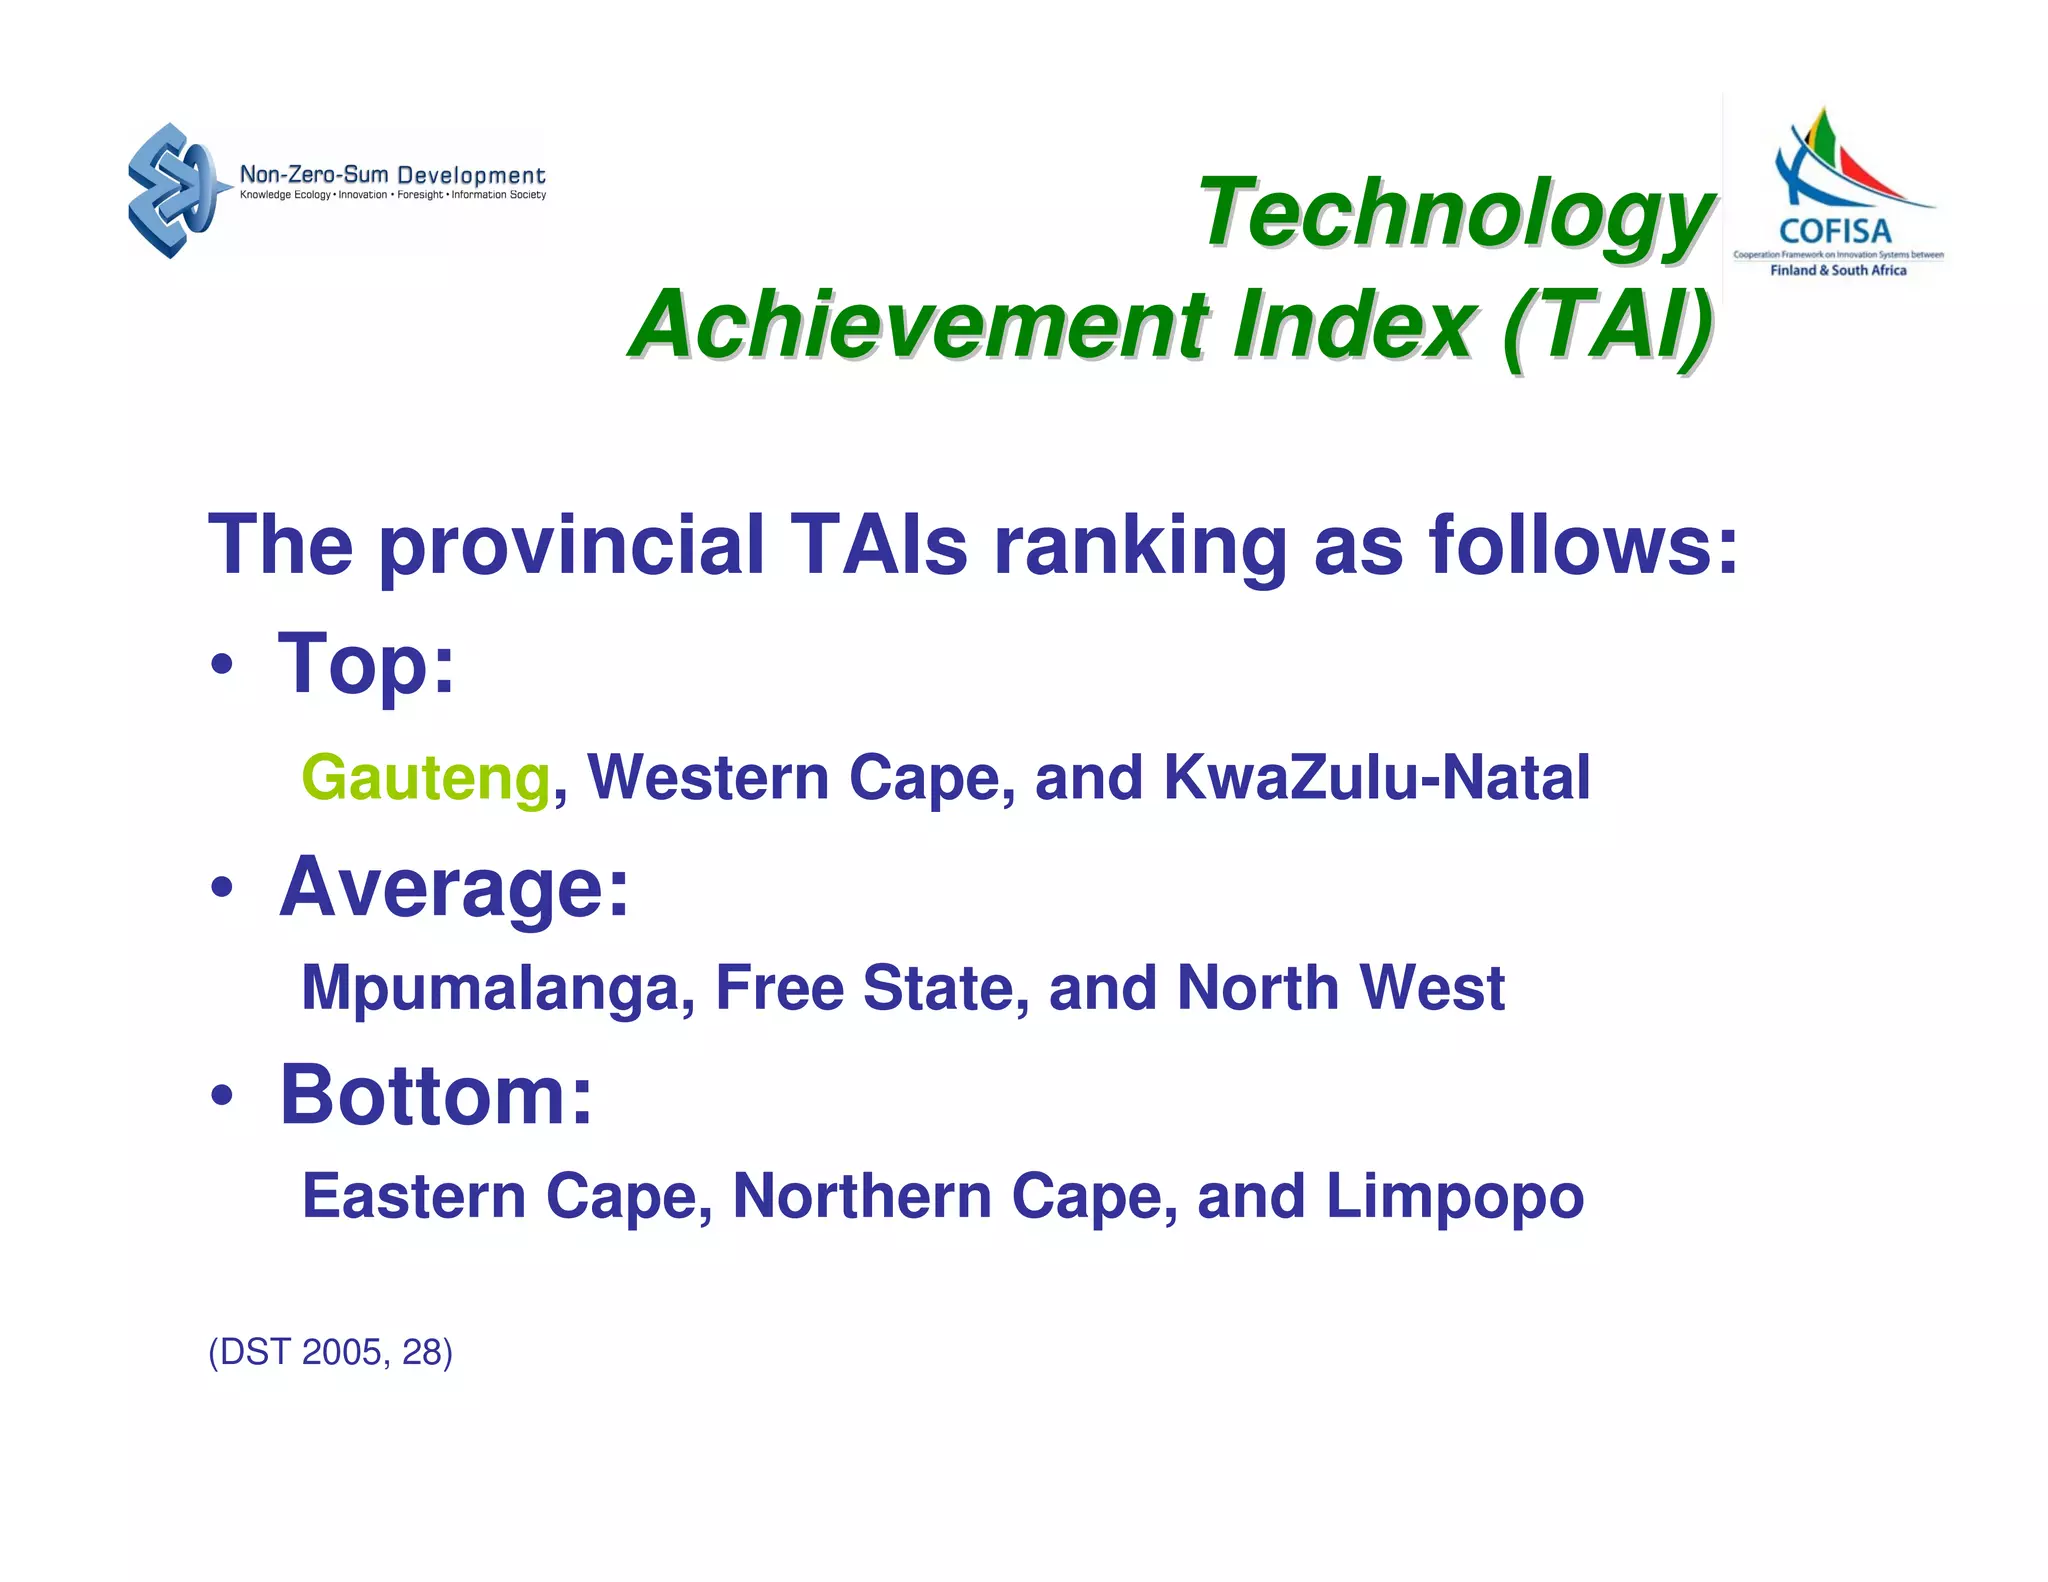
1) The document presents demographic and socioeconomic data on the province of Gauteng in South Africa, focusing on topics like population, poverty, education, industry, and research and development.
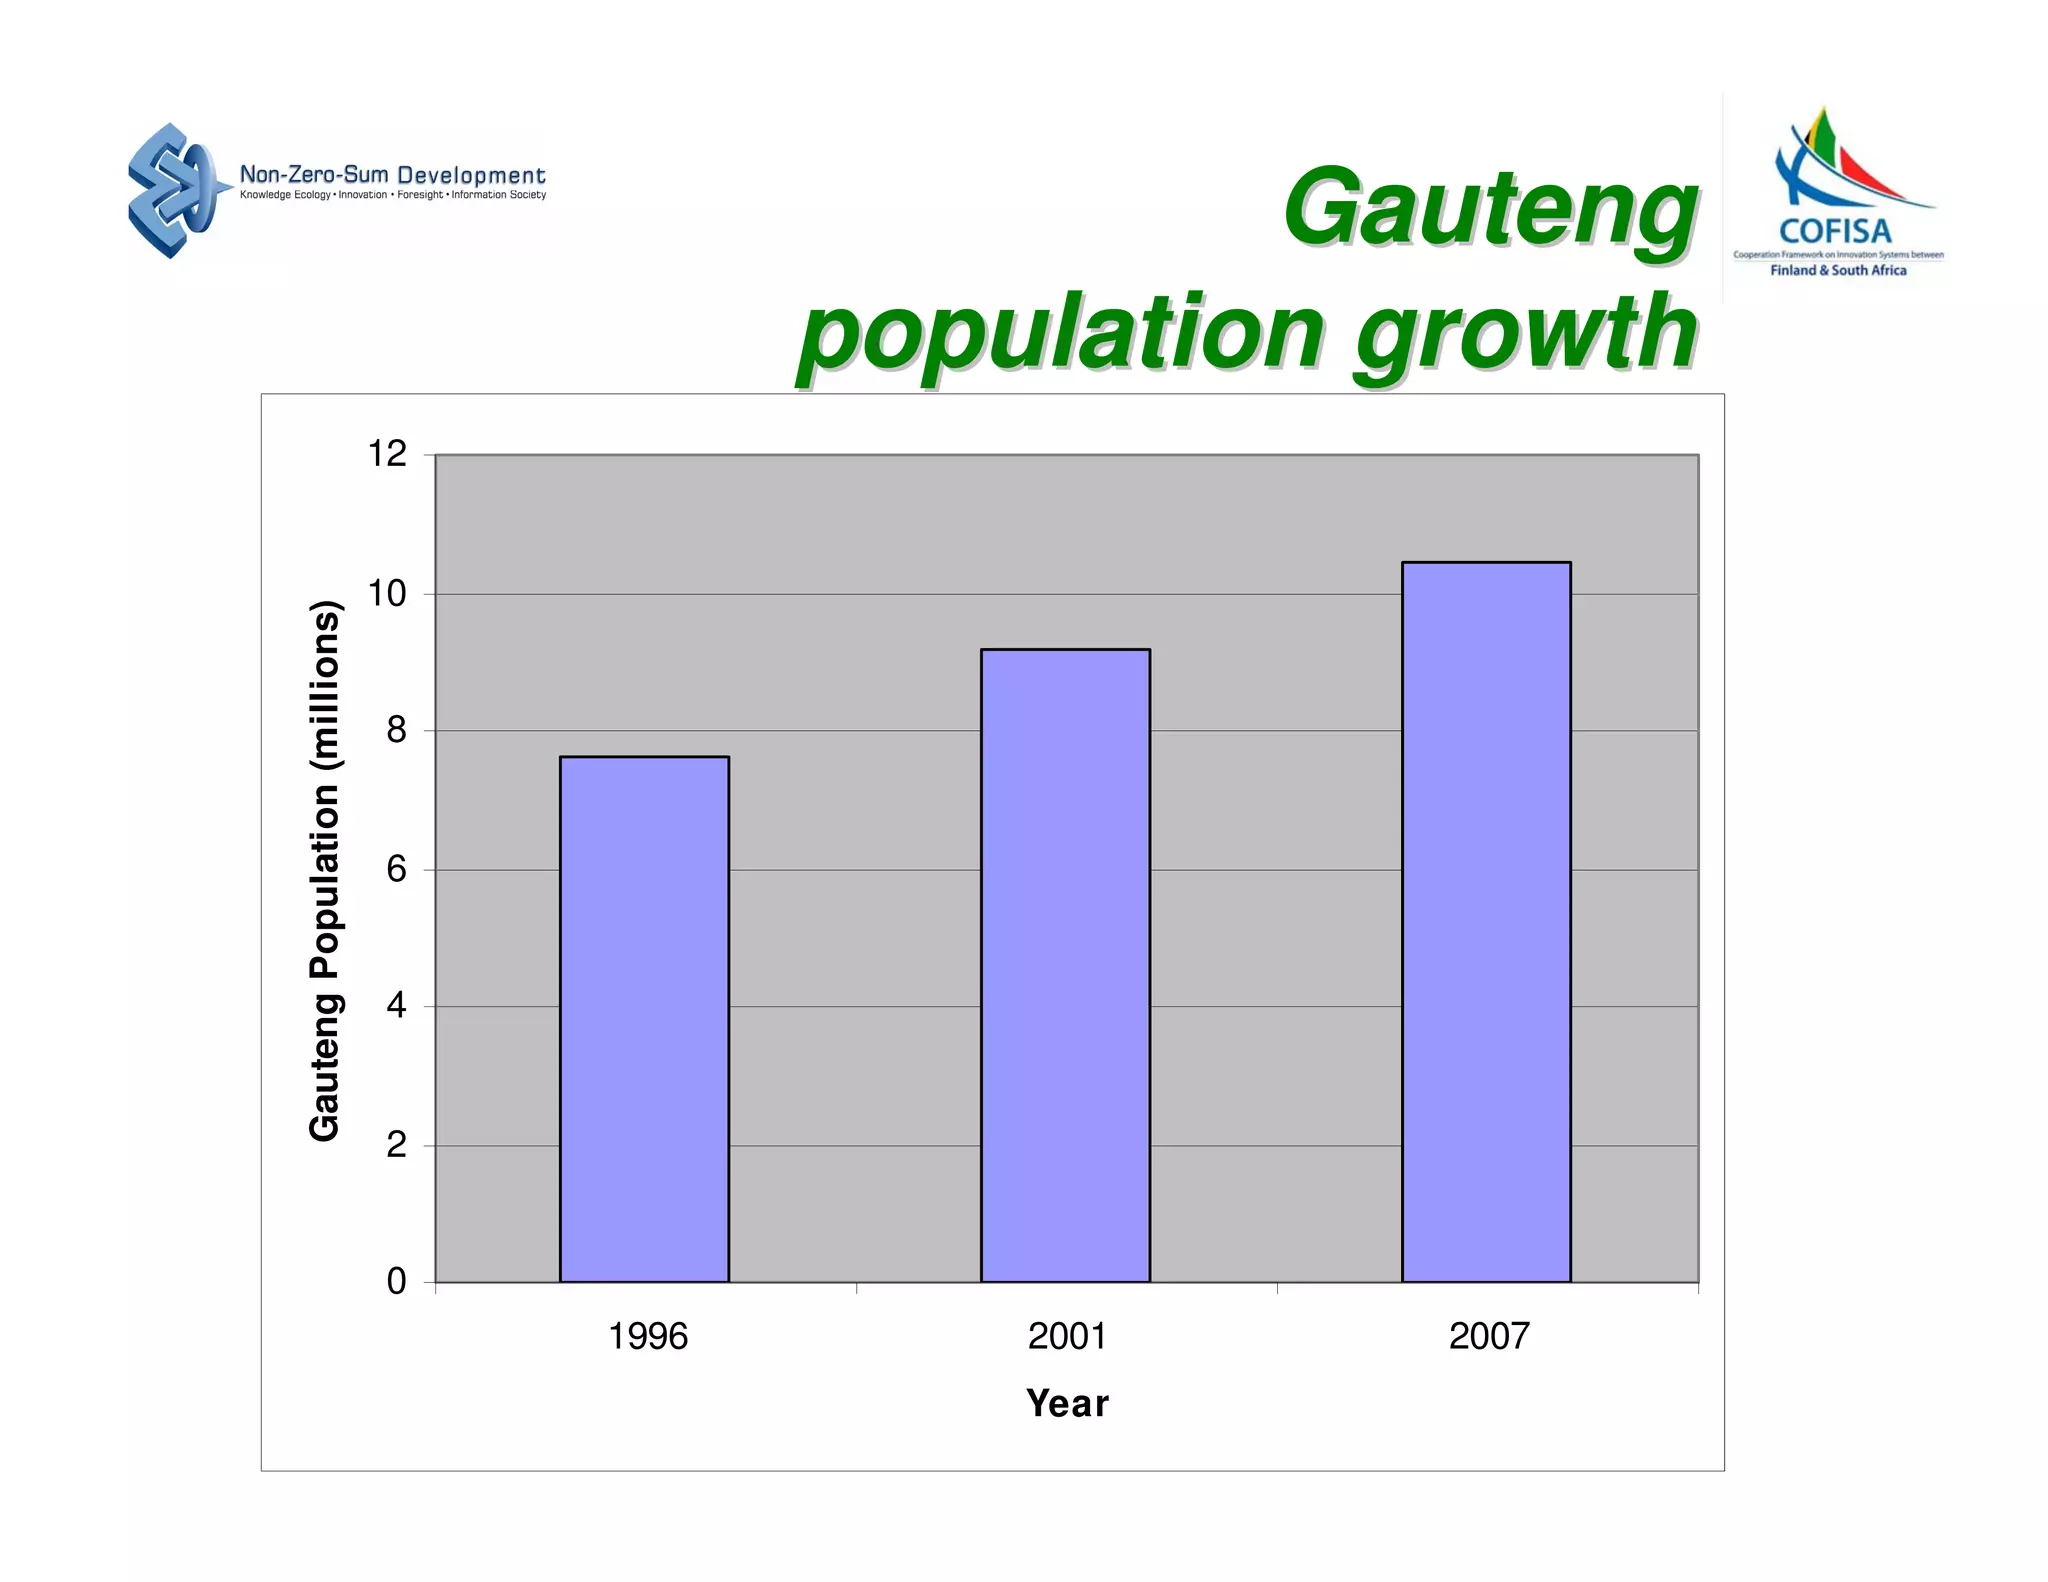
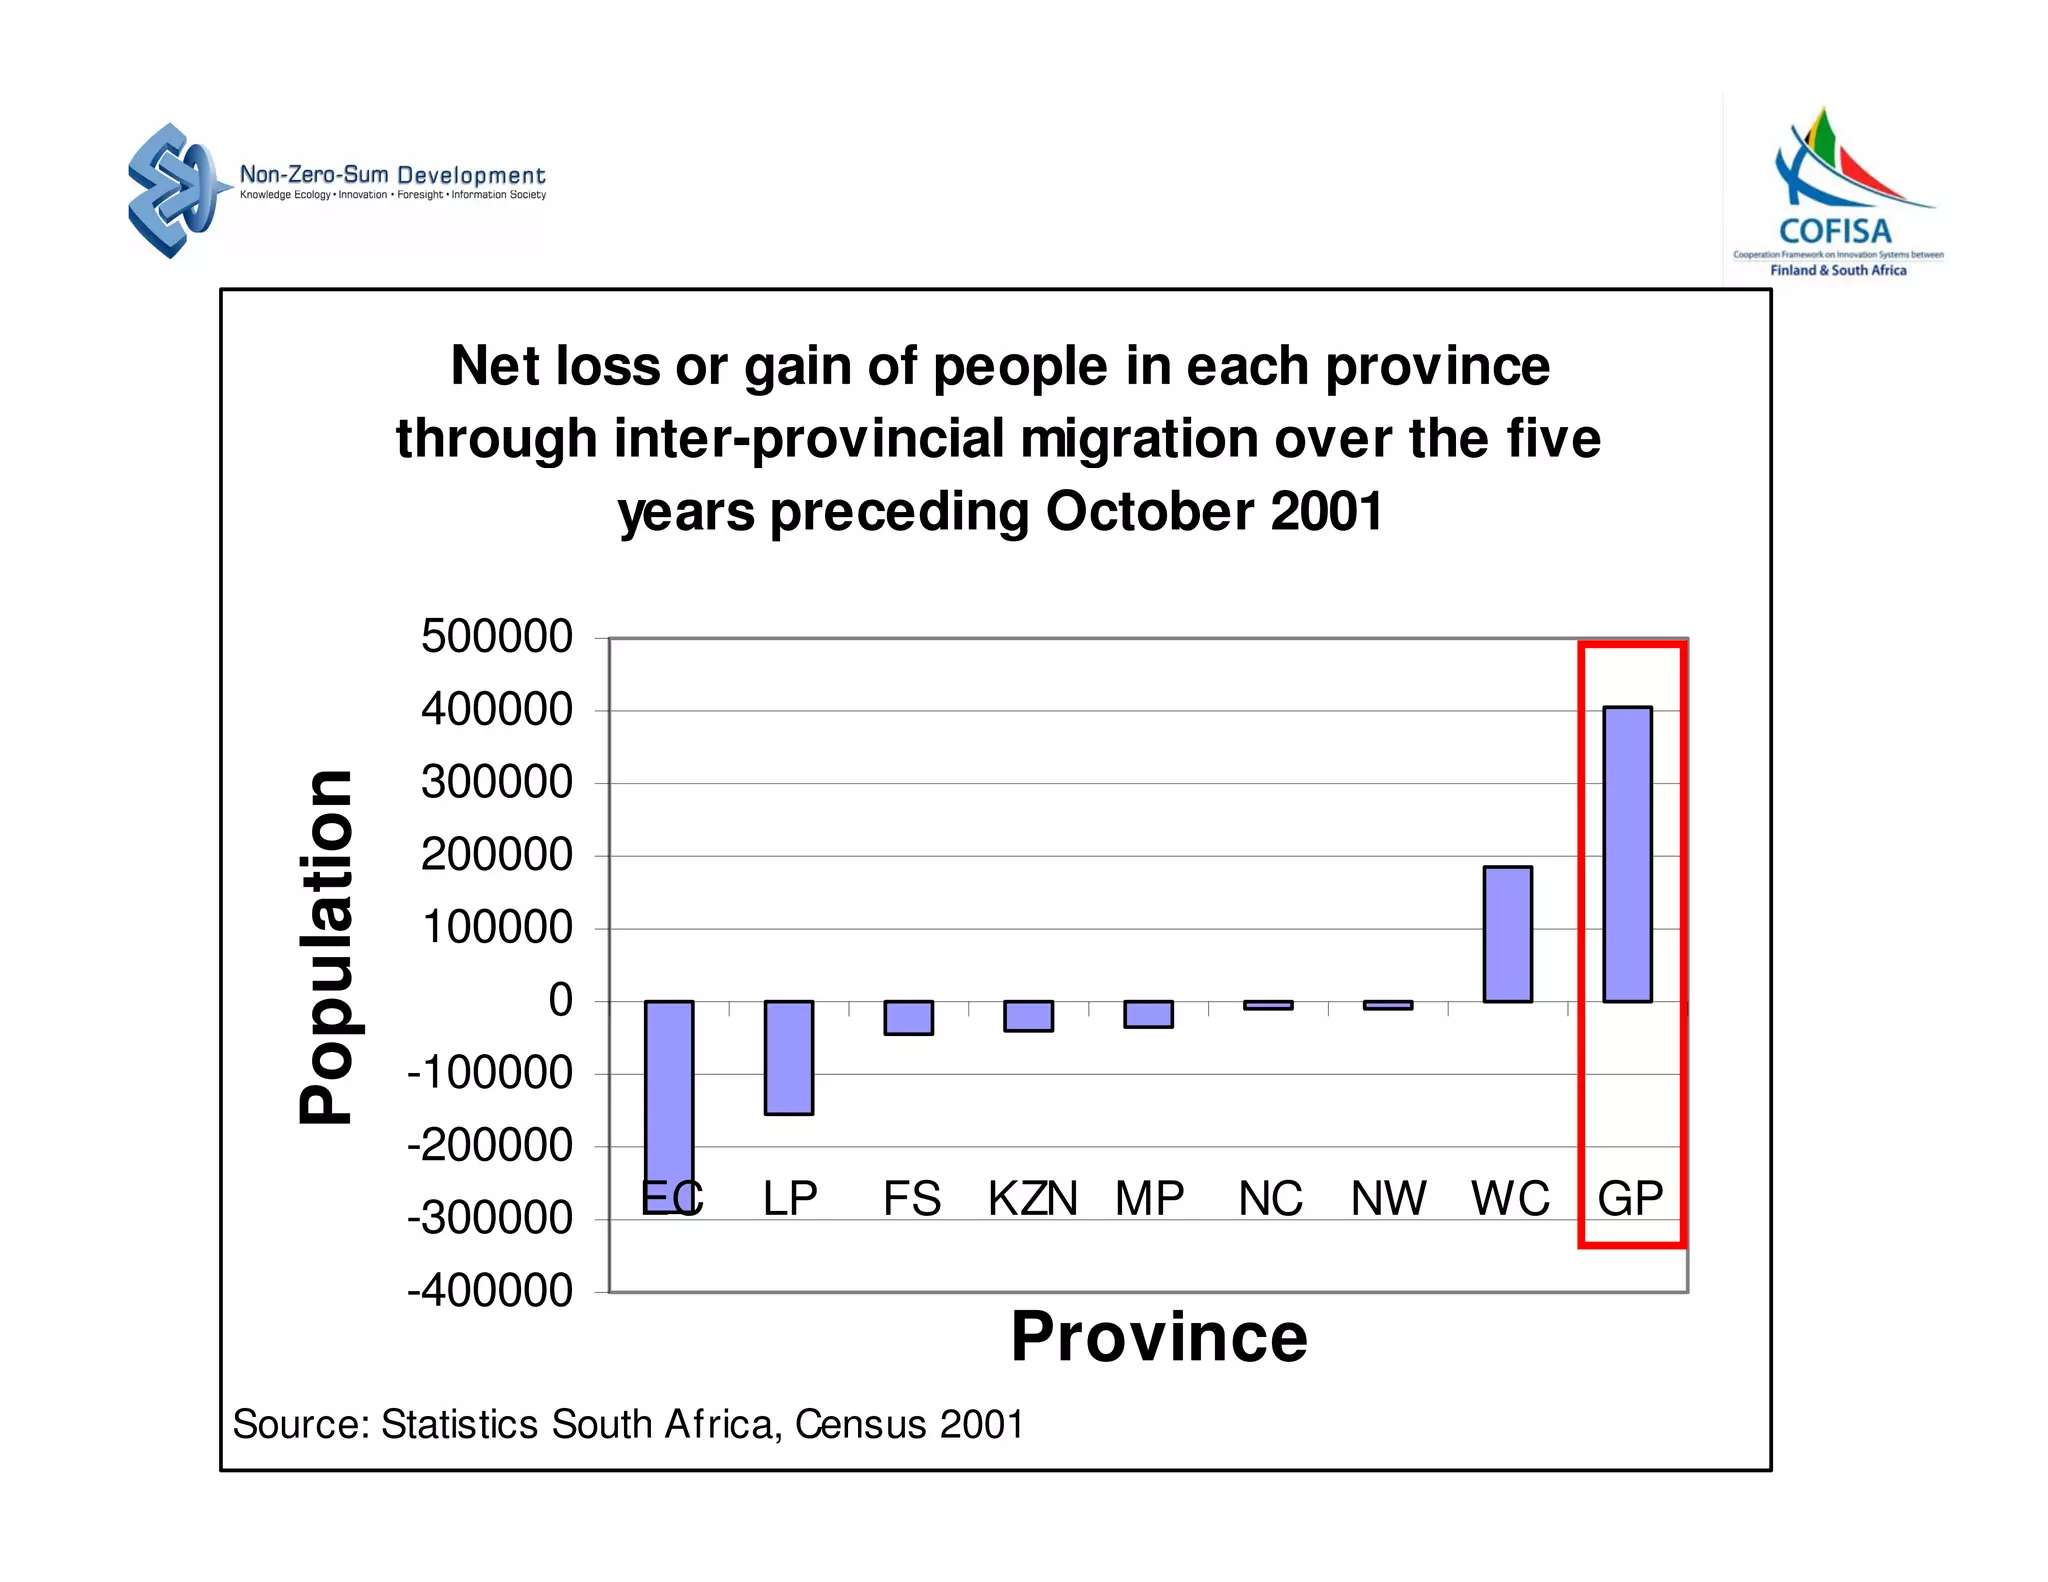
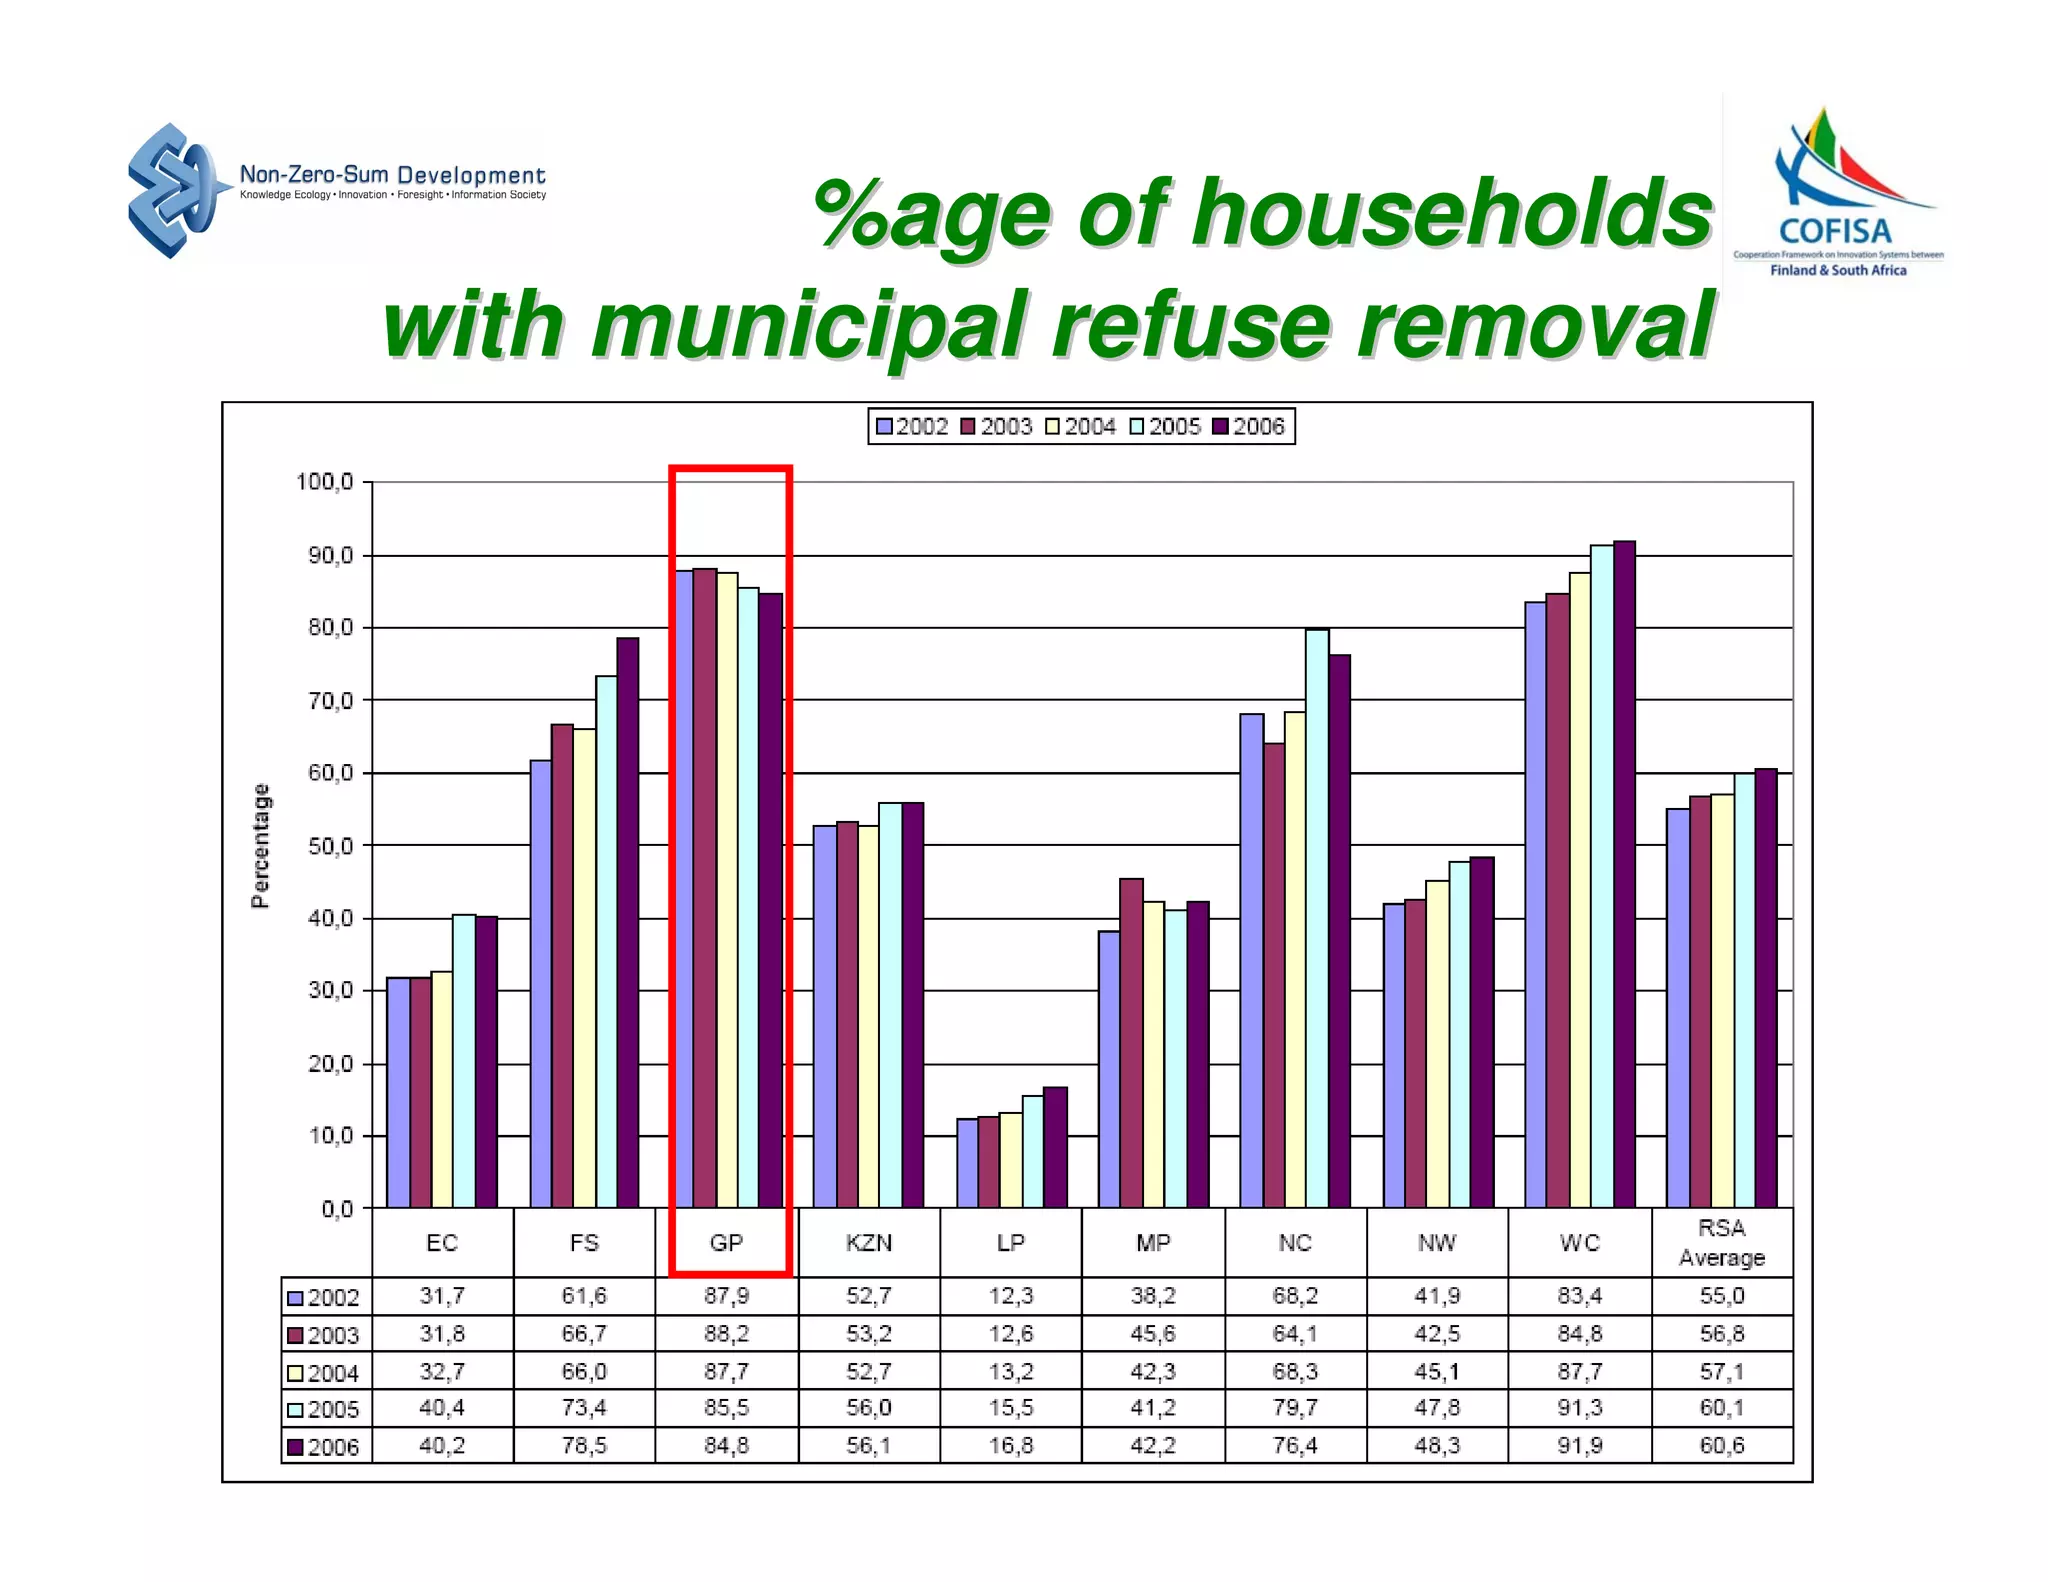
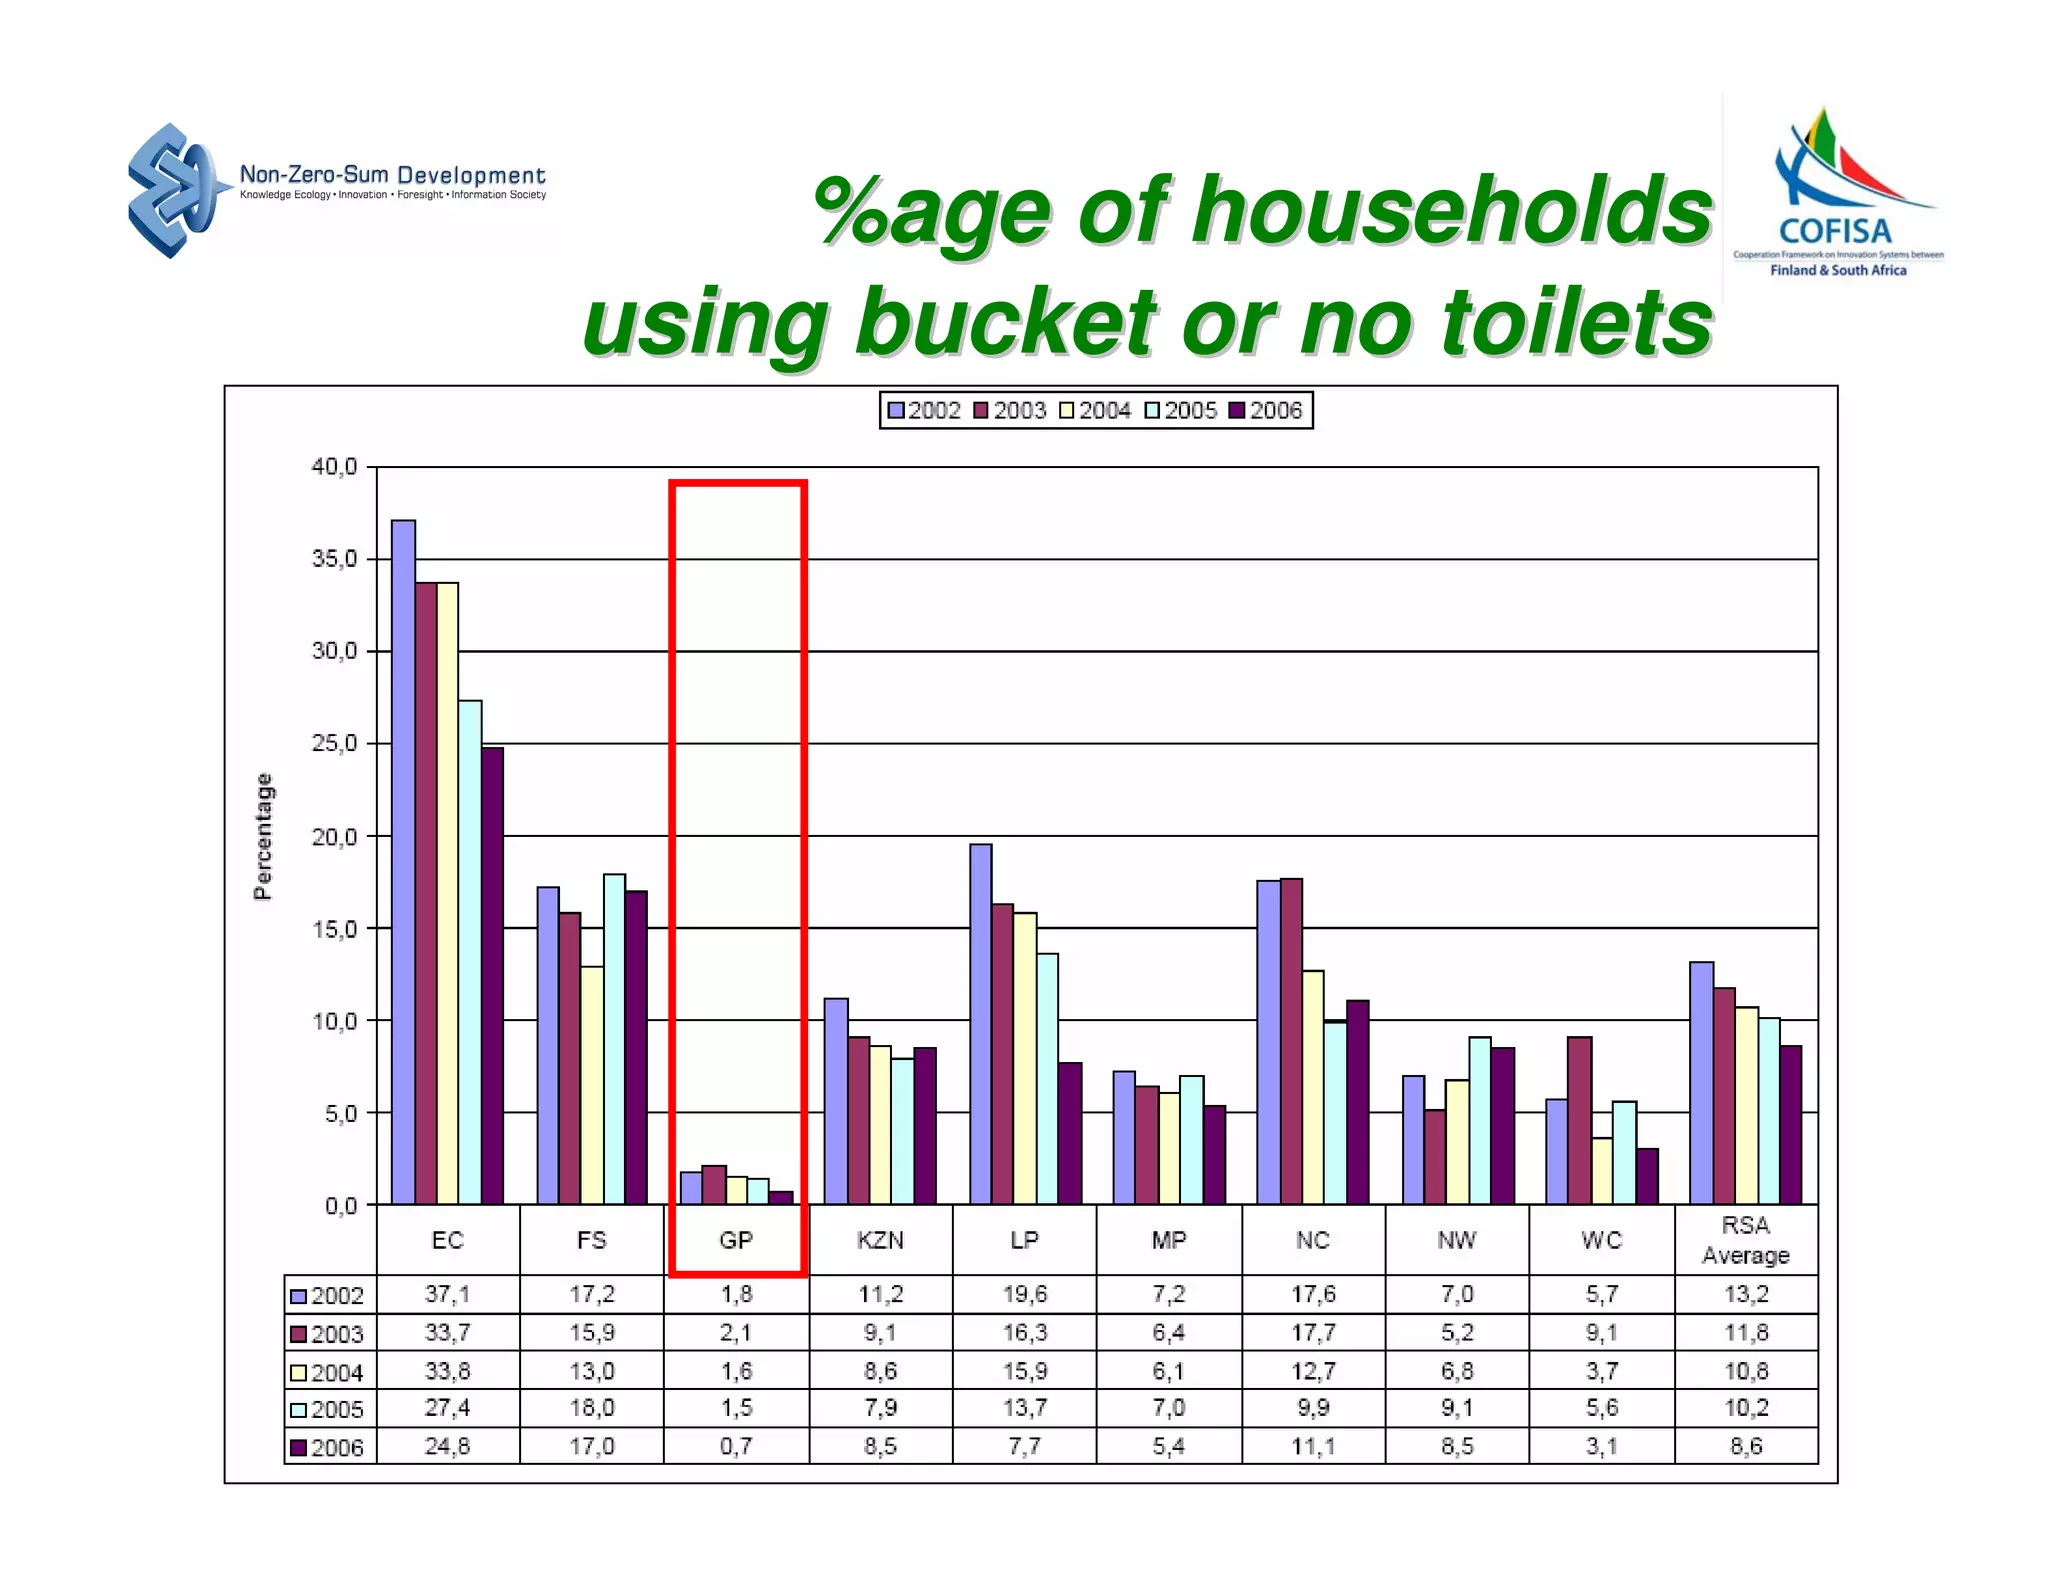
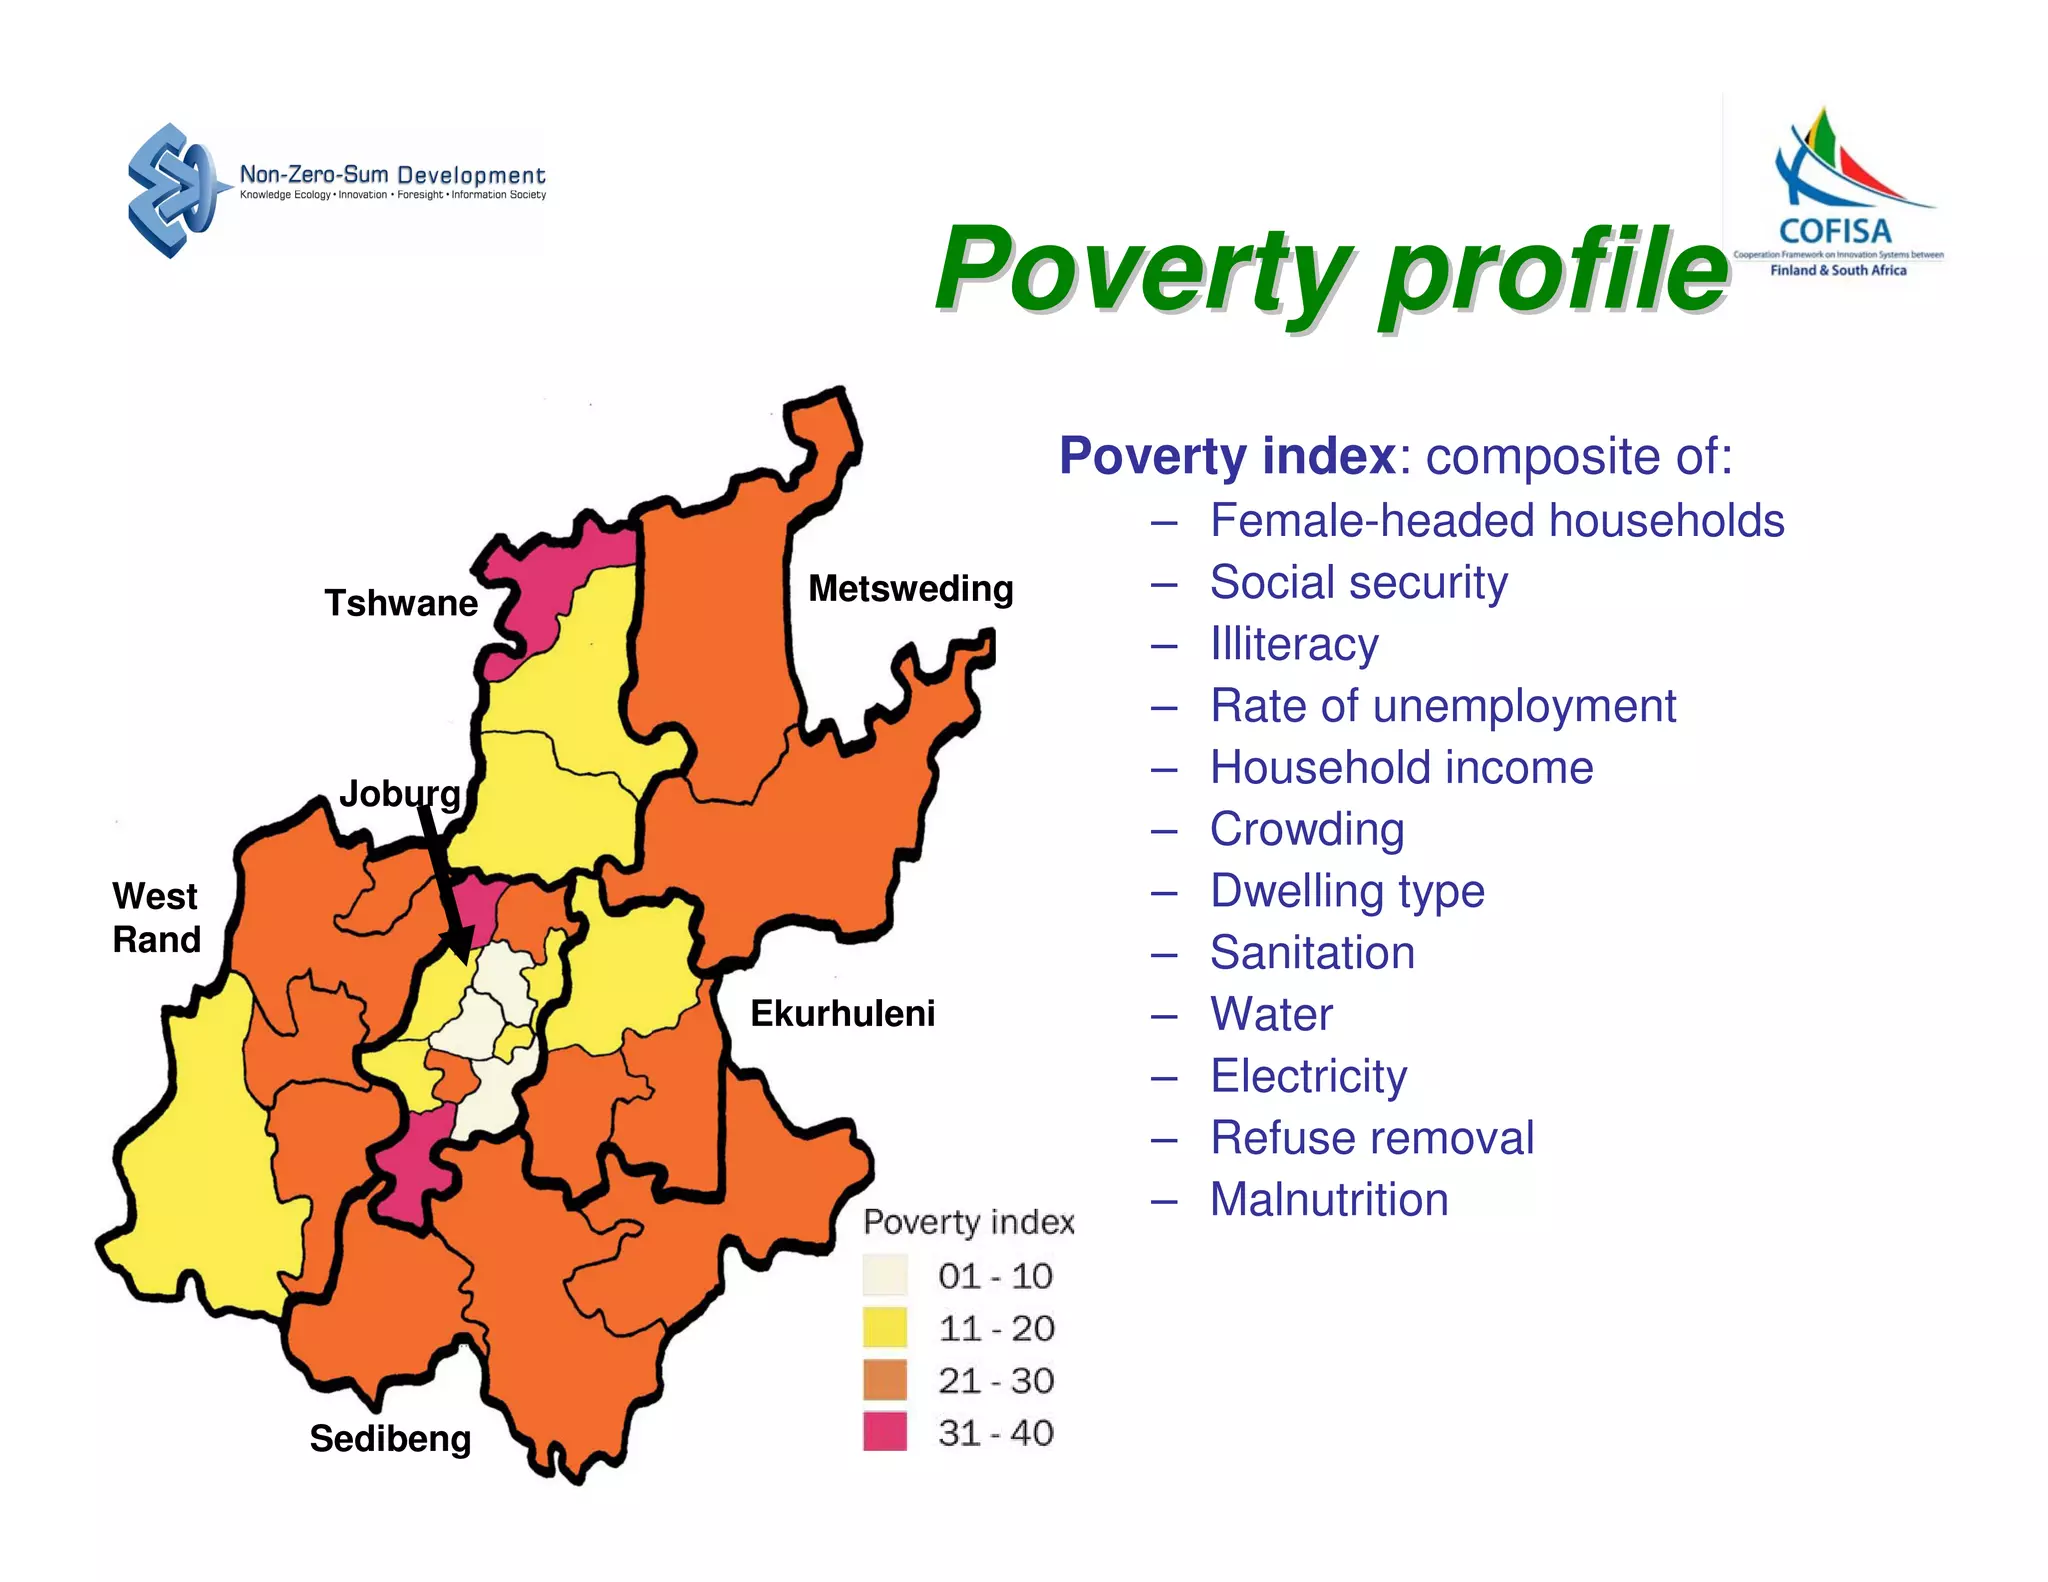
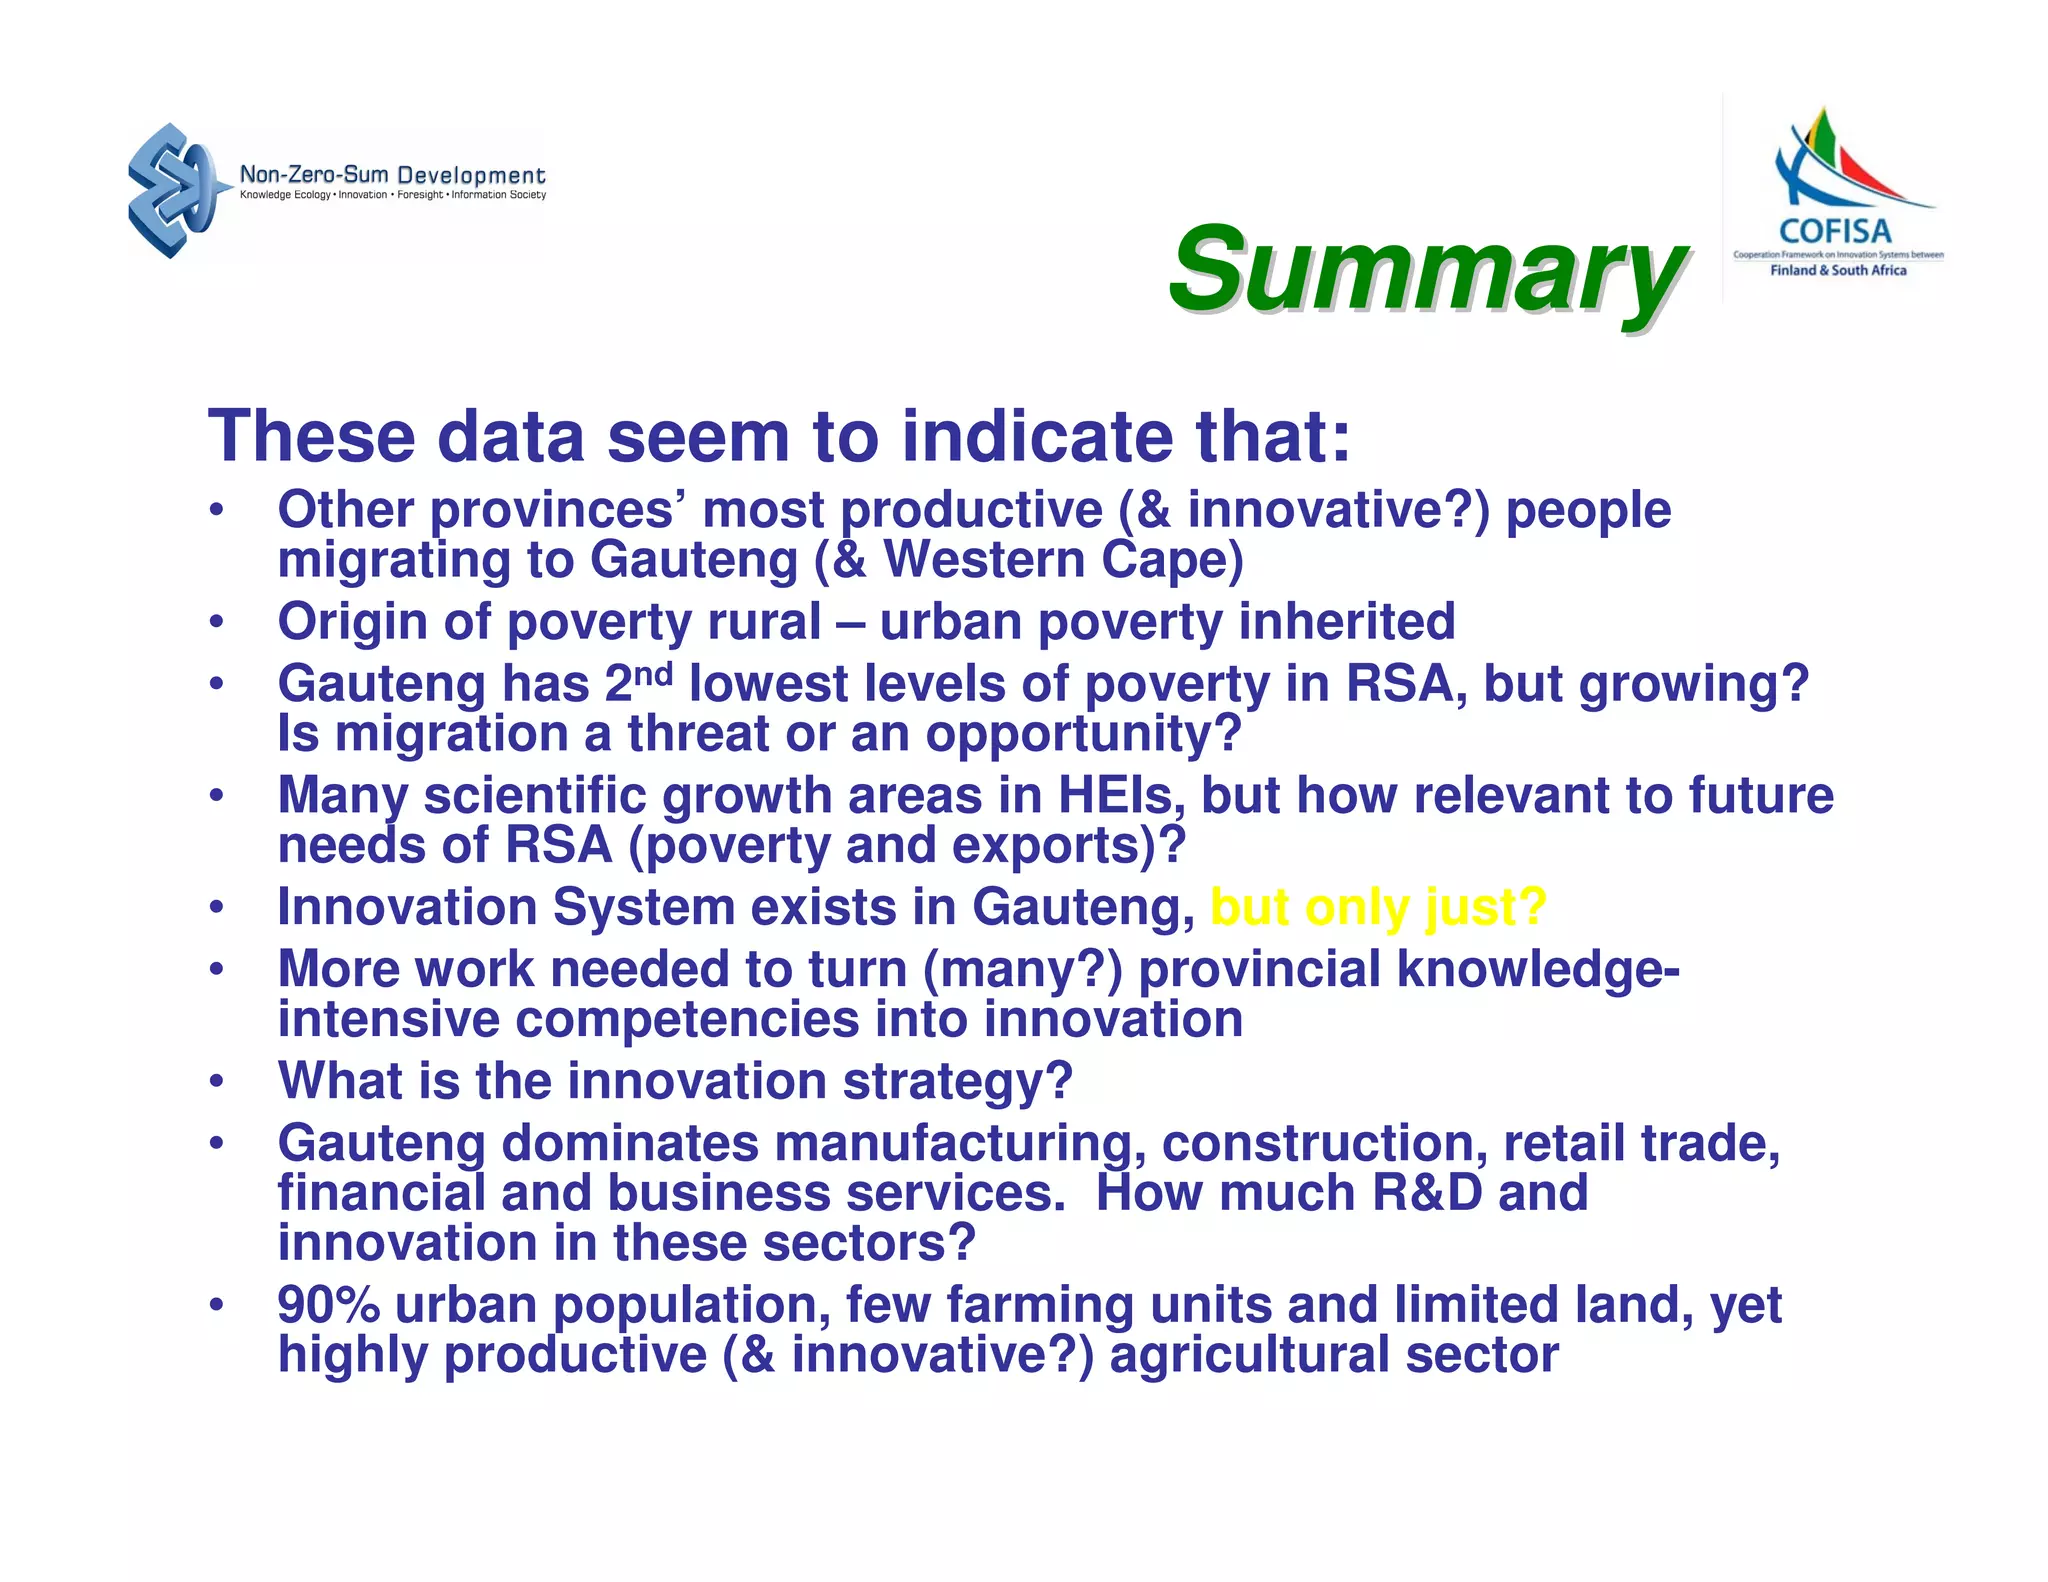
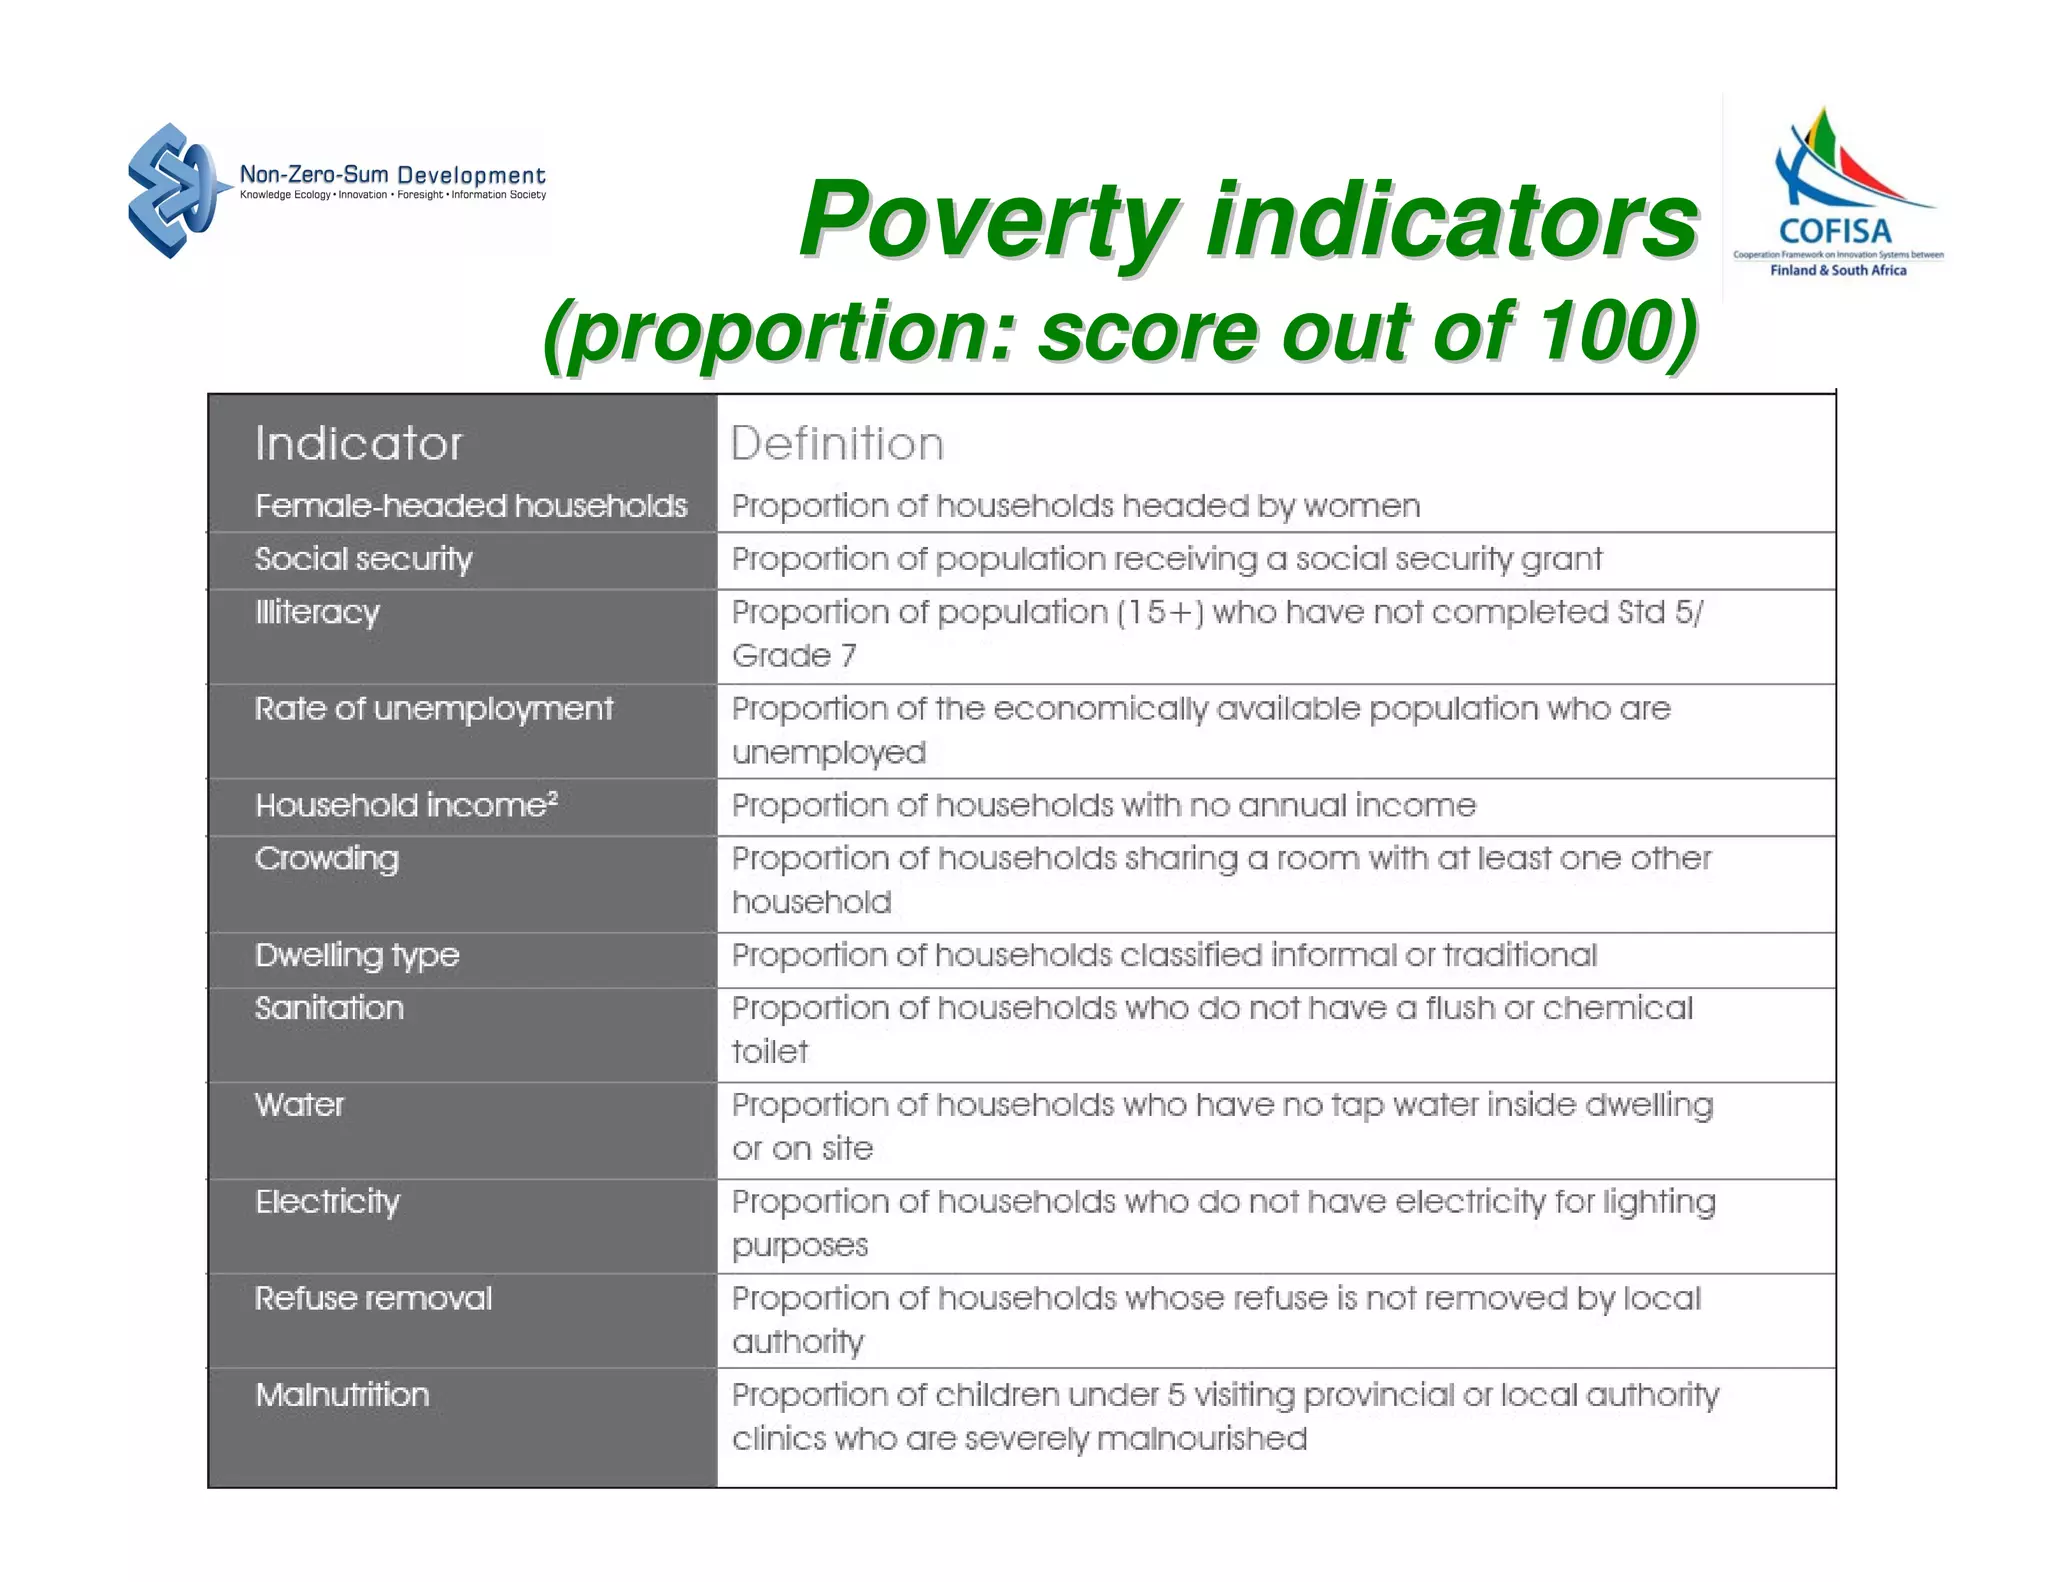
2) The data indicate that Gauteng receives migrants from other provinces and has relatively low poverty, but poverty levels may be growing.
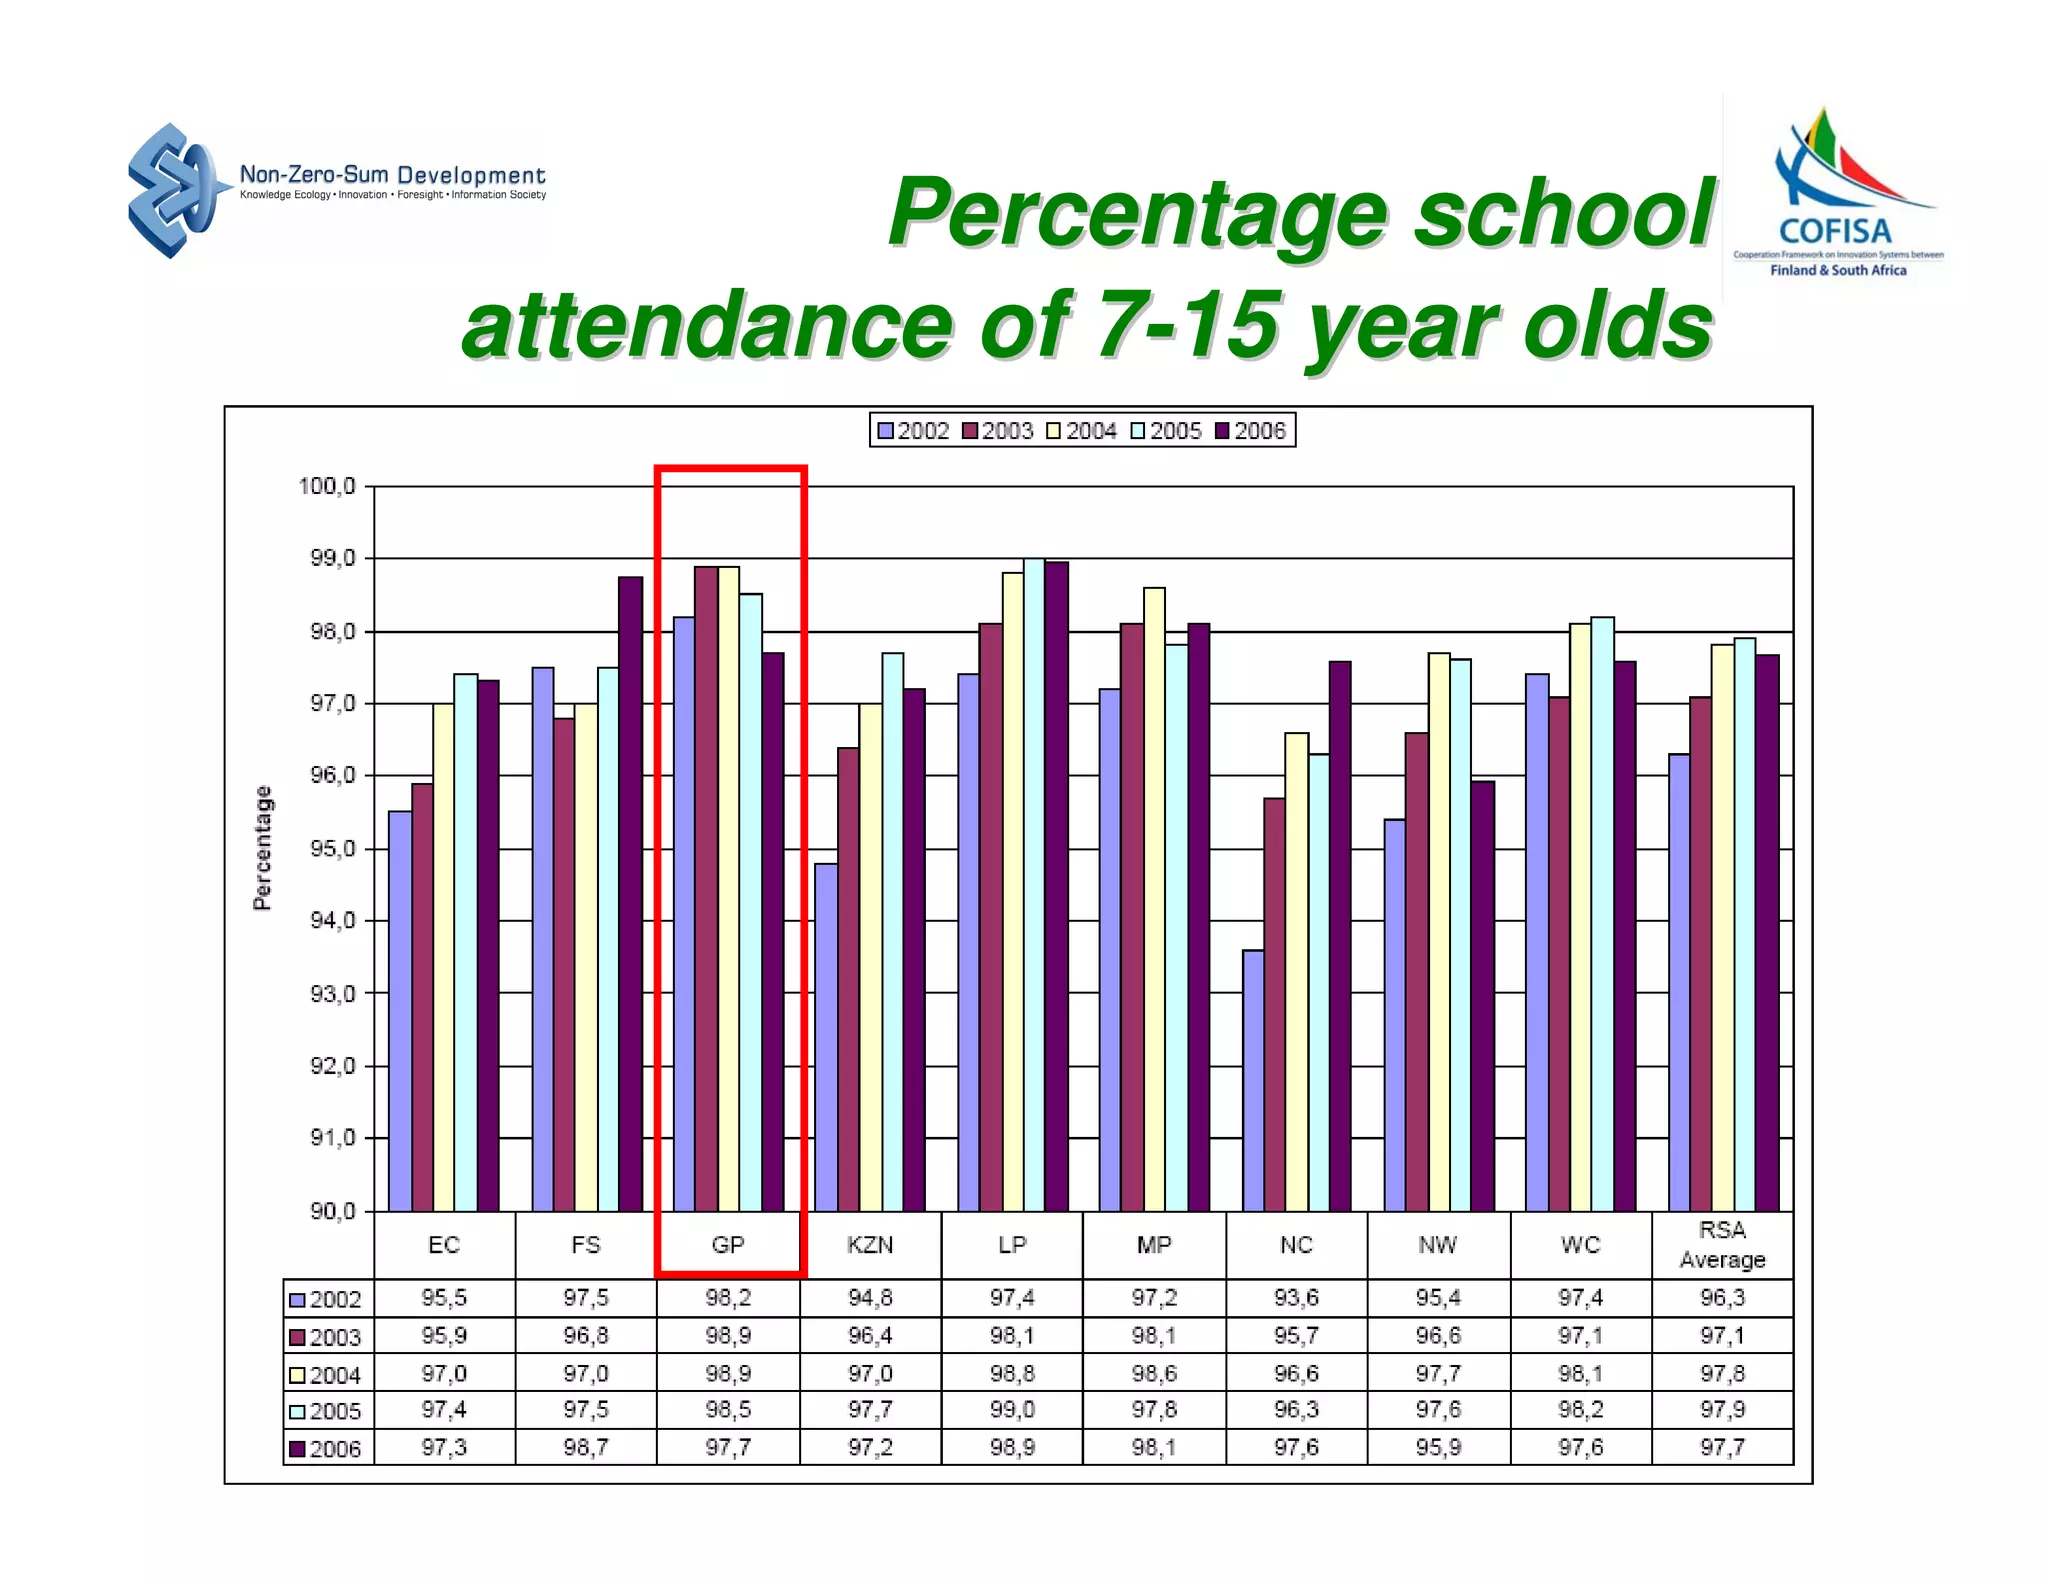
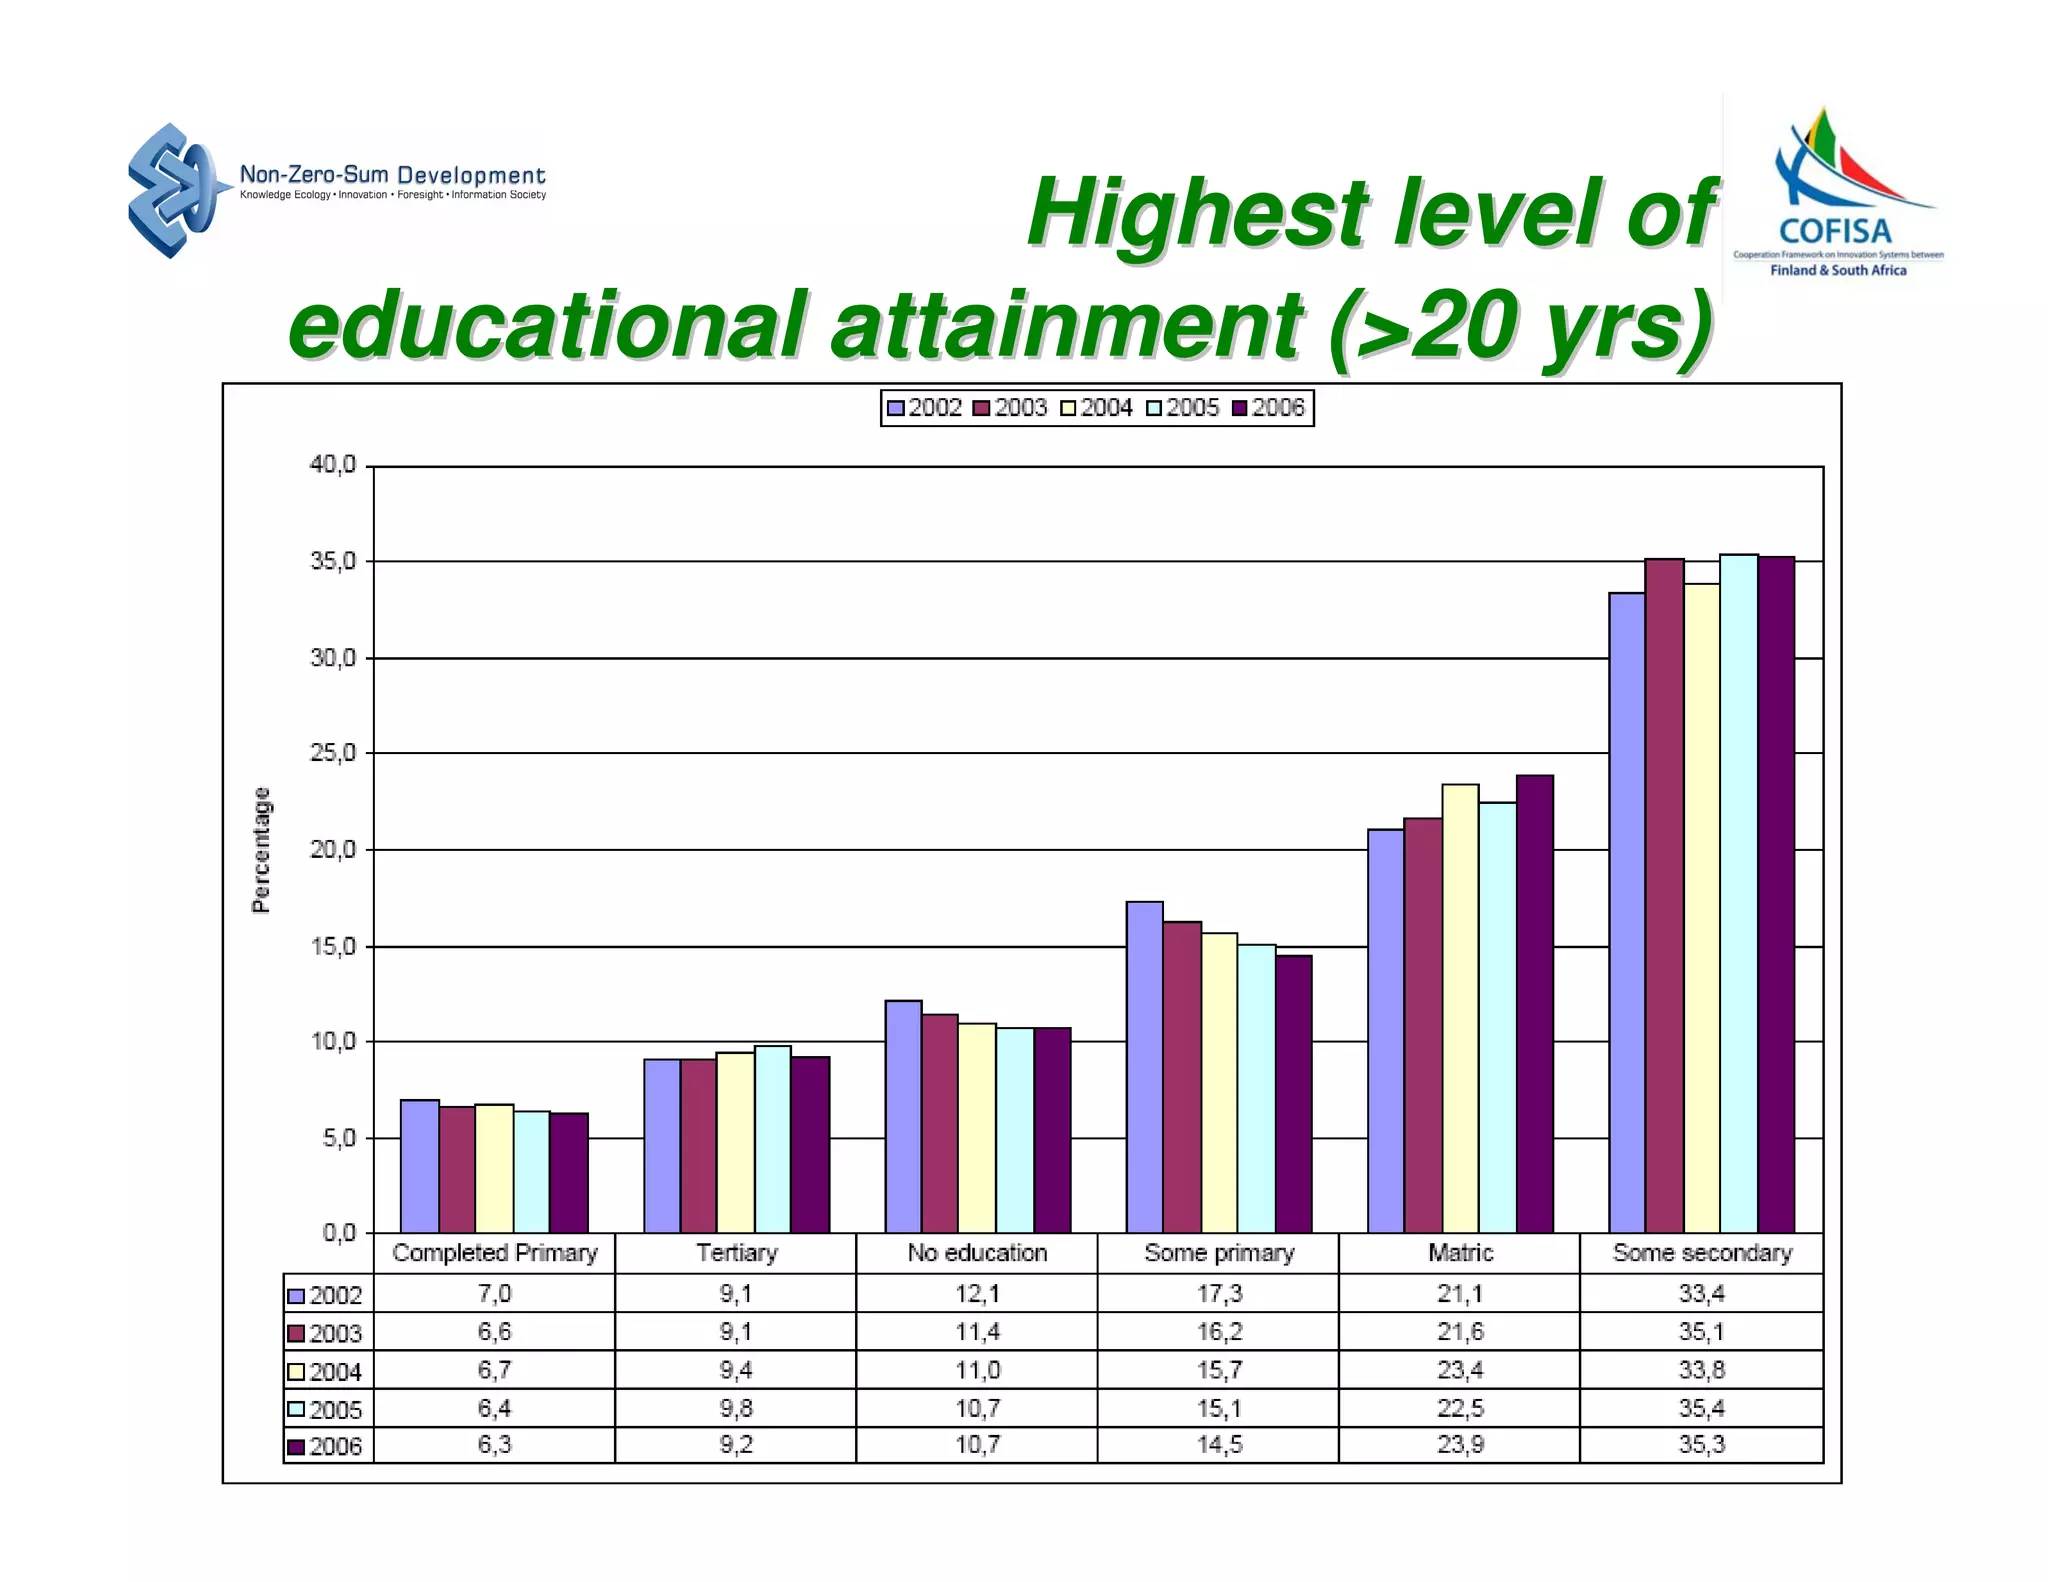
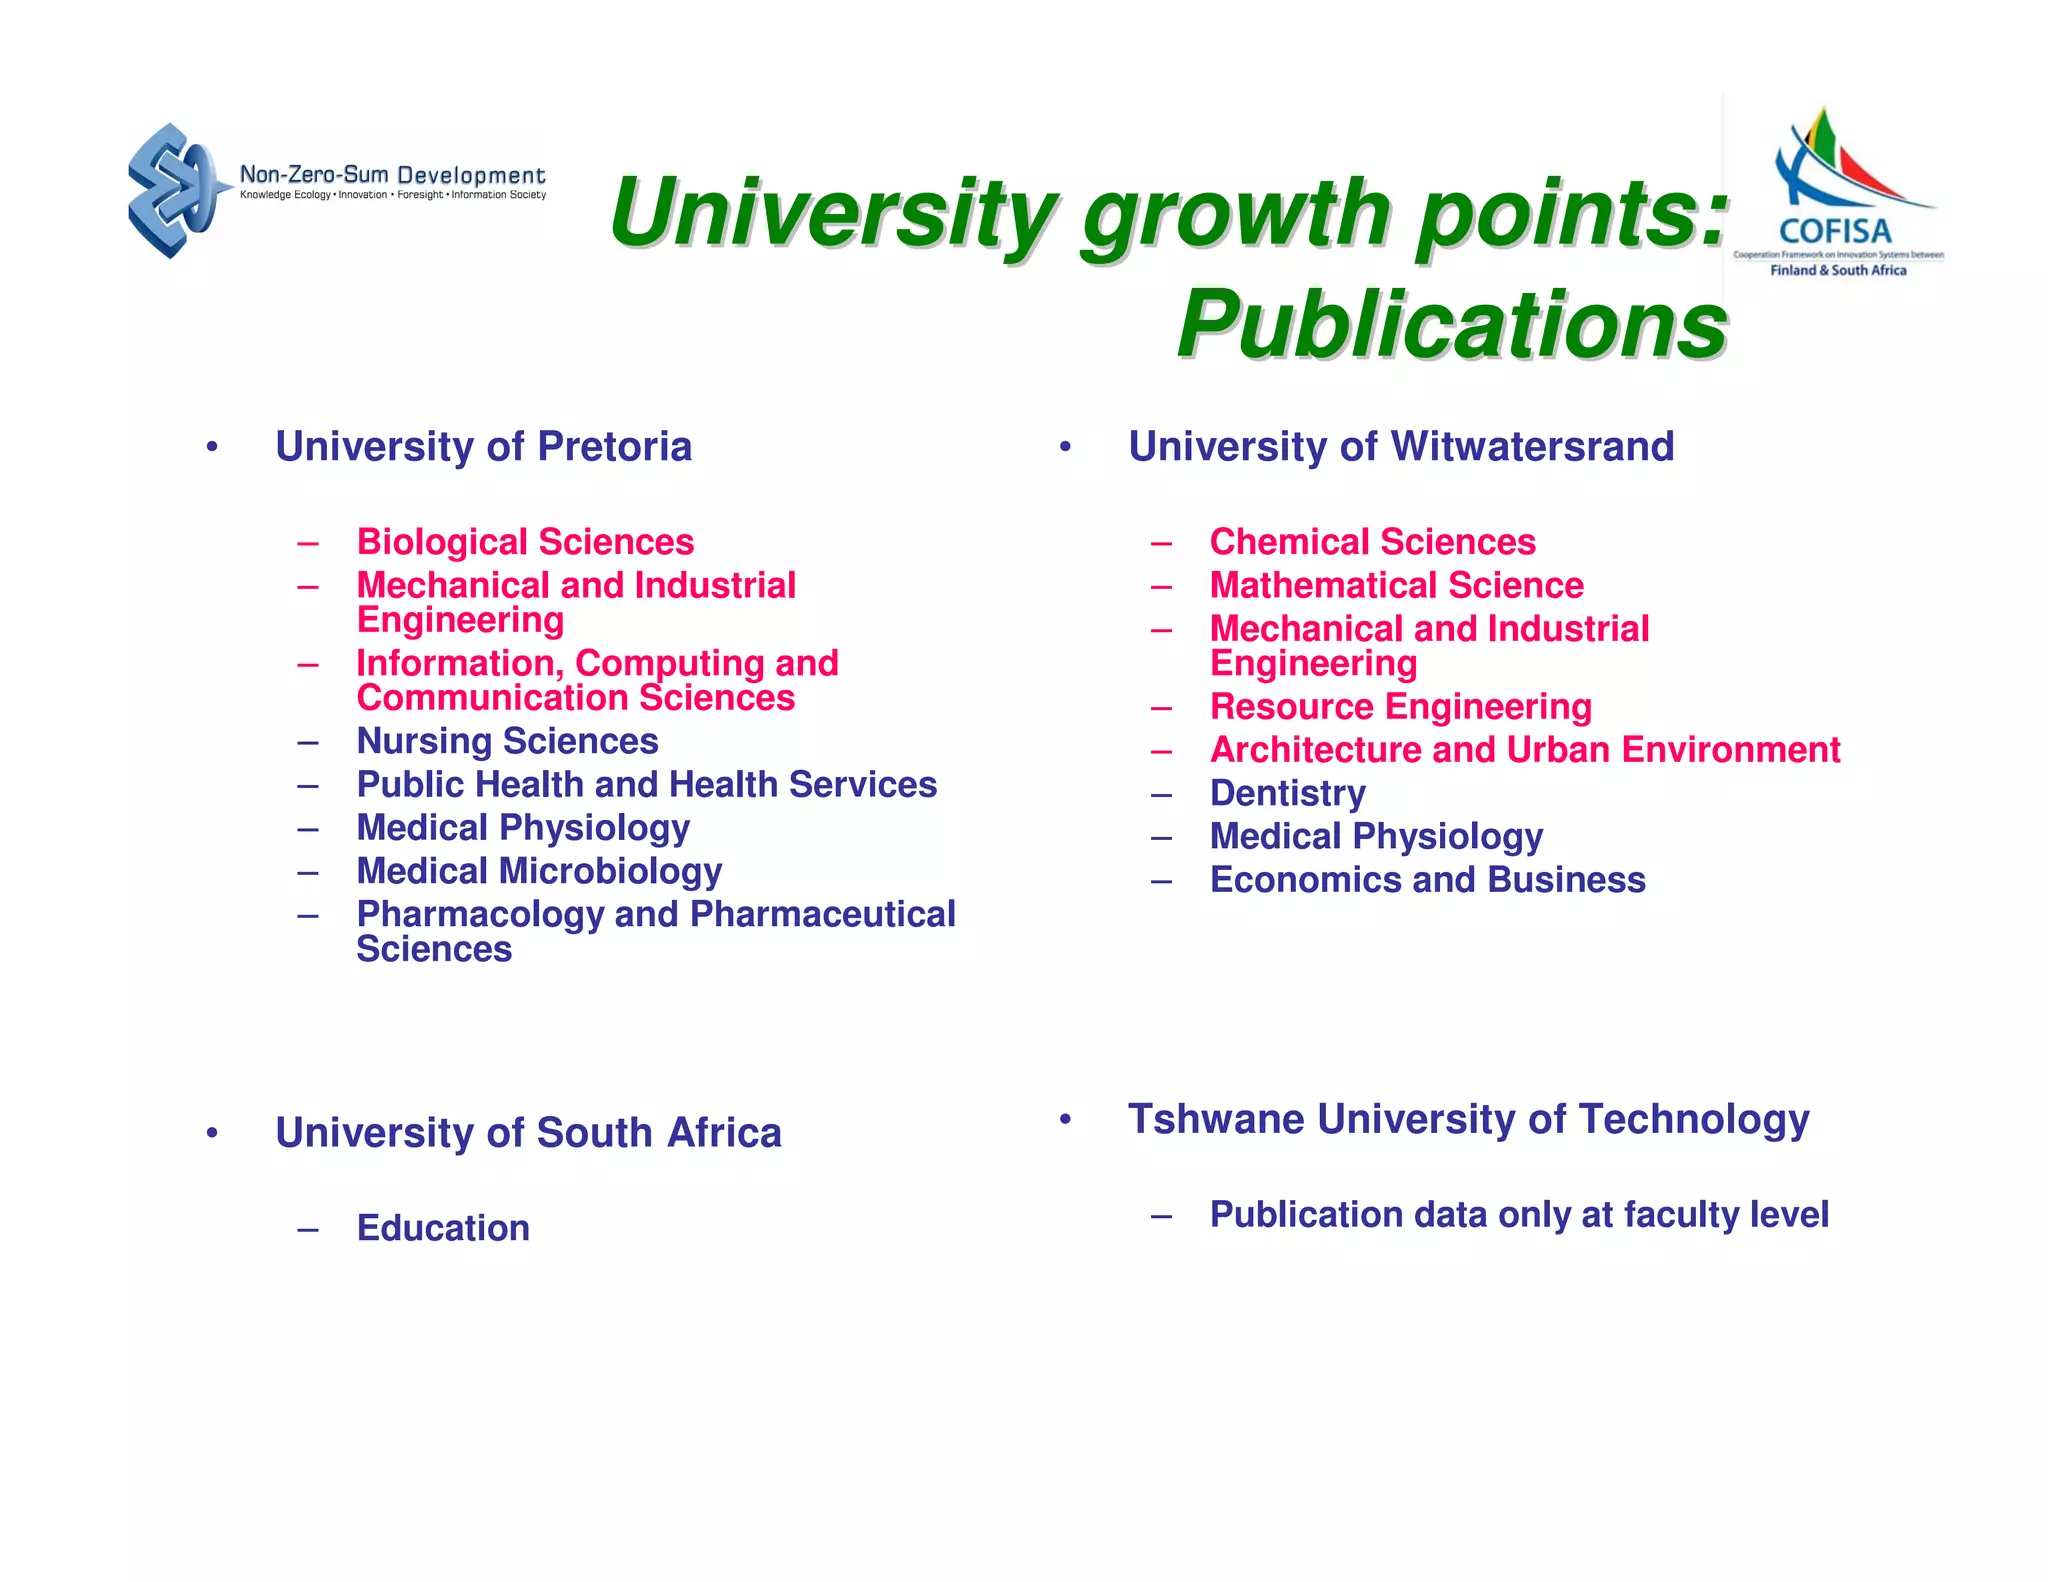
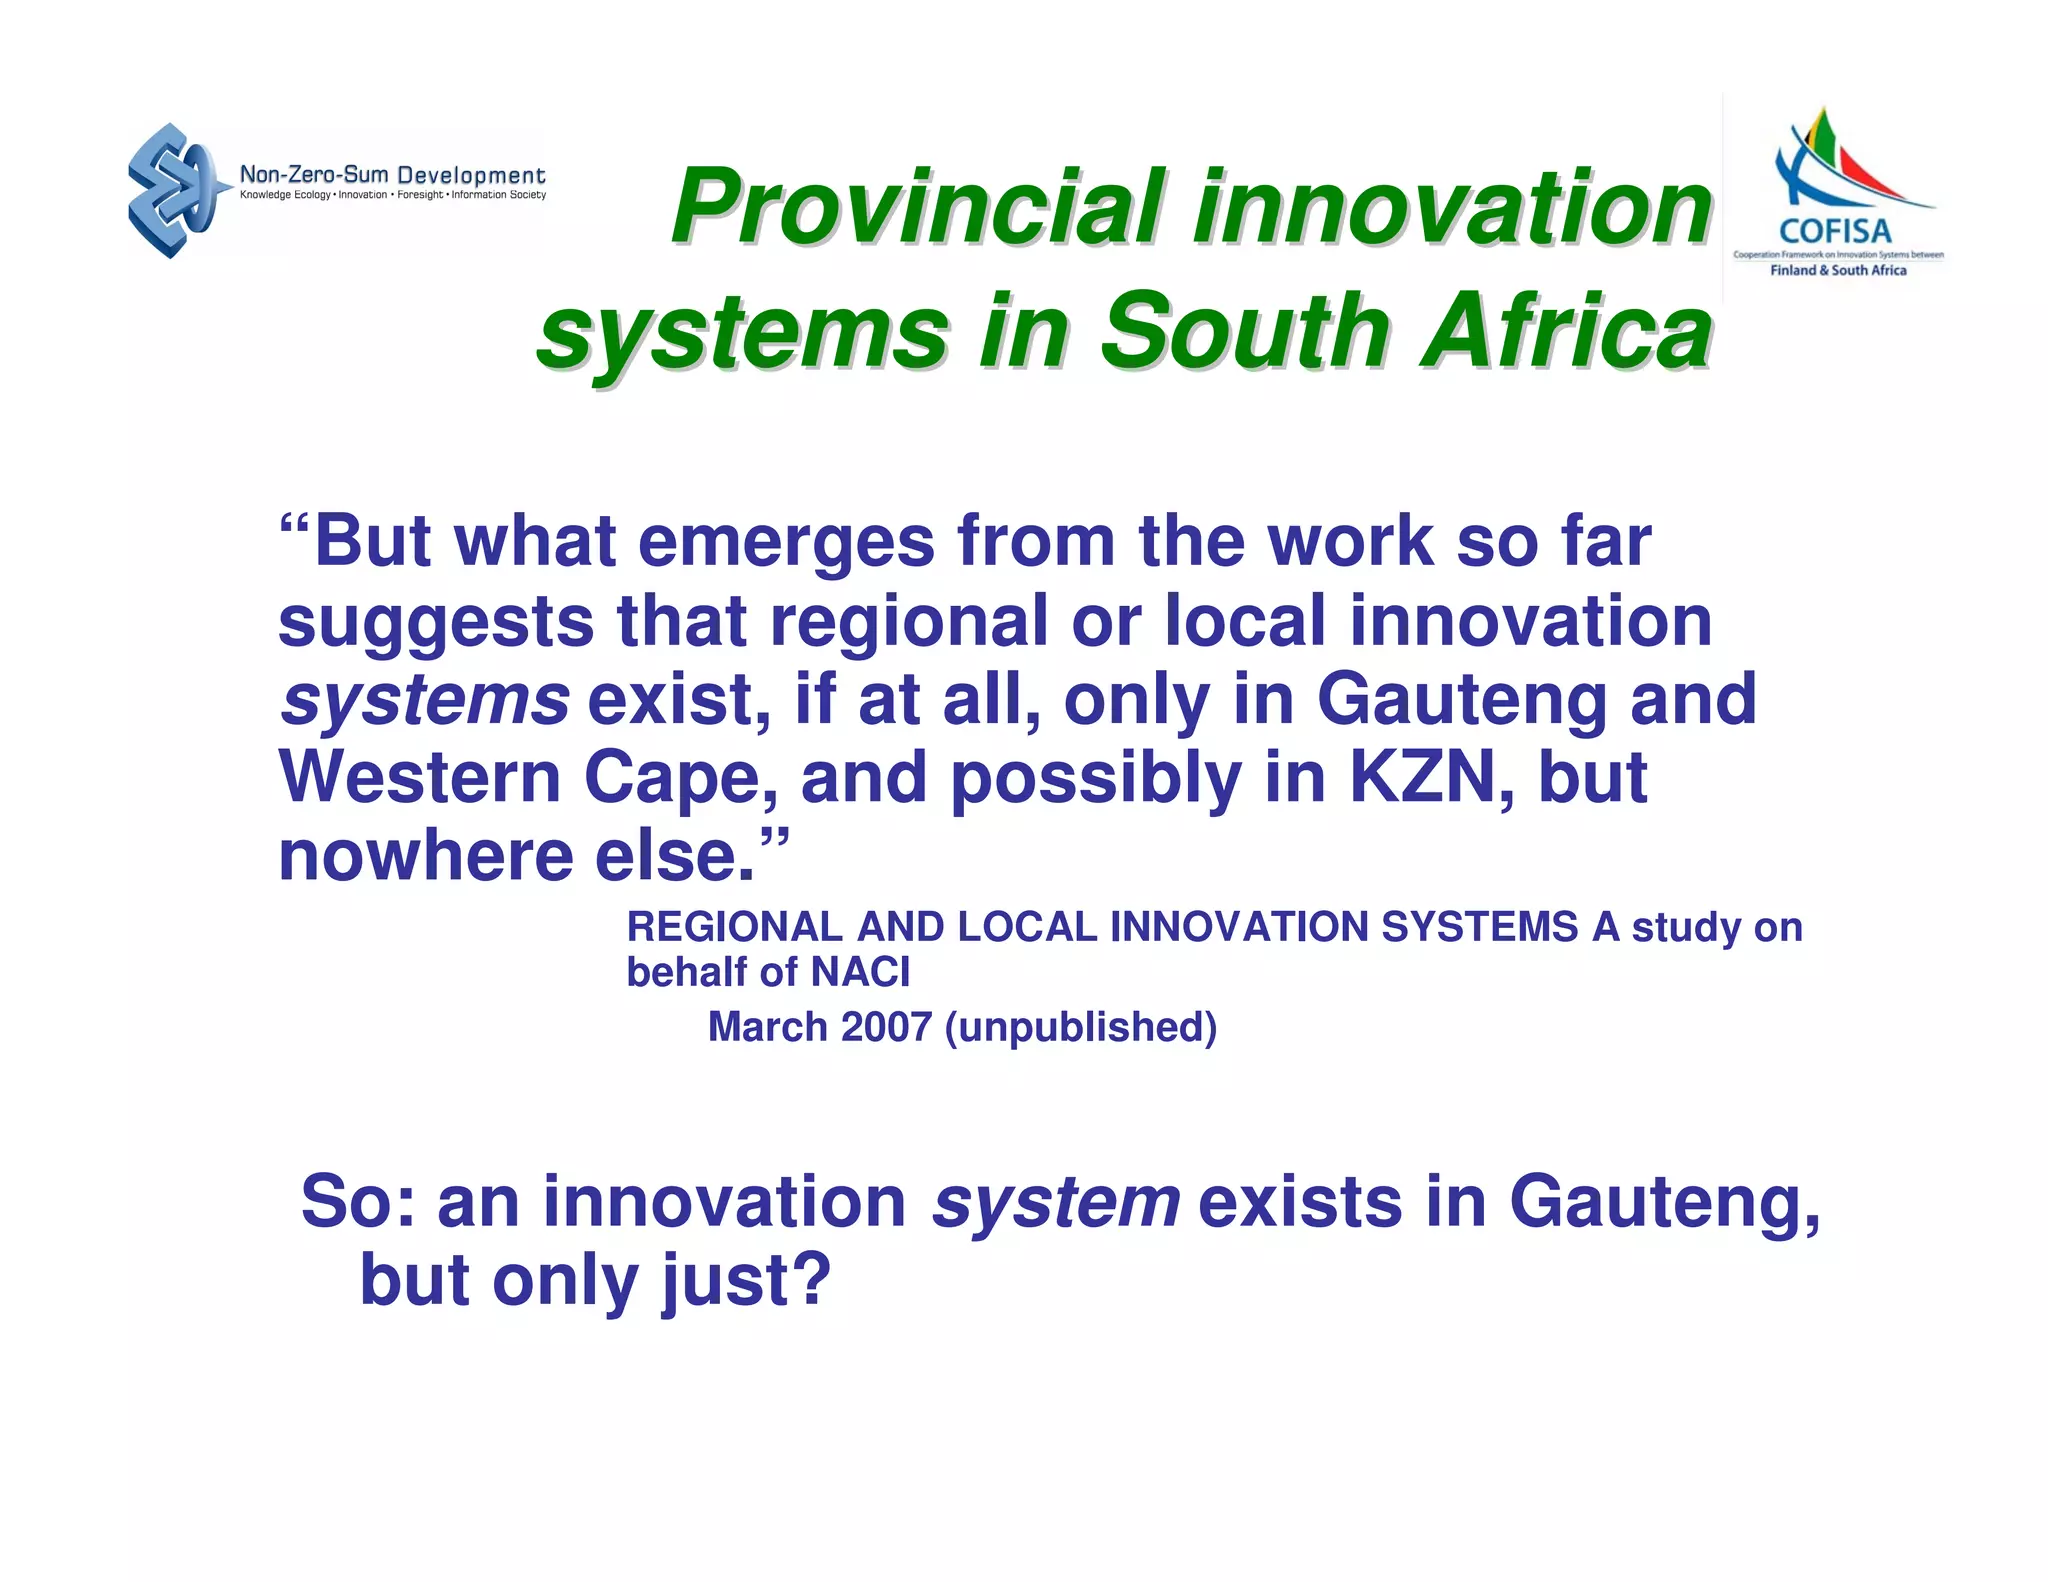
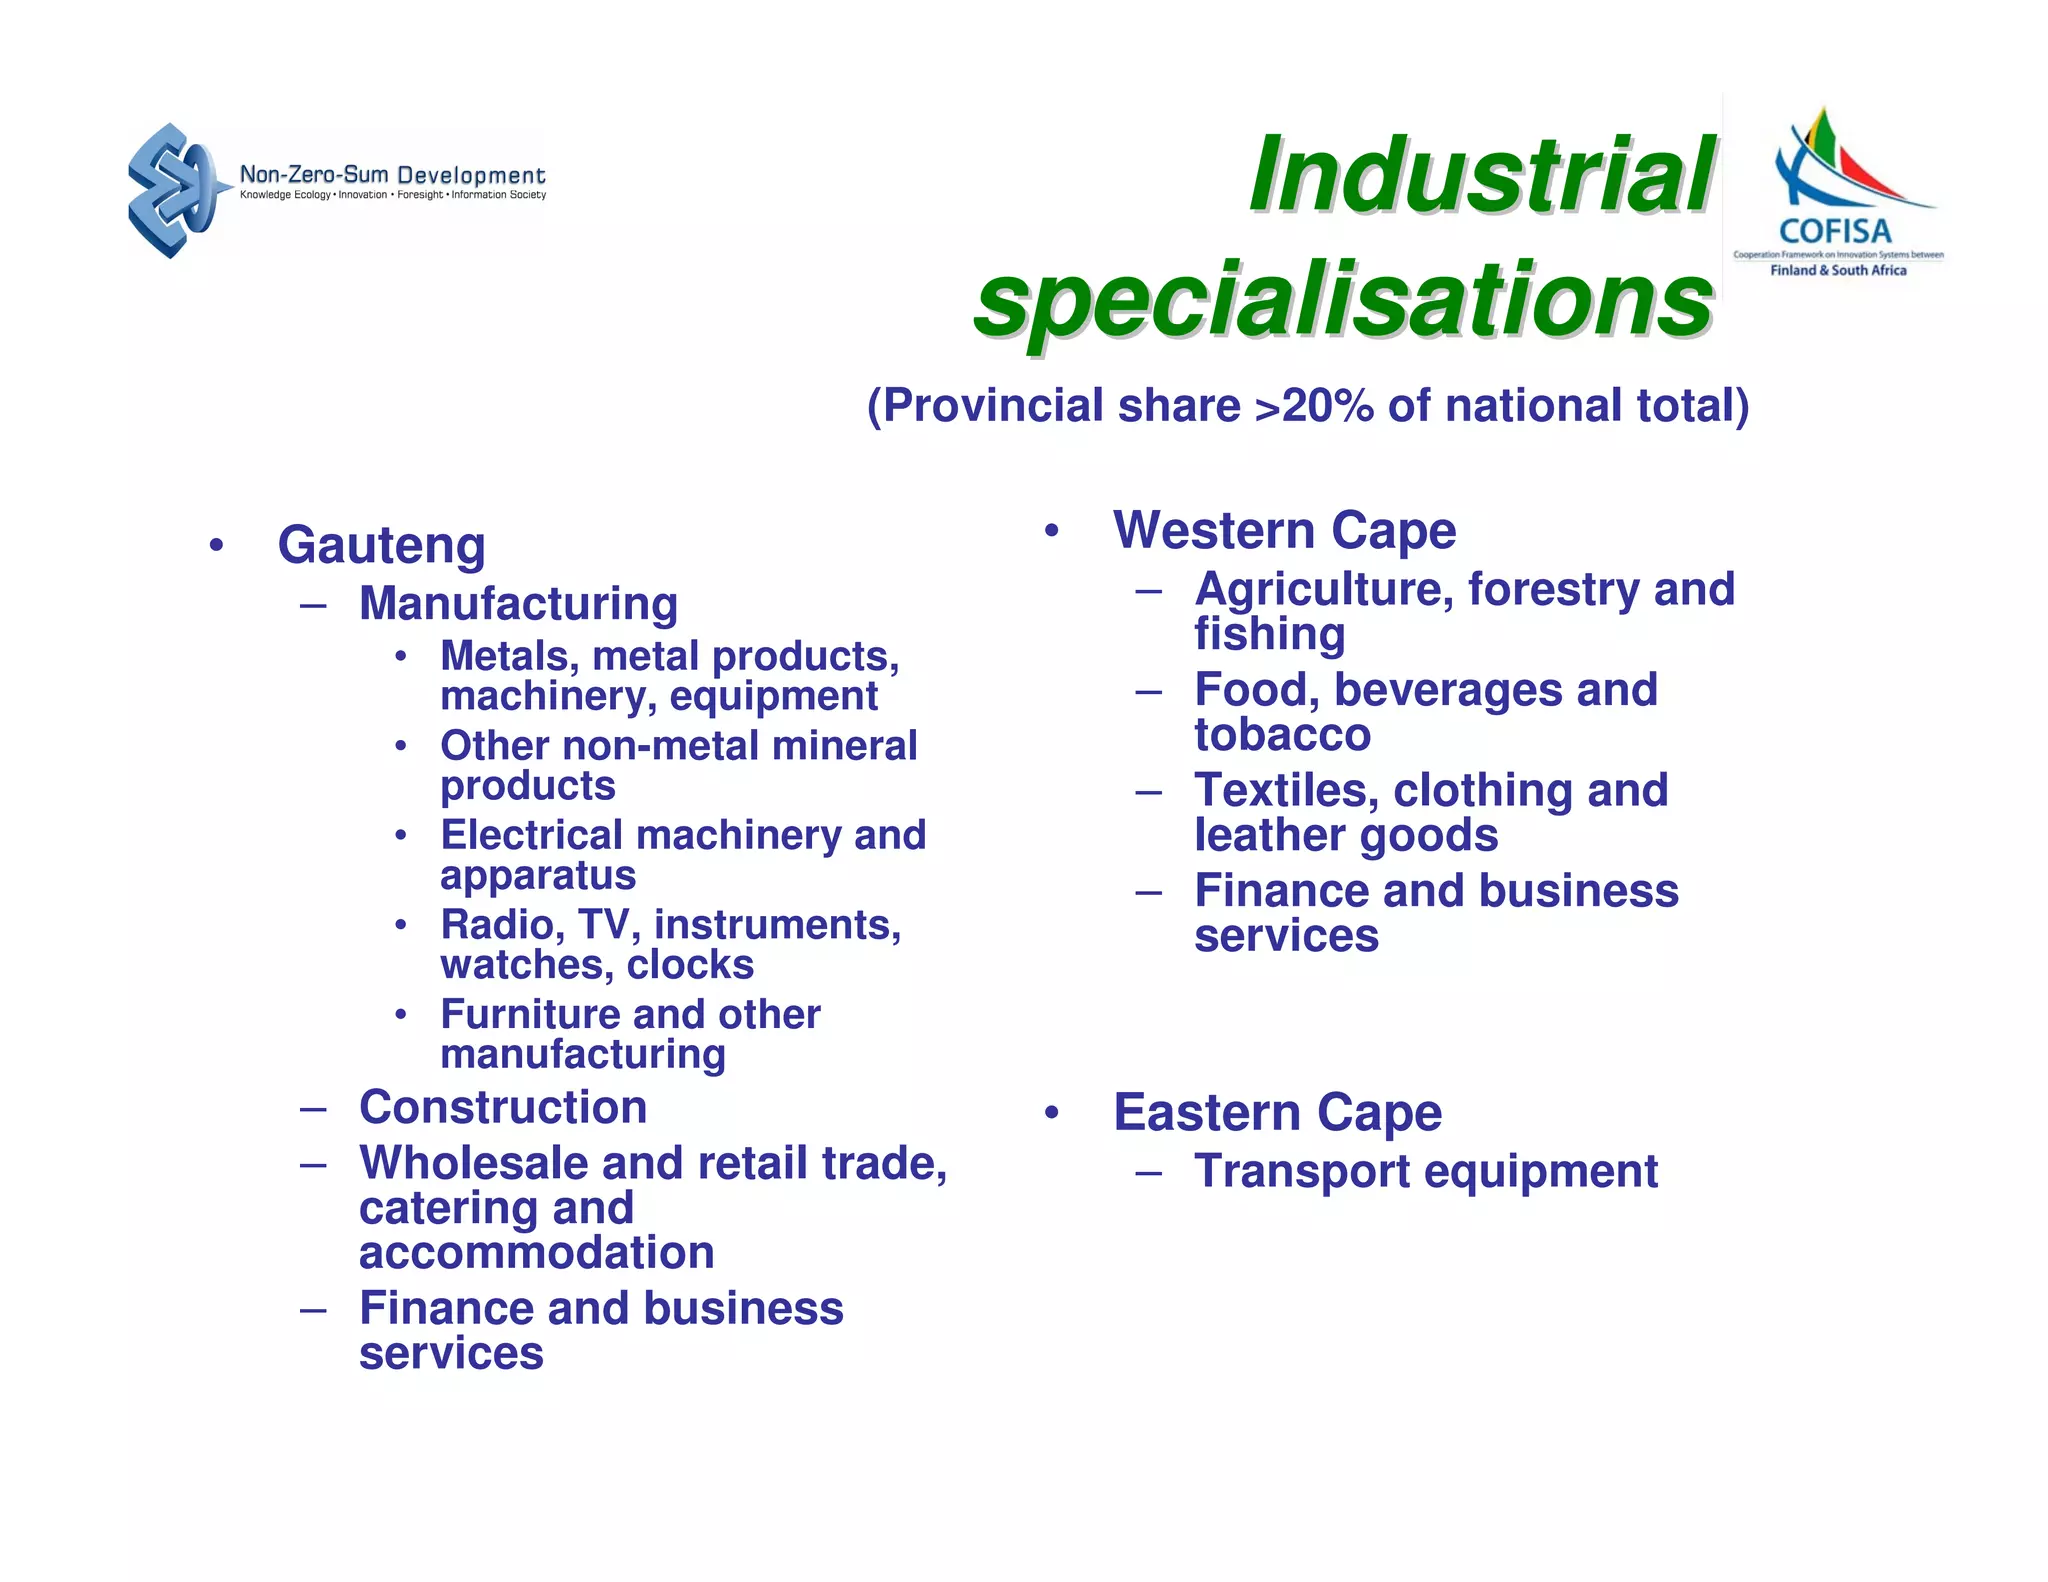
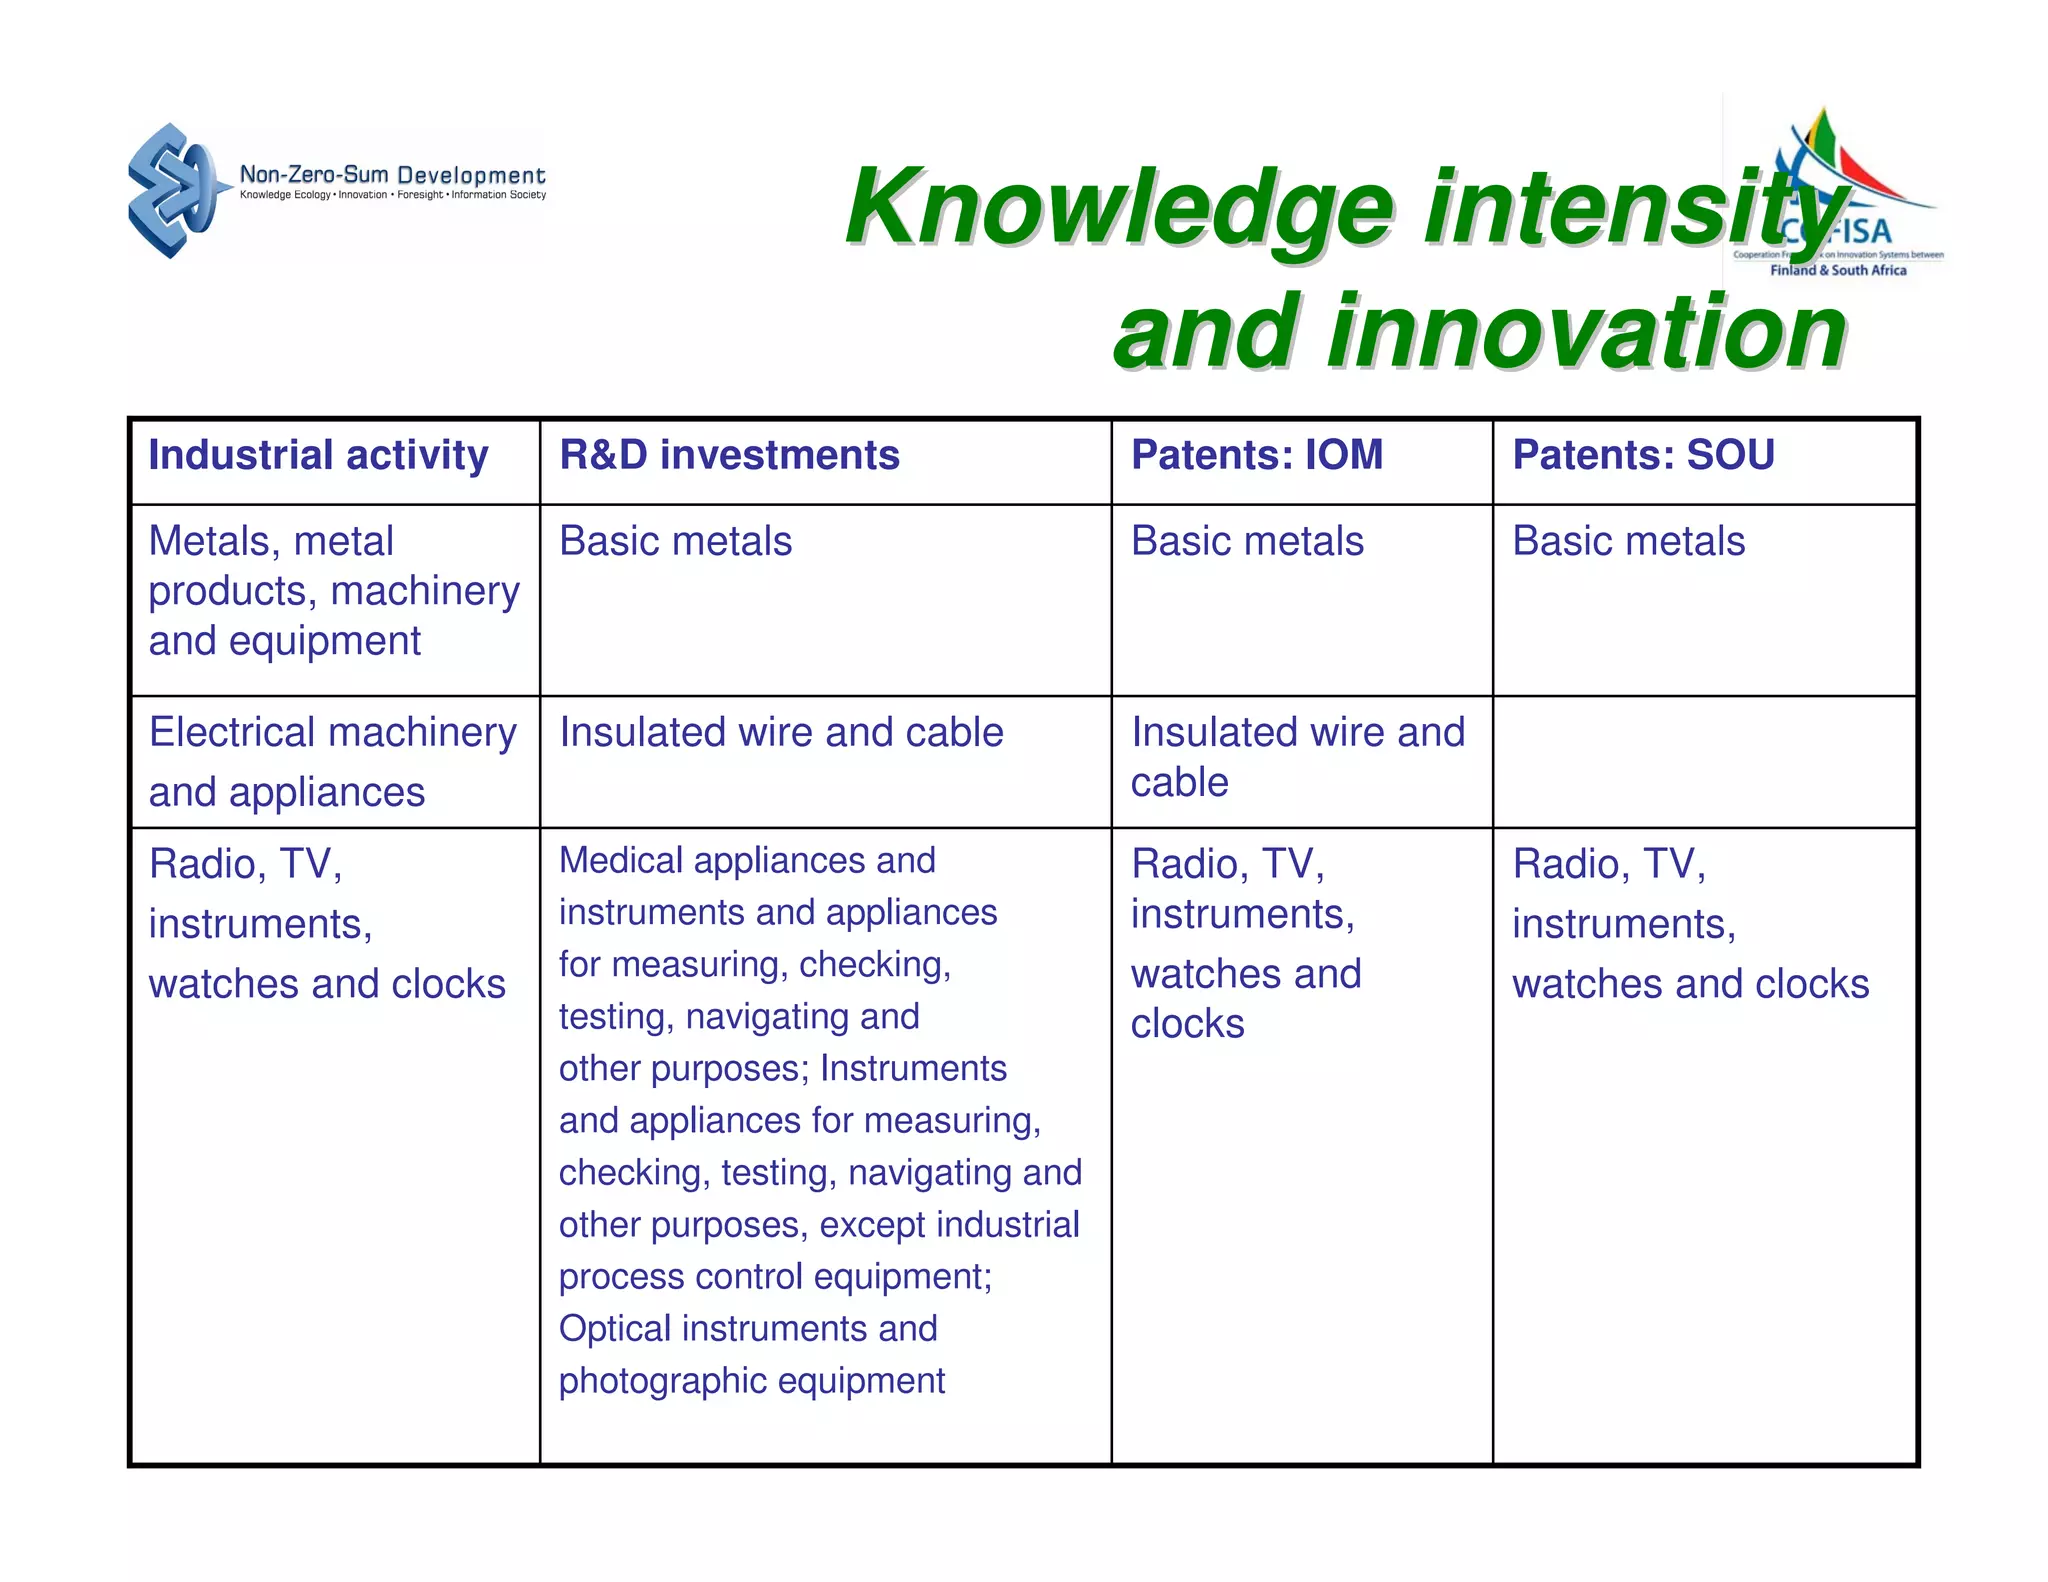
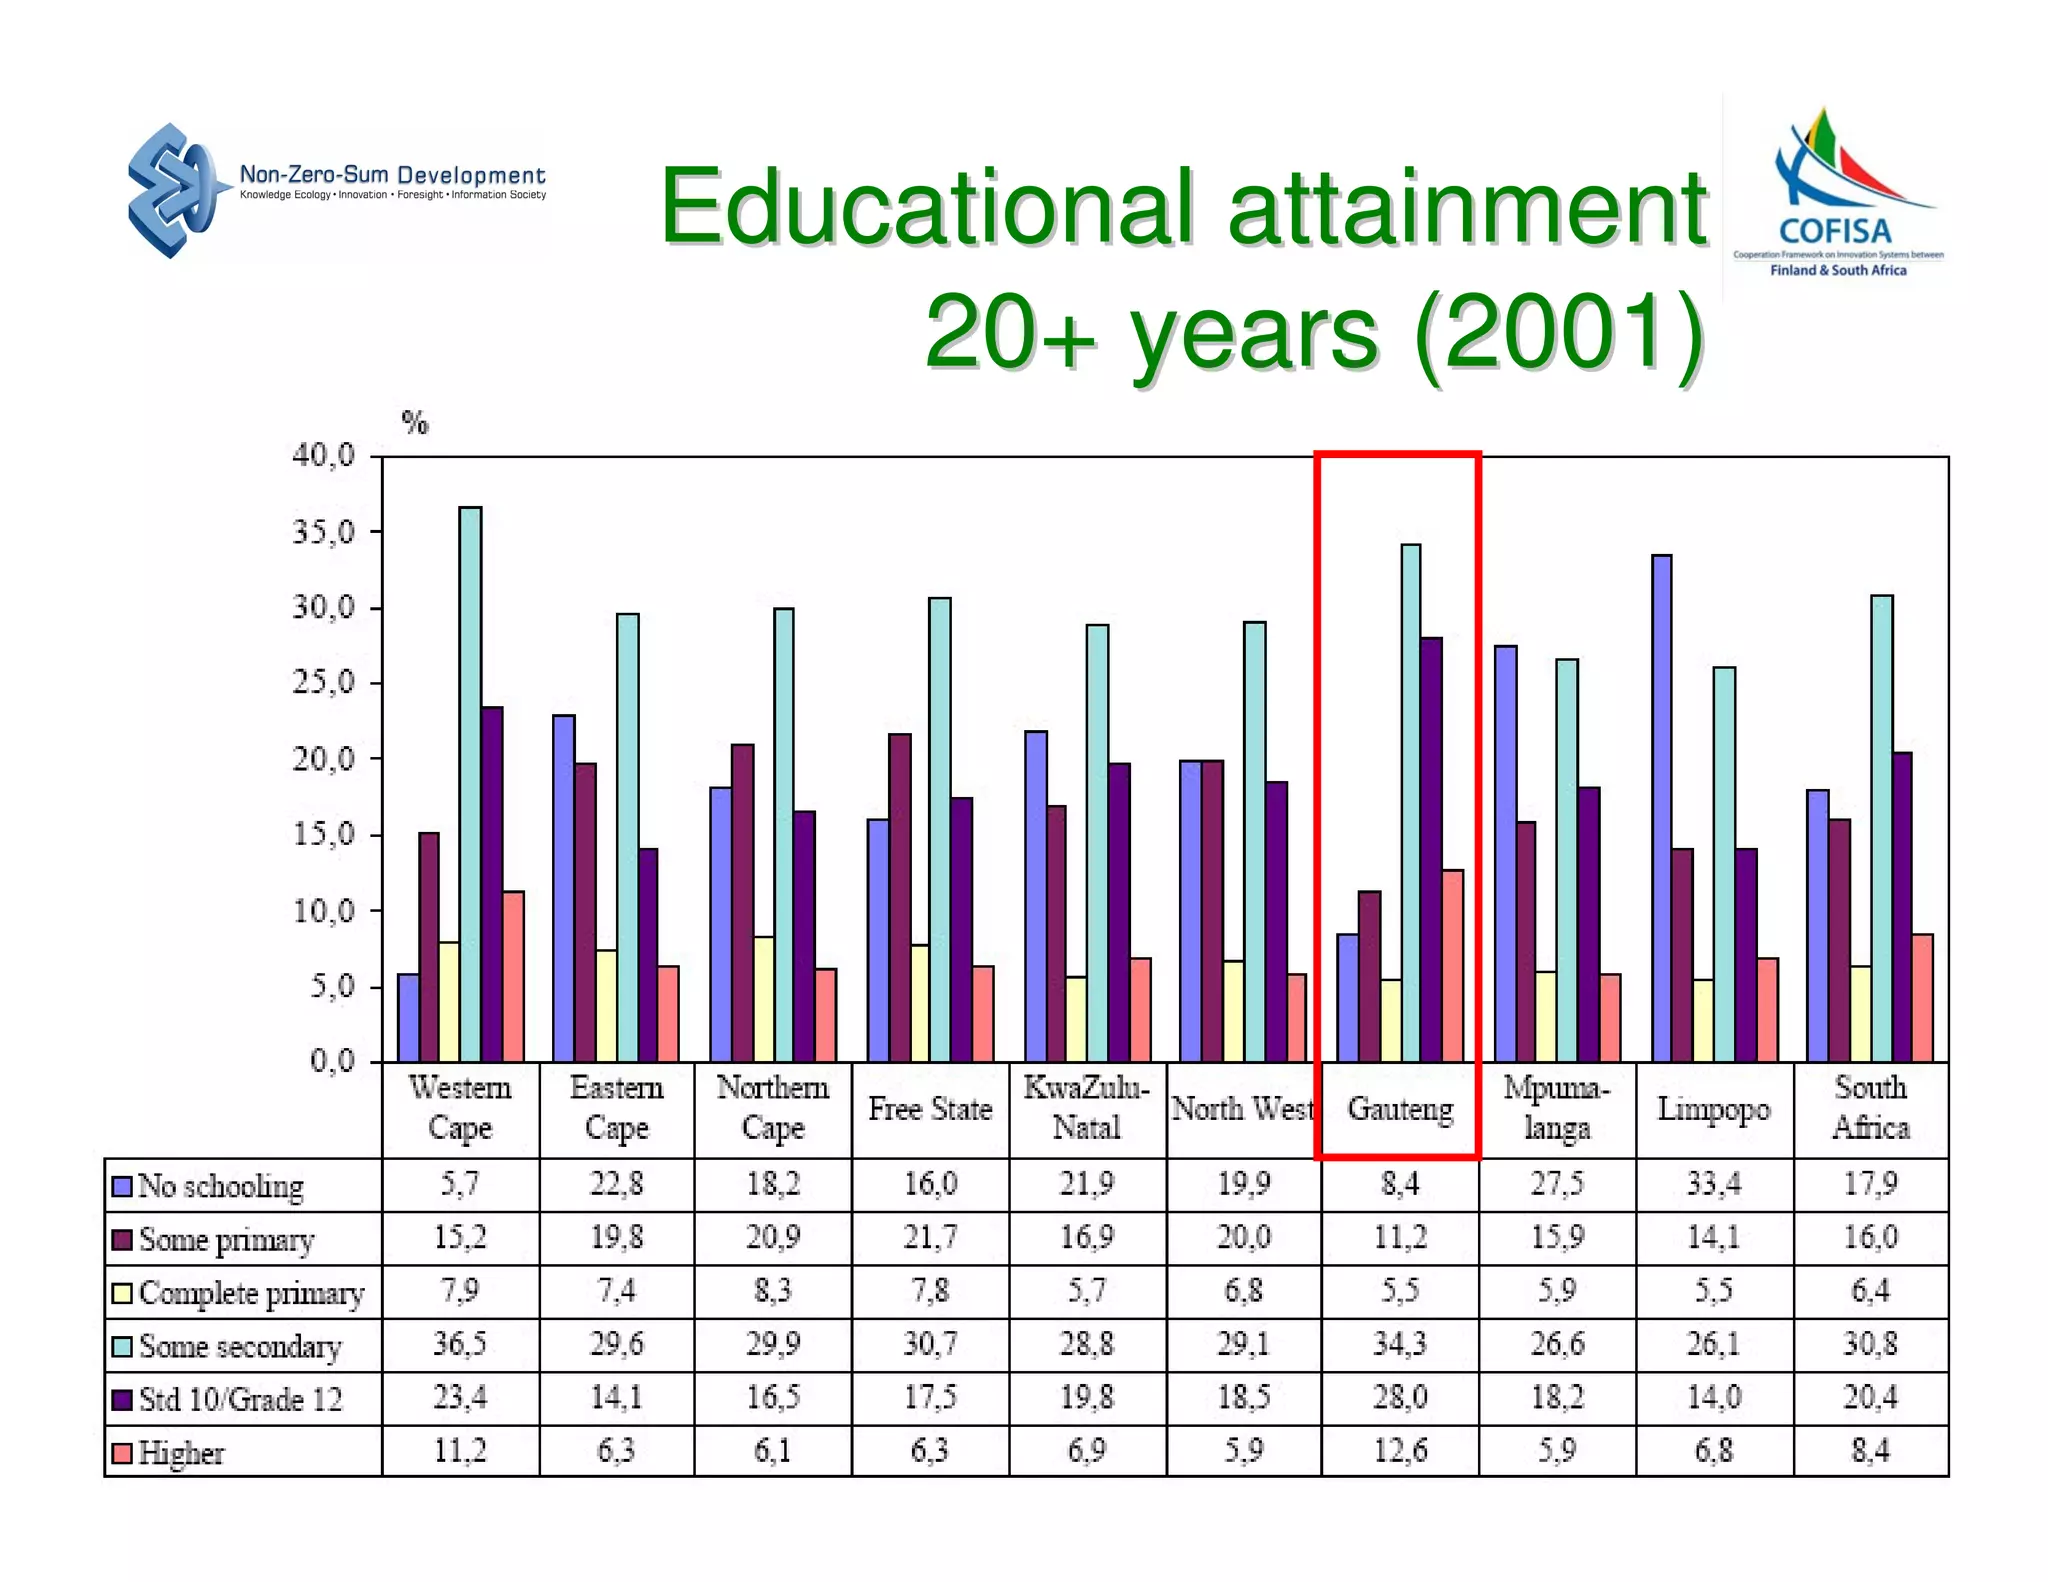
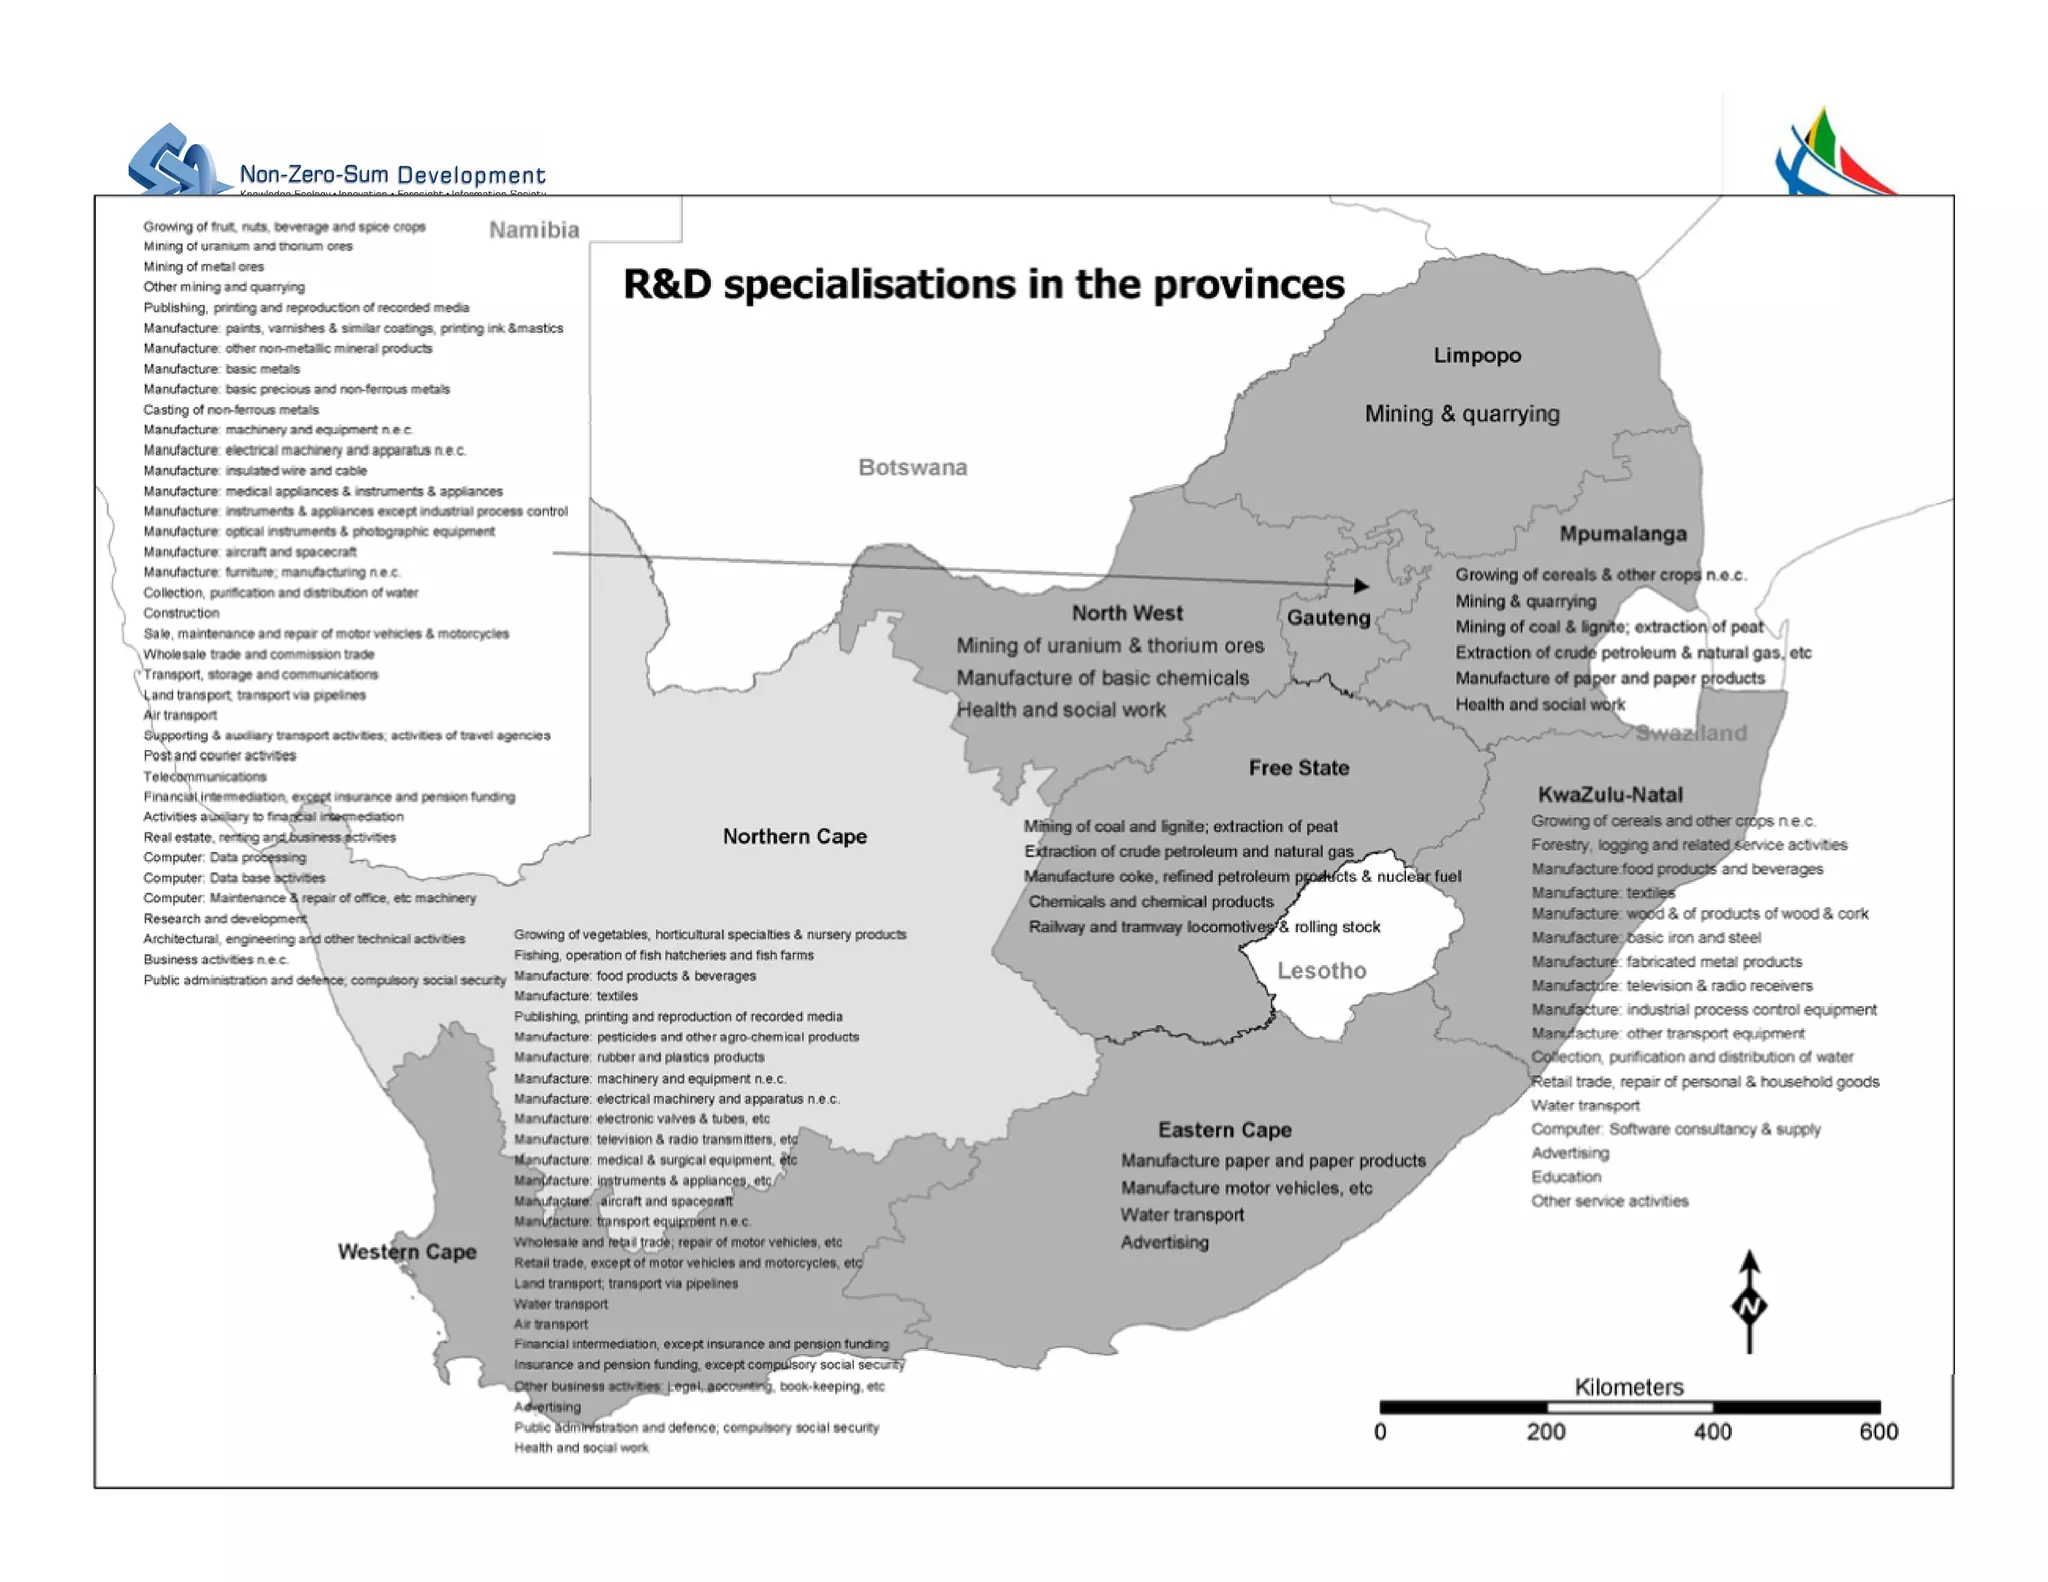
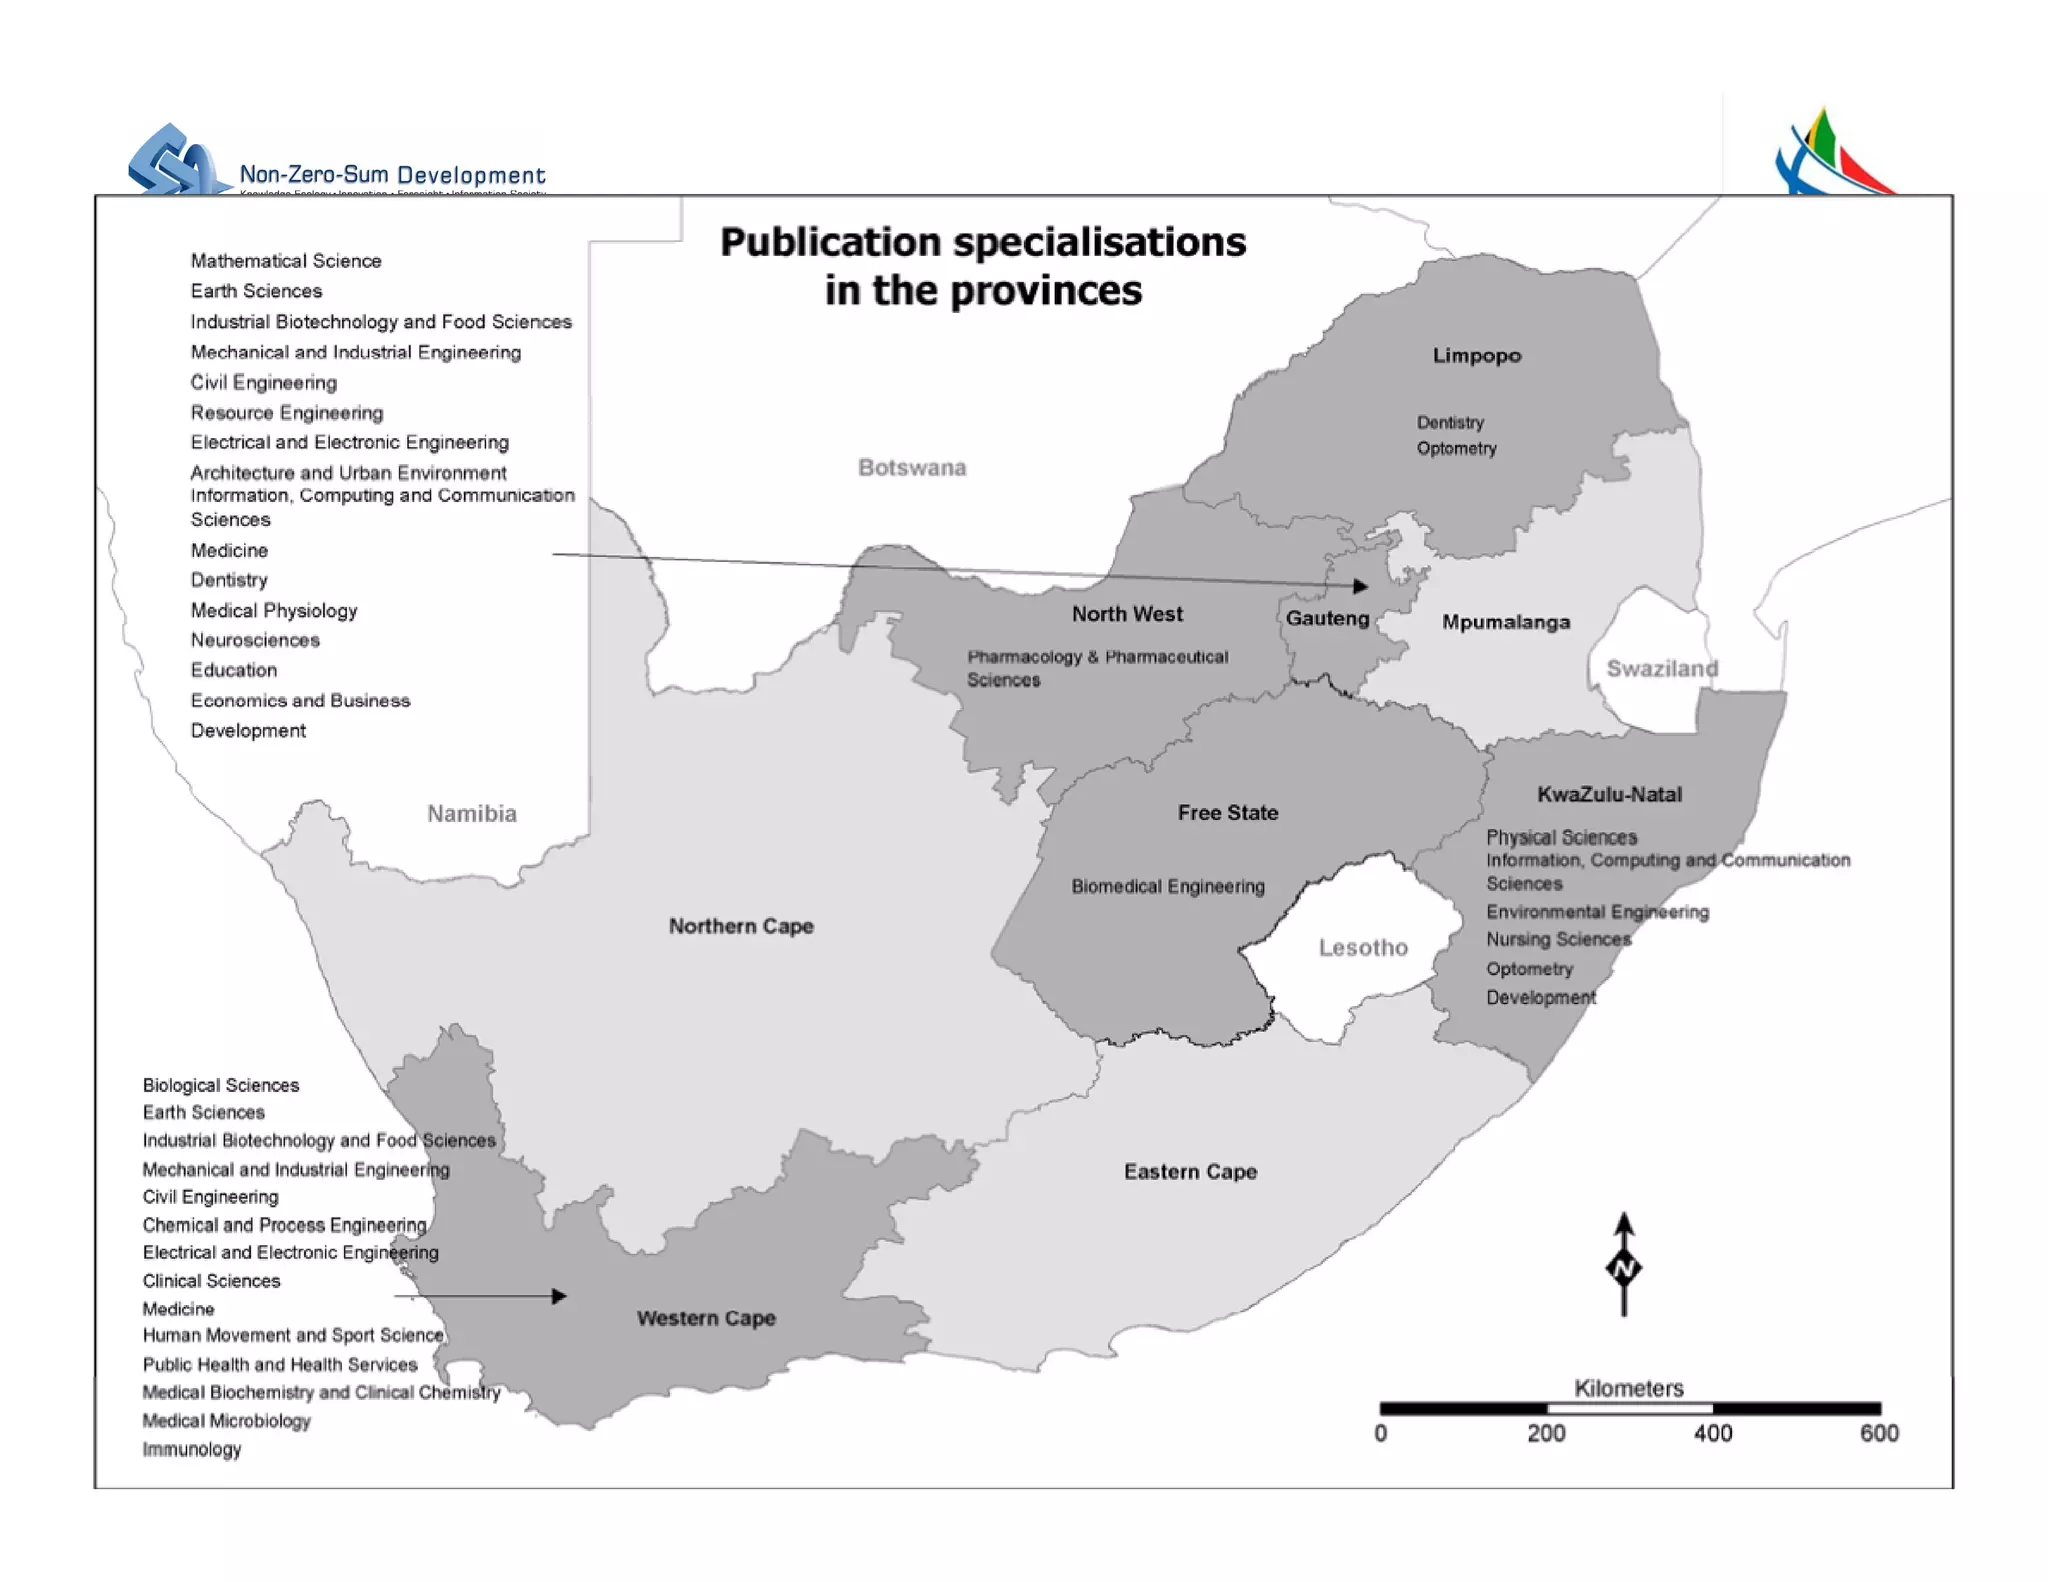
3) Gauteng has strengths in manufacturing, services, and higher education, but it is unclear how well knowledge and innovation link to addressing poverty and exports.