Download to read offline


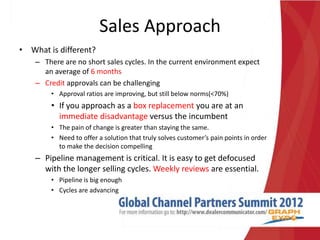
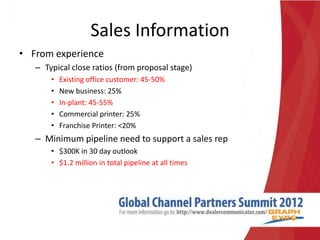
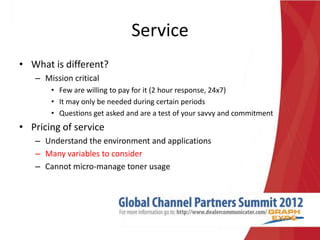


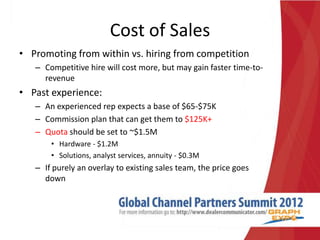

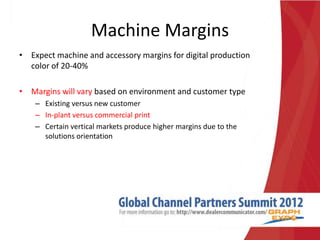
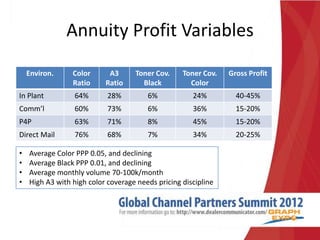
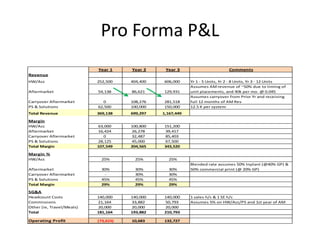


The document discusses the differences between selling digital production equipment to commercial printers versus office customers. It covers topics like buyer motives, solutions, sales approaches, service models, and business models. Specifically, it notes that commercial printer buyers are focused on increasing volume and profits, need reliable mission-critical equipment, and have longer sales cycles. The business model section discusses factors like cost of sales, machine margins around 20-40%, and the variables that impact annuity profit margins, such as environment, color ratio, and toner coverage levels. It includes a sample pro forma P&L projecting revenue, margins, expenses, and operating profit over three years.


![The Future of the Channel [Global Channel Partners Summit]](https://cdn.slidesharecdn.com/ss_thumbnails/no-7globalchannelpartnerssummit2012-121012143410-phpapp02-thumbnail.jpg?width=640&height=640&fit=bounds)
![Channel Success: Is Your Organization Ready? [Global Channel Partners Summit]](https://cdn.slidesharecdn.com/ss_thumbnails/no-6channelsgraphpresov5-121012143148-phpapp02-thumbnail.jpg?width=640&height=640&fit=bounds)
![Wide Format Printers: A Hidden Profit Pool [Global Channel Partners Summit]](https://cdn.slidesharecdn.com/ss_thumbnails/no-4graphexpo-wideformatdealerpresentation-121012143035-phpapp01-thumbnail.jpg?width=640&height=640&fit=bounds)
![The State of the Channel 2012: Does it Matter? [Global Channel Partners Summit]](https://cdn.slidesharecdn.com/ss_thumbnails/no-1drjoechannelevent1007122-121012142517-phpapp01-thumbnail.jpg?width=640&height=640&fit=bounds)
![Business Development to Drive Growth [Global Channel Partners Summit]](https://cdn.slidesharecdn.com/ss_thumbnails/lritarossidealerchannelpresfinal-121012141933-phpapp01-thumbnail.jpg?width=640&height=640&fit=bounds)
![How Social Media Works for the Channel [Global Channel Partners Summit]](https://cdn.slidesharecdn.com/ss_thumbnails/dealercommunicatorthemesocialmediapreso-121012141627-phpapp01-thumbnail.jpg?width=640&height=640&fit=bounds)


