Download as PDF, PPTX
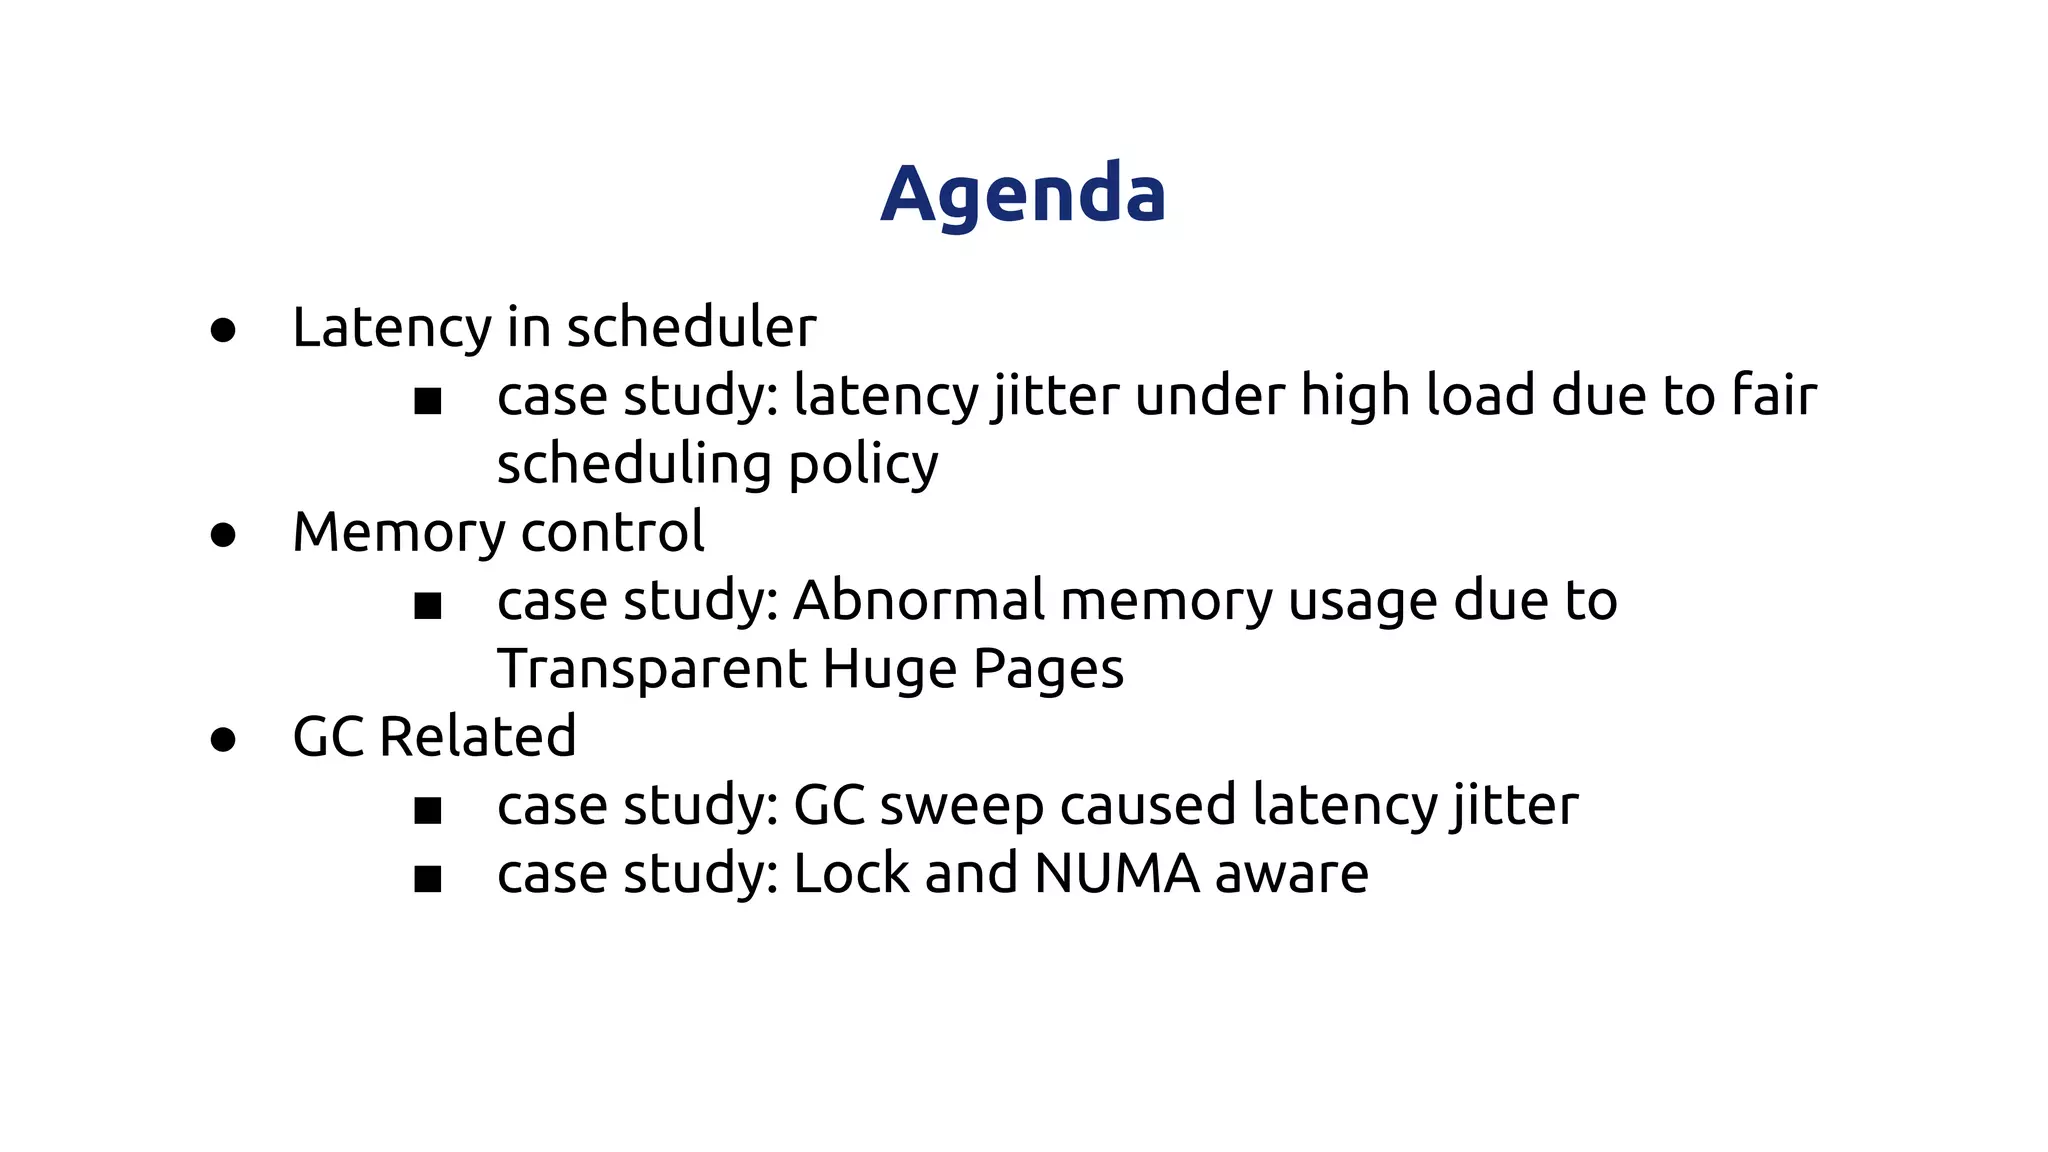
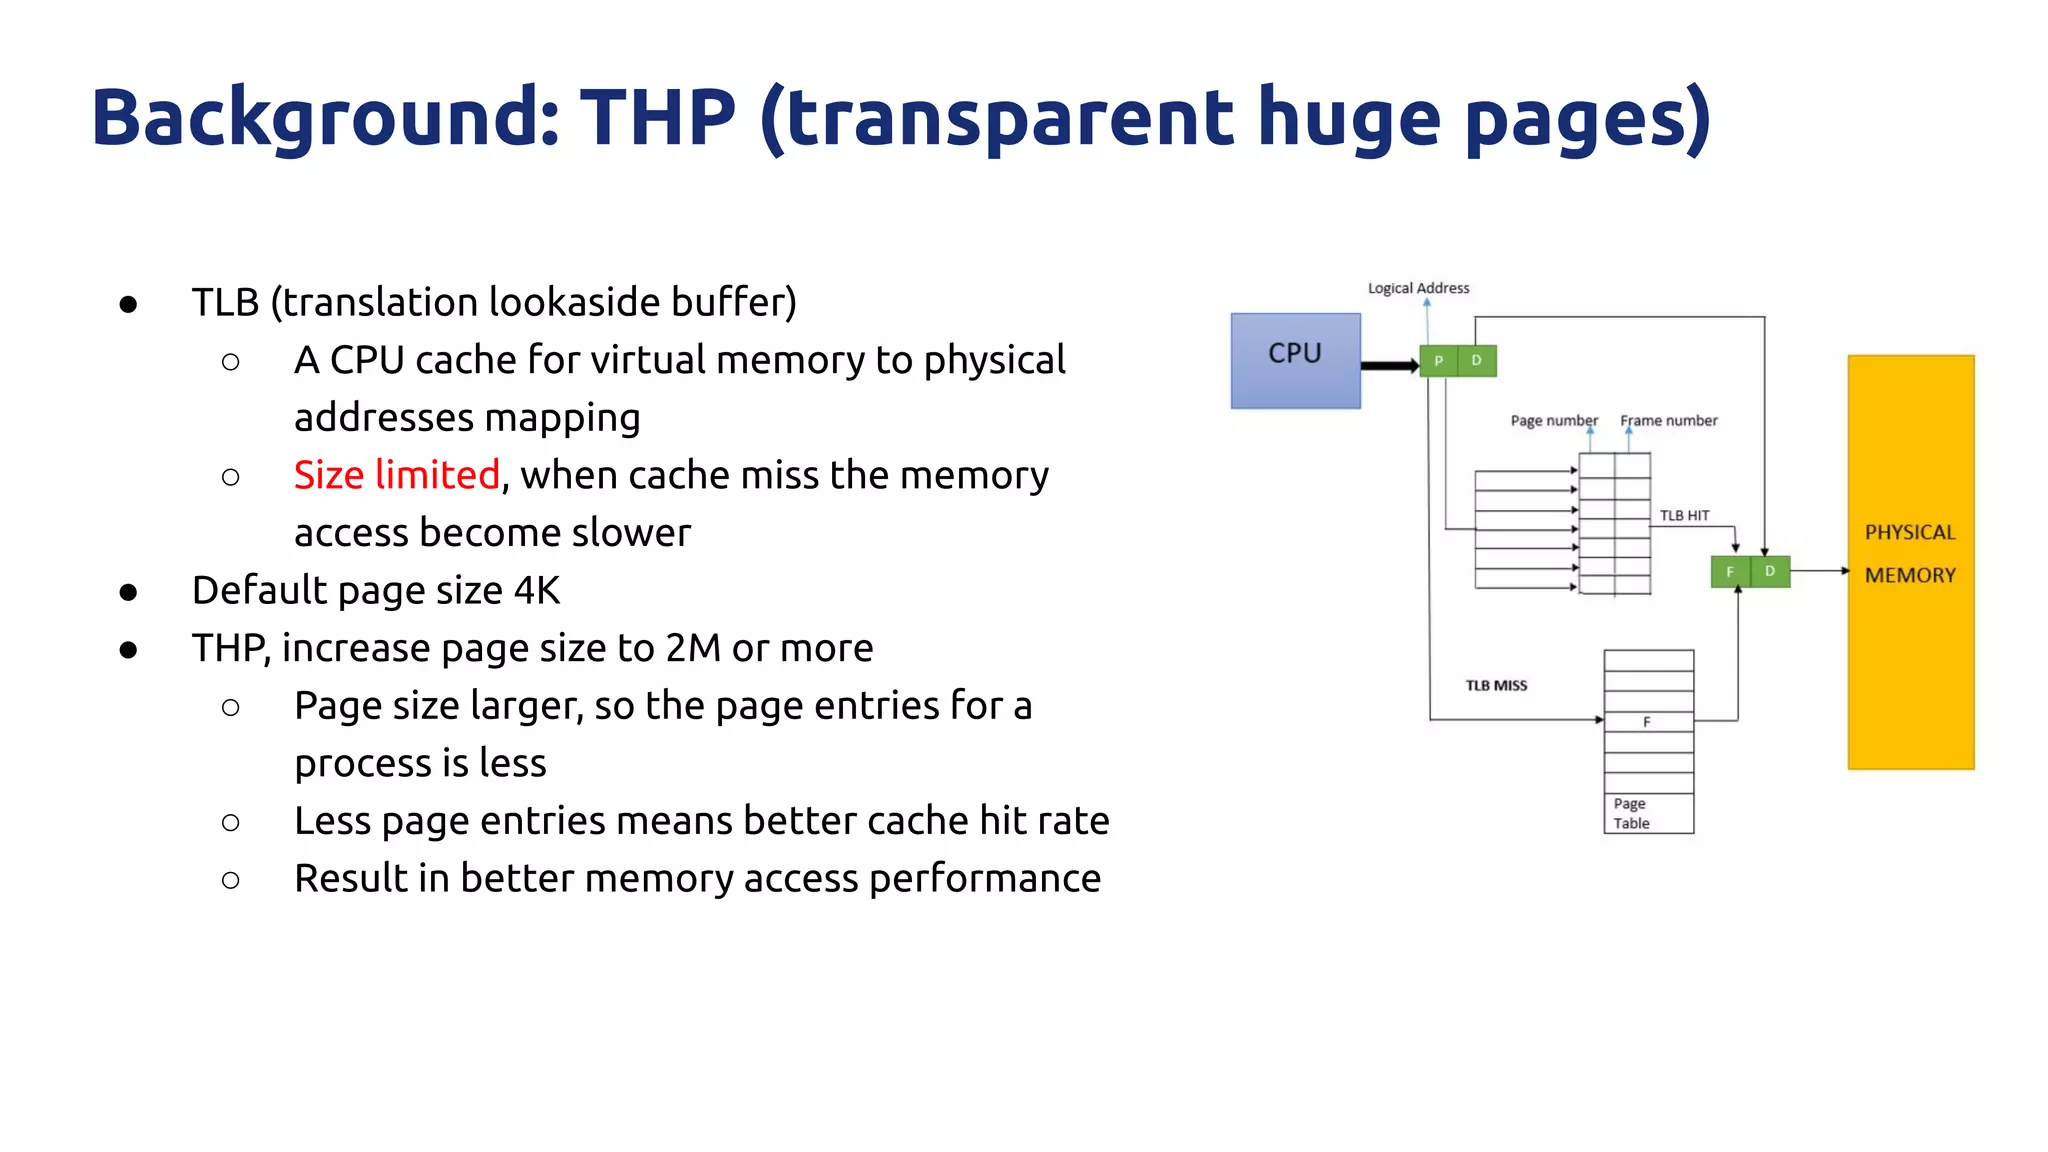
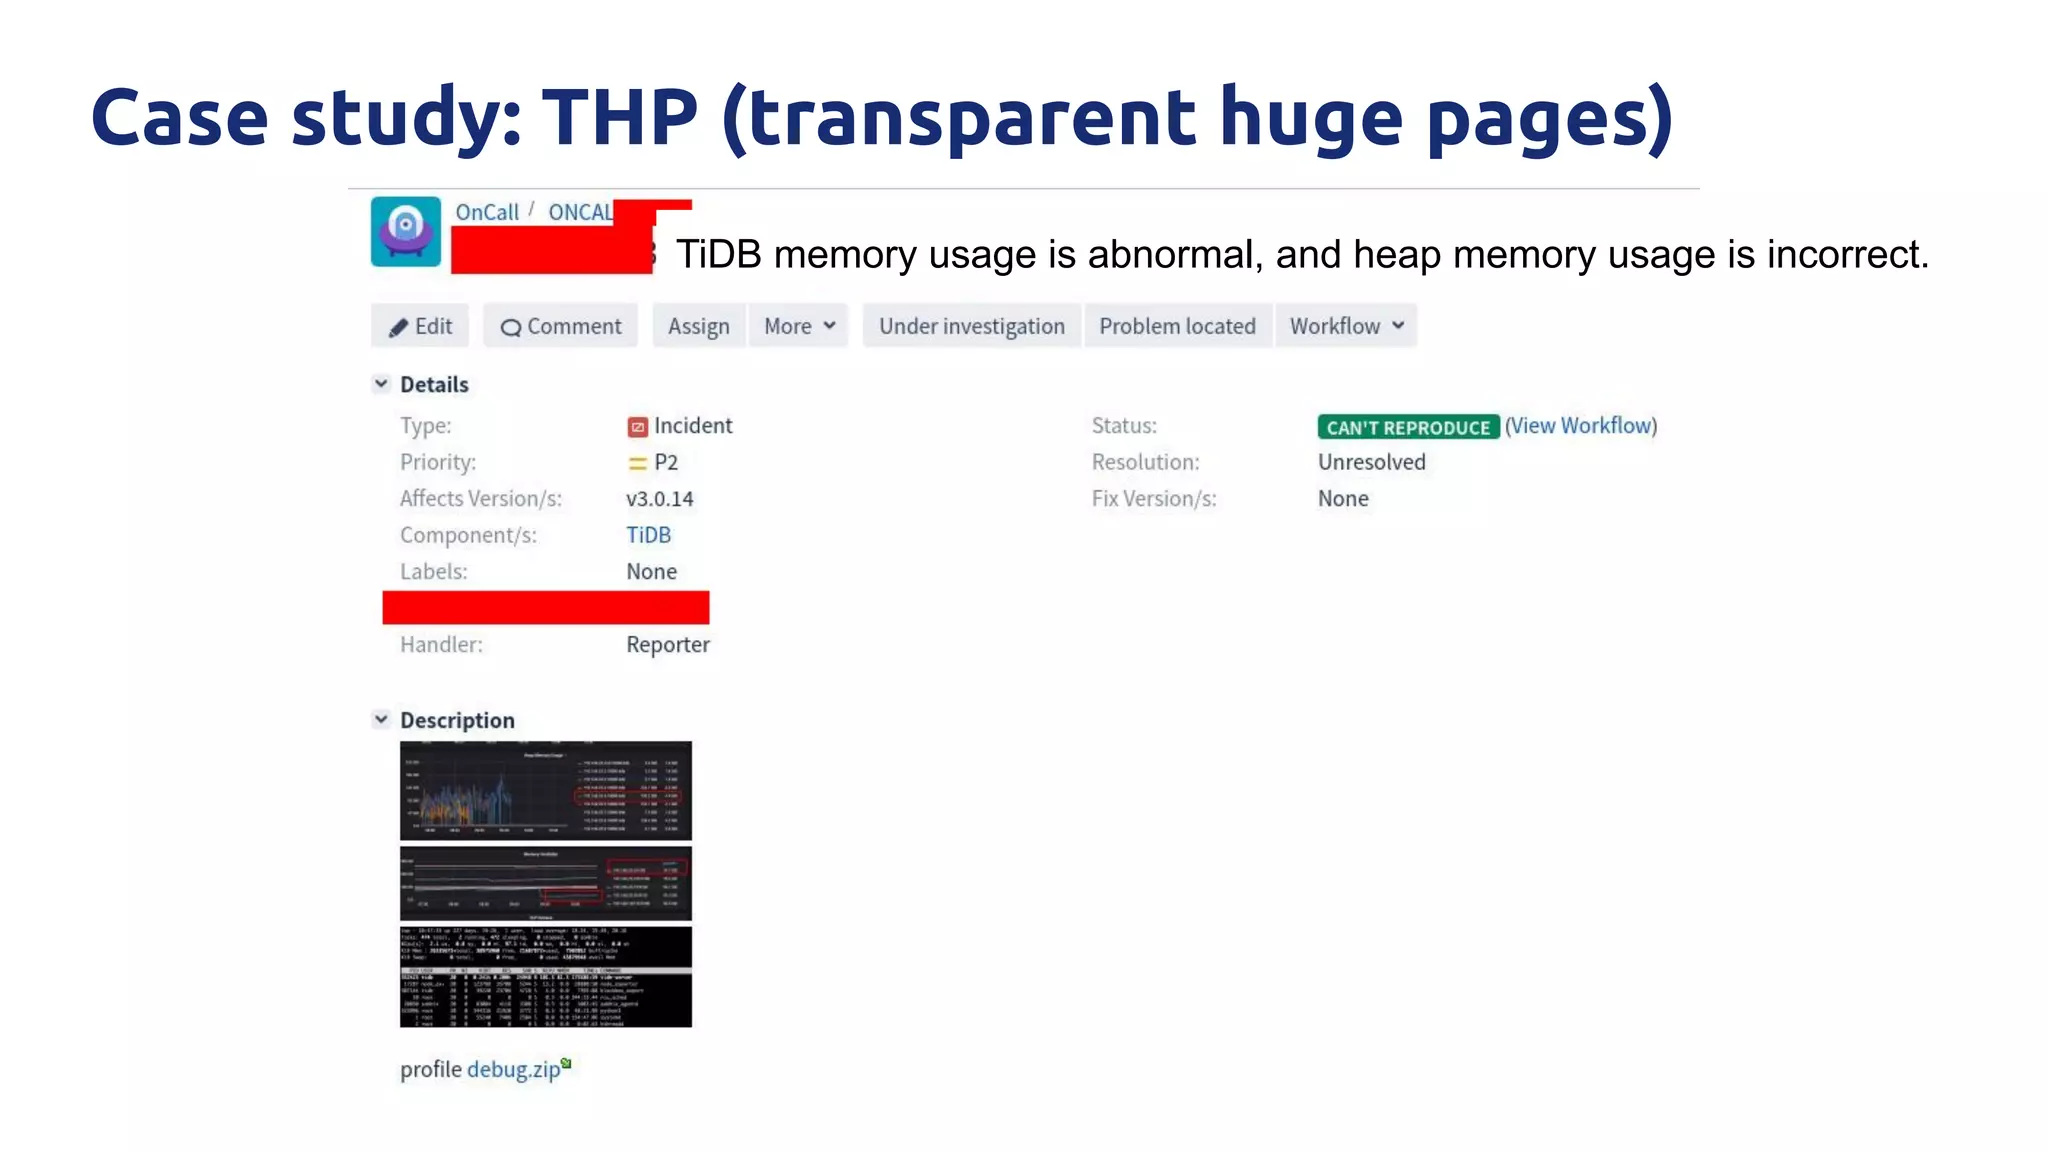
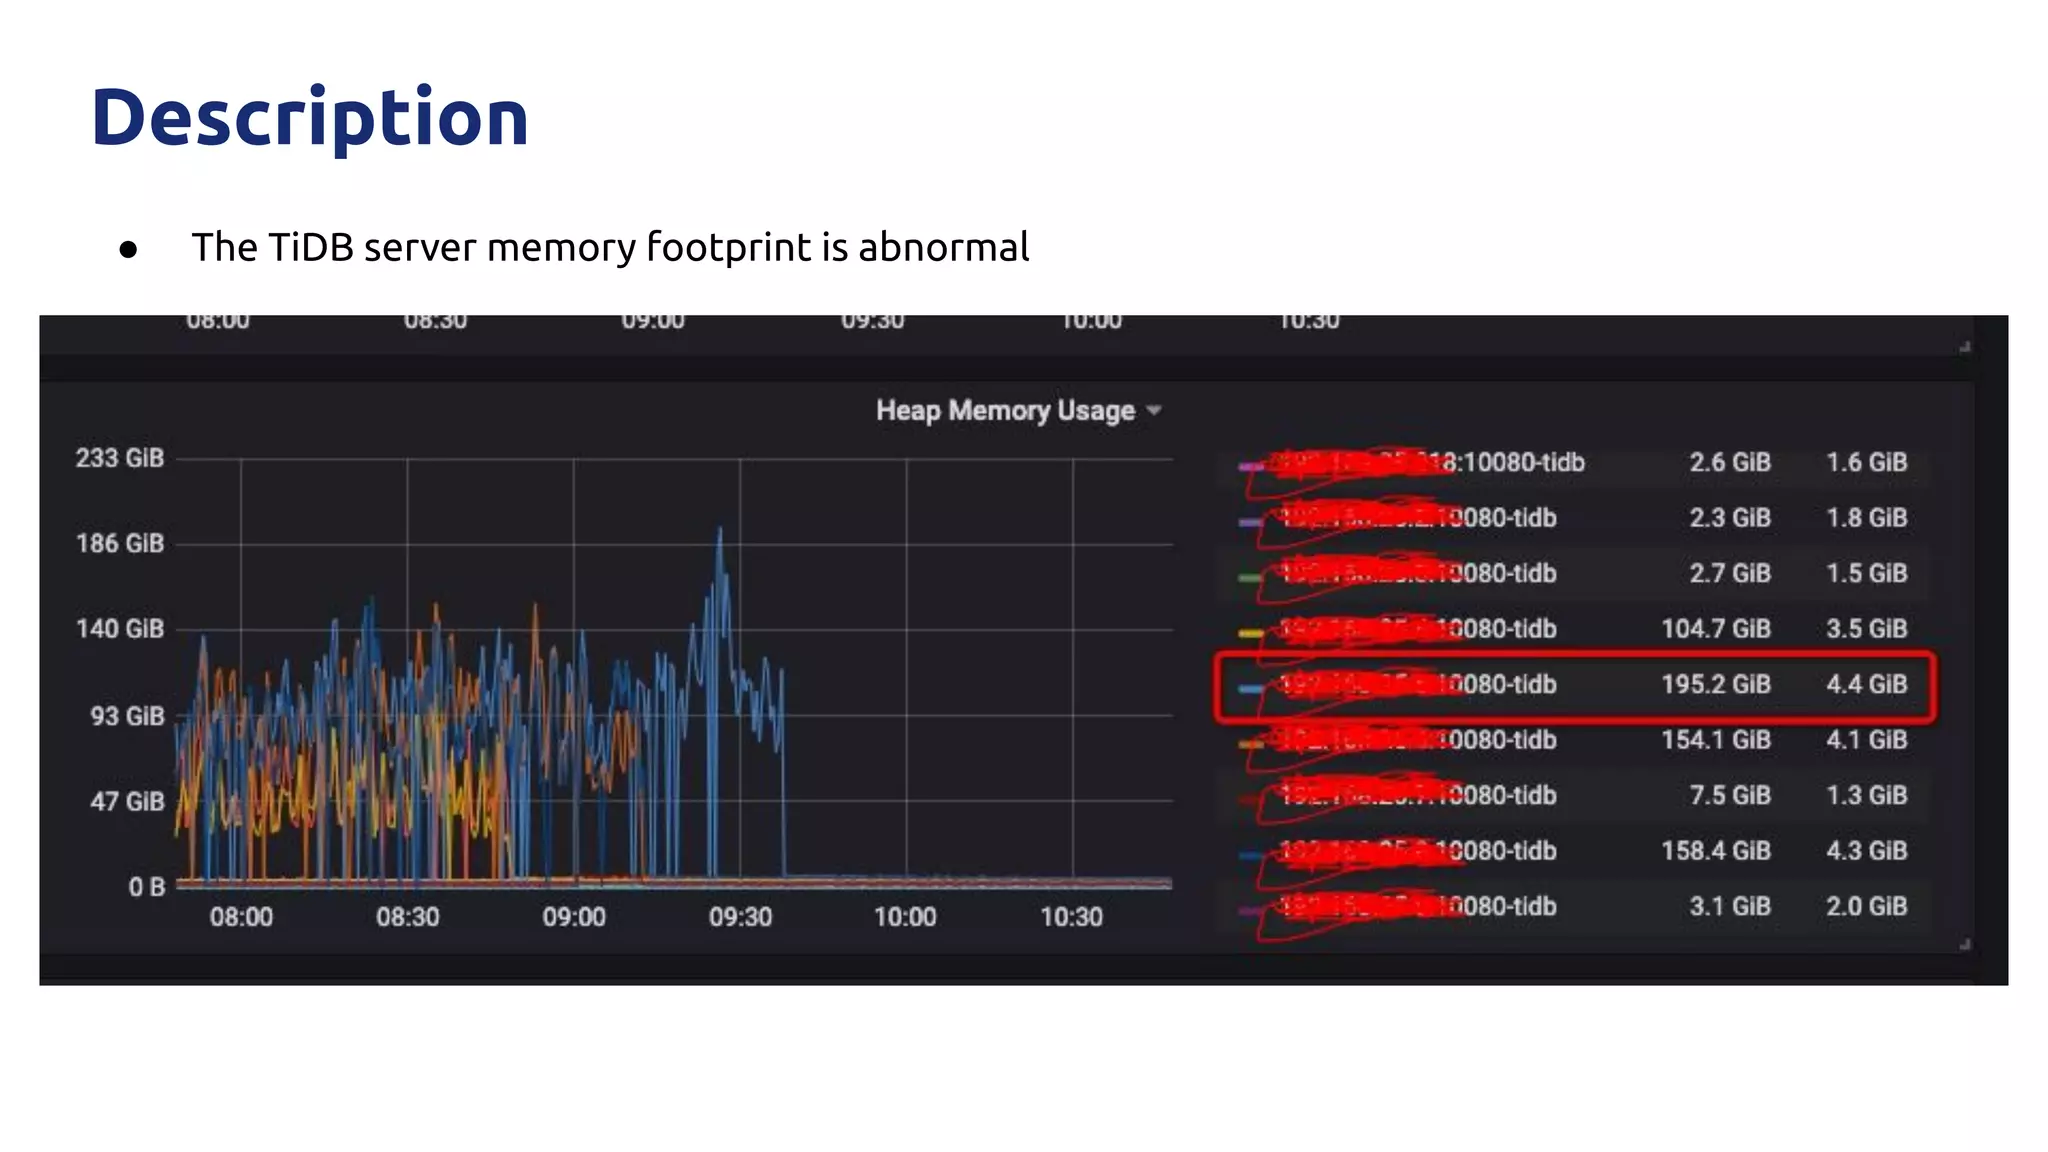
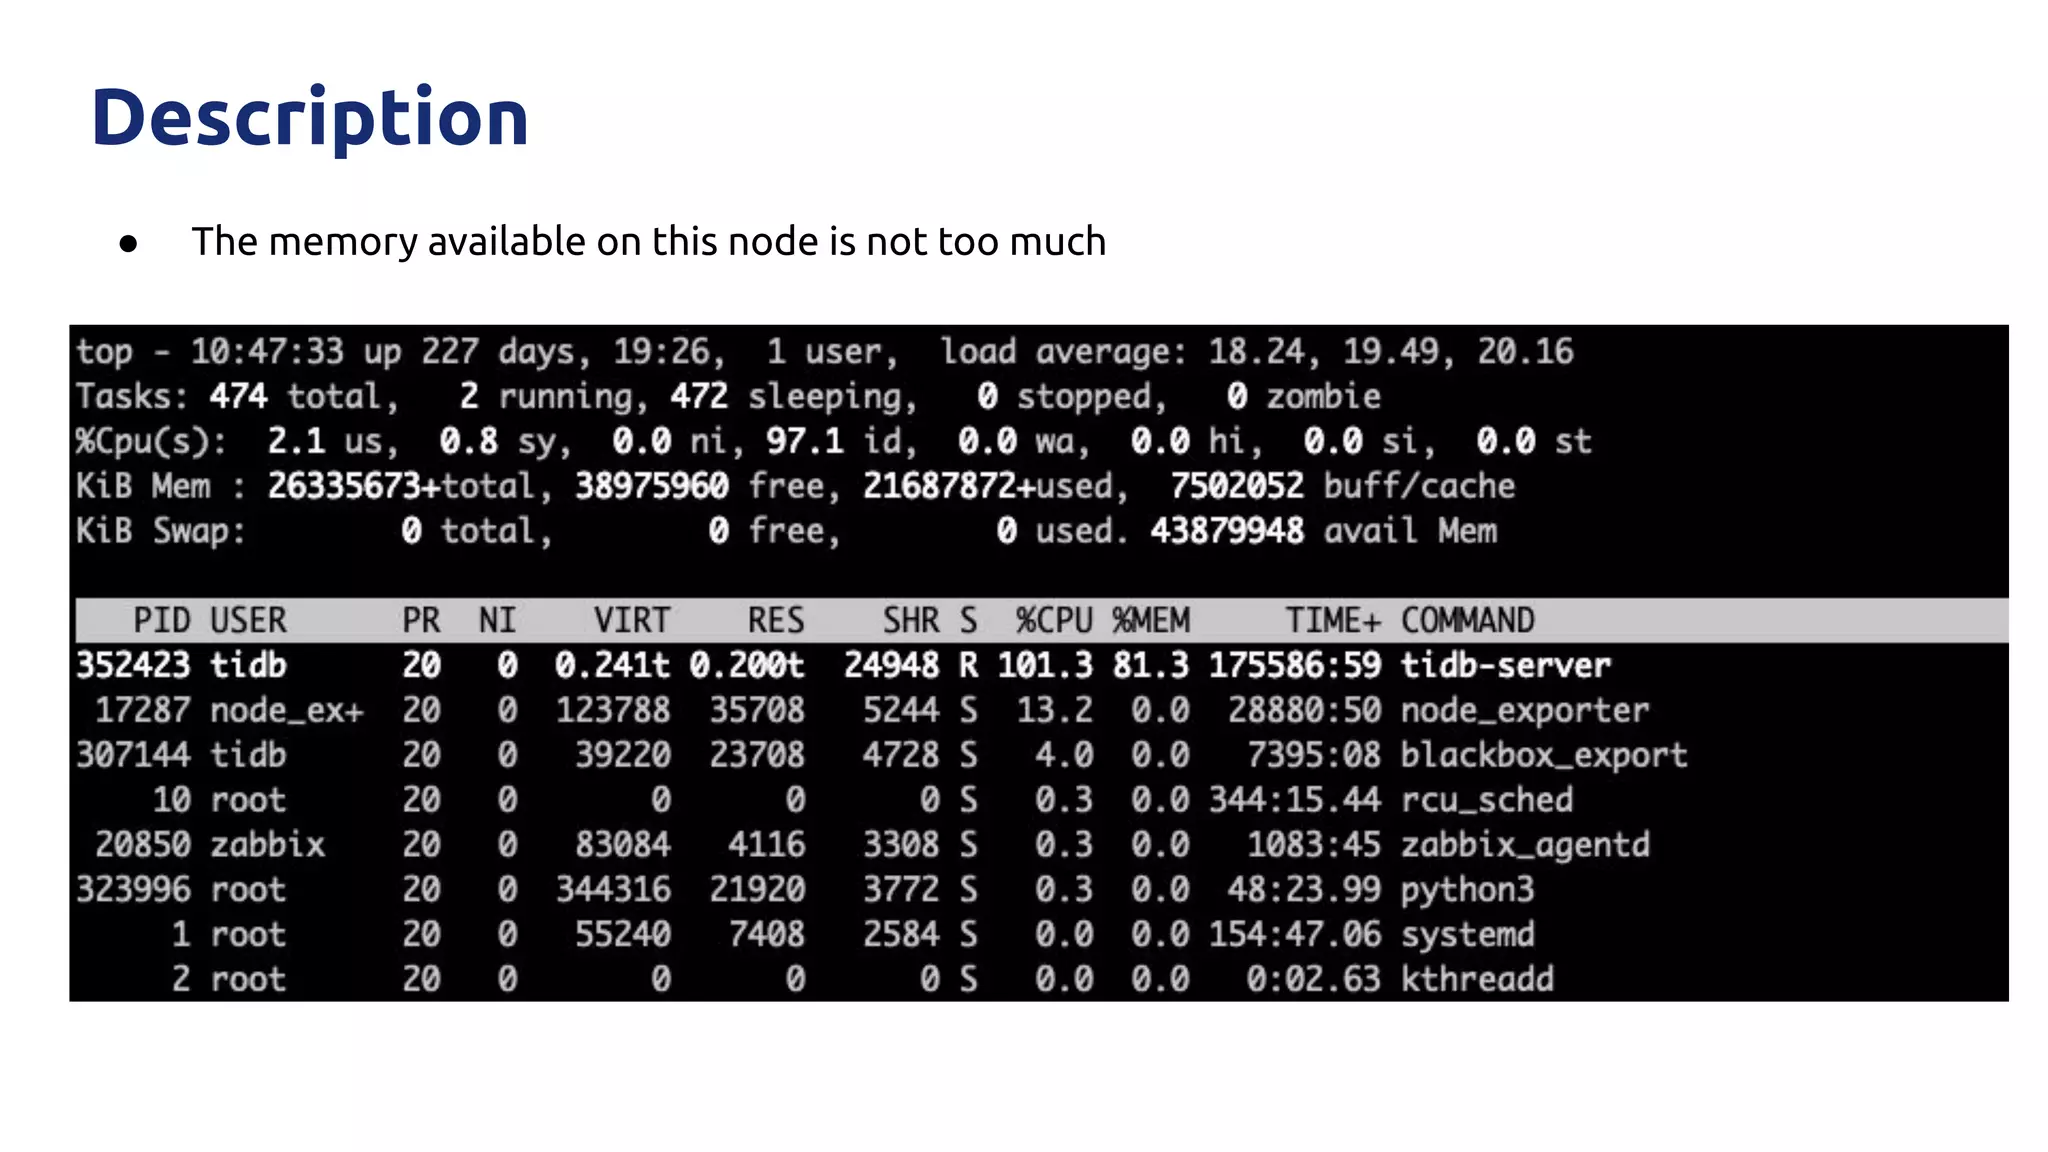
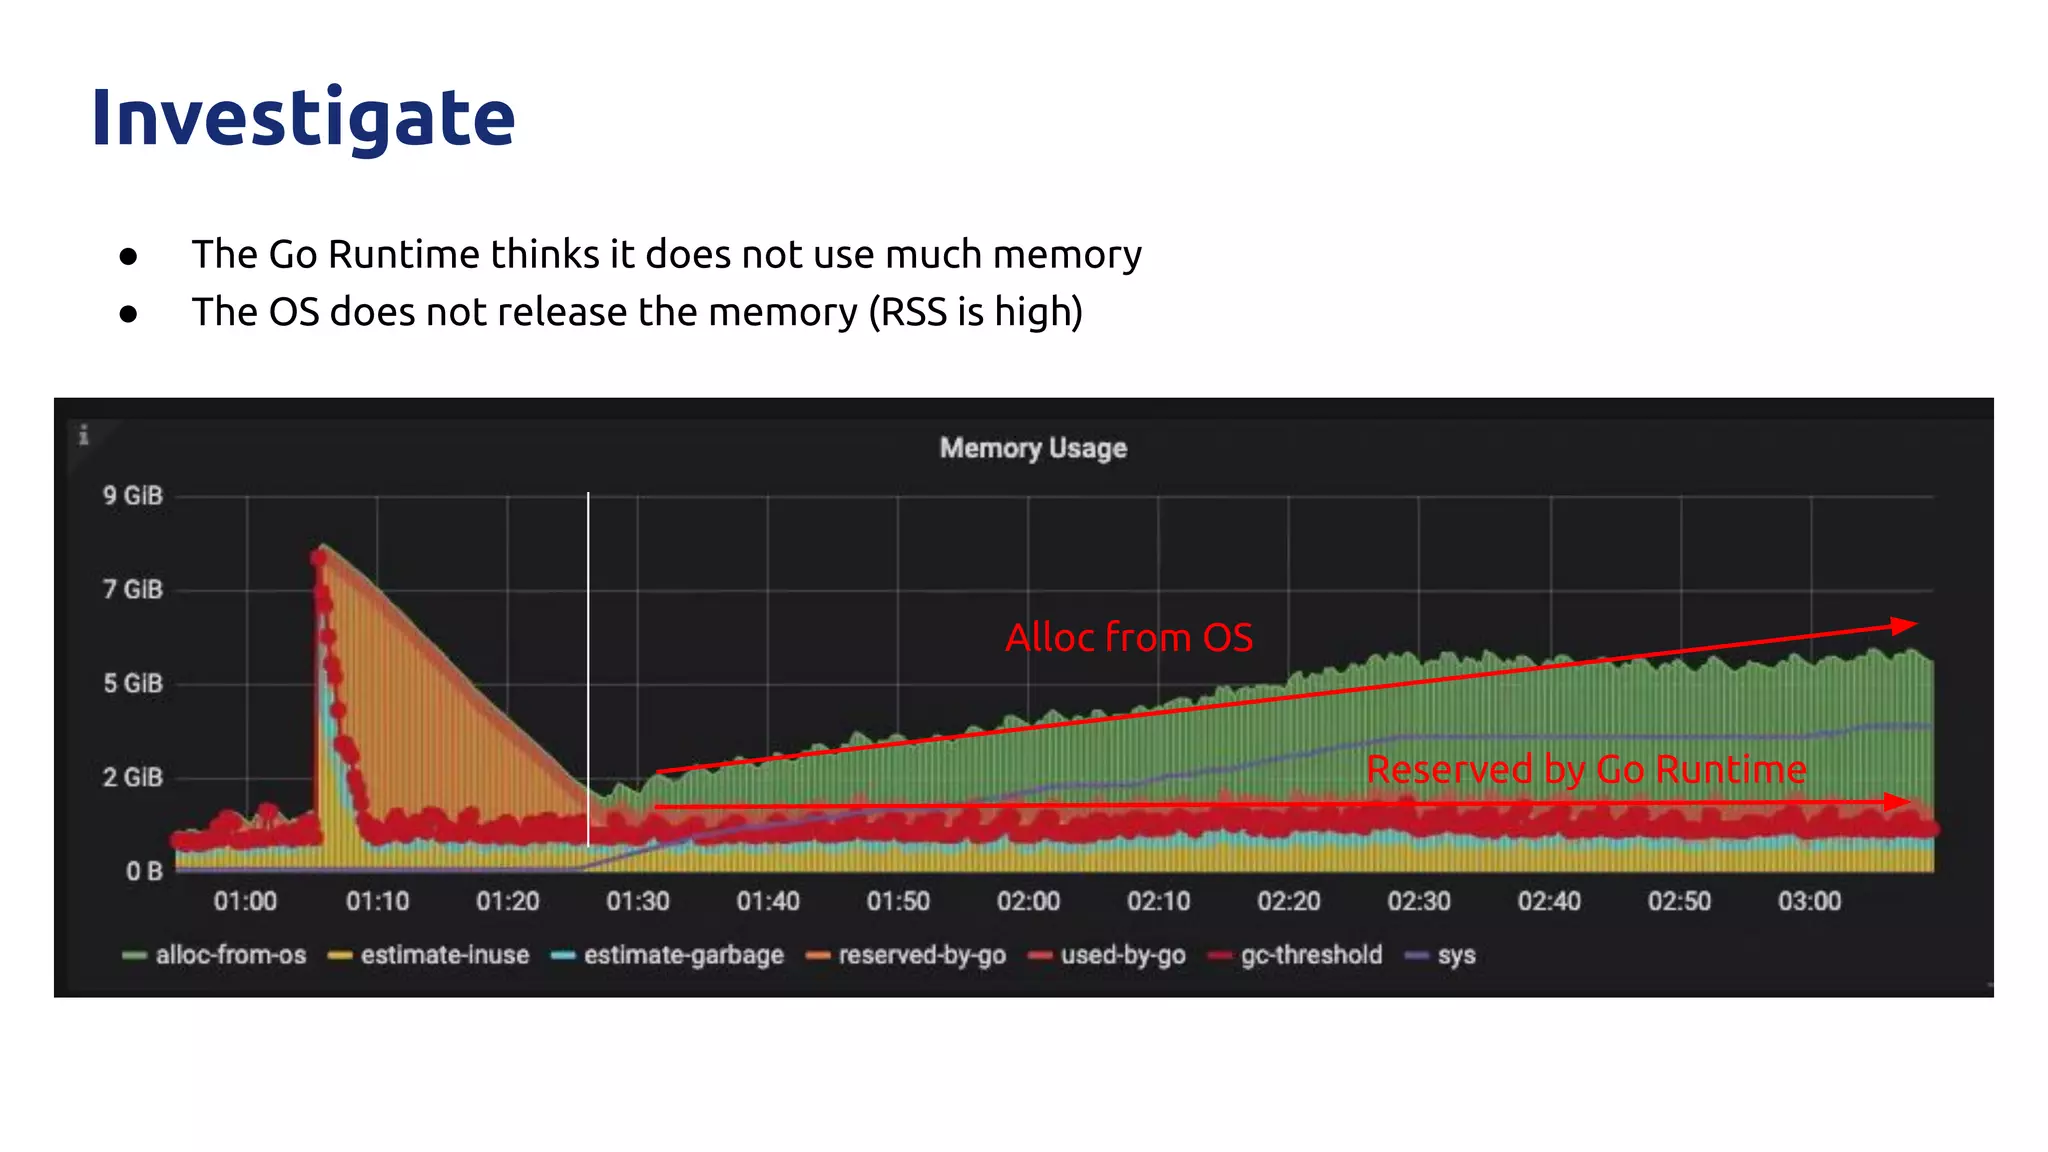
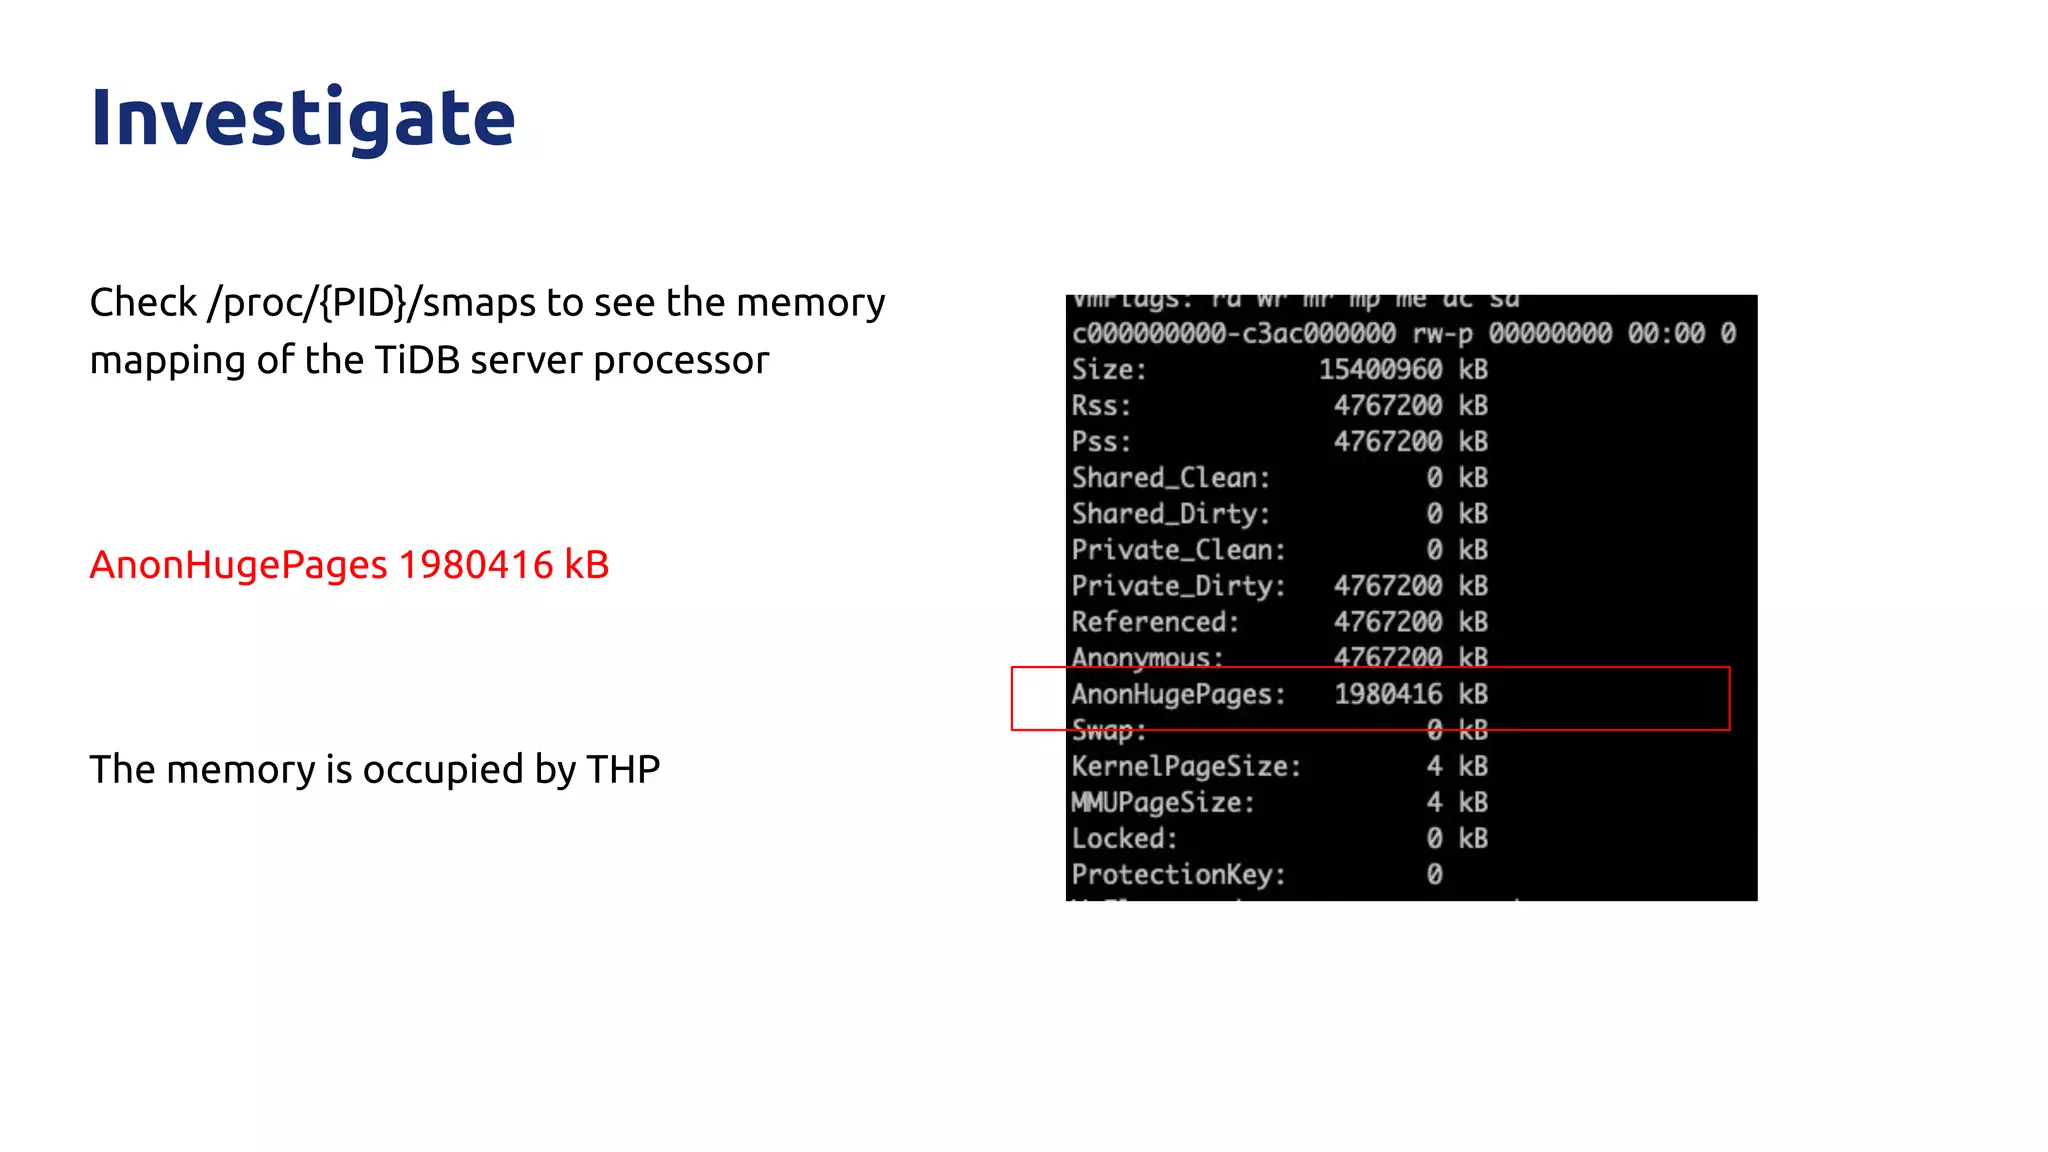
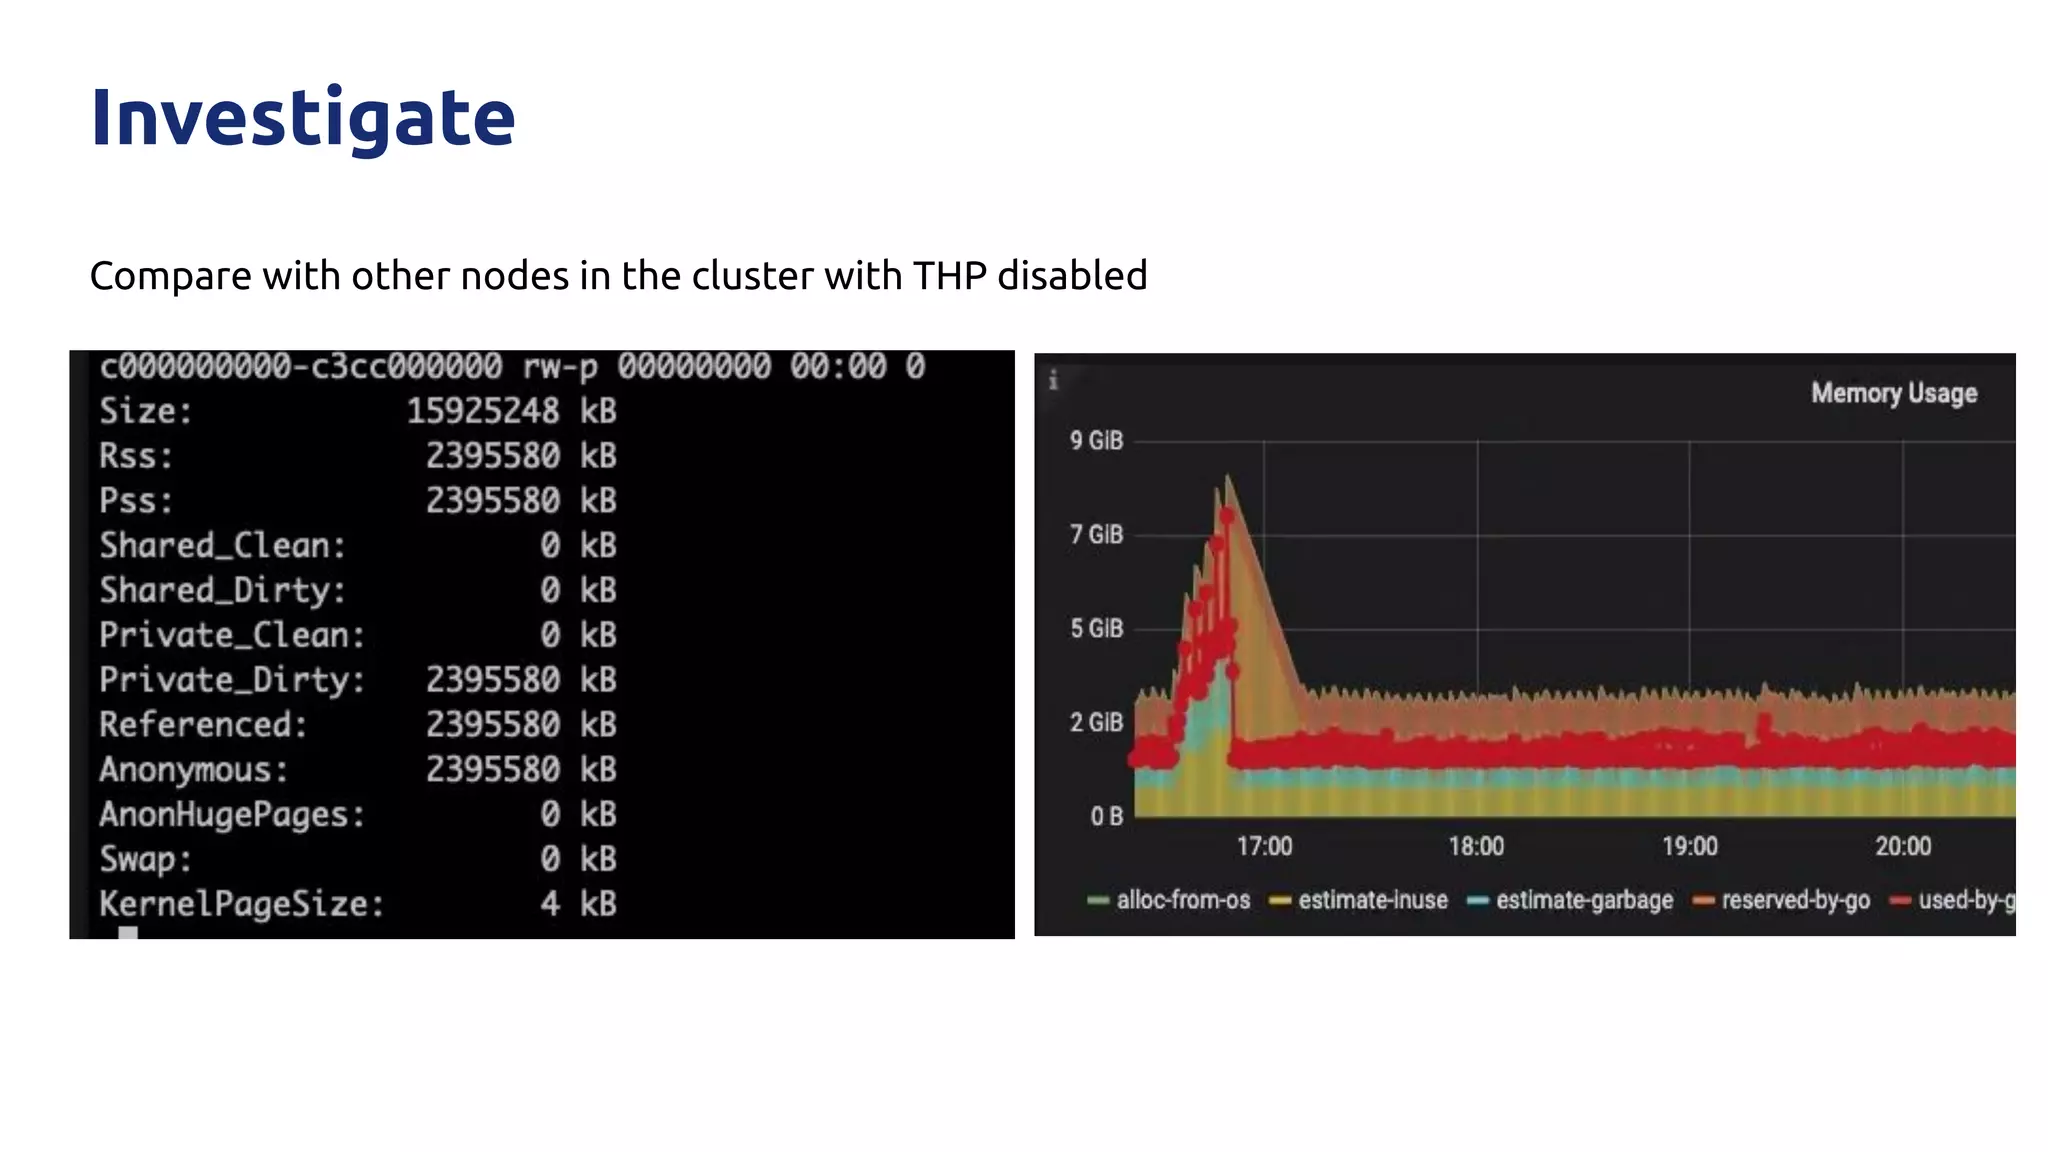
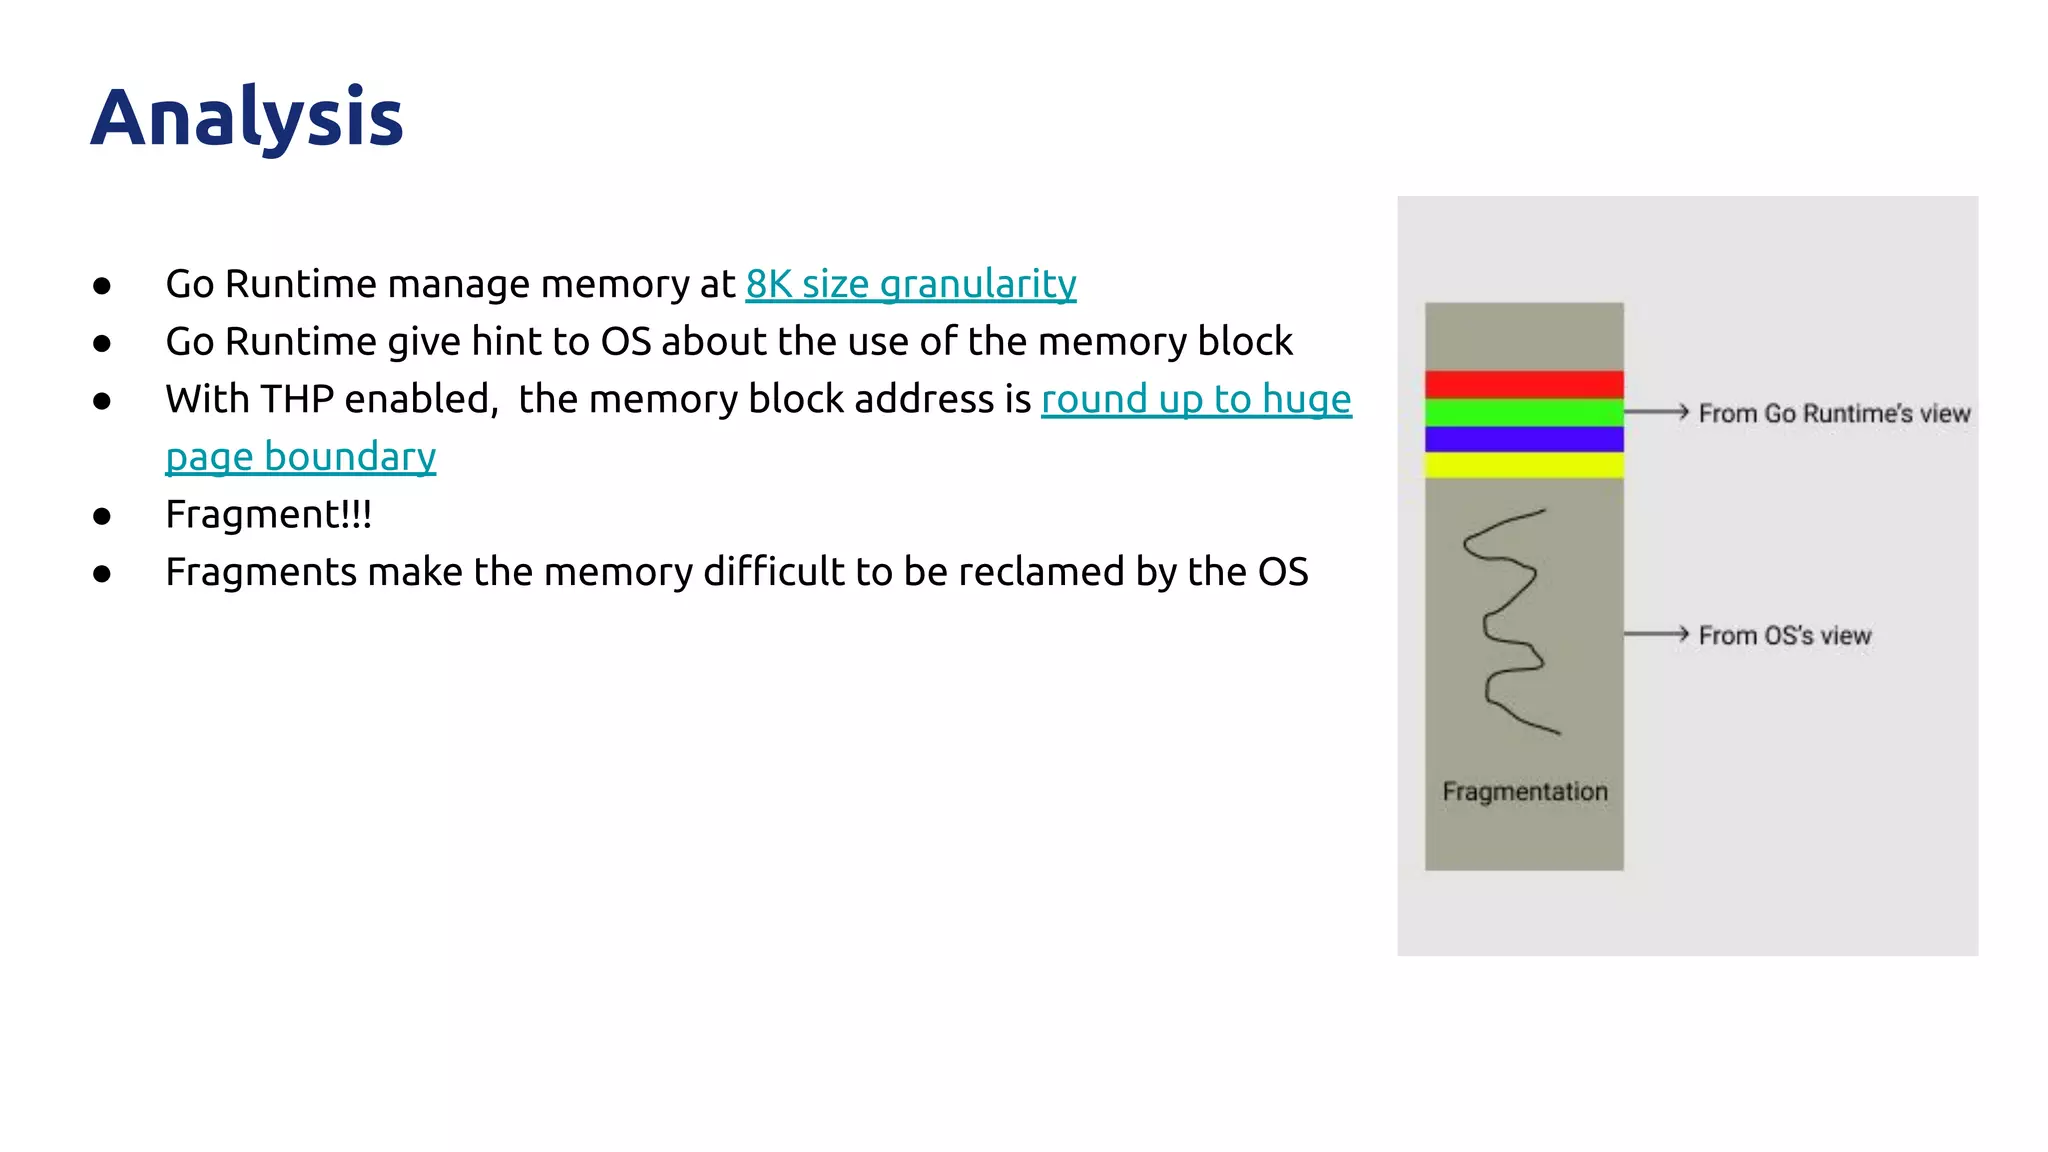
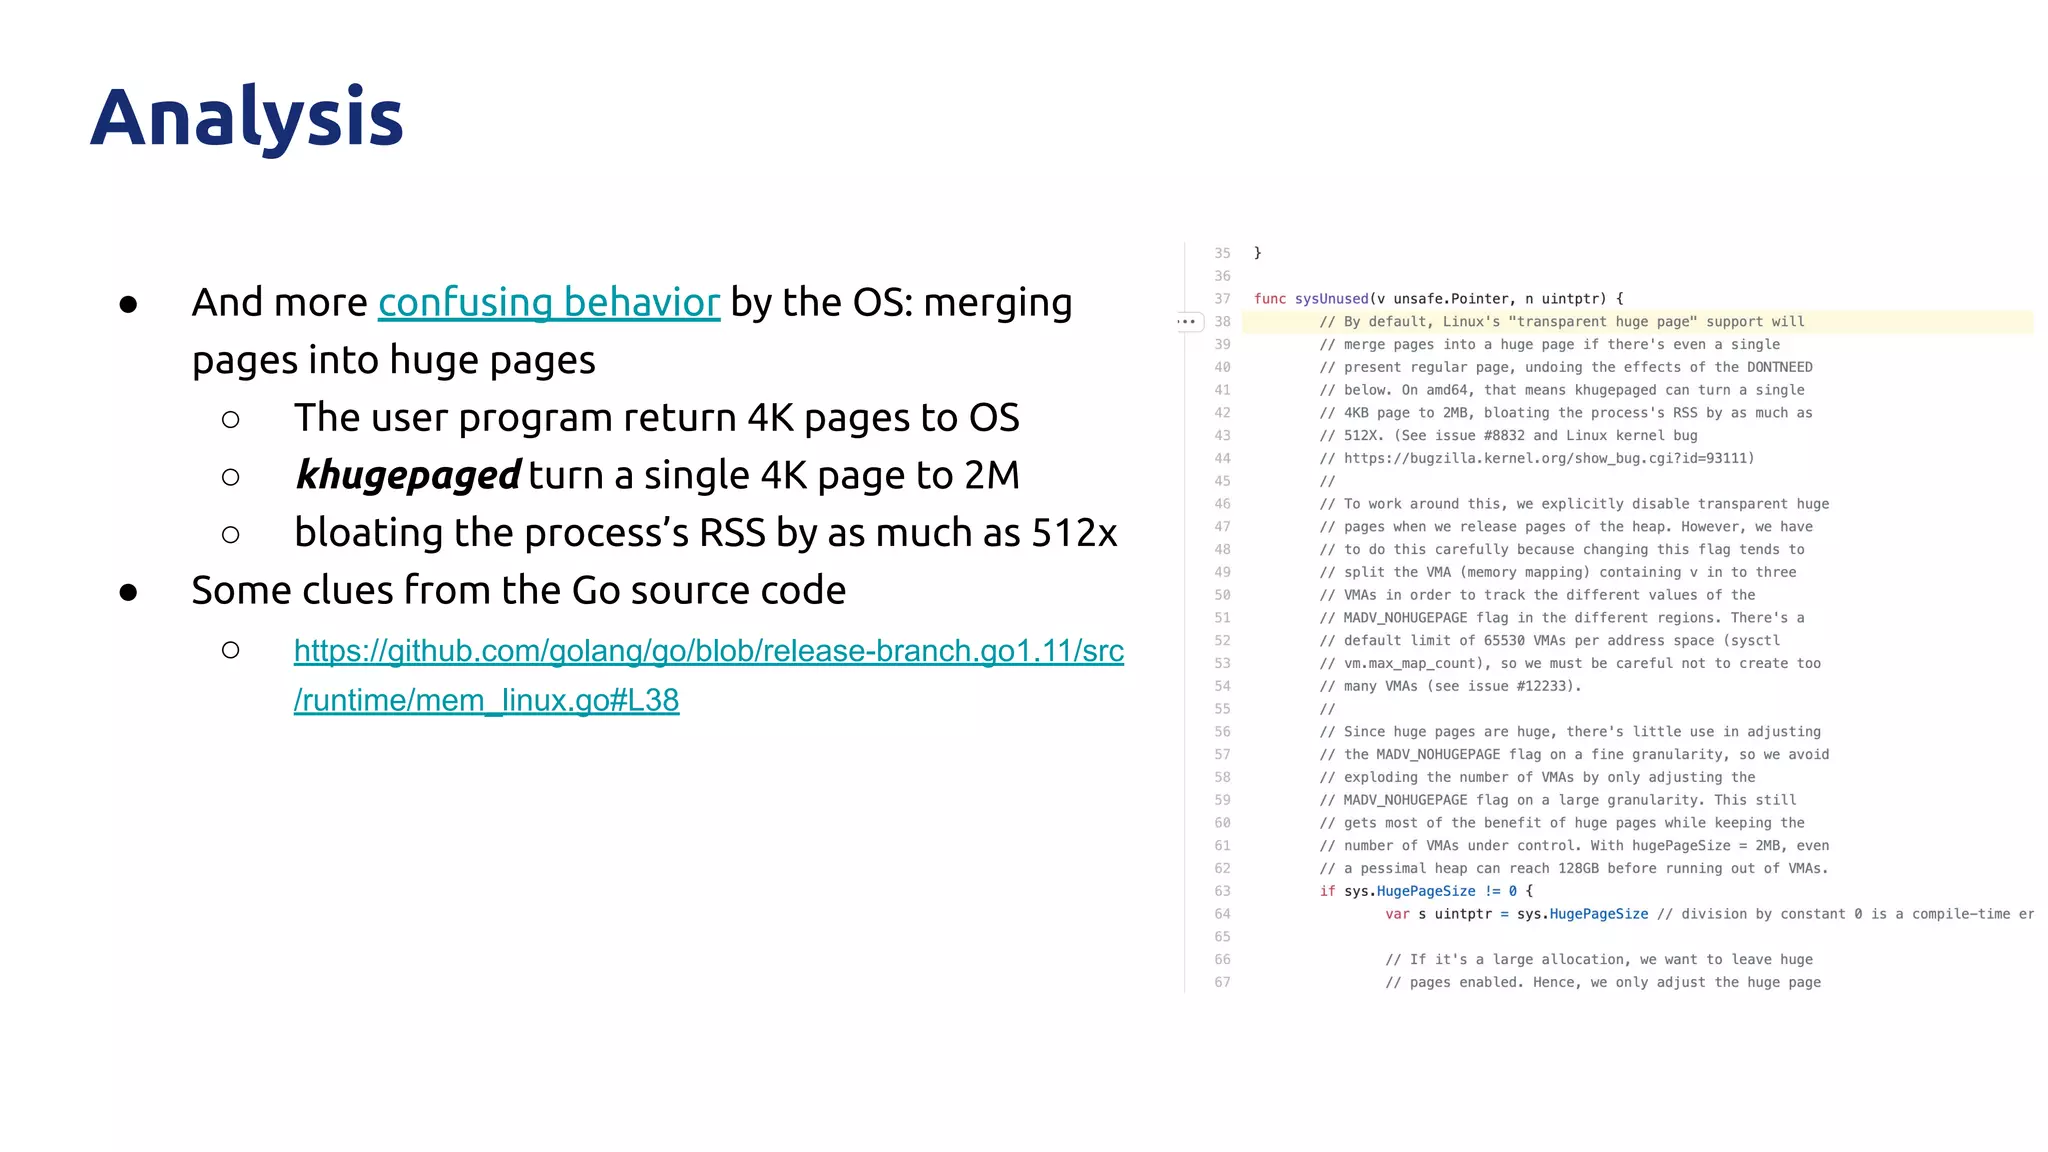
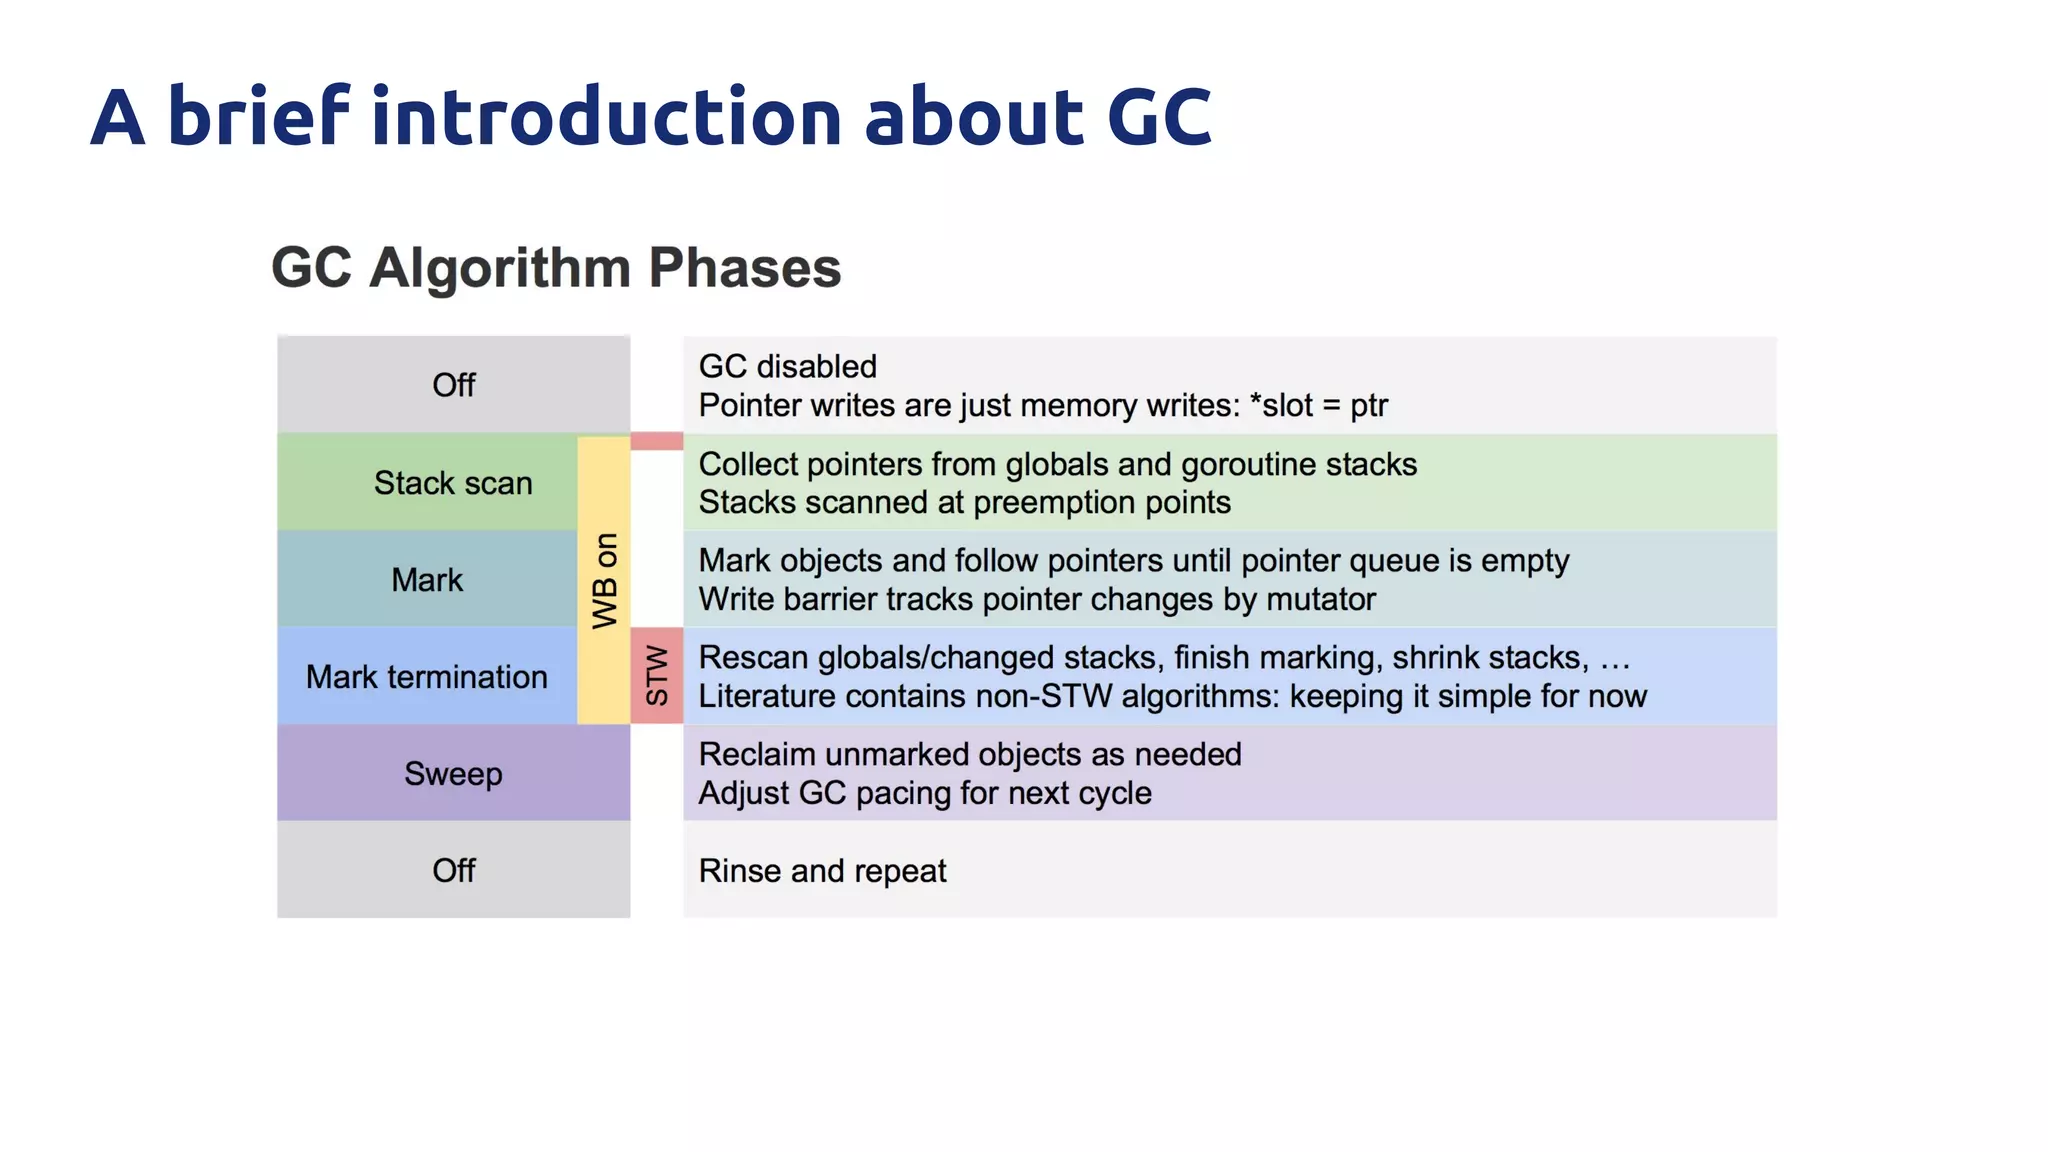
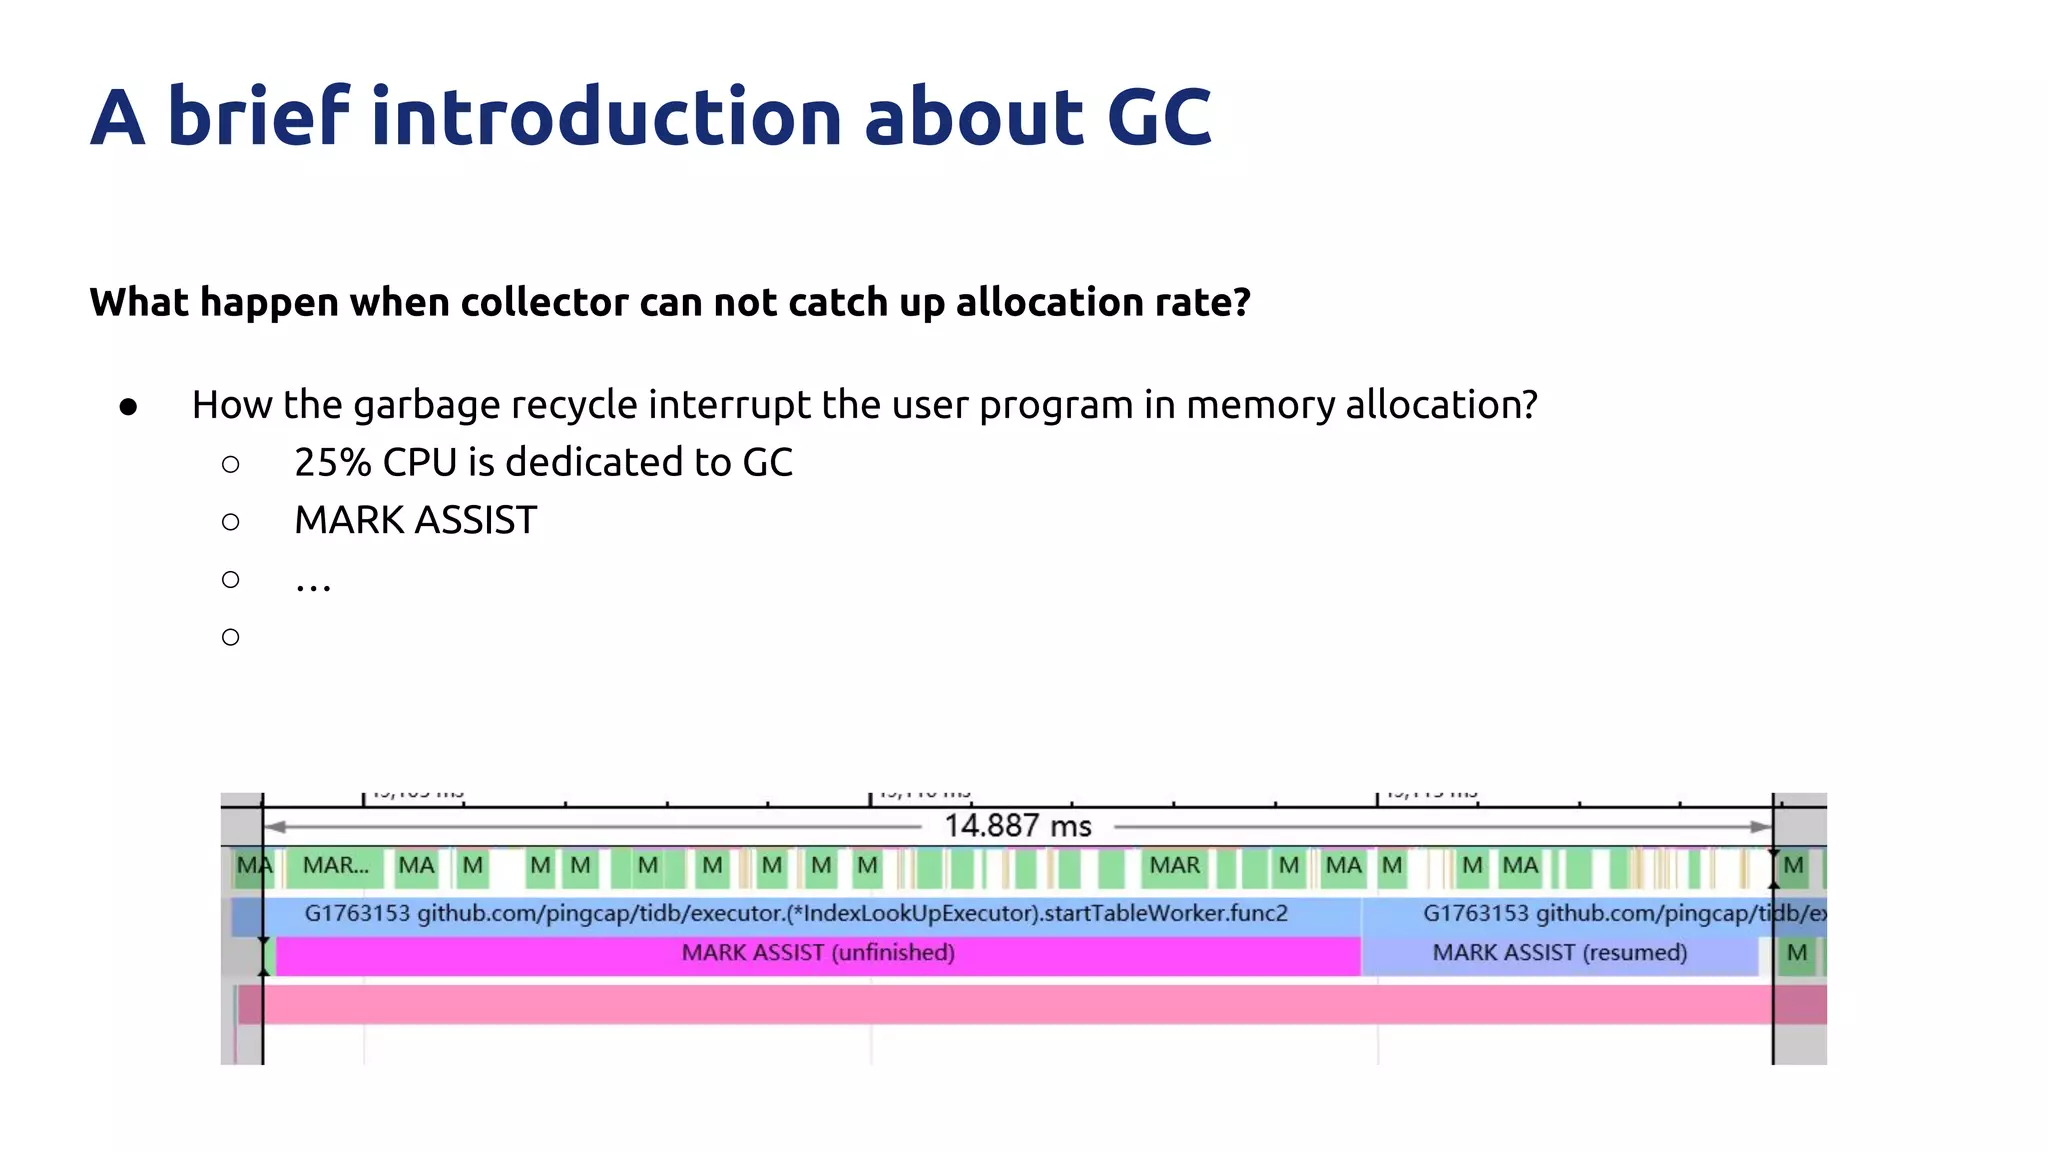
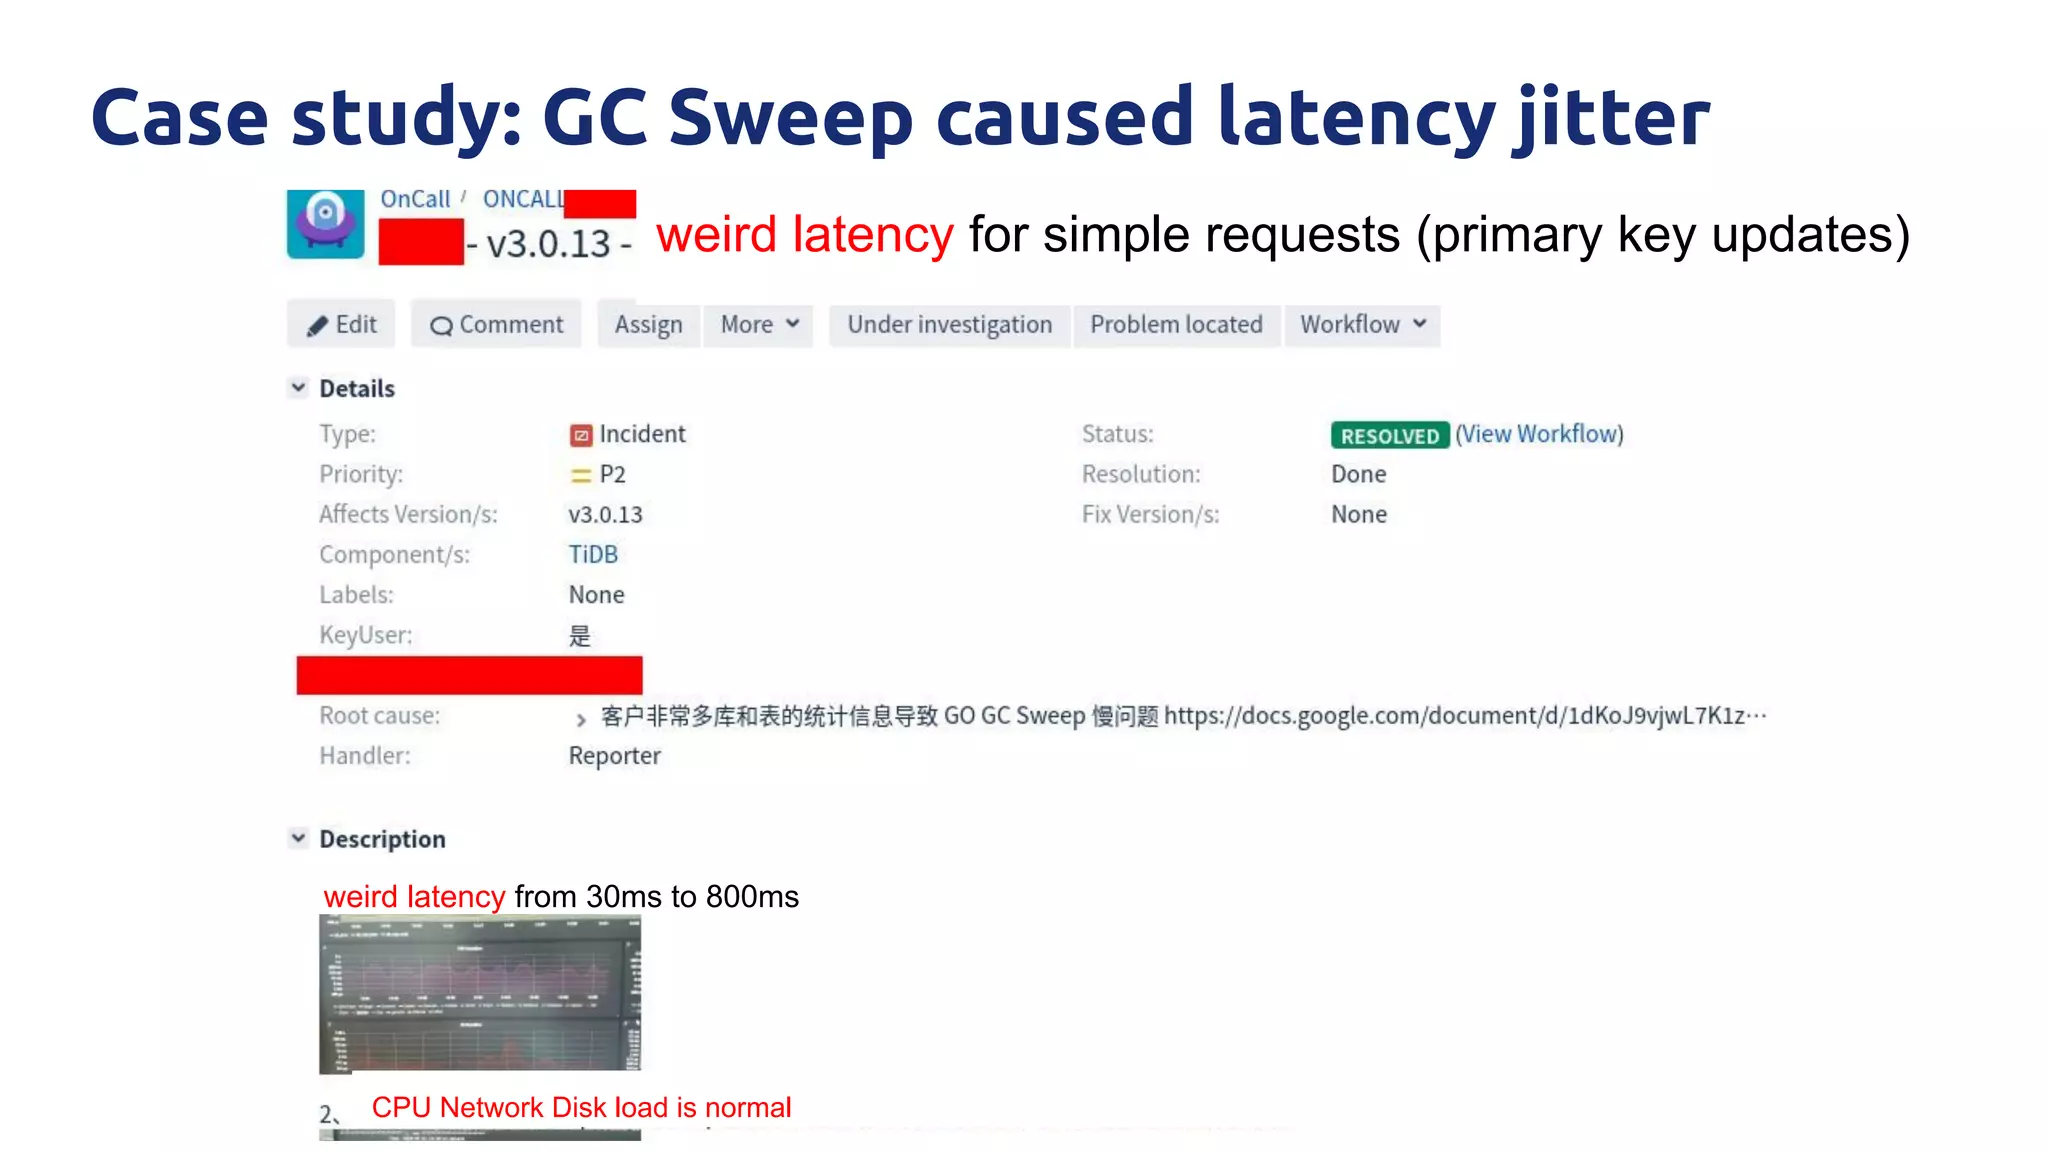
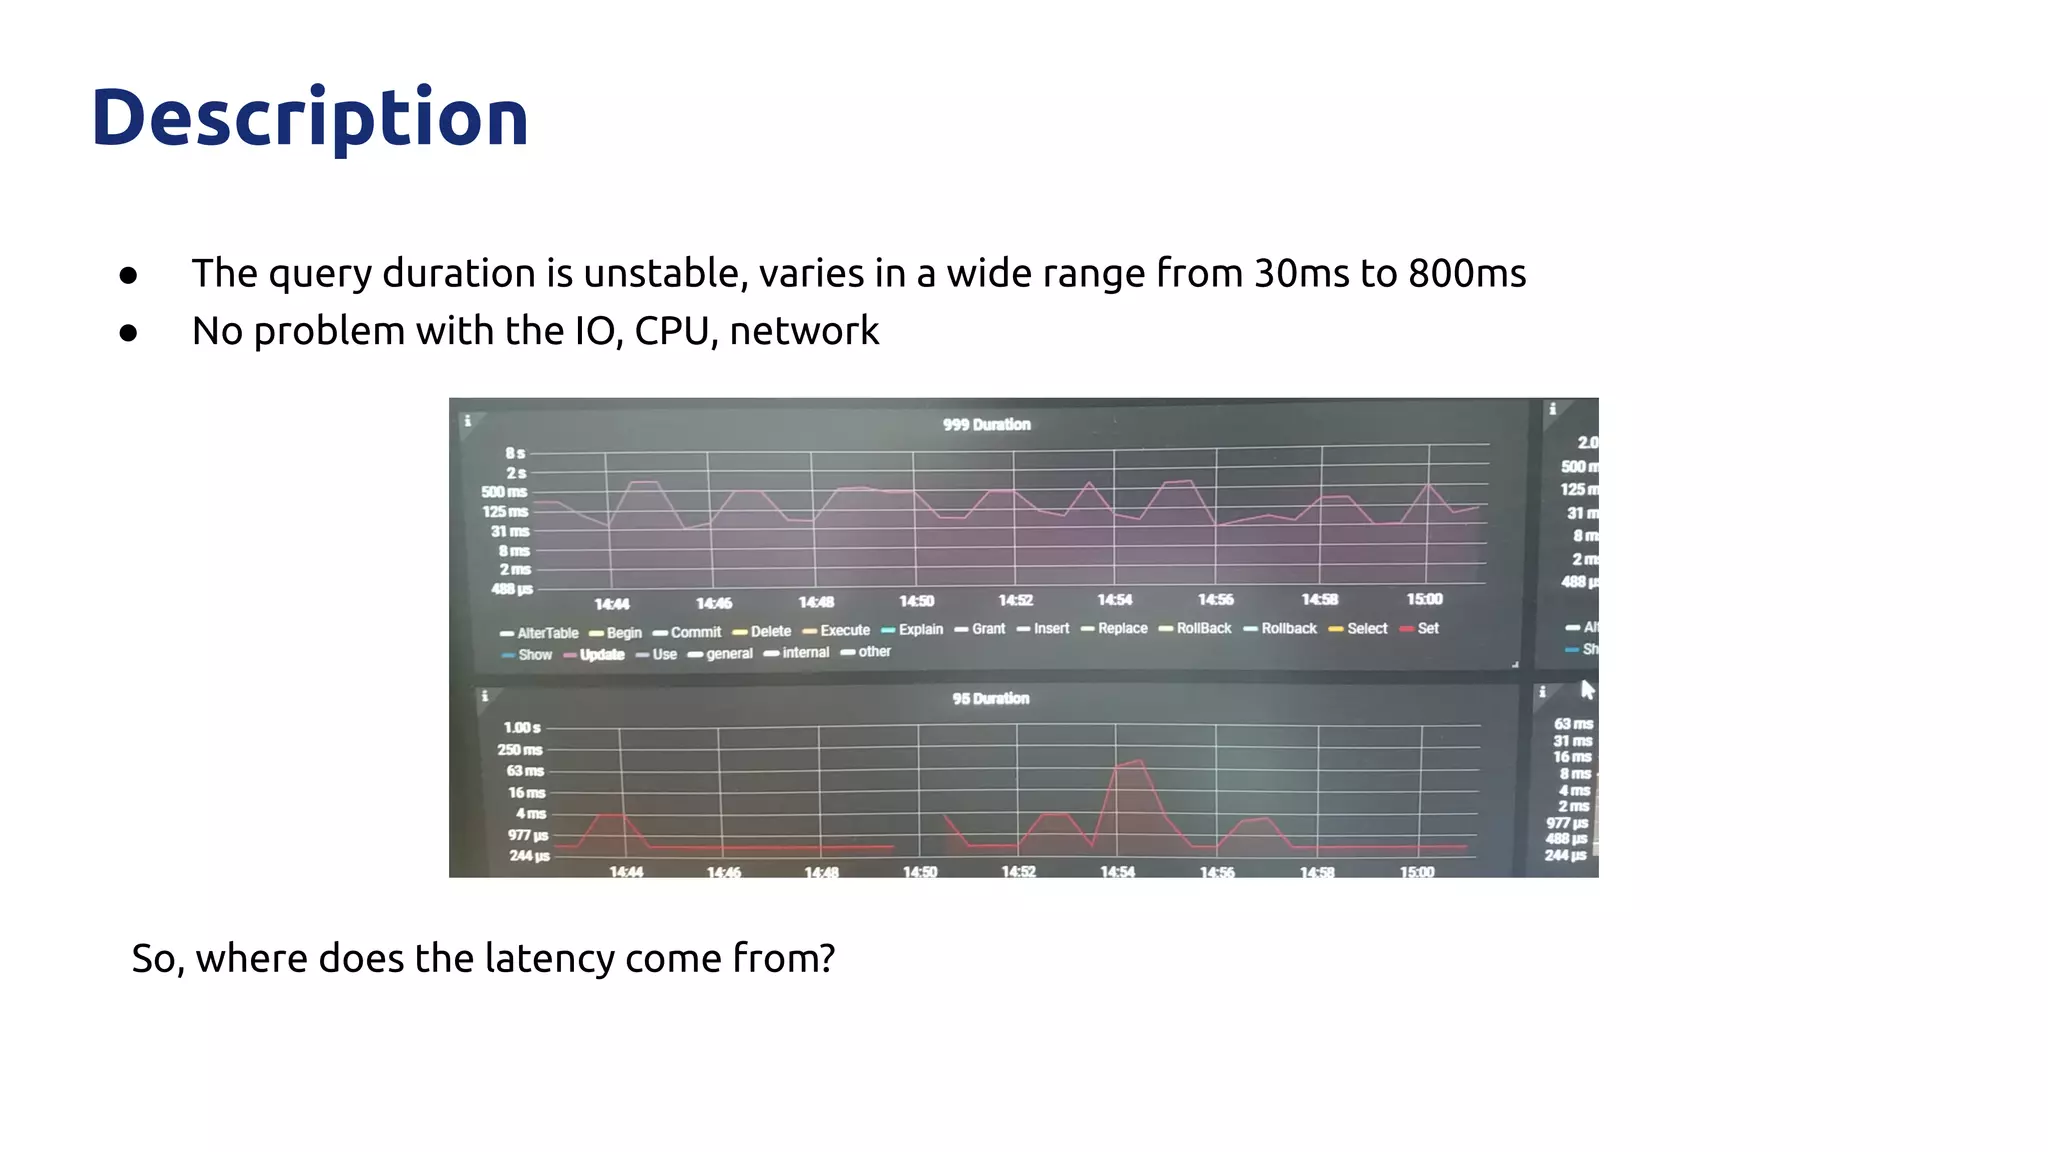
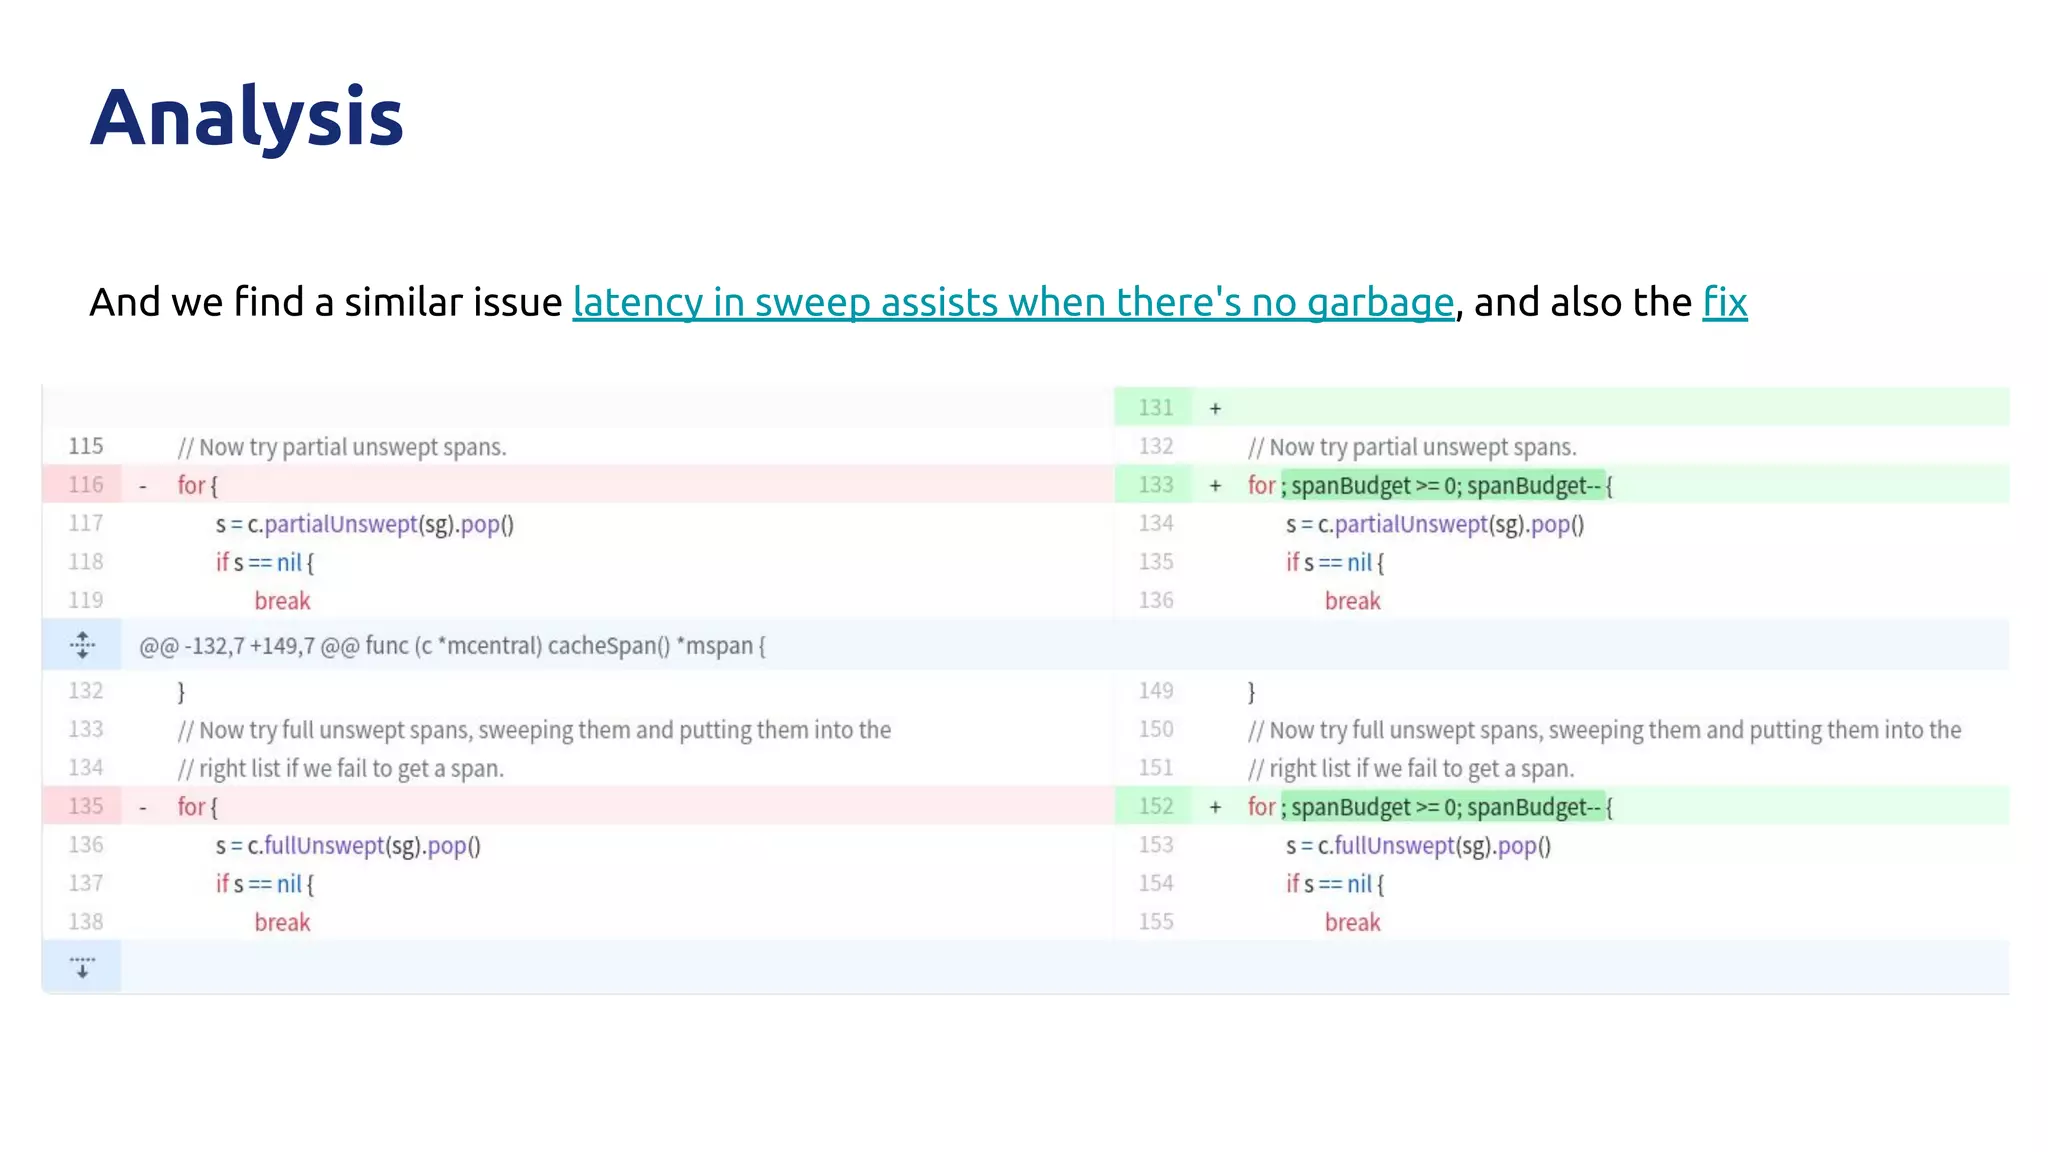
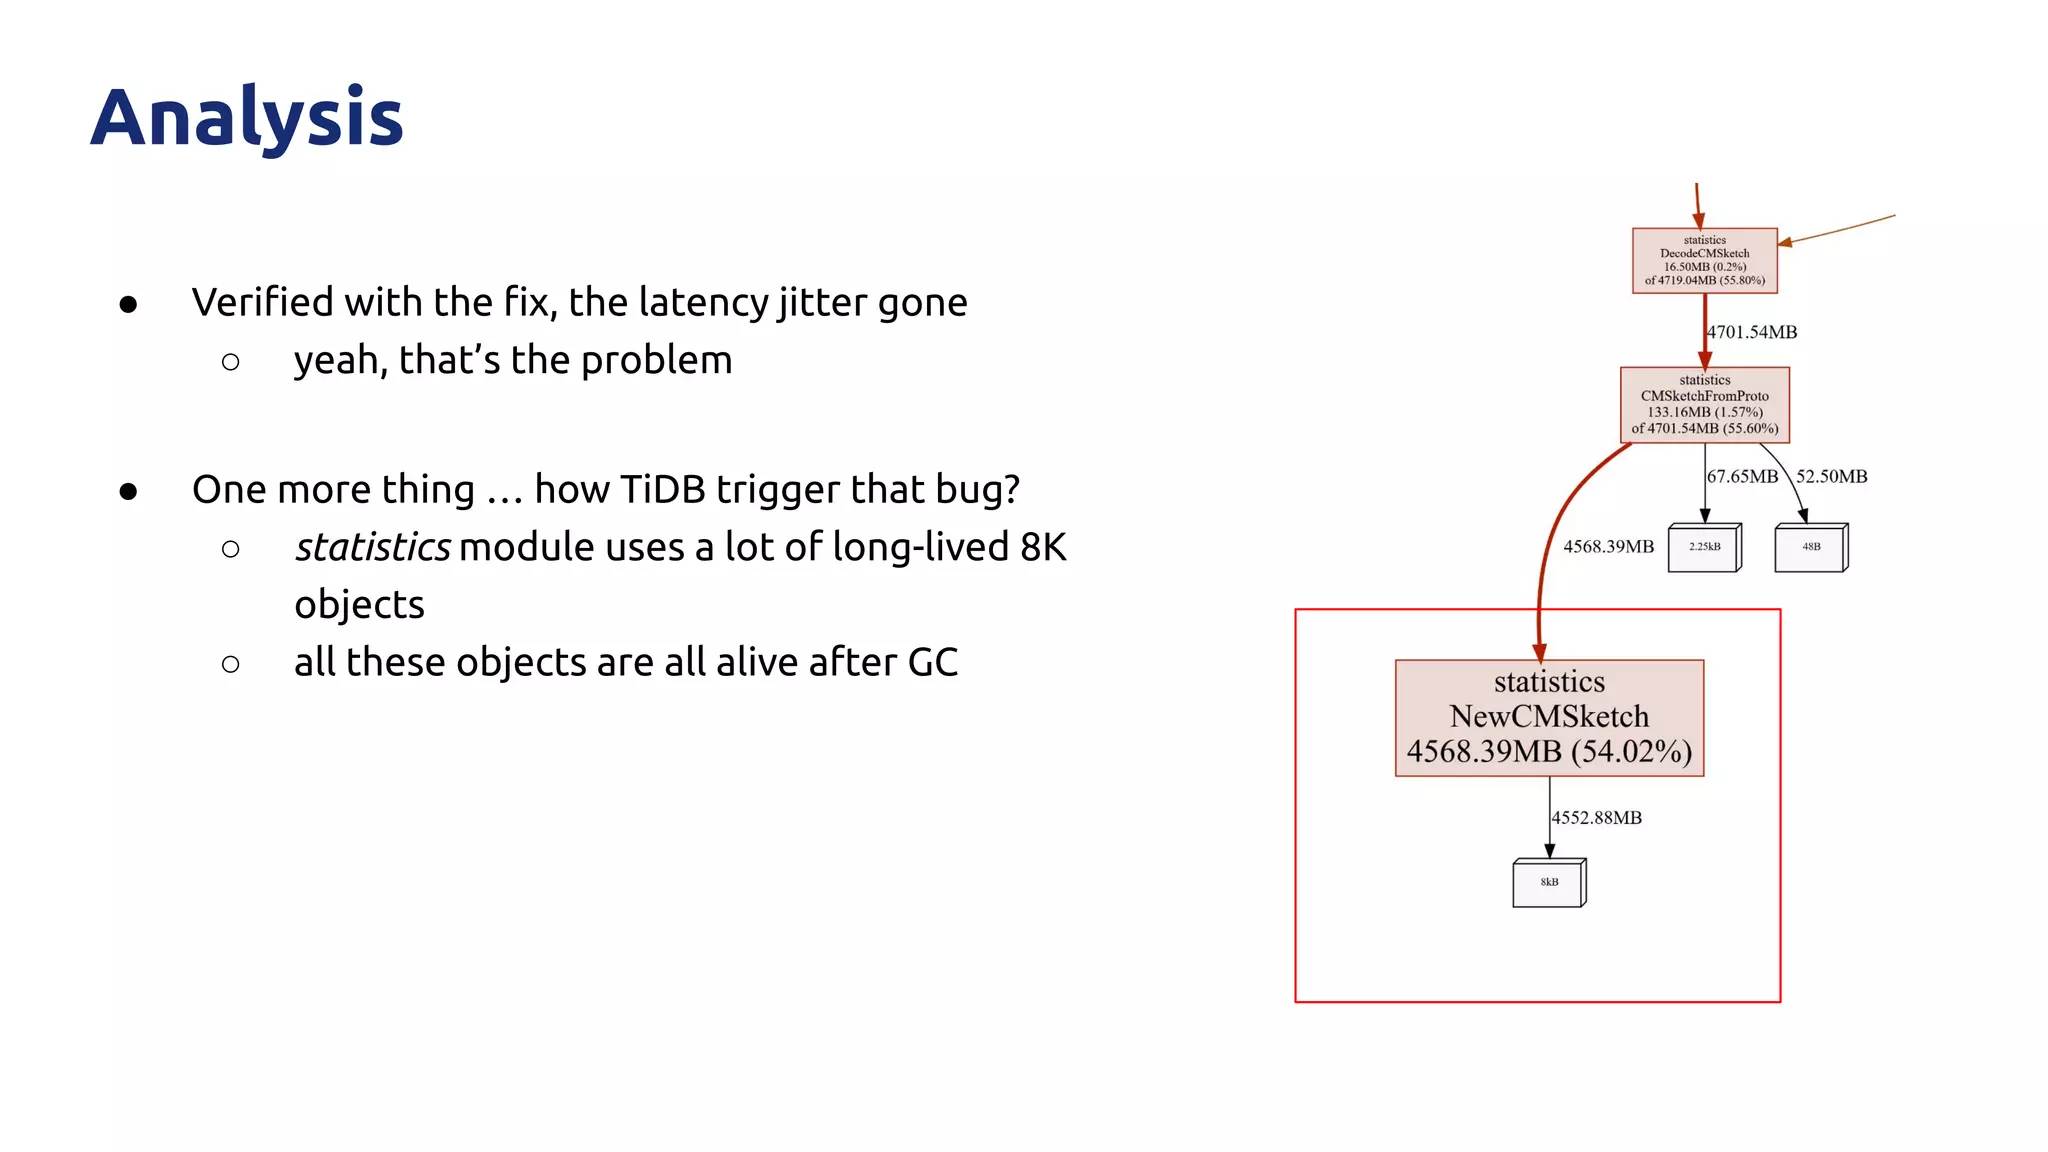
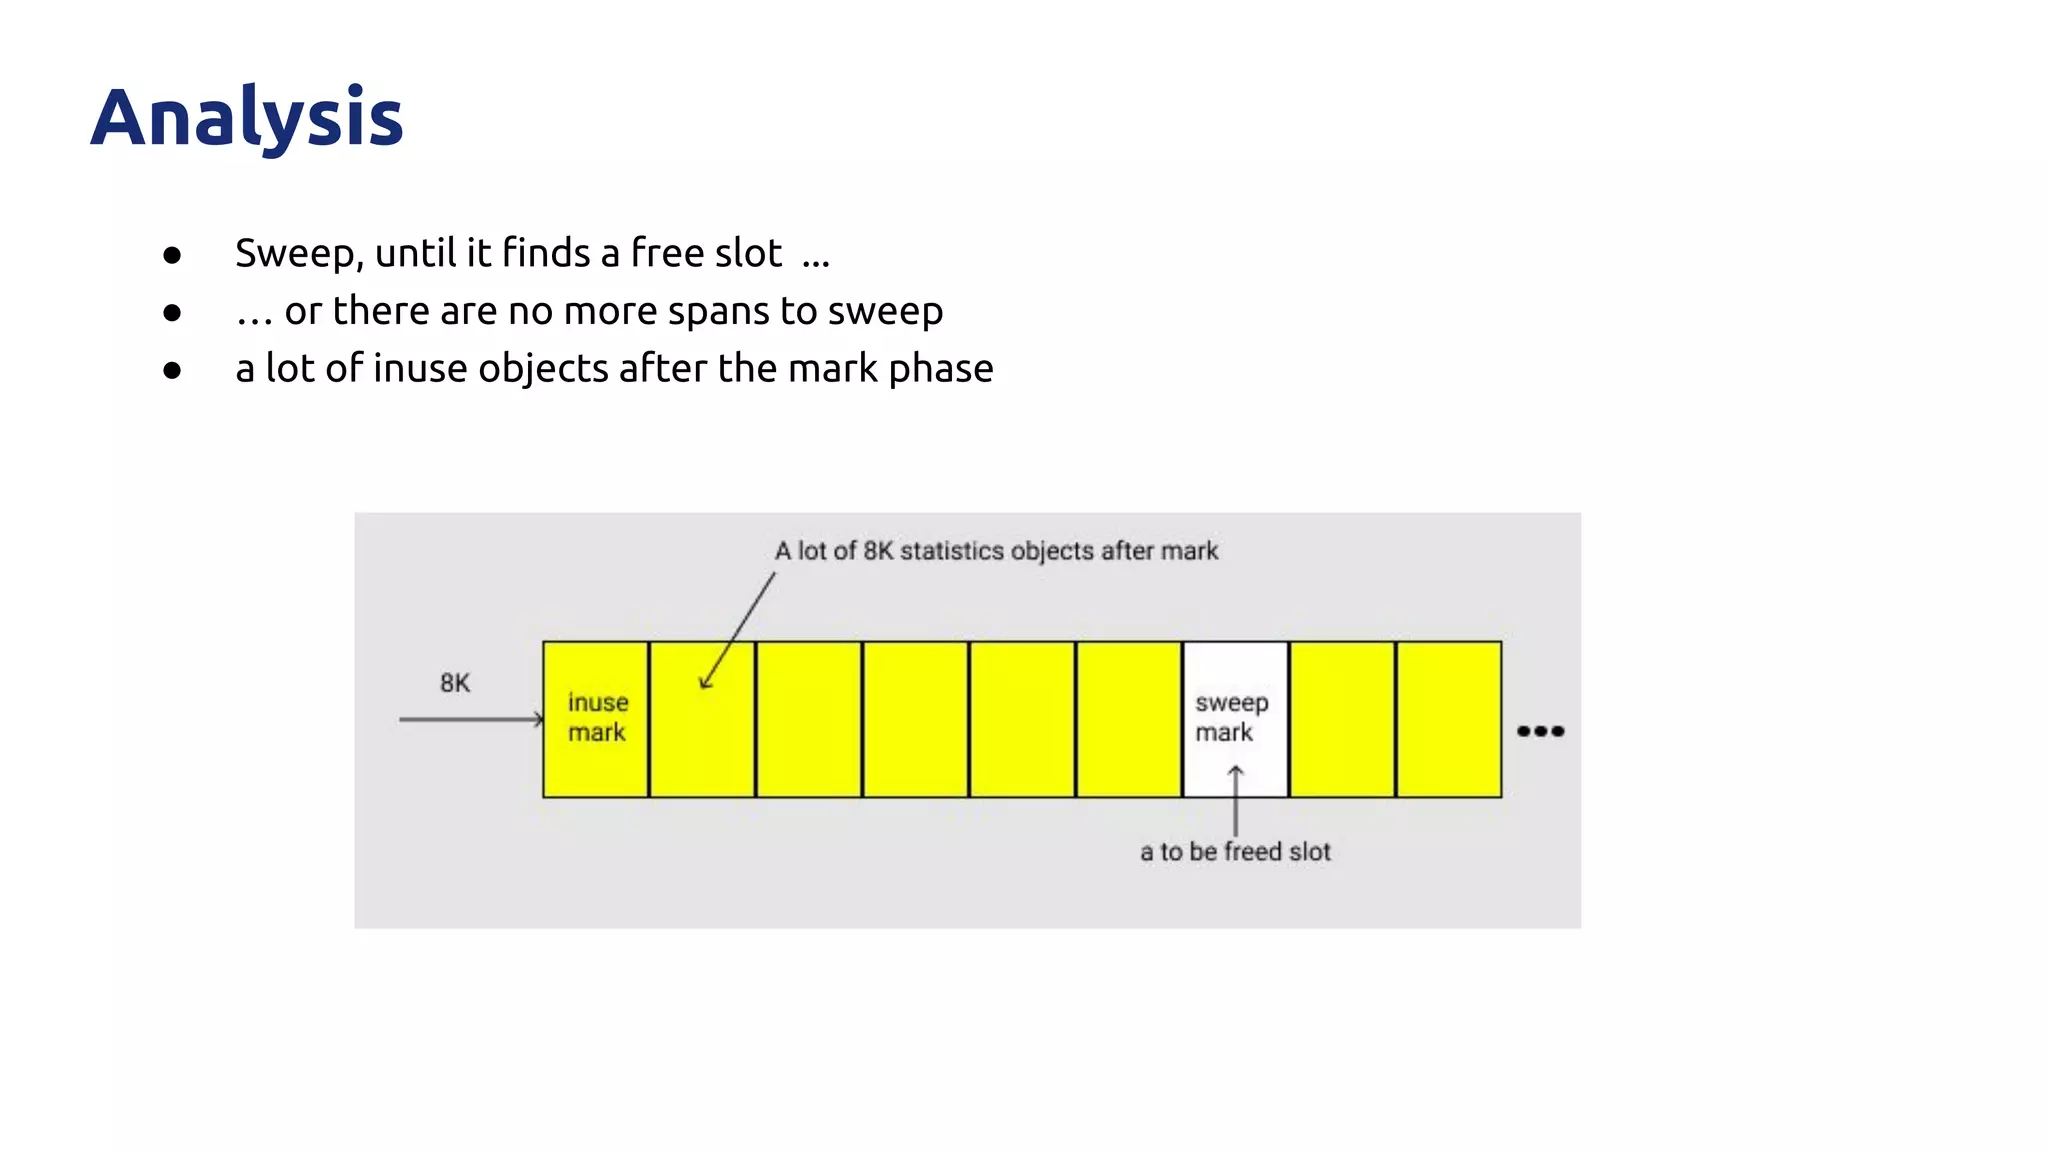
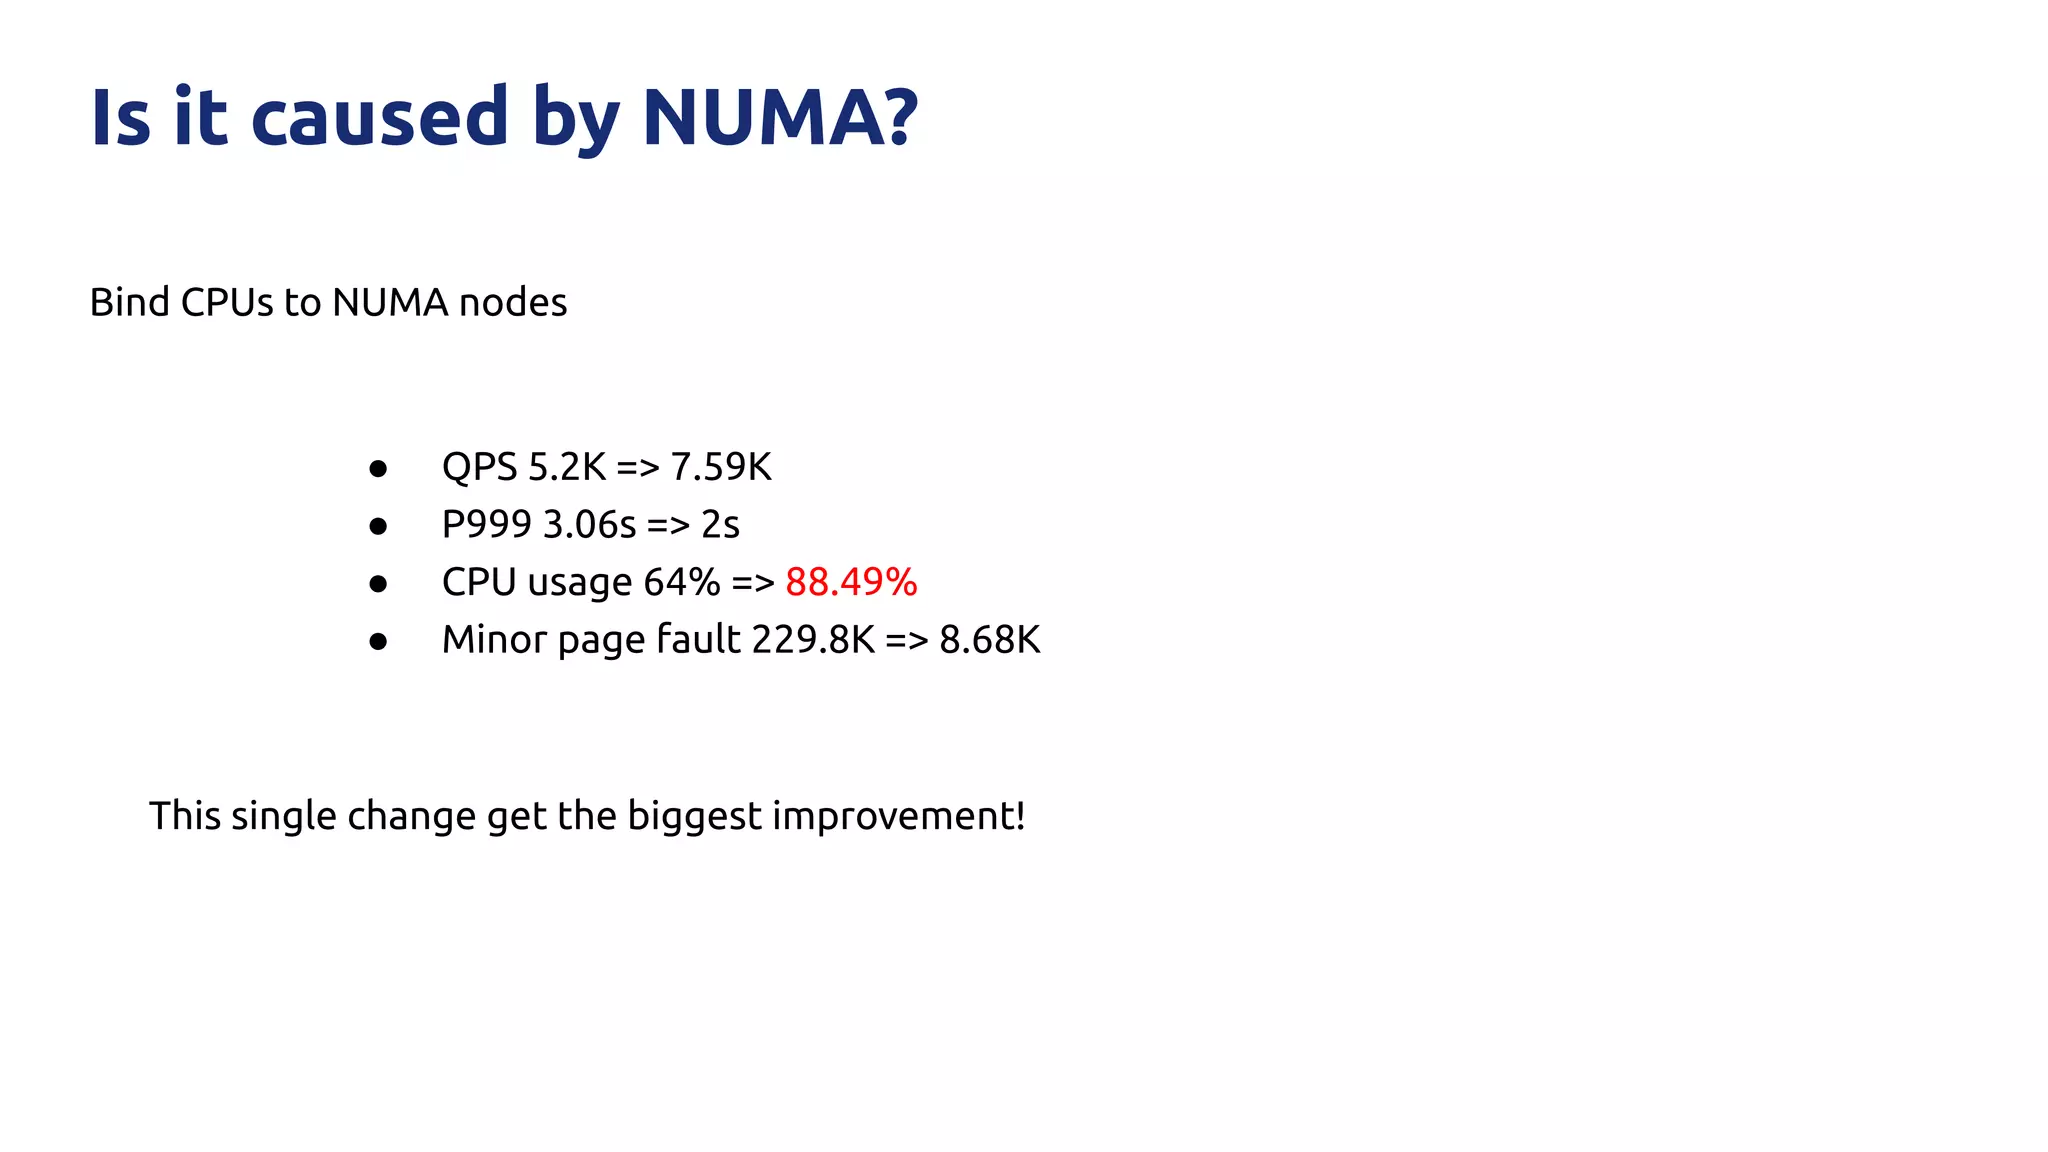
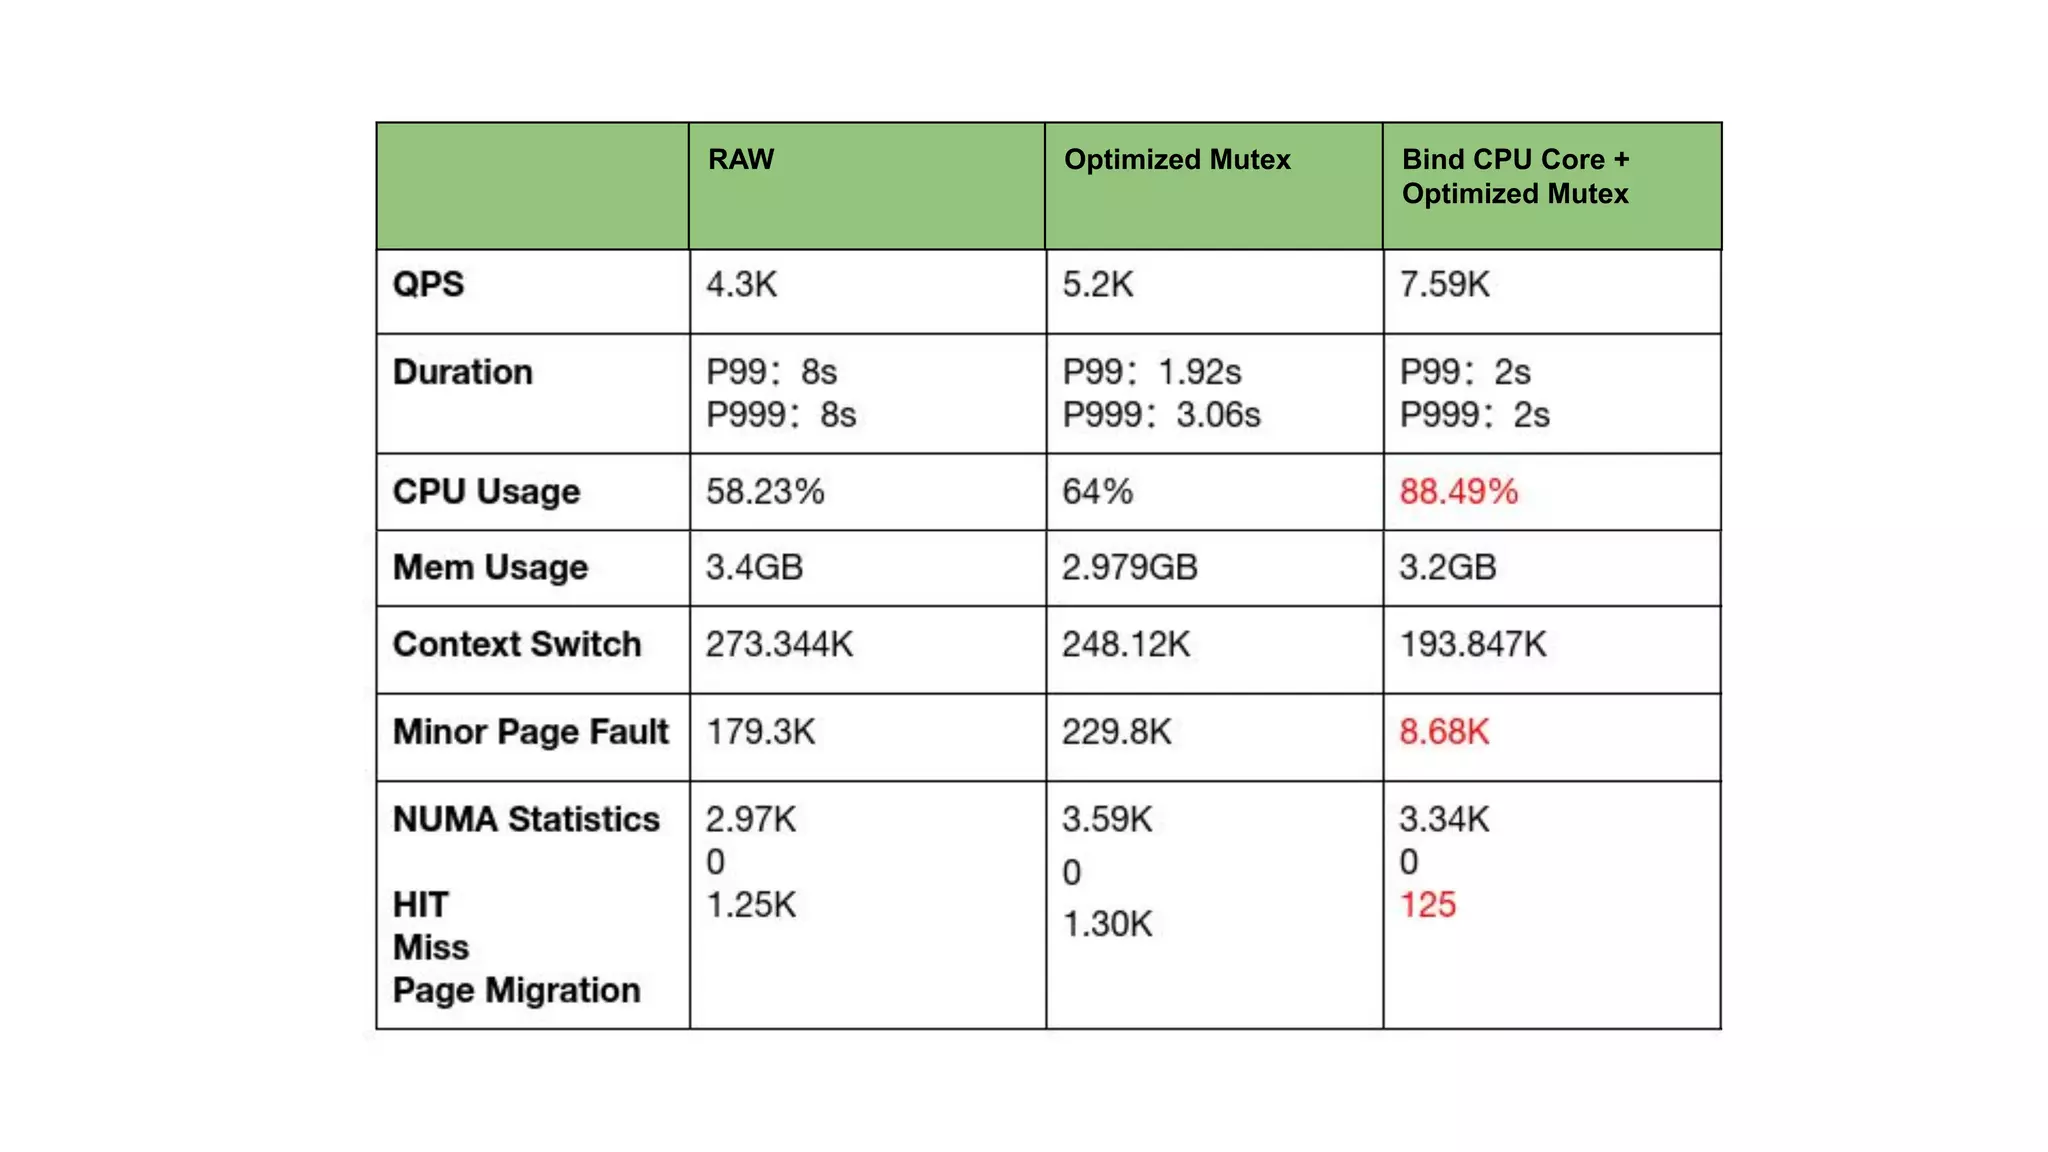
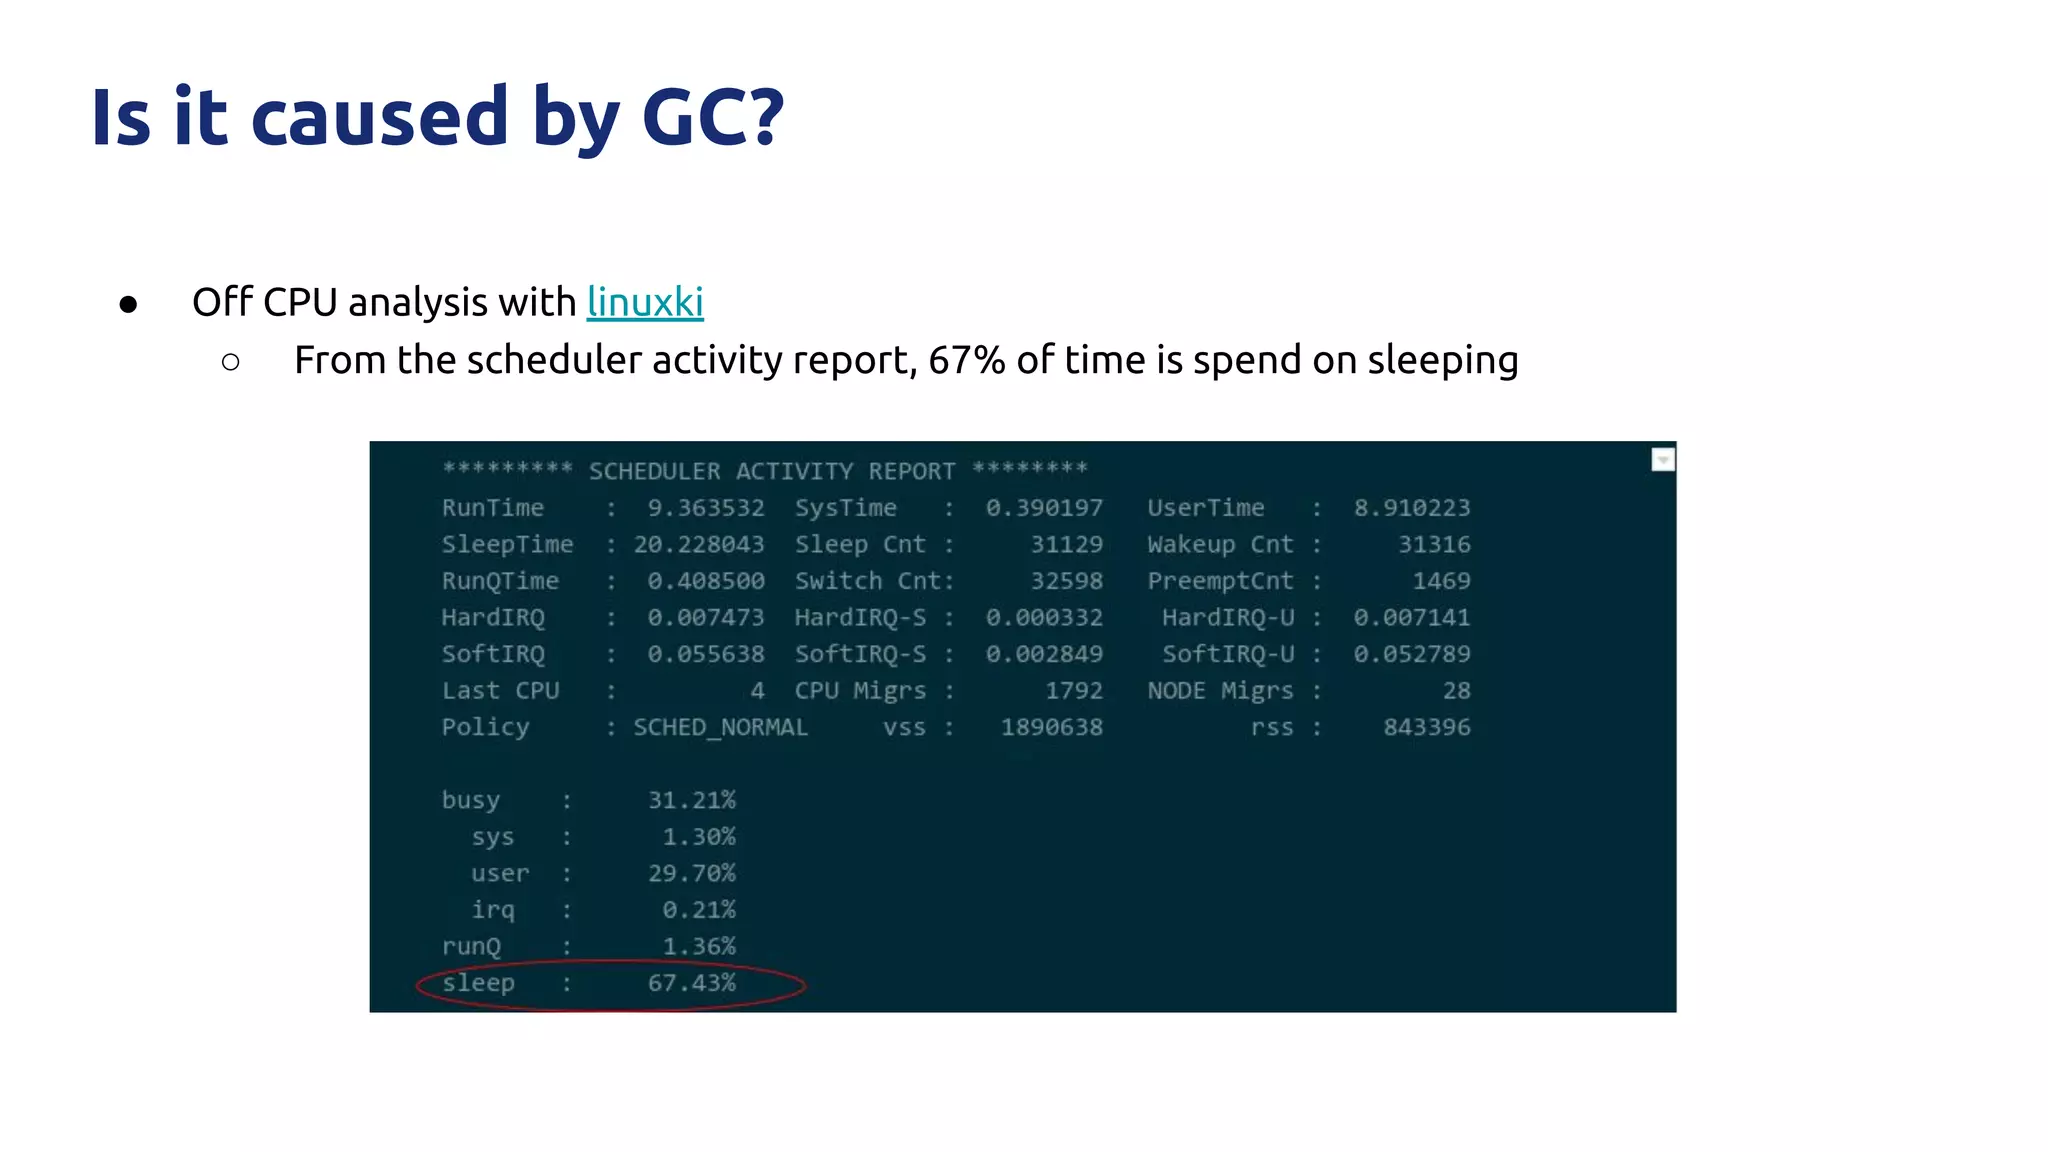
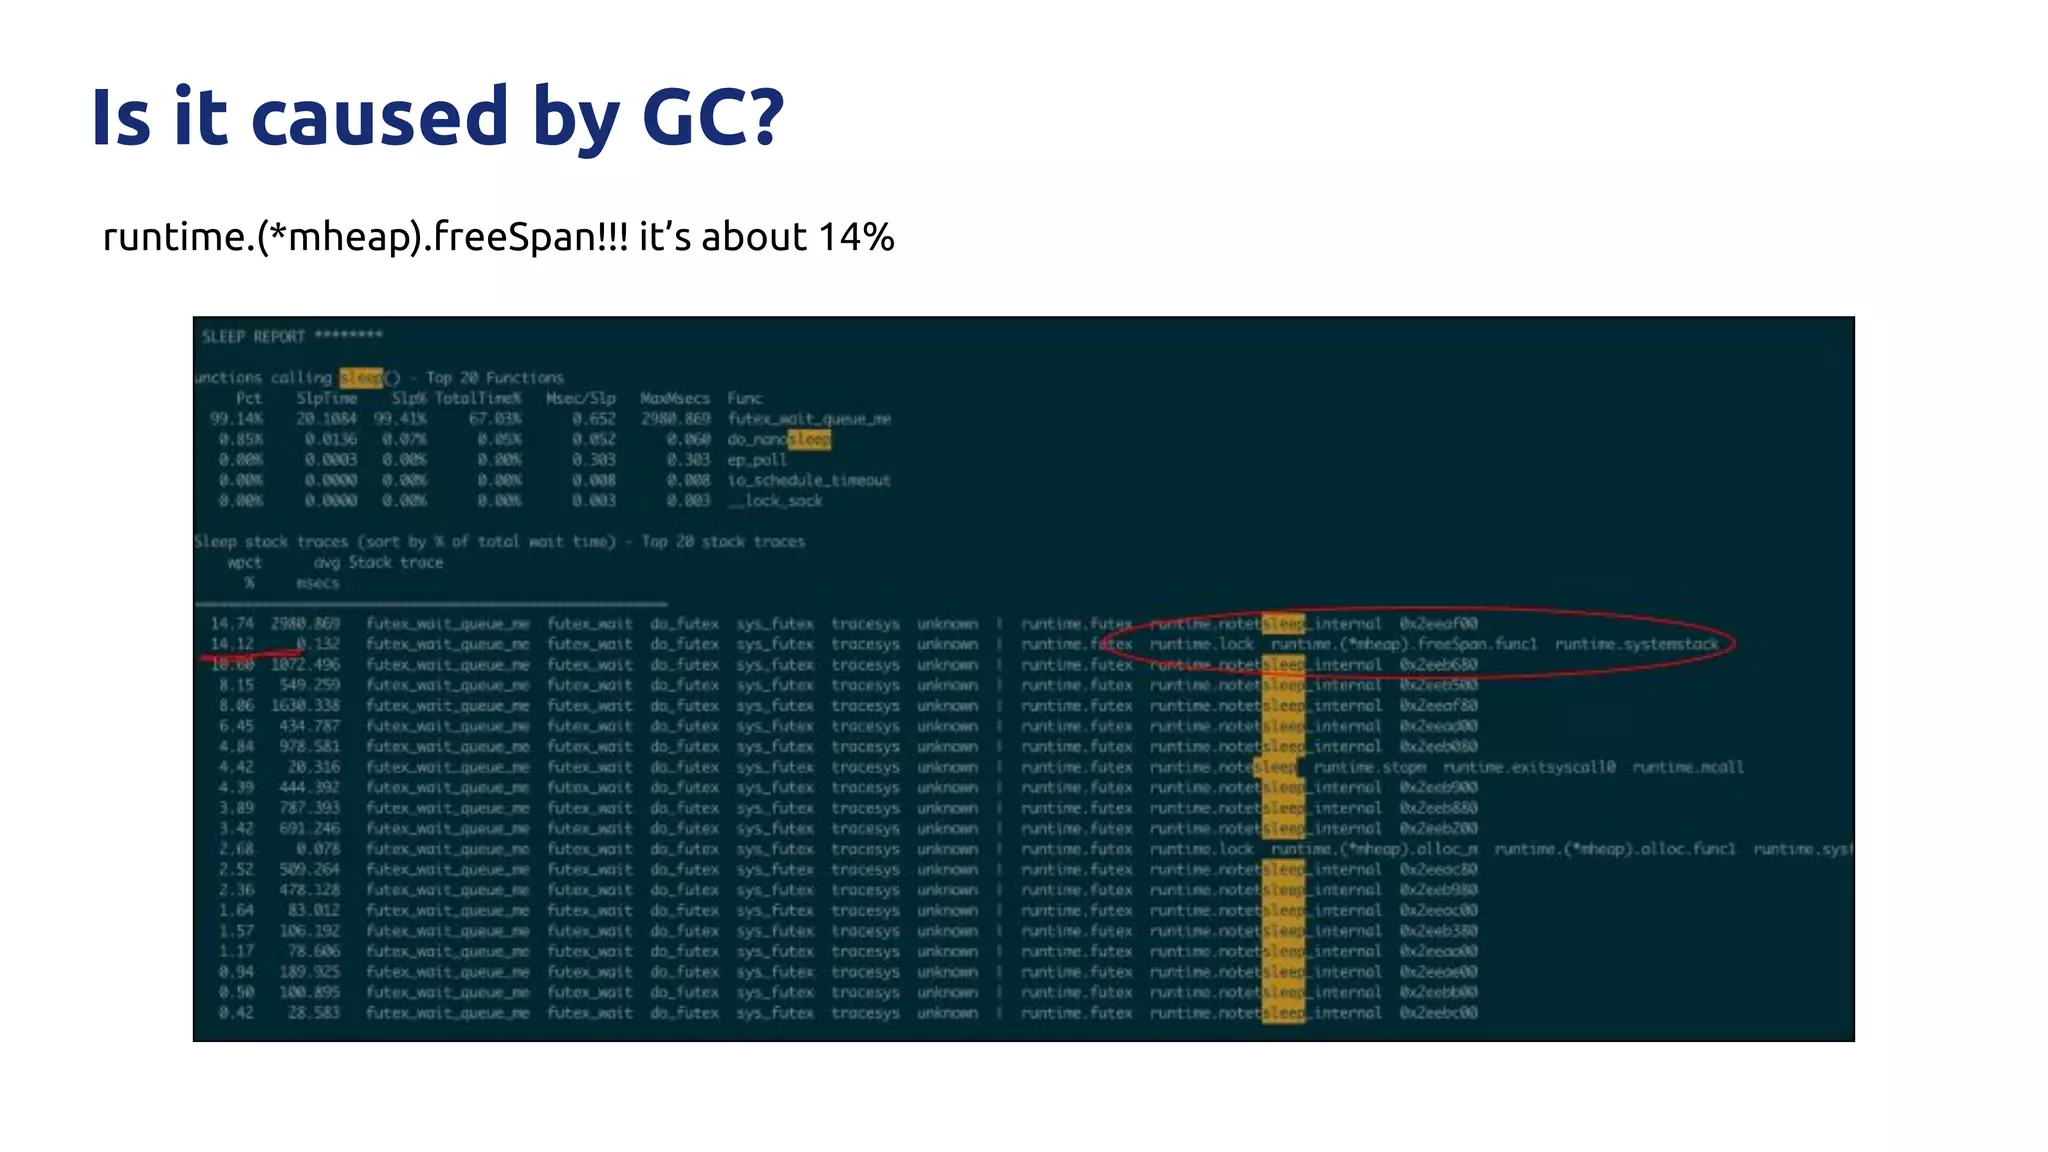
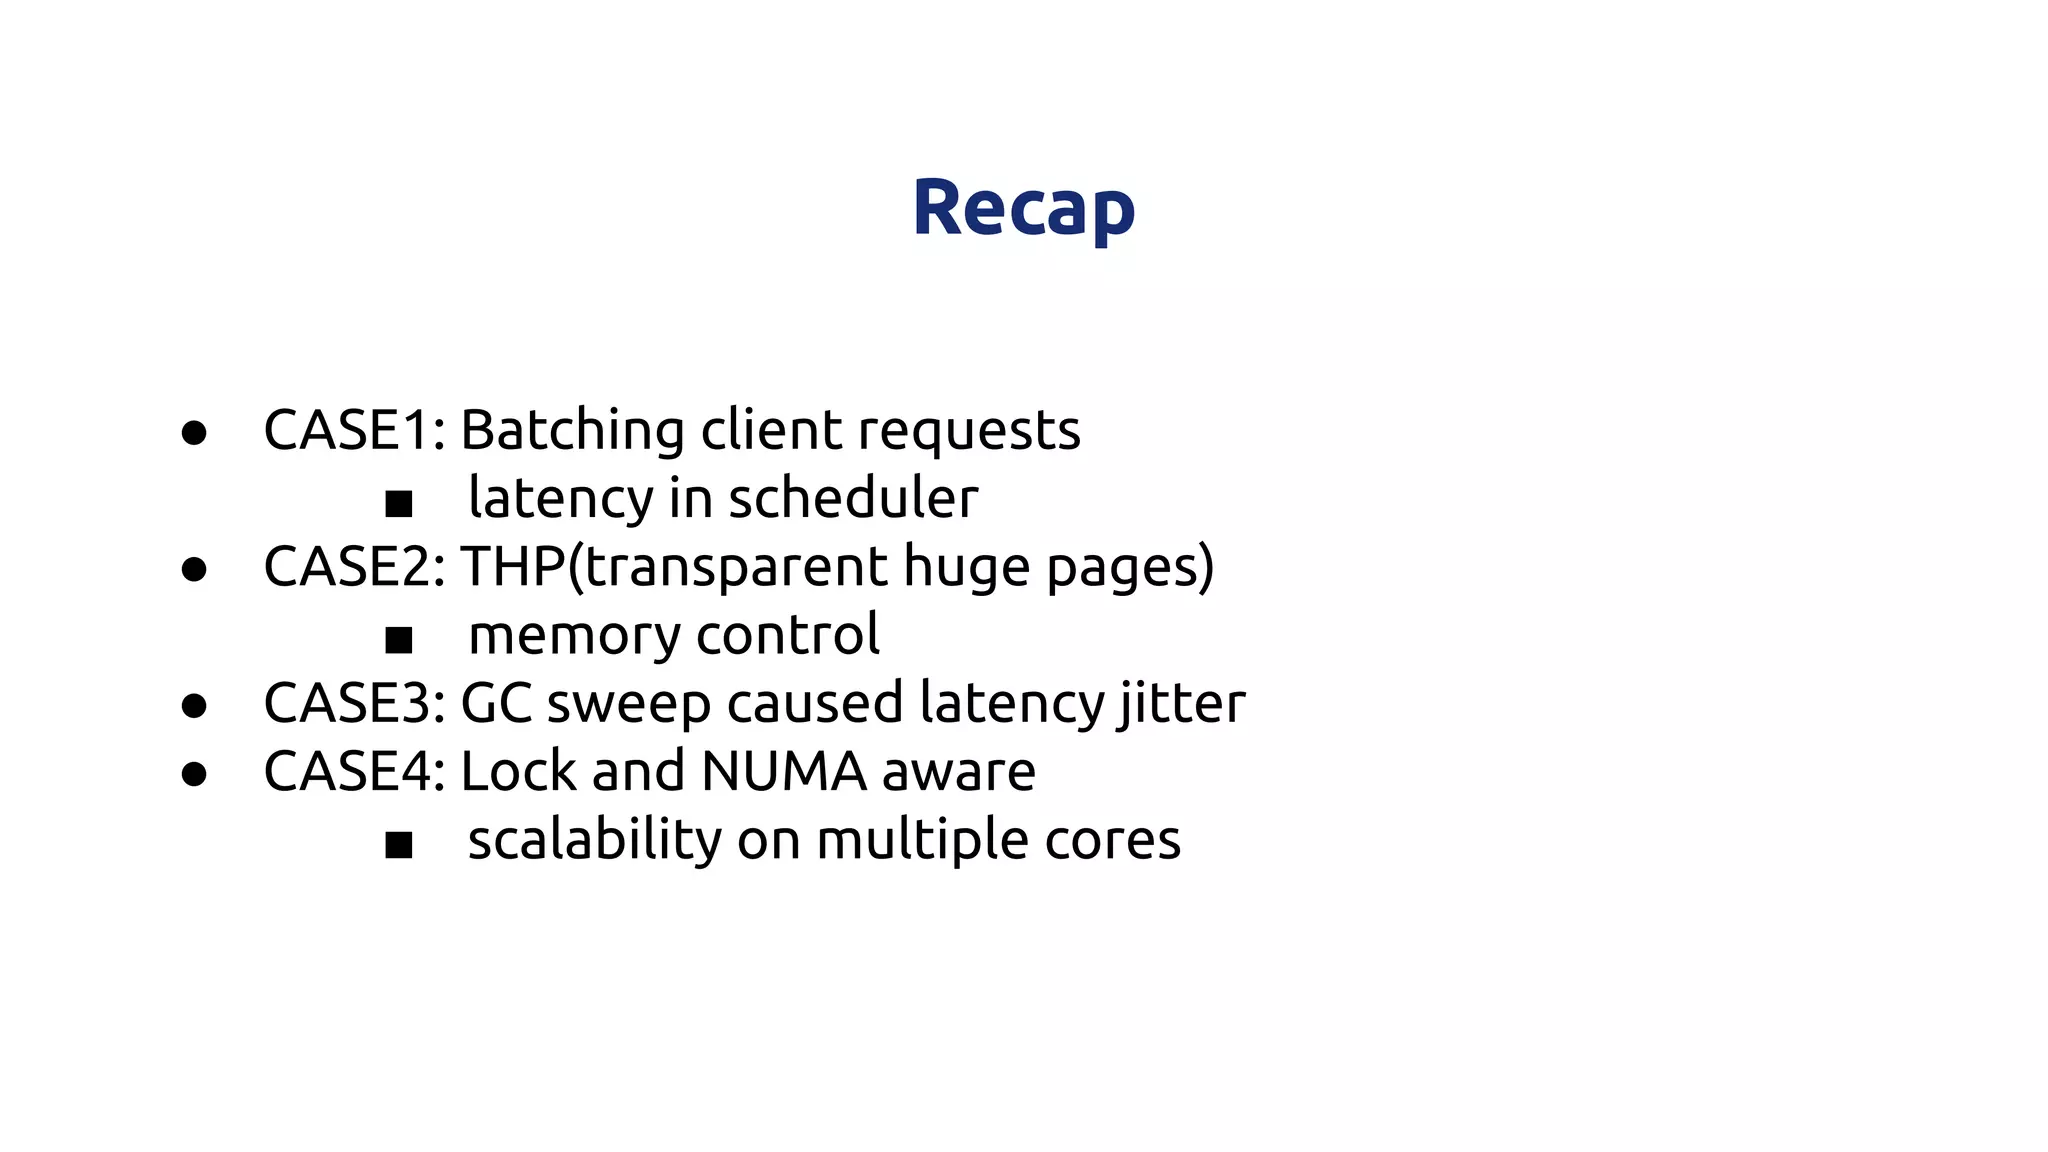

The document discusses various performance-related issues in the Go runtime within TiDB, focusing on scheduler latency, memory control with Transparent Huge Pages (THP), and garbage collection (GC) related latency jitter. It details case studies revealing the effects of high loads on scheduling decisions, memory management challenges, and how GC can disrupt service by introducing latency variations. Recommendations for improvements, such as disabling THP and optimizing mutexes and CPU bindings, are also provided to enhance performance.


![[124]네이버에서 사용되는 여러가지 Data Platform, 그리고 MongoDB](https://cdn.slidesharecdn.com/ss_thumbnails/124mongodb-181011042943-thumbnail.jpg?width=640&height=640&fit=bounds)


![[Paper Reading] Efficient Query Processing with Optimistically Compressed Has...](https://cdn.slidesharecdn.com/ss_thumbnails/icde-2020-220209161641-thumbnail.jpg?width=640&height=640&fit=bounds)
![[Paper Reading]Orca: A Modular Query Optimizer Architecture for Big Data](https://cdn.slidesharecdn.com/ss_thumbnails/orca-211220090600-thumbnail.jpg?width=640&height=640&fit=bounds)
![[Paper Reading]KVSSD: Close integration of LSM trees and flash translation la...](https://cdn.slidesharecdn.com/ss_thumbnails/kvssdcloseintegrationoflsmtreesandflashtranslationlayerforwrite-efficientkvstore-211206083654-thumbnail.jpg?width=640&height=640&fit=bounds)
![[Paper Reading]Chucky: A Succinct Cuckoo Filter for LSM-Tree](https://cdn.slidesharecdn.com/ss_thumbnails/chuckyasuccinctcuckoofilterforlsm-tree-211122111631-thumbnail.jpg?width=640&height=640&fit=bounds)
![[Paper Reading]The Bw-Tree: A B-tree for New Hardware Platforms](https://cdn.slidesharecdn.com/ss_thumbnails/thebw-treeab-treefornewhardwareplatforms-211115032950-thumbnail.jpg?width=640&height=640&fit=bounds)
![[Paper Reading] QAGen: Generating query-aware test databases](https://cdn.slidesharecdn.com/ss_thumbnails/datagenerator-211105075703-thumbnail.jpg?width=640&height=640&fit=bounds)
![[Paper Reading] Leases: An Efficient Fault-Tolerant Mechanism for Distribute...](https://cdn.slidesharecdn.com/ss_thumbnails/paperreadingleases-211101103843-thumbnail.jpg?width=640&height=640&fit=bounds)
![[Paper reading] Interleaving with Coroutines: A Practical Approach for Robust...](https://cdn.slidesharecdn.com/ss_thumbnails/paperreadinginterleavingwithcoroutinesapracticalapproachforrobustindexjoin-211011055753-thumbnail.jpg?width=640&height=640&fit=bounds)
![[Paperreading] Paxos made easy (by sen han)](https://cdn.slidesharecdn.com/ss_thumbnails/paperreadingpaxosmadeeasybysenhan-210926142716-thumbnail.jpg?width=640&height=640&fit=bounds)
![[Paper Reading] Generalized Sub-Query Fusion for Eliminating Redundant I/O fr...](https://cdn.slidesharecdn.com/ss_thumbnails/resin-210920113222-thumbnail.jpg?width=640&height=640&fit=bounds)
![[Paper Reading] Steering Query Optimizers: A Practical Take on Big Data Workl...](https://cdn.slidesharecdn.com/ss_thumbnails/steersigmod21-210913065908-thumbnail.jpg?width=640&height=640&fit=bounds)


