Download to read offline
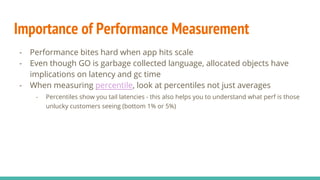
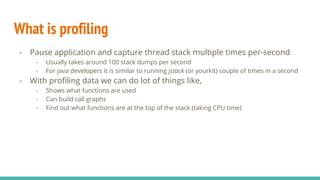


The document discusses performance tooling in Go, emphasizing the importance of measuring latency using percentiles and profiling to understand application performance at scale. It introduces Go's profiling tools, such as pprof, which helps capture CPU and memory usage, and offers insights on garbage collection and performance tuning strategies. Recommendations include using simpler data structures, reusing objects, and enabling web pprof to trace live processes for better performance management.


![Getting Started with Apache Spark: Big Data Made Simple [Free Meetup]](https://cdn.slidesharecdn.com/ss_thumbnails/apachesparkgettingstarted-260203175547-8361bcc3-thumbnail.jpg?width=640&height=640&fit=bounds)


