Download to read offline


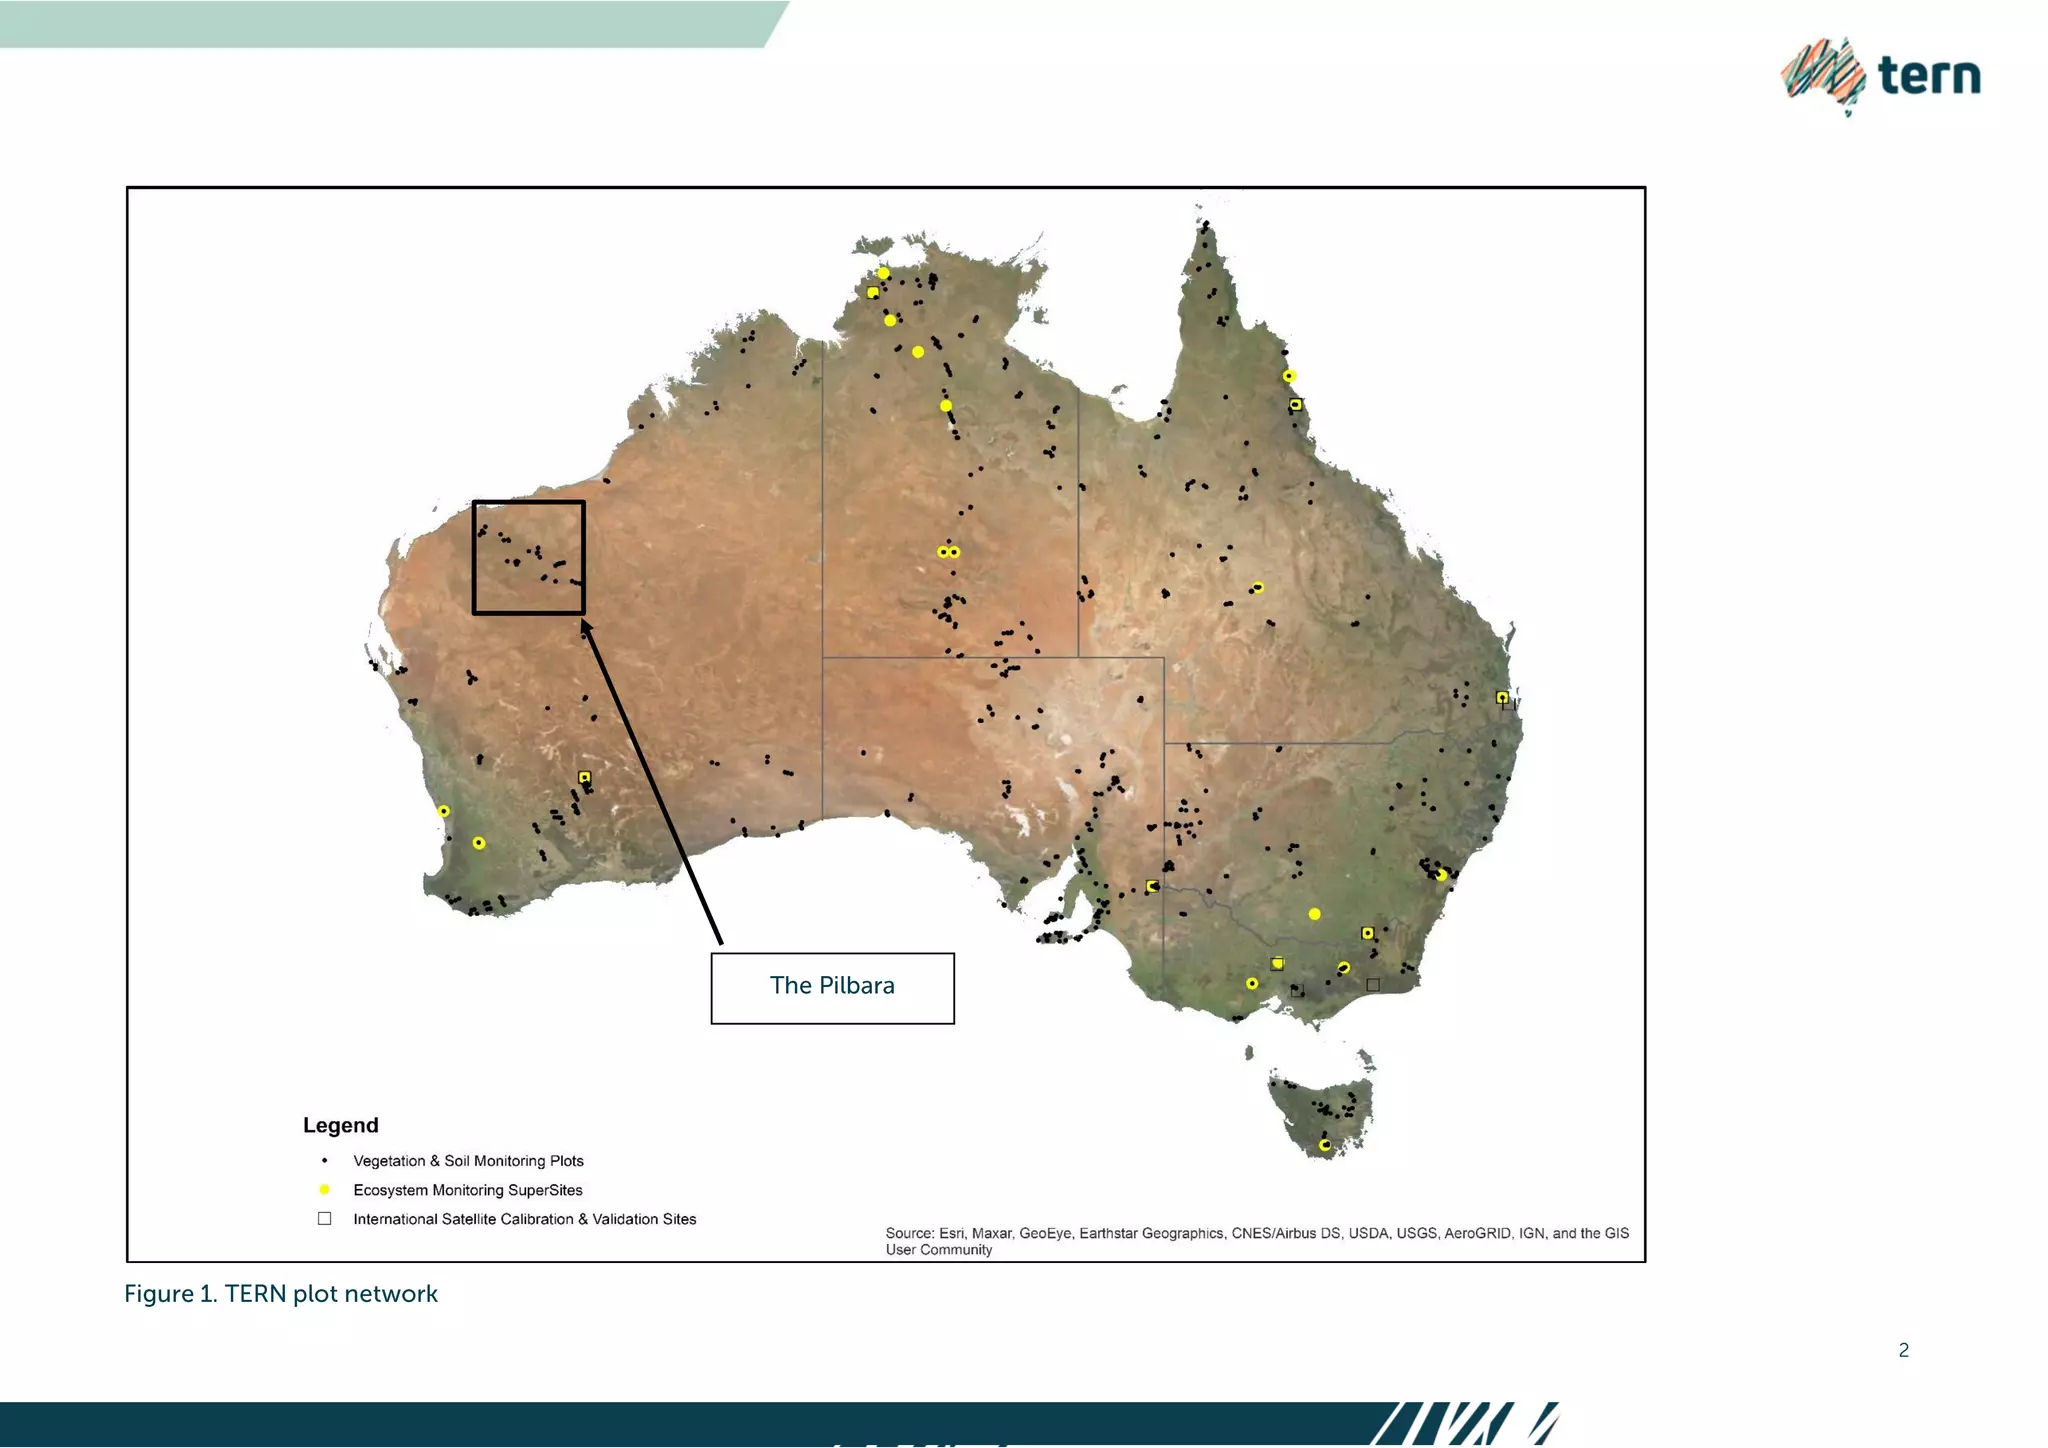
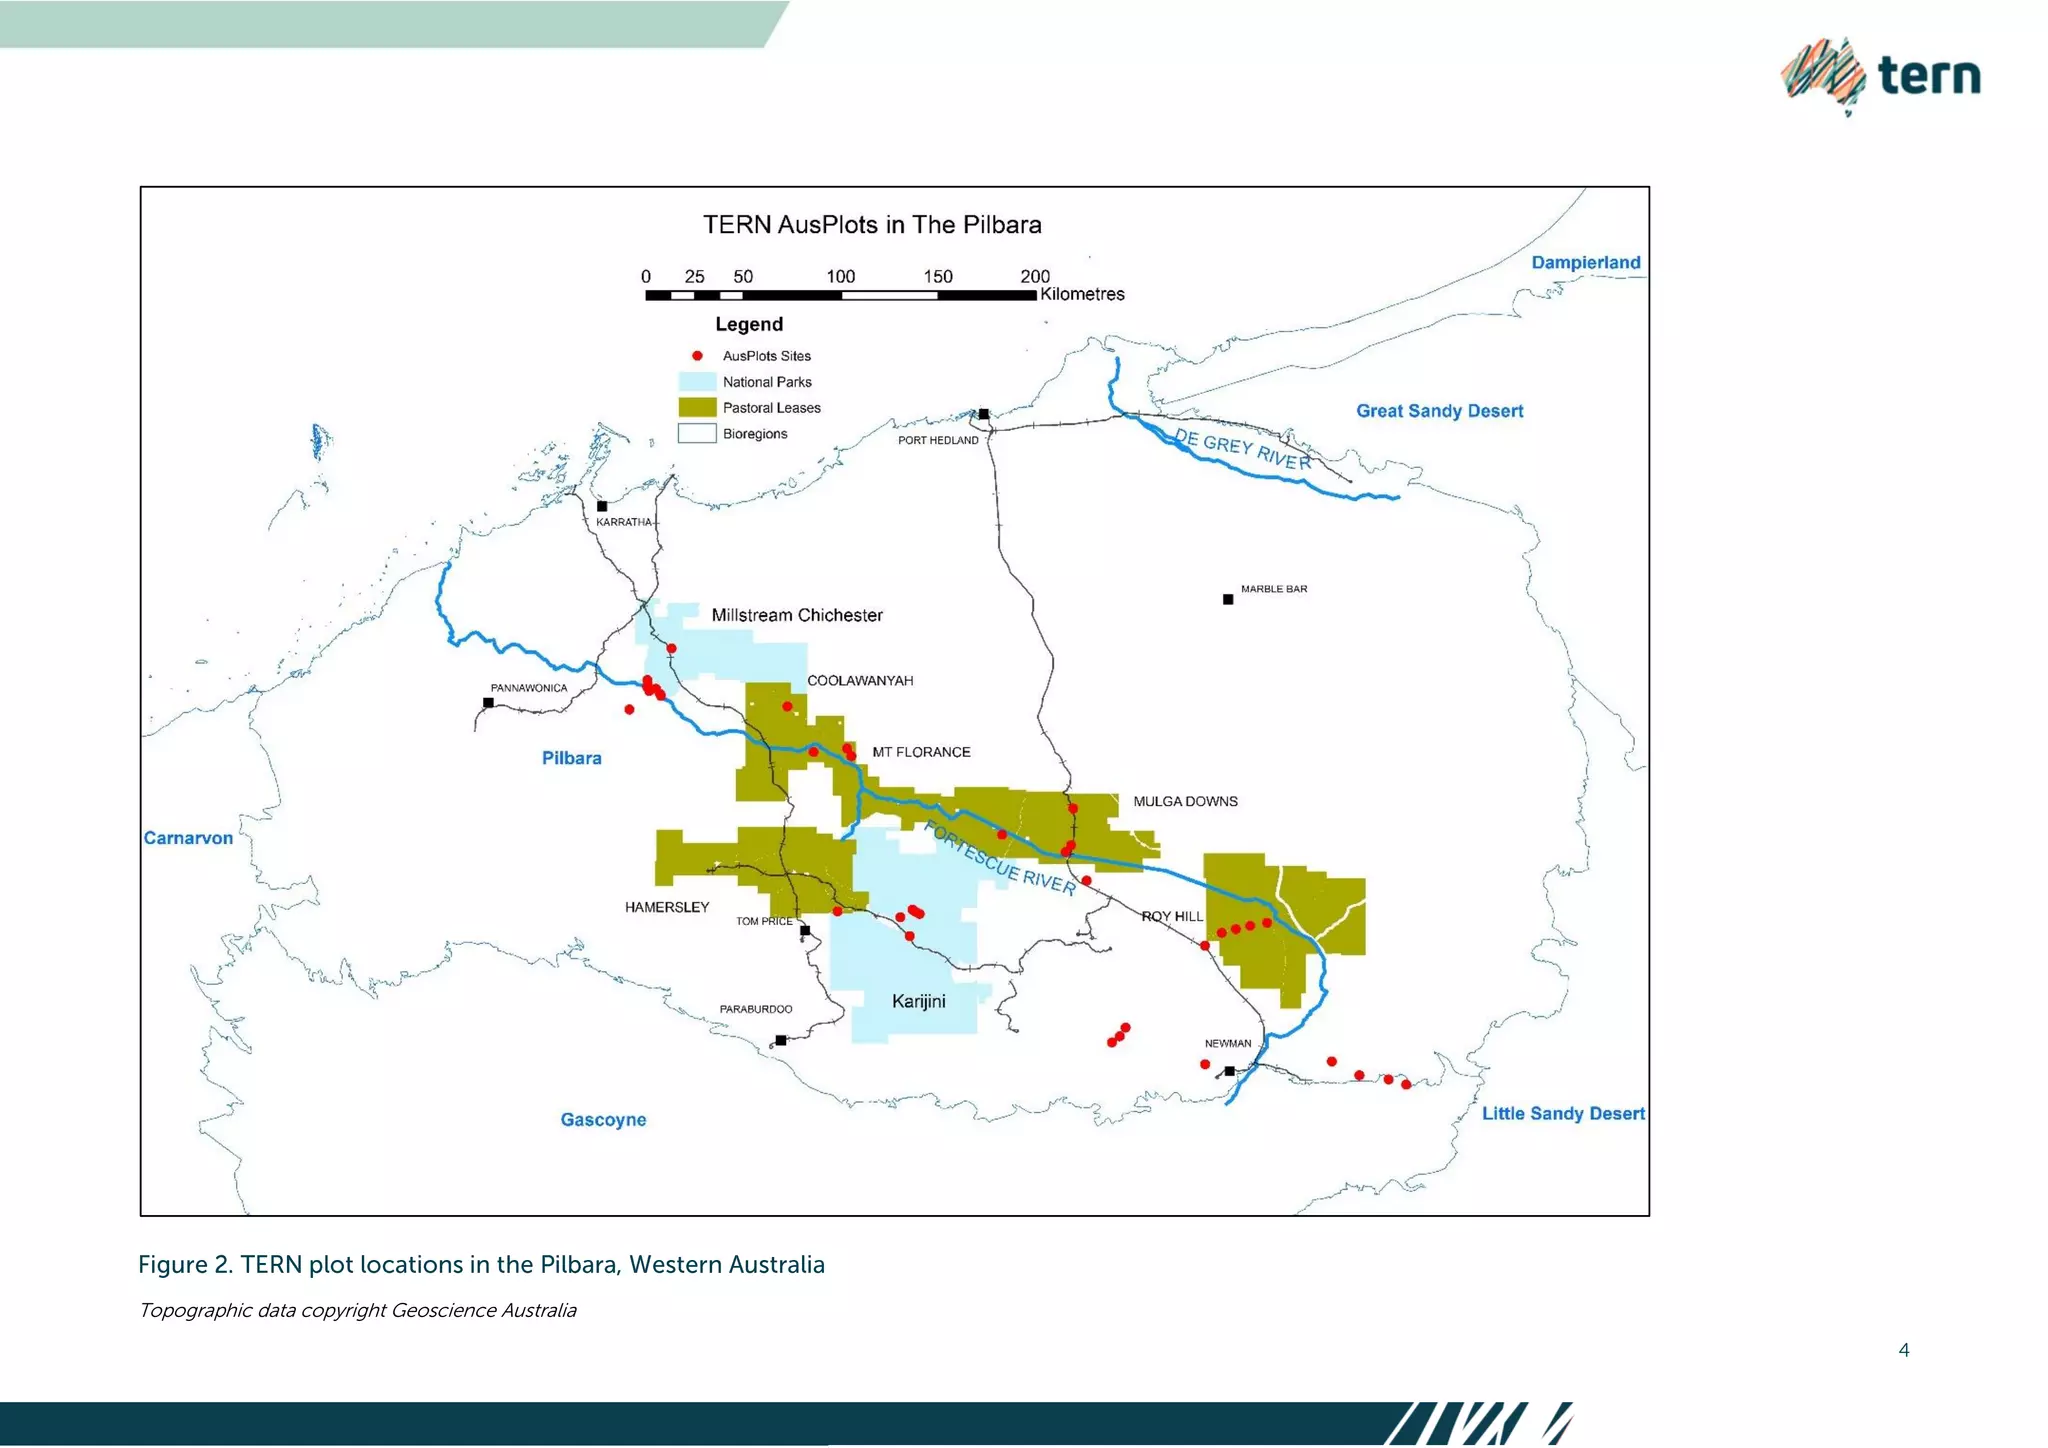


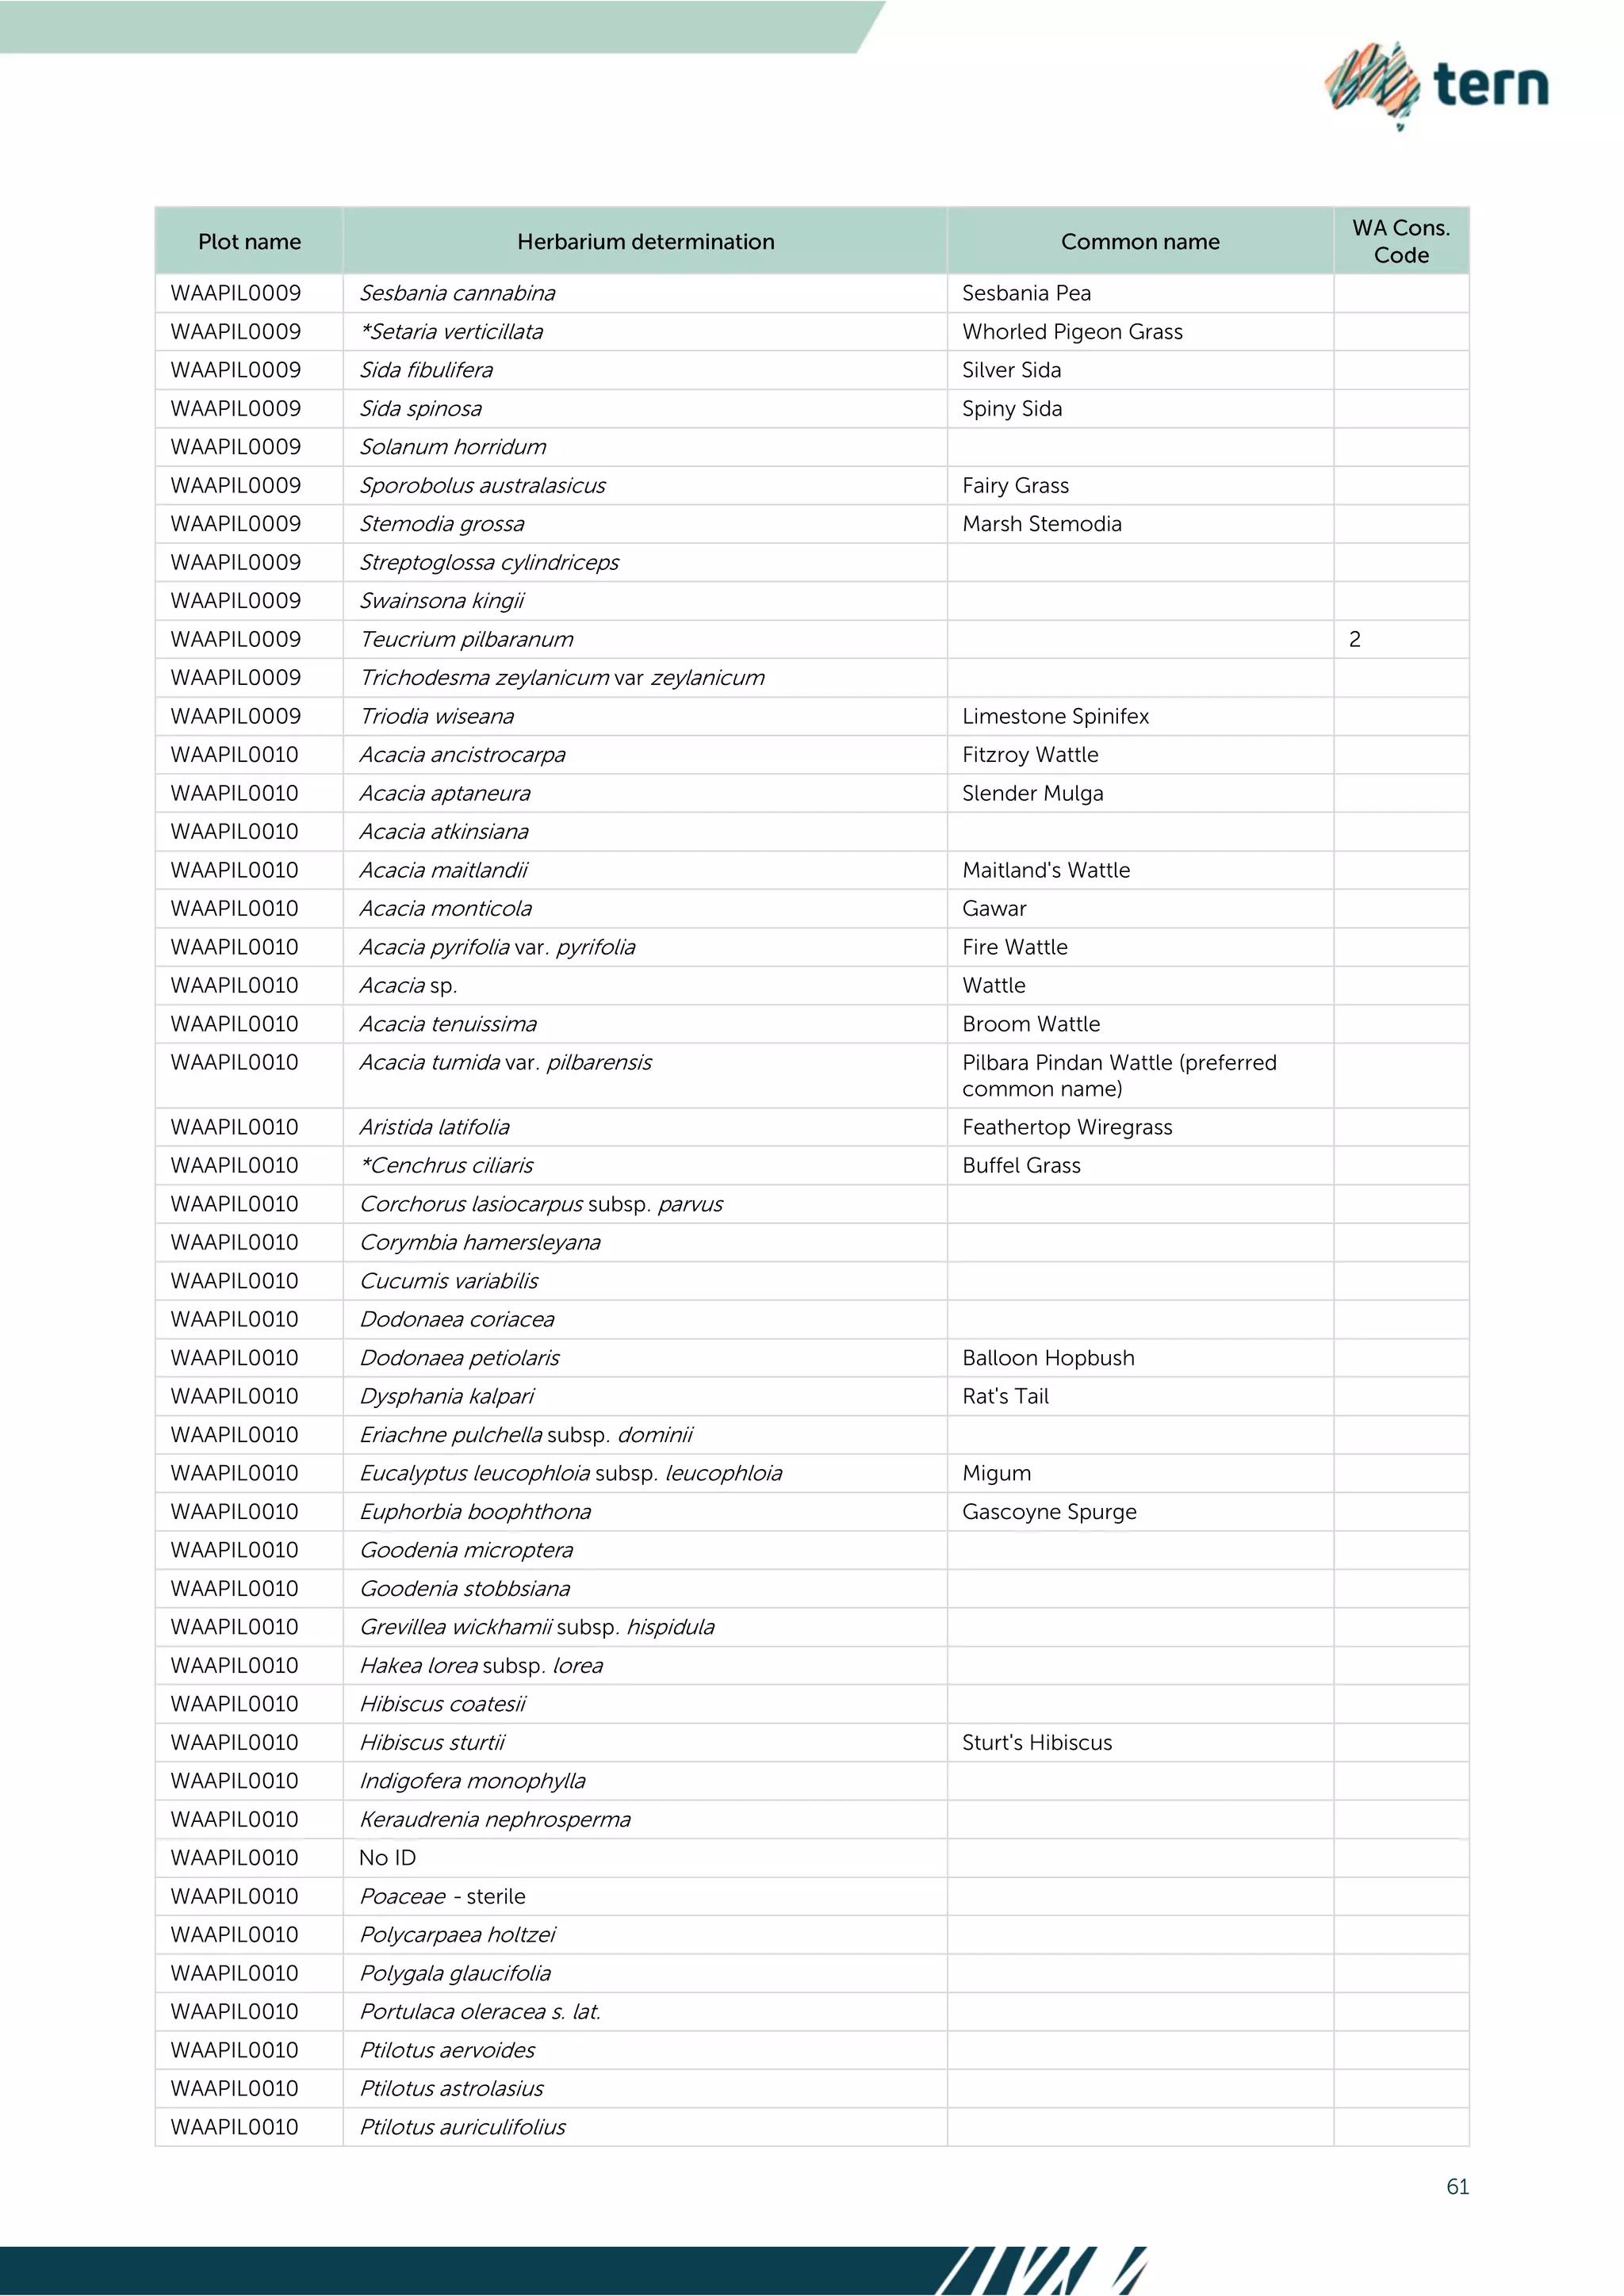
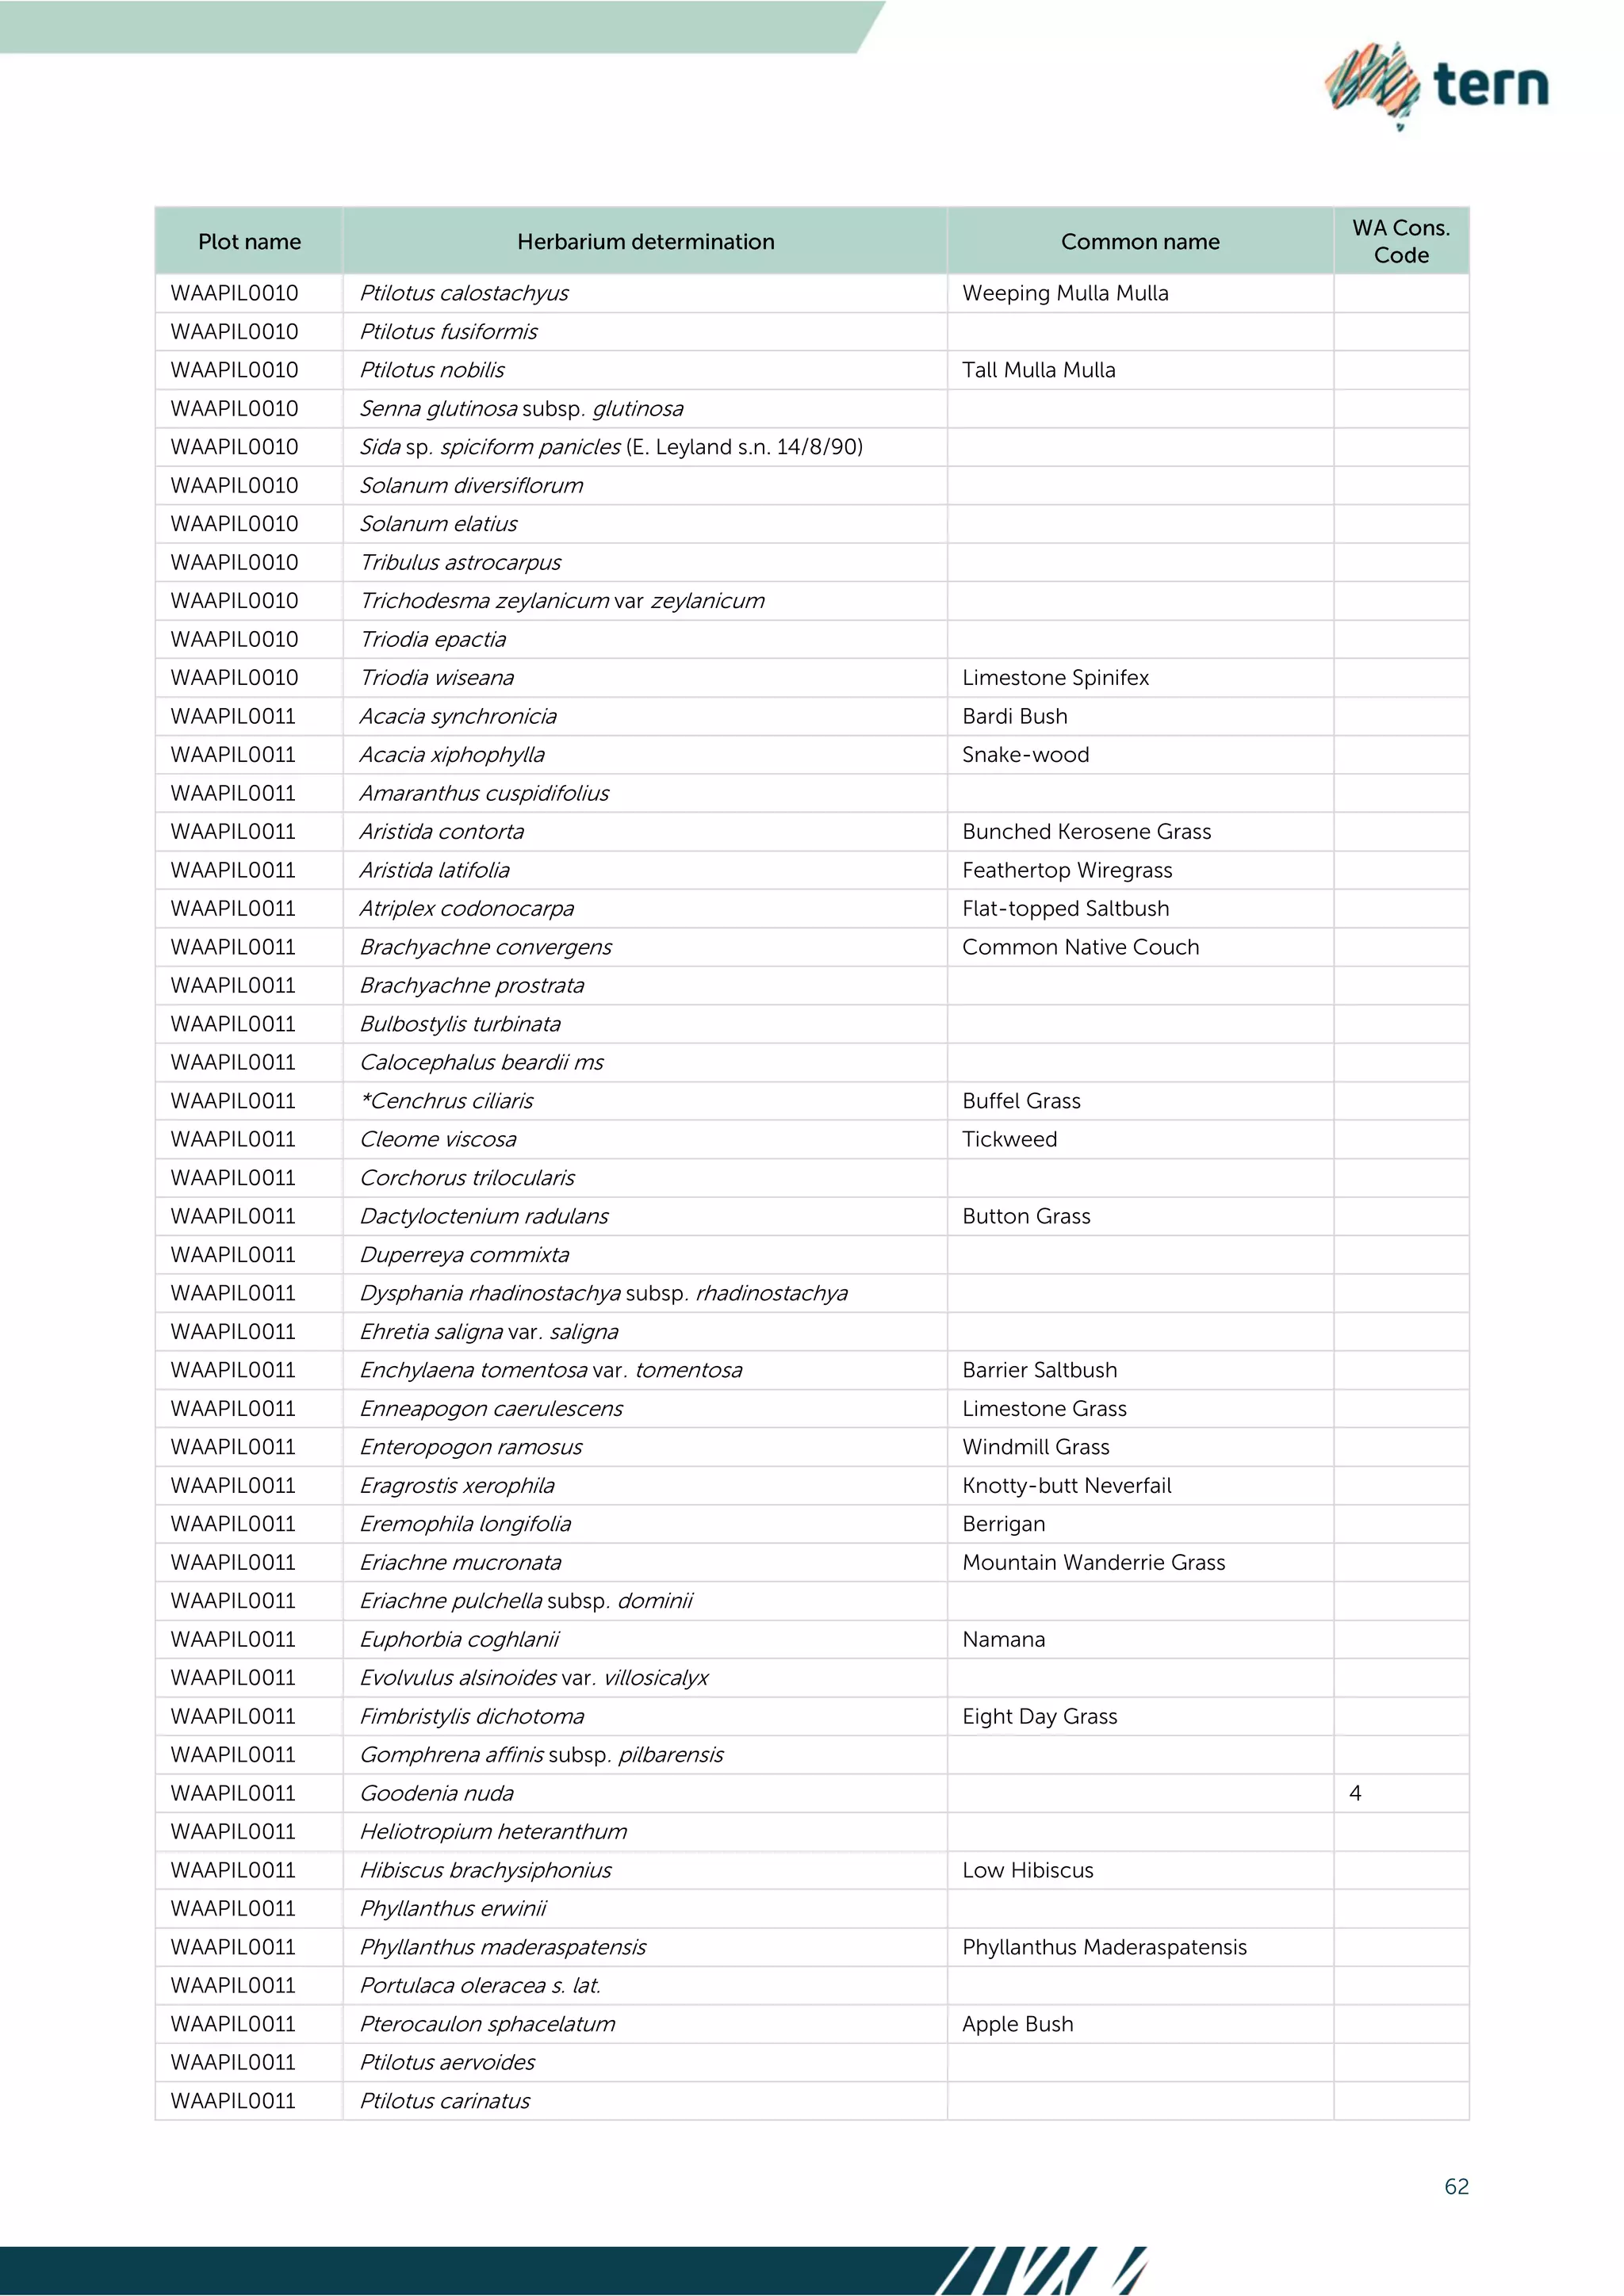
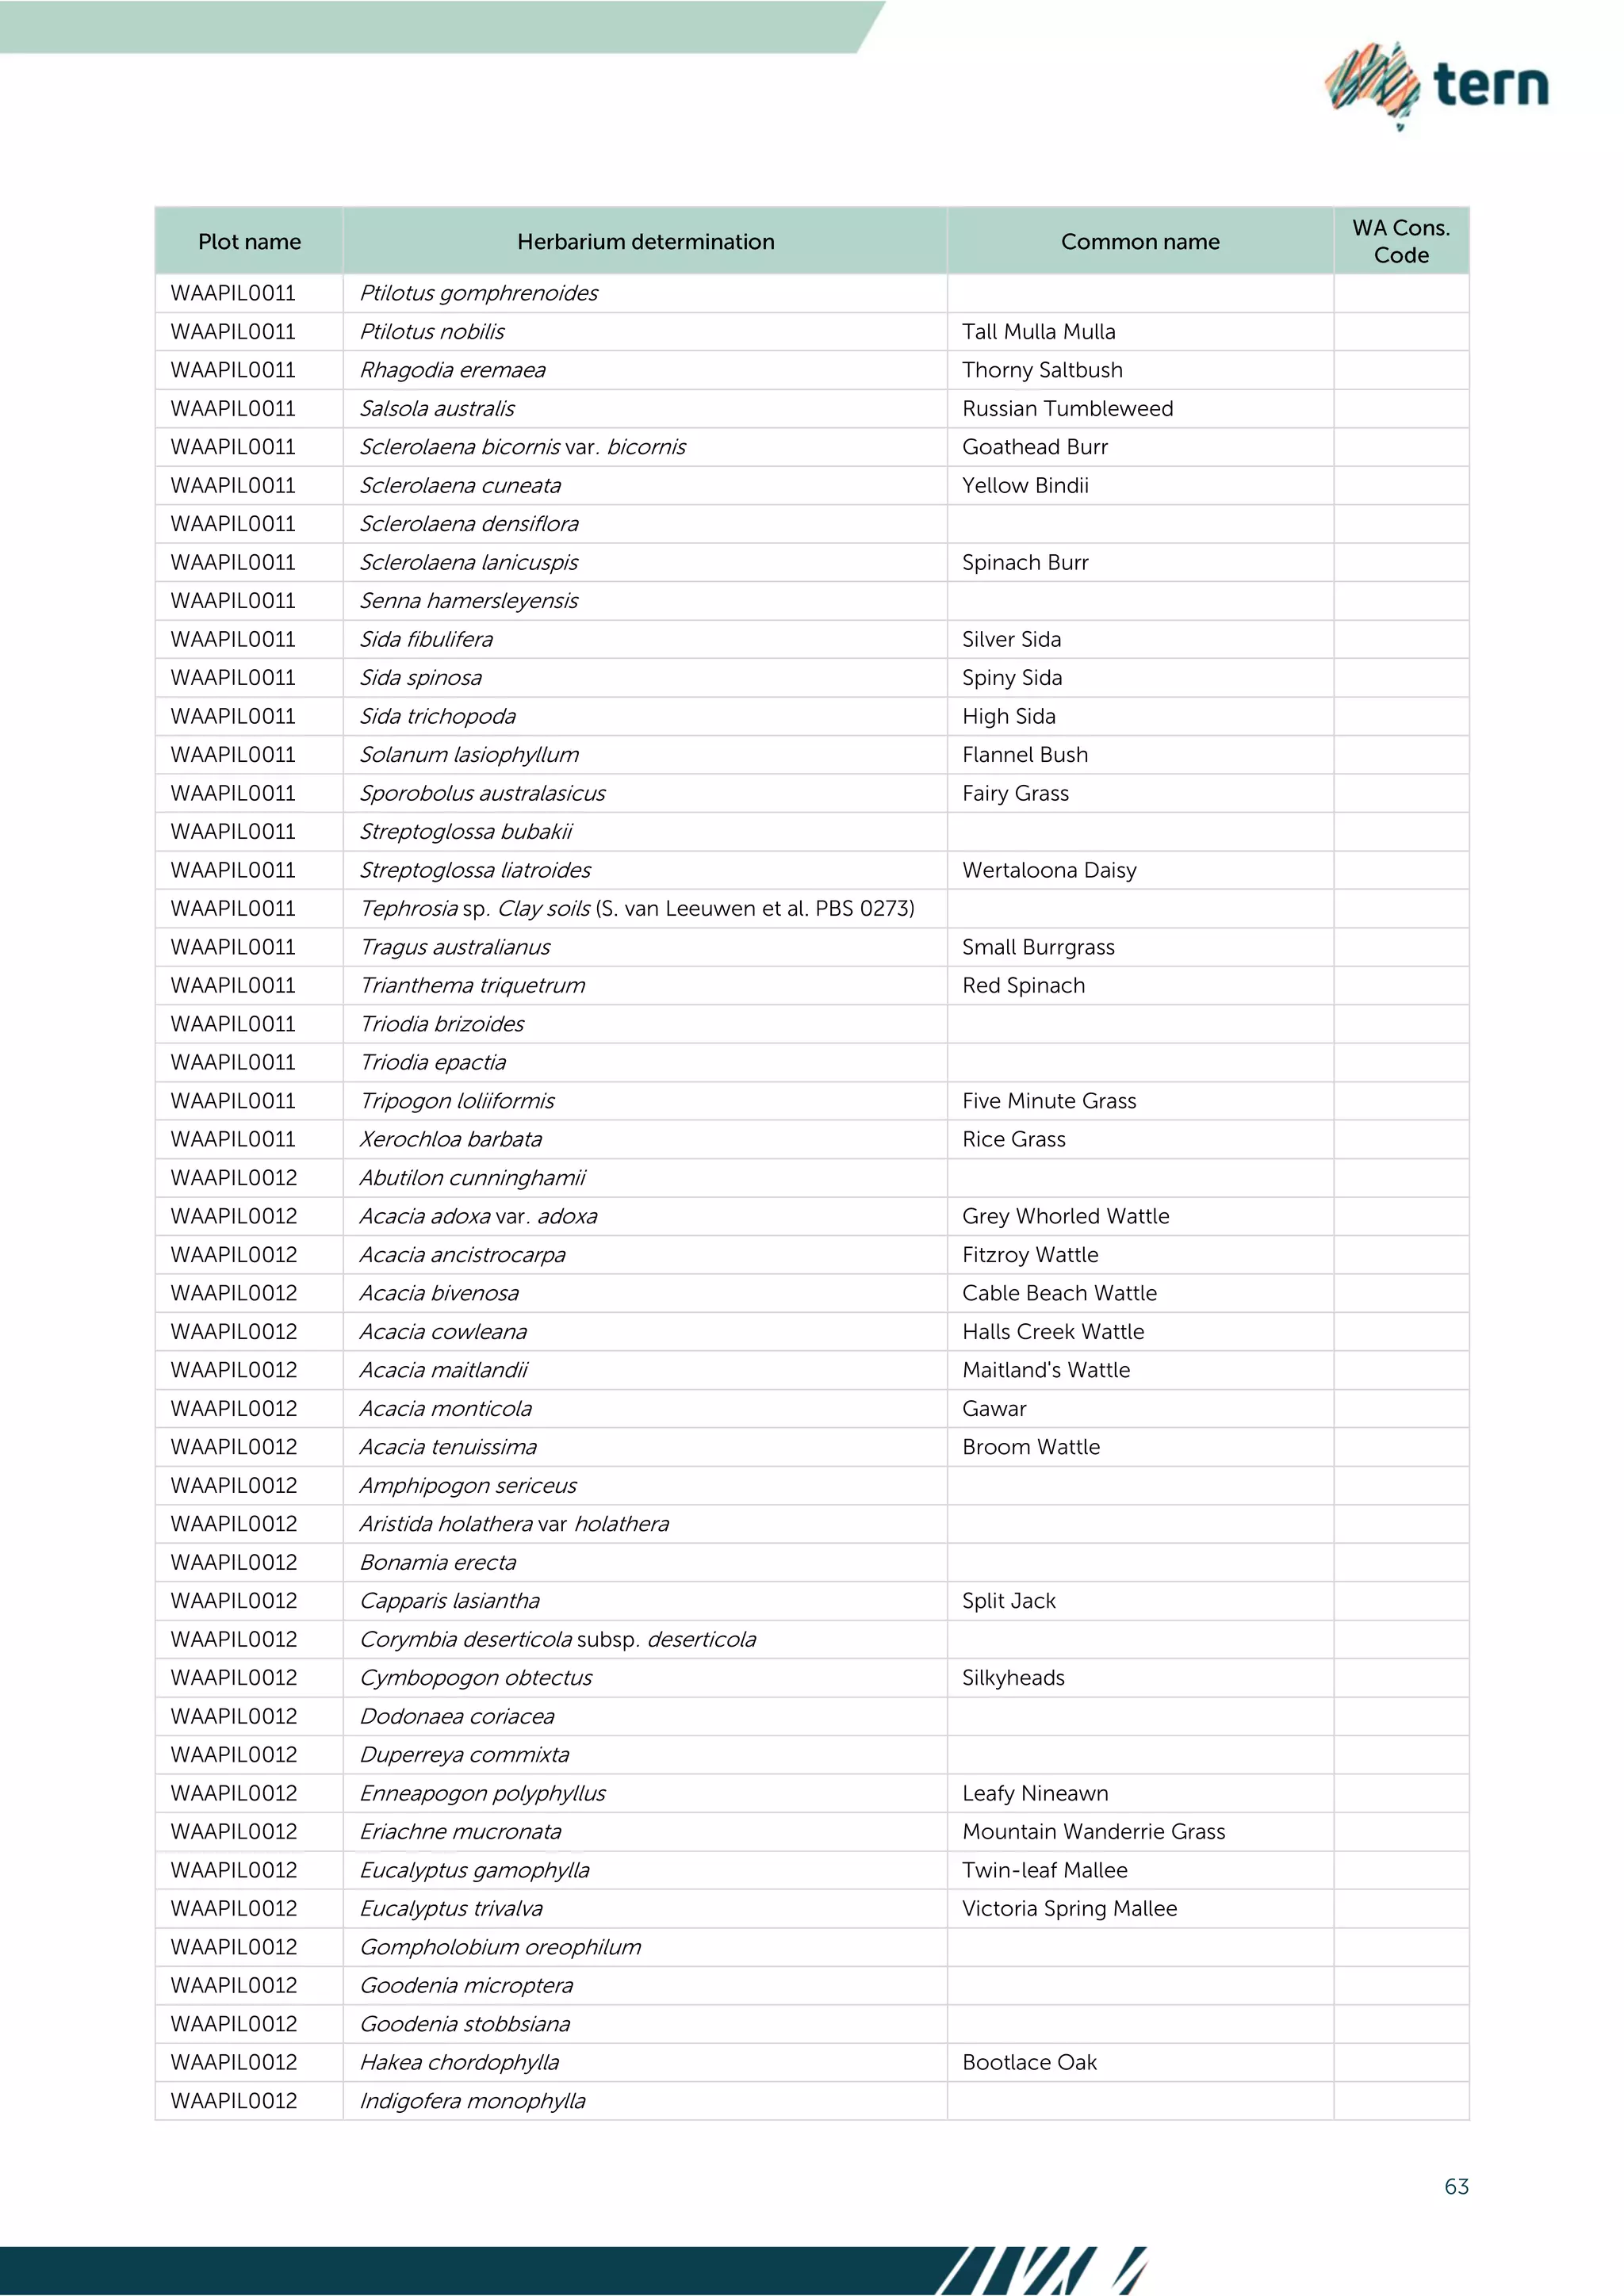
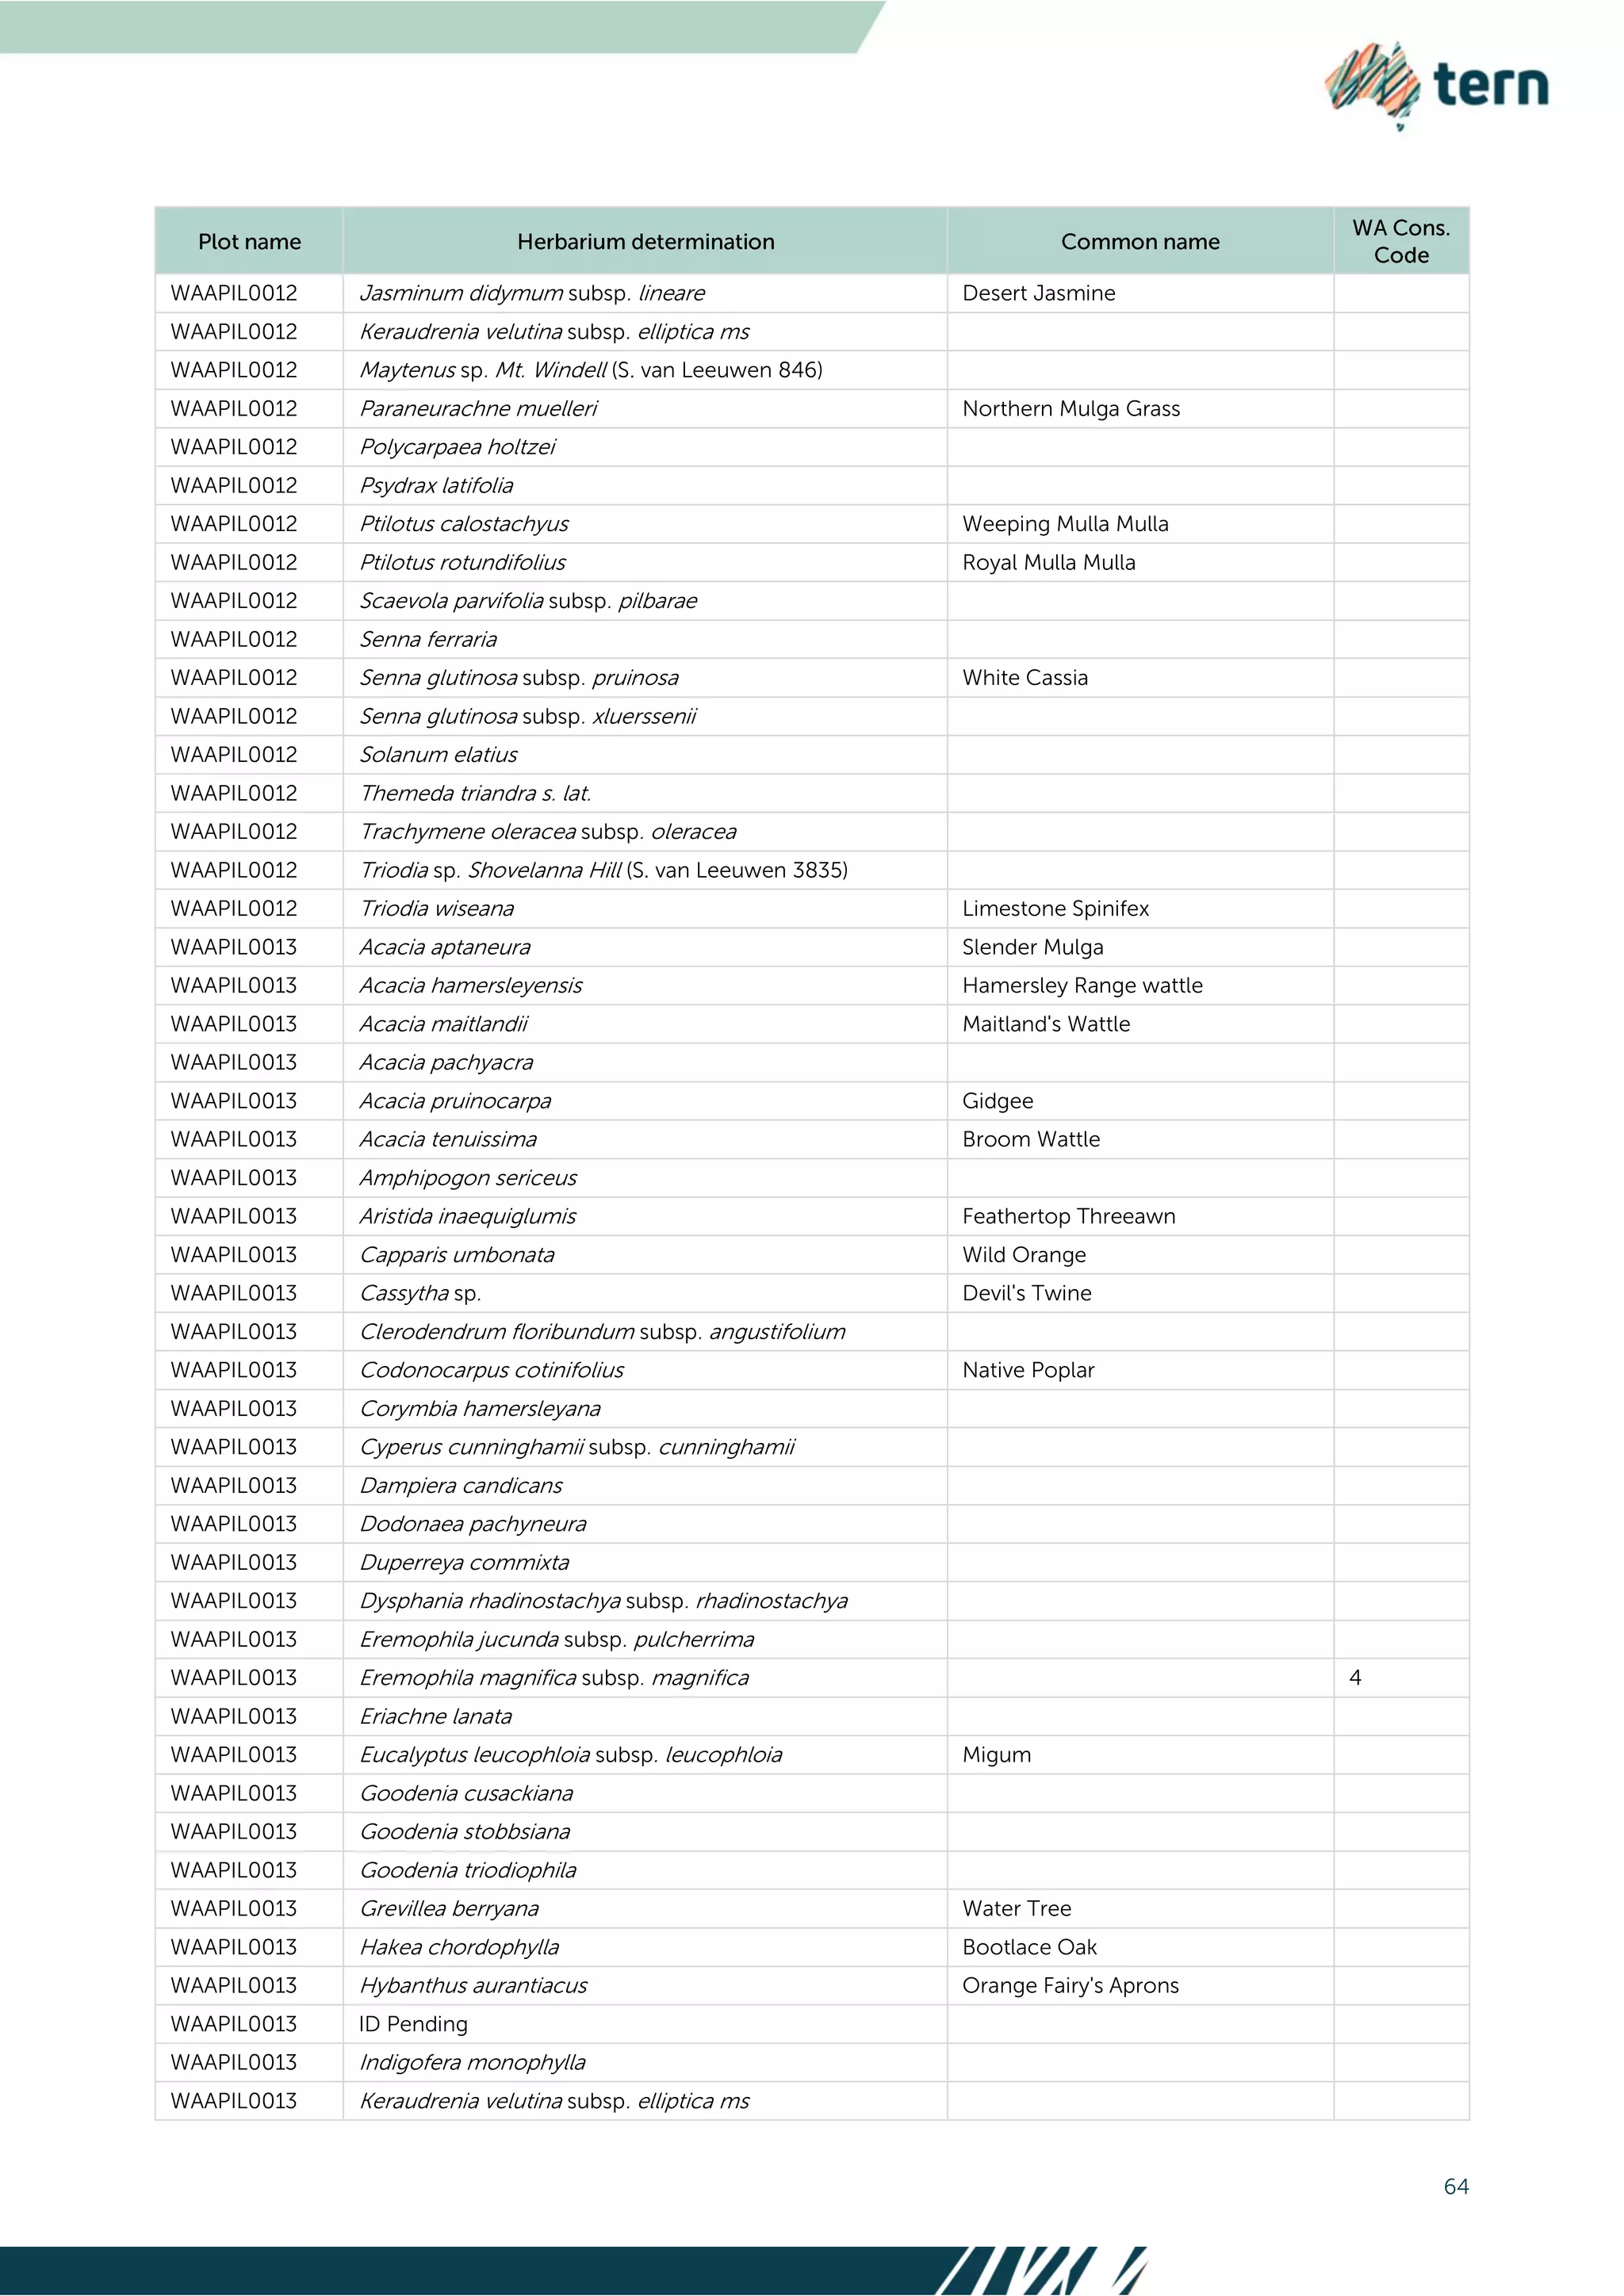

The document presents a summary of TERN's (Australian Government's National Collaborative Research Infrastructure Strategy project) ecosystem data collection in the Pilbara region from April 2015 to June 2021. It details the methodologies used for collecting soil and vegetation data across over 835 plots, highlights key partnerships, and discusses various research applications utilizing TERN data. The report also includes information on accessing the data and the types of analyses that have been conducted using the collected samples.


