SlideShare a Scribd company logo
Environment Product Line, LEME, Brazil 1
A NEW TOOL TO EVALUATE SOCIAL
AND ENVIRONMENTAL IMPACTS CAUSED
BY THE BUILDING OF A LARGE HPP
A viable way to measure sustainability is, for the first time,
added to the set of tools used to evaluate impacts in
social, economic, and environmental fields caused by the
building of a large HPP. This sweeping initiative responds
to the need for attaining a measure of sustainability,
which has been increasingly embraced as an imperative
goal, worldwide. Yet actual measurements are not merely
occasional but have not been regularly added to any ef-
fort to compare performance of cost-effective strategies,
ENVIRONMENT PRODUCT
LINE, LEME, BRAZIL
Building area of HPP Belo Monte in Xingu River (Pará state, Brazil).
Source: Analysis Team of the Environment Business Unit (LEME, Brazil), 2015.
Calculation of a sustainability index as a tool in decision-making during environmental
licensing processes: an initiative of the Analysis Team of the Environment Business Unit
(LEME, Brazil).
DETAILED DESCRIPTION OF THE INNOVATION
political decisions, or mitigation actions.
The Environmental Sustainability Index (ESI) presented
here is a measure of overall long-term ecological balance
developed and adjusted for the region surrounding a
stretch of 100 km of extension along the Xingu River in
Pará state, Brazil (Fig. 1), from now on called “Stretch of
Reduced Flow” (SRF). The SRF is a result of the general
arrangement of the HPP Belo Monte (Pará state, Brazil),
the biggest dam (11,233 MW) being built in Brazil and in
the Amazonian forest (2011 to 2015). The construction and
operation of the HPP conceived a diversion of waters from
the major reservoir (in the main channel of Xingu River), to
Betânia Souza (Project Leader); Maurício Moreira; Francisco Ribeiro;
Luciano Andrade & Cristiane Vieira (Unit Responsible)
Environment Product Line, LEME, Brazil 2
a secondary reservoir (in the inland), and therefore it will
cause a substantial reduction of water flow in Xingu River,
the so-called SRF (to be formed by the end of 2015).
The Environmental Analysis Team of LEME, Brazil, is re-
sponsible for the coordination of the licensing process of
this HPP. We proposed the ESI as a far-reaching, powerful
instrument that makes possible the assessment, through-
out time, of the impact of the HPP on the river natural
flow, hence on its biodiversity and human conditions be-
cause it represents a radical innovation towards a more
analytically driven approach to decision-making. For the
first time, the ongoing (since 2009) federal licensing pro-
cess of this HPP was presented with a feasible, integrat-
ed, and reproducible method (and results) to evaluate
tangible social and environmental impacts which are ac-
tually interconnected but are usually analysed only
separately.
Because there is a strong seasonality within the region,
and because we are interested on the environmental im-
pact of the formation of the SRF, we aimed for the first
ever comparison between the environmental sustainabil-
ity of rainy seasons (high waters) and of dry seasons with-
in the region in focus (Fig. 1), before and after the opera-
tion of the HPP.
Fig. 1 – The “Stretch of Reduced Flow” (SRF) along the Xingu River (Pará state, Brazil) formed by the diversion of waters during the operation of
the HPP Belo Monte.
Source: Analysis Team of the Environment Business Unit (LEME, Brazil), 2015.
Fig. 2 – Levels of calculation of the Environmental Sustainability Index (ESI)
created for the “Stretch of Reduced Flow” (SRF) region in Xingu River (Pará
state, Brazil) within the building area of HPP Belo Monte.
35 Variables 16 Indicators 6 Components ESI
1. World Economic Forum, 2001. Environmental Sustainability Index An
Initiative of the Global Leaders of Tomorrow Environment Task Force. Annual
Meeting, Davos, Switzerland. 255 p.
FIRST EVER MEASUREMENTS
OF ENVIRONMENTAL SUSTAINABILITY
OF THE SRF REGION
The method adopted to create the ESI suited to the
region in focus based on a multiple criteria approach
presented by the “Global Leaders of Tomorrow
Environment Task Force”, during the annual meeting
of the World Economic Forum (2001)1
. This approach
allowed simultaneous analysis of social, economic,
and environmental data. A high ESI rank indicates a
high level of environmental sustainability in a particu-
lar season or site; a low ESI rank in another season or
site (comparison over time or space) signals substan-
tial problems in achieving environmental sustainabil-
ity along multiple dimensions.
Our ESI score centers upon a set of six components as-
sociated with 16 core indicators, each of which combines
one to four variables for a total of 35 underlying variables
(Fig. 2 & Tab. 1). Indicators and variables were chosen
through careful review of scientific literature, available
data, and analysis of the first results. In addition, we con-
sidered further application and future comparison with
other enterprises for a full use of the method at least in a
countrywide manner, and therefore we considered com-
monality of variables due to relevance among other li-
censing processes in Brazil.
At the most basic level, we defined the scope in concep-
tual terms and we have determined that environmental
sustainability of the SRF region is a function of the varia-
bles, linked by indicators, of the following six components:
“Aquatic Habitats”, “Aquatic Fauna”, “Fish”, “Fishery”,
“Human Life Conditions”, and “Navigability” (Tab. 1).
SUCCESS OF IMPLEMENTATION
Environment Product Line, LEME, Brazil 3
COMPONENT INDICATOR VARIABLE
AQUATIC HABITATS
Water availability
01) Subterranean water level
02) Superficial discharge
03) Superficial water level
Climate
04) Rain level in Altamira
05) Rain level in Pimental
06) Rain level in Belo Monte
AQUATIC FAUNA Biodiversity of vertebrates
07) Relative abundance of turtles
08) Relative abundance of aquatic mammals
FISH
Water quality for fish 09) Dissolved oxygen concentration
Fish diversity
10) Number of species of fish
11) Abundance of fish
FISHERY
Fishery effort
12) Number of fishermen (commercial)
13) Number of fishermen (ornamental)
14) Number of days fishing (commercial)
15) Number of days fishing (ornamental)
Fishery production
16) Total weight (commercial)
17) Total weight (ornamental)
Fishery richness
18) Number of species (commercial)
19) Number of species (ornamental)
Rational exploitation of fish
20) Average length of the species with higher value
(commercial)
21) Average length of the most sold species (commercial)
22) Average length of the most sold species (ornamental)
HUMAN LIFE
CONDITIONS
Water quality for humans
23) Turbidity level
24) Escherichia coli concentration
25) Phosphorus concentration
26) Cyanobacteria concentration
Human health 27) Number of families visited by Health Agents
Education
28) Number of students in fluvial transport
29) Number of students
Productive activities
30) Number of families that presents fishery as a source of
income
Human water usage
31) Number of families in the urban areas with access to
water
32) Number of families in the rural areas with access to
water
NAVIGABILITY
Navigability dynamics 33) Number of vessels that passes by the SRF
Navigability conditions
34) Number of people that uses the SRF as a hydro way
35) Number of passengers in the fluvial public transport
Tab. 1 – Scope of the ESI created for the “Stretch of Reduced Flow” (SRF) region in Xingu River (Pará state, Brazil) within the building area of HPP Belo
Monte – list of inputs (variables).
Source: Analysis Team of the Environment Business Unit (LEME, Brazil), 2015.
Environment Product Line, LEME, Brazil 4
After building up the complete database, we standardized
the variables to make aggregation possible. We calculated
the Z score (value minus the average, divided by standard
deviation) for those variables for which high-observed val-
ues corresponded to high levels of environmental sustain-
ability (e.g. dissolved oxygen concentration). For variables
that high-observed values corresponded to low levels of
environmental sustainability (e.g. cyanobacteria concen-
tration in water) we also calculated the Z score (but we
standardized by dividing average minus the value, divided
by standard deviation). This effort to uniform data meets
the goal to have an index with a simple interpretation: high
scores means high levels of environmental sustainability
presented by the region in focus. At that point, we calcu-
lated the 16 indicators by taking the average of the con-
stituent variables’ Z scores. We then averaged the values
of the 16 indicators and calculated the normal percentile,
the ESI, for each season.
The calculation of the ESI allowed the first ever visualiza-
tion of the varying sustainability of the SRF region (among
seasons) in a multicriteria approach. The calculation of the
ESI used data gathered from 2012 to 2014 from the mon-
itoring projects executed as required by the ongoing fed-
eral licensing process of the HPP. Therefore, the first values
calculated showed not only comprehensive deployment
and viability of a new tool for a specific site but it also rep-
resents measures of reference of the environmental sus-
tainability status of the region before the formation of the
SRF. We highlight that, because it is such a novelty, we
simply did not have the time to reach its full potential and
largely apply the same reasoning to other customers or
sites. However, validation of its results, presented as
follows, was already highly significant with the federal en-
vironmental institution officially approving our innovative
approach and expecting for its continuity. With this in hand
and with the easiness to deploy it for any number of cus-
tomers or sites, we have an established plan to use this
tactic in future projects and even generate new business,
arousing new clients with this unique, feasible product.
We calculated the ESI of three rainy seasons and of two
dry ones (Fig. 3). Rainy seasons had higher scores for
“Aquatic Habitats”, “Human Life Conditions”, and
“Navigability”, as expected. On the other hand, higher
scores for “Fish” and “Fishery” were a result of higher cap-
ture when discharge decreases during dry seasons.
Interestingly, the ESI of the last rainy season (2014) was
lower than the ESI calculated for the dry season of 2012,
indicating that one cannot always link the dry seasons in
the Amazonian forest, with lower sustainability, as com-
monly thought.
Trade-offs between components were clear (while a com-
ponent "progressed" from one year to another, another
component "plunged") as were also parallelism among
components (when two or more components went "for-
ward" or "back" together, from one year to another). This
direct, fast, and integrated judgment is promising for the
future management of the required monitoring plan of so-
cial and environmental indicators in the region of the SRF
(during the test phase) with a view to identify problems. To
clarify how it works in general, and how the observed val-
ues are used, we display Z scores of indicators (Fig. 4), in
order to illustrate the midway outputs of the calculation of
the ESI.
Fig. 3 - Graphical representation of the ESI calculated for the
“Stretch of Reduced Flow” (SRF) region in Xingu River (Pará
state, Brazil) within the building area of HPP Belo Monte. The
figure shows the score values of social and environmental
components. The “blue area” represents the highest
observed sustainability during rainy seasons and the “orange
area” represents the highest sustainability observed during
dry ones (2012 to 2014). The grey area (intersection between
the colored areas) indicates the lowest observed
environmental sustainability of the SRF region, independently
of the season.
Source: Analysis Team of the Environment Business Unit (LEME, Brazil), 2015.
Human Life Conditions
Fish
Navigability
Fishery Aquatic Fauna
Aquatic Habitats
Environment Product Line, LEME, Brazil 5
A NEW PRODUCT IN OUR NEW BUSINESS
UNIT READY TO DRAW NEW CONTRACTS:
SIMPLIFICATION MEANING REDUCED COSTS
Social and environmental sustainability can be measured.
While no quantity of such an intricate phenomenon can be
flawlessly calculated, the ESI presented here proved to be
remarkably powerful, valuable, and robust. Its application is a
radical change in the way we do environmental monitoring
assessment and evaluation of strategies, decisions, or ac-
tions. This instrument is one sample of how we can use our
expertise in these matters to convey more confidence to
stakeholders, clients, and environmental institutions (govern-
mental or not).
Perspectives of this method are clear: a new product line
in our new Business Unit with a brand new tool that cre-
ates a chain of comparative benchmarks of environmen-
tal settings of different sites and enterprises because it
assures the shifting of policymaking onto a more fact-
based and systematically rigorous structure. This is al-
ready added in our business model as an exclusive type
of service that only we can provide, because until now,
we are the first ones within the environmental licensing
market in Brazil with the experience and proficiency to
perform similar calculations and apply them.
Gains of this innovation are extensive. We highlight, as men-
tioned above, that we have received confirmation of deploy-
ment of the ESI in the form of the official acceptance from
the federal environmental institution upon the usage of this
new tool. We cannot express how imperative it is to acquire
this kind of validation, especially in the challenging path to
obtain a Federal License of Operation (usually, our final goal)
and to maintain it. This endorsement indicates that new
business might develop purely because customers will
search for it (thus it will generate new income as well). Value
creation for the GDF SUEZ Group to have a BU that
successfully measures social and environmental sustaina-
bility with respect to governmental licensing process can be
therefore linked to new commercial contracts ranging from
0,5 Me up to 5 Me.
Moreover, the scope of the ESI noticeably intended simpli-
fication of the entire process of environmental monitoring
which means less costs for us or our clients in the long run
(consequently making us or them more revenues) because
we tend to designate deliberation of resources solely on
variables and indicators needed for the ESI. The team of
specialists needed to execute the monitoring programs as
required by federal licensing processes reach cumulated
contract values of about 40% to 50% of the total contract.
The current business plan, also using the ESI as an outlining
tool to choose which variable should continue to be moni-
tored, is to save at least a third of that value.
Another type of simplification will also mean another de-
crease in costs: thanks to the shift towards less subjective
analysis, the final merging of results on our main types of
products (thick volumes with all-encompassing social and
environmental impacts studies) may amount to reduced
number of experts and man-hours. It is expected that a
smaller expert team will be needed to objectively analyse
the outcome of such studies, ensuing an even better and
cohesive final report.
Interestingly enough, not only the entrepreneur can benefit
from the ESI analysis and practice, but also the population
can be empowered with its findings and be more informed
when participating on debates about its own needs for de-
velopment. Finally, we point out that the ESI reveals the
prospective value of enhancements not only in the Brazilian
aptitude for data-driven pursue of sustainability and eco-
nomic growth but also the world’s capacity to do it either.
This method originated from this kind of initiative and our
application is a crucial step towards global human progress
with more sustainable environments.
Fig. 4 - Midway outputs of the calculation of the ESI suited for the “Stretch of Reduced Flow” (SRF) region in
Xingu River (Pará state, Brazil) within the building area of HPP Belo Monte. For illustrative purposes only, we
display Z scores of indicators for a rainy season and a dry one.
Source: Analysis Team of the Environment Business Unit (LEME, Brazil), 2015.
VALUE FOR THE GROUP

More Related Content

What's hot

Improved Assessment of Nitrogen and Phosphorus Fate and Transport for Irrigat...
Improved Assessment of Nitrogen and Phosphorus Fate and Transport for Irrigat...Improved Assessment of Nitrogen and Phosphorus Fate and Transport for Irrigat...
Improved Assessment of Nitrogen and Phosphorus Fate and Transport for Irrigat...
National Institute of Food and Agriculture
 
Mehta nifa talk-final
Mehta nifa talk-finalMehta nifa talk-final
Measuring Success of Targeted BMP Implementation, and Getting Smarter about E...
Measuring Success of Targeted BMP Implementation, and Getting Smarter about E...Measuring Success of Targeted BMP Implementation, and Getting Smarter about E...
Measuring Success of Targeted BMP Implementation, and Getting Smarter about E...
National Institute of Food and Agriculture
 
Greenhouse gas trade-offs and N cycling in low-disturbance soils with long te...
Greenhouse gas trade-offs and N cycling in low-disturbance soils with long te...Greenhouse gas trade-offs and N cycling in low-disturbance soils with long te...
Greenhouse gas trade-offs and N cycling in low-disturbance soils with long te...
National Institute of Food and Agriculture
 
Managing Critical Source Areas for Enhancing Ecosystem Services in Agricultur...
Managing Critical Source Areas for Enhancing Ecosystem Services in Agricultur...Managing Critical Source Areas for Enhancing Ecosystem Services in Agricultur...
Managing Critical Source Areas for Enhancing Ecosystem Services in Agricultur...
National Institute of Food and Agriculture
 
Fate CEC’ in Animal Manure Amended Soils-Soil Processes
Fate CEC’ in Animal Manure Amended Soils-Soil ProcessesFate CEC’ in Animal Manure Amended Soils-Soil Processes
Fate CEC’ in Animal Manure Amended Soils-Soil Processes
National Institute of Food and Agriculture
 
NIFA-BARD Collaborative: Rapid Hydrophobicity Sensing and Computing through M...
NIFA-BARD Collaborative: Rapid Hydrophobicity Sensing and Computing through M...NIFA-BARD Collaborative: Rapid Hydrophobicity Sensing and Computing through M...
NIFA-BARD Collaborative: Rapid Hydrophobicity Sensing and Computing through M...
National Institute of Food and Agriculture
 
Multi-scale analysis of microbe-climate interactions in greenhouse gas emissi...
Multi-scale analysis of microbe-climate interactions in greenhouse gas emissi...Multi-scale analysis of microbe-climate interactions in greenhouse gas emissi...
Multi-scale analysis of microbe-climate interactions in greenhouse gas emissi...
National Institute of Food and Agriculture
 
Integrated Plan for Drought Preparedness and Mitigation, and Water Conservati...
Integrated Plan for Drought Preparedness and Mitigation, and Water Conservati...Integrated Plan for Drought Preparedness and Mitigation, and Water Conservati...
Integrated Plan for Drought Preparedness and Mitigation, and Water Conservati...
National Institute of Food and Agriculture
 
Steve Stewart CCW
Steve Stewart CCWSteve Stewart CCW
Steve Stewart CCW
CleanH2O
 
Advancing Climate-Adaptive Decision Tools To Reduce Nutrient Pollution From A...
Advancing Climate-Adaptive Decision Tools To Reduce Nutrient Pollution From A...Advancing Climate-Adaptive Decision Tools To Reduce Nutrient Pollution From A...
Advancing Climate-Adaptive Decision Tools To Reduce Nutrient Pollution From A...
National Institute of Food and Agriculture
 
Water Quality and Productivity Enhancement in an Irrigated River Basin throug...
Water Quality and Productivity Enhancement in an Irrigated River Basin throug...Water Quality and Productivity Enhancement in an Irrigated River Basin throug...
Water Quality and Productivity Enhancement in an Irrigated River Basin throug...
National Institute of Food and Agriculture
 
Implementation of In-Stream, Streambank and Riparian Practices in Conjunction...
Implementation of In-Stream, Streambank and Riparian Practices in Conjunction...Implementation of In-Stream, Streambank and Riparian Practices in Conjunction...
Implementation of In-Stream, Streambank and Riparian Practices in Conjunction...
National Institute of Food and Agriculture
 
Catchment classification: multivariate statistical analyses for physiographic...
Catchment classification: multivariate statistical analyses for physiographic...Catchment classification: multivariate statistical analyses for physiographic...
Catchment classification: multivariate statistical analyses for physiographic...
IJERA Editor
 
Coupling Solid-Aqueous-Gas Phases Of Carbon And Nitrogen Across Topographic G...
Coupling Solid-Aqueous-Gas Phases Of Carbon And Nitrogen Across Topographic G...Coupling Solid-Aqueous-Gas Phases Of Carbon And Nitrogen Across Topographic G...
Coupling Solid-Aqueous-Gas Phases Of Carbon And Nitrogen Across Topographic G...
National Institute of Food and Agriculture
 
A Water Quality Valuation Approach To Strategic Planning
A Water Quality Valuation Approach To Strategic PlanningA Water Quality Valuation Approach To Strategic Planning
A Water Quality Valuation Approach To Strategic Planning
National Institute of Food and Agriculture
 
Towards a Near Real-time Agricultural Drought Monitoring and Forecasting
Towards a Near Real-time Agricultural Drought Monitoring and ForecastingTowards a Near Real-time Agricultural Drought Monitoring and Forecasting
Towards a Near Real-time Agricultural Drought Monitoring and Forecasting
National Institute of Food and Agriculture
 
Analysis of Conservation Practice Effectiveness and Producer Adoption Behavio...
Analysis of Conservation Practice Effectiveness and Producer Adoption Behavio...Analysis of Conservation Practice Effectiveness and Producer Adoption Behavio...
Analysis of Conservation Practice Effectiveness and Producer Adoption Behavio...
National Institute of Food and Agriculture
 
Using agri environment part ii
Using agri environment part iiUsing agri environment part ii
Using agri environment part ii
Soil and Water Conservation Society
 

What's hot (20)

Improved Assessment of Nitrogen and Phosphorus Fate and Transport for Irrigat...
Improved Assessment of Nitrogen and Phosphorus Fate and Transport for Irrigat...Improved Assessment of Nitrogen and Phosphorus Fate and Transport for Irrigat...
Improved Assessment of Nitrogen and Phosphorus Fate and Transport for Irrigat...
 
Mehta nifa talk-final
Mehta nifa talk-finalMehta nifa talk-final
Mehta nifa talk-final
 
Measuring Success of Targeted BMP Implementation, and Getting Smarter about E...
Measuring Success of Targeted BMP Implementation, and Getting Smarter about E...Measuring Success of Targeted BMP Implementation, and Getting Smarter about E...
Measuring Success of Targeted BMP Implementation, and Getting Smarter about E...
 
Greenhouse gas trade-offs and N cycling in low-disturbance soils with long te...
Greenhouse gas trade-offs and N cycling in low-disturbance soils with long te...Greenhouse gas trade-offs and N cycling in low-disturbance soils with long te...
Greenhouse gas trade-offs and N cycling in low-disturbance soils with long te...
 
Managing Critical Source Areas for Enhancing Ecosystem Services in Agricultur...
Managing Critical Source Areas for Enhancing Ecosystem Services in Agricultur...Managing Critical Source Areas for Enhancing Ecosystem Services in Agricultur...
Managing Critical Source Areas for Enhancing Ecosystem Services in Agricultur...
 
Fate CEC’ in Animal Manure Amended Soils-Soil Processes
Fate CEC’ in Animal Manure Amended Soils-Soil ProcessesFate CEC’ in Animal Manure Amended Soils-Soil Processes
Fate CEC’ in Animal Manure Amended Soils-Soil Processes
 
NIFA-BARD Collaborative: Rapid Hydrophobicity Sensing and Computing through M...
NIFA-BARD Collaborative: Rapid Hydrophobicity Sensing and Computing through M...NIFA-BARD Collaborative: Rapid Hydrophobicity Sensing and Computing through M...
NIFA-BARD Collaborative: Rapid Hydrophobicity Sensing and Computing through M...
 
Multi-scale analysis of microbe-climate interactions in greenhouse gas emissi...
Multi-scale analysis of microbe-climate interactions in greenhouse gas emissi...Multi-scale analysis of microbe-climate interactions in greenhouse gas emissi...
Multi-scale analysis of microbe-climate interactions in greenhouse gas emissi...
 
Integrated Plan for Drought Preparedness and Mitigation, and Water Conservati...
Integrated Plan for Drought Preparedness and Mitigation, and Water Conservati...Integrated Plan for Drought Preparedness and Mitigation, and Water Conservati...
Integrated Plan for Drought Preparedness and Mitigation, and Water Conservati...
 
Steve Stewart CCW
Steve Stewart CCWSteve Stewart CCW
Steve Stewart CCW
 
Advancing Climate-Adaptive Decision Tools To Reduce Nutrient Pollution From A...
Advancing Climate-Adaptive Decision Tools To Reduce Nutrient Pollution From A...Advancing Climate-Adaptive Decision Tools To Reduce Nutrient Pollution From A...
Advancing Climate-Adaptive Decision Tools To Reduce Nutrient Pollution From A...
 
Water Quality and Productivity Enhancement in an Irrigated River Basin throug...
Water Quality and Productivity Enhancement in an Irrigated River Basin throug...Water Quality and Productivity Enhancement in an Irrigated River Basin throug...
Water Quality and Productivity Enhancement in an Irrigated River Basin throug...
 
Water Quality and Productivity Enhancement in an Irrigated River Basin throug...
Water Quality and Productivity Enhancement in an Irrigated River Basin throug...Water Quality and Productivity Enhancement in an Irrigated River Basin throug...
Water Quality and Productivity Enhancement in an Irrigated River Basin throug...
 
Implementation of In-Stream, Streambank and Riparian Practices in Conjunction...
Implementation of In-Stream, Streambank and Riparian Practices in Conjunction...Implementation of In-Stream, Streambank and Riparian Practices in Conjunction...
Implementation of In-Stream, Streambank and Riparian Practices in Conjunction...
 
Catchment classification: multivariate statistical analyses for physiographic...
Catchment classification: multivariate statistical analyses for physiographic...Catchment classification: multivariate statistical analyses for physiographic...
Catchment classification: multivariate statistical analyses for physiographic...
 
Coupling Solid-Aqueous-Gas Phases Of Carbon And Nitrogen Across Topographic G...
Coupling Solid-Aqueous-Gas Phases Of Carbon And Nitrogen Across Topographic G...Coupling Solid-Aqueous-Gas Phases Of Carbon And Nitrogen Across Topographic G...
Coupling Solid-Aqueous-Gas Phases Of Carbon And Nitrogen Across Topographic G...
 
A Water Quality Valuation Approach To Strategic Planning
A Water Quality Valuation Approach To Strategic PlanningA Water Quality Valuation Approach To Strategic Planning
A Water Quality Valuation Approach To Strategic Planning
 
Towards a Near Real-time Agricultural Drought Monitoring and Forecasting
Towards a Near Real-time Agricultural Drought Monitoring and ForecastingTowards a Near Real-time Agricultural Drought Monitoring and Forecasting
Towards a Near Real-time Agricultural Drought Monitoring and Forecasting
 
Analysis of Conservation Practice Effectiveness and Producer Adoption Behavio...
Analysis of Conservation Practice Effectiveness and Producer Adoption Behavio...Analysis of Conservation Practice Effectiveness and Producer Adoption Behavio...
Analysis of Conservation Practice Effectiveness and Producer Adoption Behavio...
 
Using agri environment part ii
Using agri environment part iiUsing agri environment part ii
Using agri environment part ii
 

Viewers also liked

MAPA MENTAL Arquitectura barroca
MAPA MENTAL Arquitectura barrocaMAPA MENTAL Arquitectura barroca
MAPA MENTAL Arquitectura barroca
luisana bello orea
 
Funciones tracendentes
Funciones tracendentesFunciones tracendentes
Funciones tracendentes
Andres Santos
 
Driving Operational Efficiency in Shared Services
Driving Operational Efficiency in Shared ServicesDriving Operational Efficiency in Shared Services
Driving Operational Efficiency in Shared Services
Patrick Acheampong
 
Priyanka cv
Priyanka cvPriyanka cv
Priyanka cv
Priyanka Verma
 
Angelamaria estradatabares actividad1_2mapac
Angelamaria estradatabares actividad1_2mapacAngelamaria estradatabares actividad1_2mapac
Angelamaria estradatabares actividad1_2mapac
Angelaestrada37095606
 
B Shared Hr Functions
B Shared Hr FunctionsB Shared Hr Functions
B Shared Hr Functions
Caster Center
 
CLOUD SERVICE IS NOW OPEN FOR BUSINESS
CLOUD SERVICE IS NOW OPEN FOR BUSINESSCLOUD SERVICE IS NOW OPEN FOR BUSINESS
CLOUD SERVICE IS NOW OPEN FOR BUSINESS
Stuart Crawford
 
Final Project Stage 6
Final Project Stage 6Final Project Stage 6
Final Project Stage 6
uaz1170237
 
Herramienta rss
Herramienta rssHerramienta rss
Herramienta rss
Unad
 
Hr helpdesk and open mind profile-2013
Hr helpdesk   and open mind profile-2013Hr helpdesk   and open mind profile-2013
Hr helpdesk and open mind profile-2013
Naveen Gulati
 
202 970-1-pb
202 970-1-pb202 970-1-pb
202 970-1-pb
Anita Amaya
 
4 Steps to ABM Success Engagio and Infer - Nov 2016 - Slideshare
4 Steps to ABM Success   Engagio and  Infer - Nov 2016 - Slideshare4 Steps to ABM Success   Engagio and  Infer - Nov 2016 - Slideshare
4 Steps to ABM Success Engagio and Infer - Nov 2016 - Slideshare
Engagio
 
2017 child maltreatment
2017 child maltreatment2017 child maltreatment
2017 child maltreatment
Robert Cole
 
Derecho financiero y tributario
Derecho financiero y tributarioDerecho financiero y tributario
Derecho financiero y tributario
rosana Marchan
 
18BC03_Discovery_Enables_Accurate_CMDB_Hinkle_DiscoverFinancial
18BC03_Discovery_Enables_Accurate_CMDB_Hinkle_DiscoverFinancial18BC03_Discovery_Enables_Accurate_CMDB_Hinkle_DiscoverFinancial
18BC03_Discovery_Enables_Accurate_CMDB_Hinkle_DiscoverFinancial
Tim Hinkle
 
портфоліо вихователя ГПД
 портфоліо вихователя ГПД портфоліо вихователя ГПД
портфоліо вихователя ГПД
Алла Дейнега
 
Química
QuímicaQuímica

Viewers also liked (17)

MAPA MENTAL Arquitectura barroca
MAPA MENTAL Arquitectura barrocaMAPA MENTAL Arquitectura barroca
MAPA MENTAL Arquitectura barroca
 
Funciones tracendentes
Funciones tracendentesFunciones tracendentes
Funciones tracendentes
 
Driving Operational Efficiency in Shared Services
Driving Operational Efficiency in Shared ServicesDriving Operational Efficiency in Shared Services
Driving Operational Efficiency in Shared Services
 
Priyanka cv
Priyanka cvPriyanka cv
Priyanka cv
 
Angelamaria estradatabares actividad1_2mapac
Angelamaria estradatabares actividad1_2mapacAngelamaria estradatabares actividad1_2mapac
Angelamaria estradatabares actividad1_2mapac
 
B Shared Hr Functions
B Shared Hr FunctionsB Shared Hr Functions
B Shared Hr Functions
 
CLOUD SERVICE IS NOW OPEN FOR BUSINESS
CLOUD SERVICE IS NOW OPEN FOR BUSINESSCLOUD SERVICE IS NOW OPEN FOR BUSINESS
CLOUD SERVICE IS NOW OPEN FOR BUSINESS
 
Final Project Stage 6
Final Project Stage 6Final Project Stage 6
Final Project Stage 6
 
Herramienta rss
Herramienta rssHerramienta rss
Herramienta rss
 
Hr helpdesk and open mind profile-2013
Hr helpdesk   and open mind profile-2013Hr helpdesk   and open mind profile-2013
Hr helpdesk and open mind profile-2013
 
202 970-1-pb
202 970-1-pb202 970-1-pb
202 970-1-pb
 
4 Steps to ABM Success Engagio and Infer - Nov 2016 - Slideshare
4 Steps to ABM Success   Engagio and  Infer - Nov 2016 - Slideshare4 Steps to ABM Success   Engagio and  Infer - Nov 2016 - Slideshare
4 Steps to ABM Success Engagio and Infer - Nov 2016 - Slideshare
 
2017 child maltreatment
2017 child maltreatment2017 child maltreatment
2017 child maltreatment
 
Derecho financiero y tributario
Derecho financiero y tributarioDerecho financiero y tributario
Derecho financiero y tributario
 
18BC03_Discovery_Enables_Accurate_CMDB_Hinkle_DiscoverFinancial
18BC03_Discovery_Enables_Accurate_CMDB_Hinkle_DiscoverFinancial18BC03_Discovery_Enables_Accurate_CMDB_Hinkle_DiscoverFinancial
18BC03_Discovery_Enables_Accurate_CMDB_Hinkle_DiscoverFinancial
 
портфоліо вихователя ГПД
 портфоліо вихователя ГПД портфоліо вихователя ГПД
портфоліо вихователя ГПД
 
Química
QuímicaQuímica
Química
 

Similar to IT 2015_ATTACHMENT - Maria Souza_LEME BRAZIL

AGEDI Climate Change Brochure low res
AGEDI Climate Change Brochure low resAGEDI Climate Change Brochure low res
AGEDI Climate Change Brochure low res
Jane C. Glavan
 
REFDSS_FundApplLimnolManuscript
REFDSS_FundApplLimnolManuscriptREFDSS_FundApplLimnolManuscript
REFDSS_FundApplLimnolManuscript
Leanne Hanson
 
Mr. Carlos Benitez IEWP @Technical Exchange on River Basin Management Plannin...
Mr. Carlos Benitez IEWP @Technical Exchange on River Basin Management Plannin...Mr. Carlos Benitez IEWP @Technical Exchange on River Basin Management Plannin...
Mr. Carlos Benitez IEWP @Technical Exchange on River Basin Management Plannin...
India-EU Water Partnership
 
Ramage GEO World Urban Forum KL 2018
Ramage GEO World Urban Forum KL 2018Ramage GEO World Urban Forum KL 2018
Ramage GEO World Urban Forum KL 2018
Steven Ramage
 
State Environmental Monitor 6-3-96
State Environmental Monitor 6-3-96State Environmental Monitor 6-3-96
State Environmental Monitor 6-3-96
James Bernard
 
UNDP MT EbA Learning Brief 3 FINAL web vs 05.01.16
UNDP MT EbA Learning Brief 3 FINAL web vs 05.01.16UNDP MT EbA Learning Brief 3 FINAL web vs 05.01.16
UNDP MT EbA Learning Brief 3 FINAL web vs 05.01.16
Tine Rossing
 
CRP6 2012 Annual Report
CRP6 2012 Annual ReportCRP6 2012 Annual Report
CRP6 2012 Annual Report
World Agroforestry (ICRAF)
 
Prof José Galizia Tundisi Ciclo Palestra Dez 2009
Prof José Galizia Tundisi  Ciclo Palestra Dez 2009Prof José Galizia Tundisi  Ciclo Palestra Dez 2009
Prof José Galizia Tundisi Ciclo Palestra Dez 2009
Fabricio Martins
 
Integrated Management of Land- Based Activities in the Sao Francisco River Ba...
Integrated Management of Land- Based Activities in the Sao Francisco River Ba...Integrated Management of Land- Based Activities in the Sao Francisco River Ba...
Integrated Management of Land- Based Activities in the Sao Francisco River Ba...
Iwl Pcu
 
Watershed Management and Resilience
Watershed Management and ResilienceWatershed Management and Resilience
Watershed Management and Resilience
greeninclusivegrowth
 
Engagement of high level policymakers to sustain Amazon project outcomes
Engagement of high level policymakers to sustain Amazon project outcomesEngagement of high level policymakers to sustain Amazon project outcomes
Engagement of high level policymakers to sustain Amazon project outcomes
Iwl Pcu
 
Integrated Management of Land- Based Activities in the Sao Francisco River Basin
Integrated Management of Land- Based Activities in the Sao Francisco River BasinIntegrated Management of Land- Based Activities in the Sao Francisco River Basin
Integrated Management of Land- Based Activities in the Sao Francisco River Basin
Iwl Pcu
 
Natural capital accounting presentation at the xbrl euro filing 2017 presente...
Natural capital accounting presentation at the xbrl euro filing 2017 presente...Natural capital accounting presentation at the xbrl euro filing 2017 presente...
Natural capital accounting presentation at the xbrl euro filing 2017 presente...
Workiva
 
a-i3959e
a-i3959ea-i3959e
a-i3959e
Andrew Bam
 
Session15_WaterFoodEnergyProjectionsMekong
Session15_WaterFoodEnergyProjectionsMekongSession15_WaterFoodEnergyProjectionsMekong
Session15_WaterFoodEnergyProjectionsMekong
Water, Land and Ecosystems (WLE)
 
Nbi draft 00 presentation oct 23 25, 2017
Nbi draft 00 presentation oct 23 25, 2017Nbi draft 00 presentation oct 23 25, 2017
Nbi draft 00 presentation oct 23 25, 2017
Ogaro Lugard
 
Academia: Richard Lawford, Morgan State University, 16th January UN Water Zar...
Academia: Richard Lawford, Morgan State University, 16th January UN Water Zar...Academia: Richard Lawford, Morgan State University, 16th January UN Water Zar...
Academia: Richard Lawford, Morgan State University, 16th January UN Water Zar...
water-decade
 
Climate Change Impacts on the Goals of the New York-New Jersey Harbor Estuary...
Climate Change Impacts on the Goals of the New York-New Jersey Harbor Estuary...Climate Change Impacts on the Goals of the New York-New Jersey Harbor Estuary...
Climate Change Impacts on the Goals of the New York-New Jersey Harbor Estuary...
Sabrina Ramkhelawan
 
Ecosystem_Services_Primer-edited
Ecosystem_Services_Primer-editedEcosystem_Services_Primer-edited
Ecosystem_Services_Primer-edited
Jay Drummond, jr
 
A new angle on soverign credit risk
A new angle on soverign credit riskA new angle on soverign credit risk
A new angle on soverign credit risk
Dr Lendy Spires
 

Similar to IT 2015_ATTACHMENT - Maria Souza_LEME BRAZIL (20)

AGEDI Climate Change Brochure low res
AGEDI Climate Change Brochure low resAGEDI Climate Change Brochure low res
AGEDI Climate Change Brochure low res
 
REFDSS_FundApplLimnolManuscript
REFDSS_FundApplLimnolManuscriptREFDSS_FundApplLimnolManuscript
REFDSS_FundApplLimnolManuscript
 
Mr. Carlos Benitez IEWP @Technical Exchange on River Basin Management Plannin...
Mr. Carlos Benitez IEWP @Technical Exchange on River Basin Management Plannin...Mr. Carlos Benitez IEWP @Technical Exchange on River Basin Management Plannin...
Mr. Carlos Benitez IEWP @Technical Exchange on River Basin Management Plannin...
 
Ramage GEO World Urban Forum KL 2018
Ramage GEO World Urban Forum KL 2018Ramage GEO World Urban Forum KL 2018
Ramage GEO World Urban Forum KL 2018
 
State Environmental Monitor 6-3-96
State Environmental Monitor 6-3-96State Environmental Monitor 6-3-96
State Environmental Monitor 6-3-96
 
UNDP MT EbA Learning Brief 3 FINAL web vs 05.01.16
UNDP MT EbA Learning Brief 3 FINAL web vs 05.01.16UNDP MT EbA Learning Brief 3 FINAL web vs 05.01.16
UNDP MT EbA Learning Brief 3 FINAL web vs 05.01.16
 
CRP6 2012 Annual Report
CRP6 2012 Annual ReportCRP6 2012 Annual Report
CRP6 2012 Annual Report
 
Prof José Galizia Tundisi Ciclo Palestra Dez 2009
Prof José Galizia Tundisi  Ciclo Palestra Dez 2009Prof José Galizia Tundisi  Ciclo Palestra Dez 2009
Prof José Galizia Tundisi Ciclo Palestra Dez 2009
 
Integrated Management of Land- Based Activities in the Sao Francisco River Ba...
Integrated Management of Land- Based Activities in the Sao Francisco River Ba...Integrated Management of Land- Based Activities in the Sao Francisco River Ba...
Integrated Management of Land- Based Activities in the Sao Francisco River Ba...
 
Watershed Management and Resilience
Watershed Management and ResilienceWatershed Management and Resilience
Watershed Management and Resilience
 
Engagement of high level policymakers to sustain Amazon project outcomes
Engagement of high level policymakers to sustain Amazon project outcomesEngagement of high level policymakers to sustain Amazon project outcomes
Engagement of high level policymakers to sustain Amazon project outcomes
 
Integrated Management of Land- Based Activities in the Sao Francisco River Basin
Integrated Management of Land- Based Activities in the Sao Francisco River BasinIntegrated Management of Land- Based Activities in the Sao Francisco River Basin
Integrated Management of Land- Based Activities in the Sao Francisco River Basin
 
Natural capital accounting presentation at the xbrl euro filing 2017 presente...
Natural capital accounting presentation at the xbrl euro filing 2017 presente...Natural capital accounting presentation at the xbrl euro filing 2017 presente...
Natural capital accounting presentation at the xbrl euro filing 2017 presente...
 
a-i3959e
a-i3959ea-i3959e
a-i3959e
 
Session15_WaterFoodEnergyProjectionsMekong
Session15_WaterFoodEnergyProjectionsMekongSession15_WaterFoodEnergyProjectionsMekong
Session15_WaterFoodEnergyProjectionsMekong
 
Nbi draft 00 presentation oct 23 25, 2017
Nbi draft 00 presentation oct 23 25, 2017Nbi draft 00 presentation oct 23 25, 2017
Nbi draft 00 presentation oct 23 25, 2017
 
Academia: Richard Lawford, Morgan State University, 16th January UN Water Zar...
Academia: Richard Lawford, Morgan State University, 16th January UN Water Zar...Academia: Richard Lawford, Morgan State University, 16th January UN Water Zar...
Academia: Richard Lawford, Morgan State University, 16th January UN Water Zar...
 
Climate Change Impacts on the Goals of the New York-New Jersey Harbor Estuary...
Climate Change Impacts on the Goals of the New York-New Jersey Harbor Estuary...Climate Change Impacts on the Goals of the New York-New Jersey Harbor Estuary...
Climate Change Impacts on the Goals of the New York-New Jersey Harbor Estuary...
 
Ecosystem_Services_Primer-edited
Ecosystem_Services_Primer-editedEcosystem_Services_Primer-edited
Ecosystem_Services_Primer-edited
 
A new angle on soverign credit risk
A new angle on soverign credit riskA new angle on soverign credit risk
A new angle on soverign credit risk
 

IT 2015_ATTACHMENT - Maria Souza_LEME BRAZIL

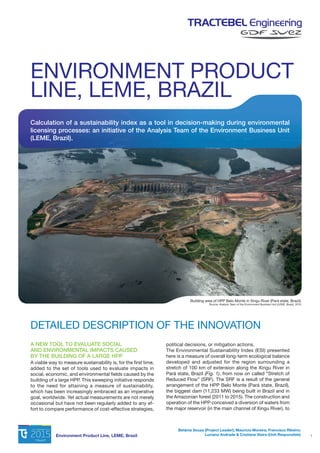
  • 1. Environment Product Line, LEME, Brazil 1 A NEW TOOL TO EVALUATE SOCIAL AND ENVIRONMENTAL IMPACTS CAUSED BY THE BUILDING OF A LARGE HPP A viable way to measure sustainability is, for the first time, added to the set of tools used to evaluate impacts in social, economic, and environmental fields caused by the building of a large HPP. This sweeping initiative responds to the need for attaining a measure of sustainability, which has been increasingly embraced as an imperative goal, worldwide. Yet actual measurements are not merely occasional but have not been regularly added to any ef- fort to compare performance of cost-effective strategies, ENVIRONMENT PRODUCT LINE, LEME, BRAZIL Building area of HPP Belo Monte in Xingu River (Pará state, Brazil). Source: Analysis Team of the Environment Business Unit (LEME, Brazil), 2015. Calculation of a sustainability index as a tool in decision-making during environmental licensing processes: an initiative of the Analysis Team of the Environment Business Unit (LEME, Brazil). DETAILED DESCRIPTION OF THE INNOVATION political decisions, or mitigation actions. The Environmental Sustainability Index (ESI) presented here is a measure of overall long-term ecological balance developed and adjusted for the region surrounding a stretch of 100 km of extension along the Xingu River in Pará state, Brazil (Fig. 1), from now on called “Stretch of Reduced Flow” (SRF). The SRF is a result of the general arrangement of the HPP Belo Monte (Pará state, Brazil), the biggest dam (11,233 MW) being built in Brazil and in the Amazonian forest (2011 to 2015). The construction and operation of the HPP conceived a diversion of waters from the major reservoir (in the main channel of Xingu River), to Betânia Souza (Project Leader); Maurício Moreira; Francisco Ribeiro; Luciano Andrade & Cristiane Vieira (Unit Responsible)
  • 2. Environment Product Line, LEME, Brazil 2 a secondary reservoir (in the inland), and therefore it will cause a substantial reduction of water flow in Xingu River, the so-called SRF (to be formed by the end of 2015). The Environmental Analysis Team of LEME, Brazil, is re- sponsible for the coordination of the licensing process of this HPP. We proposed the ESI as a far-reaching, powerful instrument that makes possible the assessment, through- out time, of the impact of the HPP on the river natural flow, hence on its biodiversity and human conditions be- cause it represents a radical innovation towards a more analytically driven approach to decision-making. For the first time, the ongoing (since 2009) federal licensing pro- cess of this HPP was presented with a feasible, integrat- ed, and reproducible method (and results) to evaluate tangible social and environmental impacts which are ac- tually interconnected but are usually analysed only separately. Because there is a strong seasonality within the region, and because we are interested on the environmental im- pact of the formation of the SRF, we aimed for the first ever comparison between the environmental sustainabil- ity of rainy seasons (high waters) and of dry seasons with- in the region in focus (Fig. 1), before and after the opera- tion of the HPP. Fig. 1 – The “Stretch of Reduced Flow” (SRF) along the Xingu River (Pará state, Brazil) formed by the diversion of waters during the operation of the HPP Belo Monte. Source: Analysis Team of the Environment Business Unit (LEME, Brazil), 2015. Fig. 2 – Levels of calculation of the Environmental Sustainability Index (ESI) created for the “Stretch of Reduced Flow” (SRF) region in Xingu River (Pará state, Brazil) within the building area of HPP Belo Monte. 35 Variables 16 Indicators 6 Components ESI 1. World Economic Forum, 2001. Environmental Sustainability Index An Initiative of the Global Leaders of Tomorrow Environment Task Force. Annual Meeting, Davos, Switzerland. 255 p. FIRST EVER MEASUREMENTS OF ENVIRONMENTAL SUSTAINABILITY OF THE SRF REGION The method adopted to create the ESI suited to the region in focus based on a multiple criteria approach presented by the “Global Leaders of Tomorrow Environment Task Force”, during the annual meeting of the World Economic Forum (2001)1 . This approach allowed simultaneous analysis of social, economic, and environmental data. A high ESI rank indicates a high level of environmental sustainability in a particu- lar season or site; a low ESI rank in another season or site (comparison over time or space) signals substan- tial problems in achieving environmental sustainabil- ity along multiple dimensions. Our ESI score centers upon a set of six components as- sociated with 16 core indicators, each of which combines one to four variables for a total of 35 underlying variables (Fig. 2 & Tab. 1). Indicators and variables were chosen through careful review of scientific literature, available data, and analysis of the first results. In addition, we con- sidered further application and future comparison with other enterprises for a full use of the method at least in a countrywide manner, and therefore we considered com- monality of variables due to relevance among other li- censing processes in Brazil. At the most basic level, we defined the scope in concep- tual terms and we have determined that environmental sustainability of the SRF region is a function of the varia- bles, linked by indicators, of the following six components: “Aquatic Habitats”, “Aquatic Fauna”, “Fish”, “Fishery”, “Human Life Conditions”, and “Navigability” (Tab. 1). SUCCESS OF IMPLEMENTATION
  • 3. Environment Product Line, LEME, Brazil 3 COMPONENT INDICATOR VARIABLE AQUATIC HABITATS Water availability 01) Subterranean water level 02) Superficial discharge 03) Superficial water level Climate 04) Rain level in Altamira 05) Rain level in Pimental 06) Rain level in Belo Monte AQUATIC FAUNA Biodiversity of vertebrates 07) Relative abundance of turtles 08) Relative abundance of aquatic mammals FISH Water quality for fish 09) Dissolved oxygen concentration Fish diversity 10) Number of species of fish 11) Abundance of fish FISHERY Fishery effort 12) Number of fishermen (commercial) 13) Number of fishermen (ornamental) 14) Number of days fishing (commercial) 15) Number of days fishing (ornamental) Fishery production 16) Total weight (commercial) 17) Total weight (ornamental) Fishery richness 18) Number of species (commercial) 19) Number of species (ornamental) Rational exploitation of fish 20) Average length of the species with higher value (commercial) 21) Average length of the most sold species (commercial) 22) Average length of the most sold species (ornamental) HUMAN LIFE CONDITIONS Water quality for humans 23) Turbidity level 24) Escherichia coli concentration 25) Phosphorus concentration 26) Cyanobacteria concentration Human health 27) Number of families visited by Health Agents Education 28) Number of students in fluvial transport 29) Number of students Productive activities 30) Number of families that presents fishery as a source of income Human water usage 31) Number of families in the urban areas with access to water 32) Number of families in the rural areas with access to water NAVIGABILITY Navigability dynamics 33) Number of vessels that passes by the SRF Navigability conditions 34) Number of people that uses the SRF as a hydro way 35) Number of passengers in the fluvial public transport Tab. 1 – Scope of the ESI created for the “Stretch of Reduced Flow” (SRF) region in Xingu River (Pará state, Brazil) within the building area of HPP Belo Monte – list of inputs (variables). Source: Analysis Team of the Environment Business Unit (LEME, Brazil), 2015.
  • 4. Environment Product Line, LEME, Brazil 4 After building up the complete database, we standardized the variables to make aggregation possible. We calculated the Z score (value minus the average, divided by standard deviation) for those variables for which high-observed val- ues corresponded to high levels of environmental sustain- ability (e.g. dissolved oxygen concentration). For variables that high-observed values corresponded to low levels of environmental sustainability (e.g. cyanobacteria concen- tration in water) we also calculated the Z score (but we standardized by dividing average minus the value, divided by standard deviation). This effort to uniform data meets the goal to have an index with a simple interpretation: high scores means high levels of environmental sustainability presented by the region in focus. At that point, we calcu- lated the 16 indicators by taking the average of the con- stituent variables’ Z scores. We then averaged the values of the 16 indicators and calculated the normal percentile, the ESI, for each season. The calculation of the ESI allowed the first ever visualiza- tion of the varying sustainability of the SRF region (among seasons) in a multicriteria approach. The calculation of the ESI used data gathered from 2012 to 2014 from the mon- itoring projects executed as required by the ongoing fed- eral licensing process of the HPP. Therefore, the first values calculated showed not only comprehensive deployment and viability of a new tool for a specific site but it also rep- resents measures of reference of the environmental sus- tainability status of the region before the formation of the SRF. We highlight that, because it is such a novelty, we simply did not have the time to reach its full potential and largely apply the same reasoning to other customers or sites. However, validation of its results, presented as follows, was already highly significant with the federal en- vironmental institution officially approving our innovative approach and expecting for its continuity. With this in hand and with the easiness to deploy it for any number of cus- tomers or sites, we have an established plan to use this tactic in future projects and even generate new business, arousing new clients with this unique, feasible product. We calculated the ESI of three rainy seasons and of two dry ones (Fig. 3). Rainy seasons had higher scores for “Aquatic Habitats”, “Human Life Conditions”, and “Navigability”, as expected. On the other hand, higher scores for “Fish” and “Fishery” were a result of higher cap- ture when discharge decreases during dry seasons. Interestingly, the ESI of the last rainy season (2014) was lower than the ESI calculated for the dry season of 2012, indicating that one cannot always link the dry seasons in the Amazonian forest, with lower sustainability, as com- monly thought. Trade-offs between components were clear (while a com- ponent "progressed" from one year to another, another component "plunged") as were also parallelism among components (when two or more components went "for- ward" or "back" together, from one year to another). This direct, fast, and integrated judgment is promising for the future management of the required monitoring plan of so- cial and environmental indicators in the region of the SRF (during the test phase) with a view to identify problems. To clarify how it works in general, and how the observed val- ues are used, we display Z scores of indicators (Fig. 4), in order to illustrate the midway outputs of the calculation of the ESI. Fig. 3 - Graphical representation of the ESI calculated for the “Stretch of Reduced Flow” (SRF) region in Xingu River (Pará state, Brazil) within the building area of HPP Belo Monte. The figure shows the score values of social and environmental components. The “blue area” represents the highest observed sustainability during rainy seasons and the “orange area” represents the highest sustainability observed during dry ones (2012 to 2014). The grey area (intersection between the colored areas) indicates the lowest observed environmental sustainability of the SRF region, independently of the season. Source: Analysis Team of the Environment Business Unit (LEME, Brazil), 2015. Human Life Conditions Fish Navigability Fishery Aquatic Fauna Aquatic Habitats
  • 5. Environment Product Line, LEME, Brazil 5 A NEW PRODUCT IN OUR NEW BUSINESS UNIT READY TO DRAW NEW CONTRACTS: SIMPLIFICATION MEANING REDUCED COSTS Social and environmental sustainability can be measured. While no quantity of such an intricate phenomenon can be flawlessly calculated, the ESI presented here proved to be remarkably powerful, valuable, and robust. Its application is a radical change in the way we do environmental monitoring assessment and evaluation of strategies, decisions, or ac- tions. This instrument is one sample of how we can use our expertise in these matters to convey more confidence to stakeholders, clients, and environmental institutions (govern- mental or not). Perspectives of this method are clear: a new product line in our new Business Unit with a brand new tool that cre- ates a chain of comparative benchmarks of environmen- tal settings of different sites and enterprises because it assures the shifting of policymaking onto a more fact- based and systematically rigorous structure. This is al- ready added in our business model as an exclusive type of service that only we can provide, because until now, we are the first ones within the environmental licensing market in Brazil with the experience and proficiency to perform similar calculations and apply them. Gains of this innovation are extensive. We highlight, as men- tioned above, that we have received confirmation of deploy- ment of the ESI in the form of the official acceptance from the federal environmental institution upon the usage of this new tool. We cannot express how imperative it is to acquire this kind of validation, especially in the challenging path to obtain a Federal License of Operation (usually, our final goal) and to maintain it. This endorsement indicates that new business might develop purely because customers will search for it (thus it will generate new income as well). Value creation for the GDF SUEZ Group to have a BU that successfully measures social and environmental sustaina- bility with respect to governmental licensing process can be therefore linked to new commercial contracts ranging from 0,5 Me up to 5 Me. Moreover, the scope of the ESI noticeably intended simpli- fication of the entire process of environmental monitoring which means less costs for us or our clients in the long run (consequently making us or them more revenues) because we tend to designate deliberation of resources solely on variables and indicators needed for the ESI. The team of specialists needed to execute the monitoring programs as required by federal licensing processes reach cumulated contract values of about 40% to 50% of the total contract. The current business plan, also using the ESI as an outlining tool to choose which variable should continue to be moni- tored, is to save at least a third of that value. Another type of simplification will also mean another de- crease in costs: thanks to the shift towards less subjective analysis, the final merging of results on our main types of products (thick volumes with all-encompassing social and environmental impacts studies) may amount to reduced number of experts and man-hours. It is expected that a smaller expert team will be needed to objectively analyse the outcome of such studies, ensuing an even better and cohesive final report. Interestingly enough, not only the entrepreneur can benefit from the ESI analysis and practice, but also the population can be empowered with its findings and be more informed when participating on debates about its own needs for de- velopment. Finally, we point out that the ESI reveals the prospective value of enhancements not only in the Brazilian aptitude for data-driven pursue of sustainability and eco- nomic growth but also the world’s capacity to do it either. This method originated from this kind of initiative and our application is a crucial step towards global human progress with more sustainable environments. Fig. 4 - Midway outputs of the calculation of the ESI suited for the “Stretch of Reduced Flow” (SRF) region in Xingu River (Pará state, Brazil) within the building area of HPP Belo Monte. For illustrative purposes only, we display Z scores of indicators for a rainy season and a dry one. Source: Analysis Team of the Environment Business Unit (LEME, Brazil), 2015. VALUE FOR THE GROUP