Download to read offline

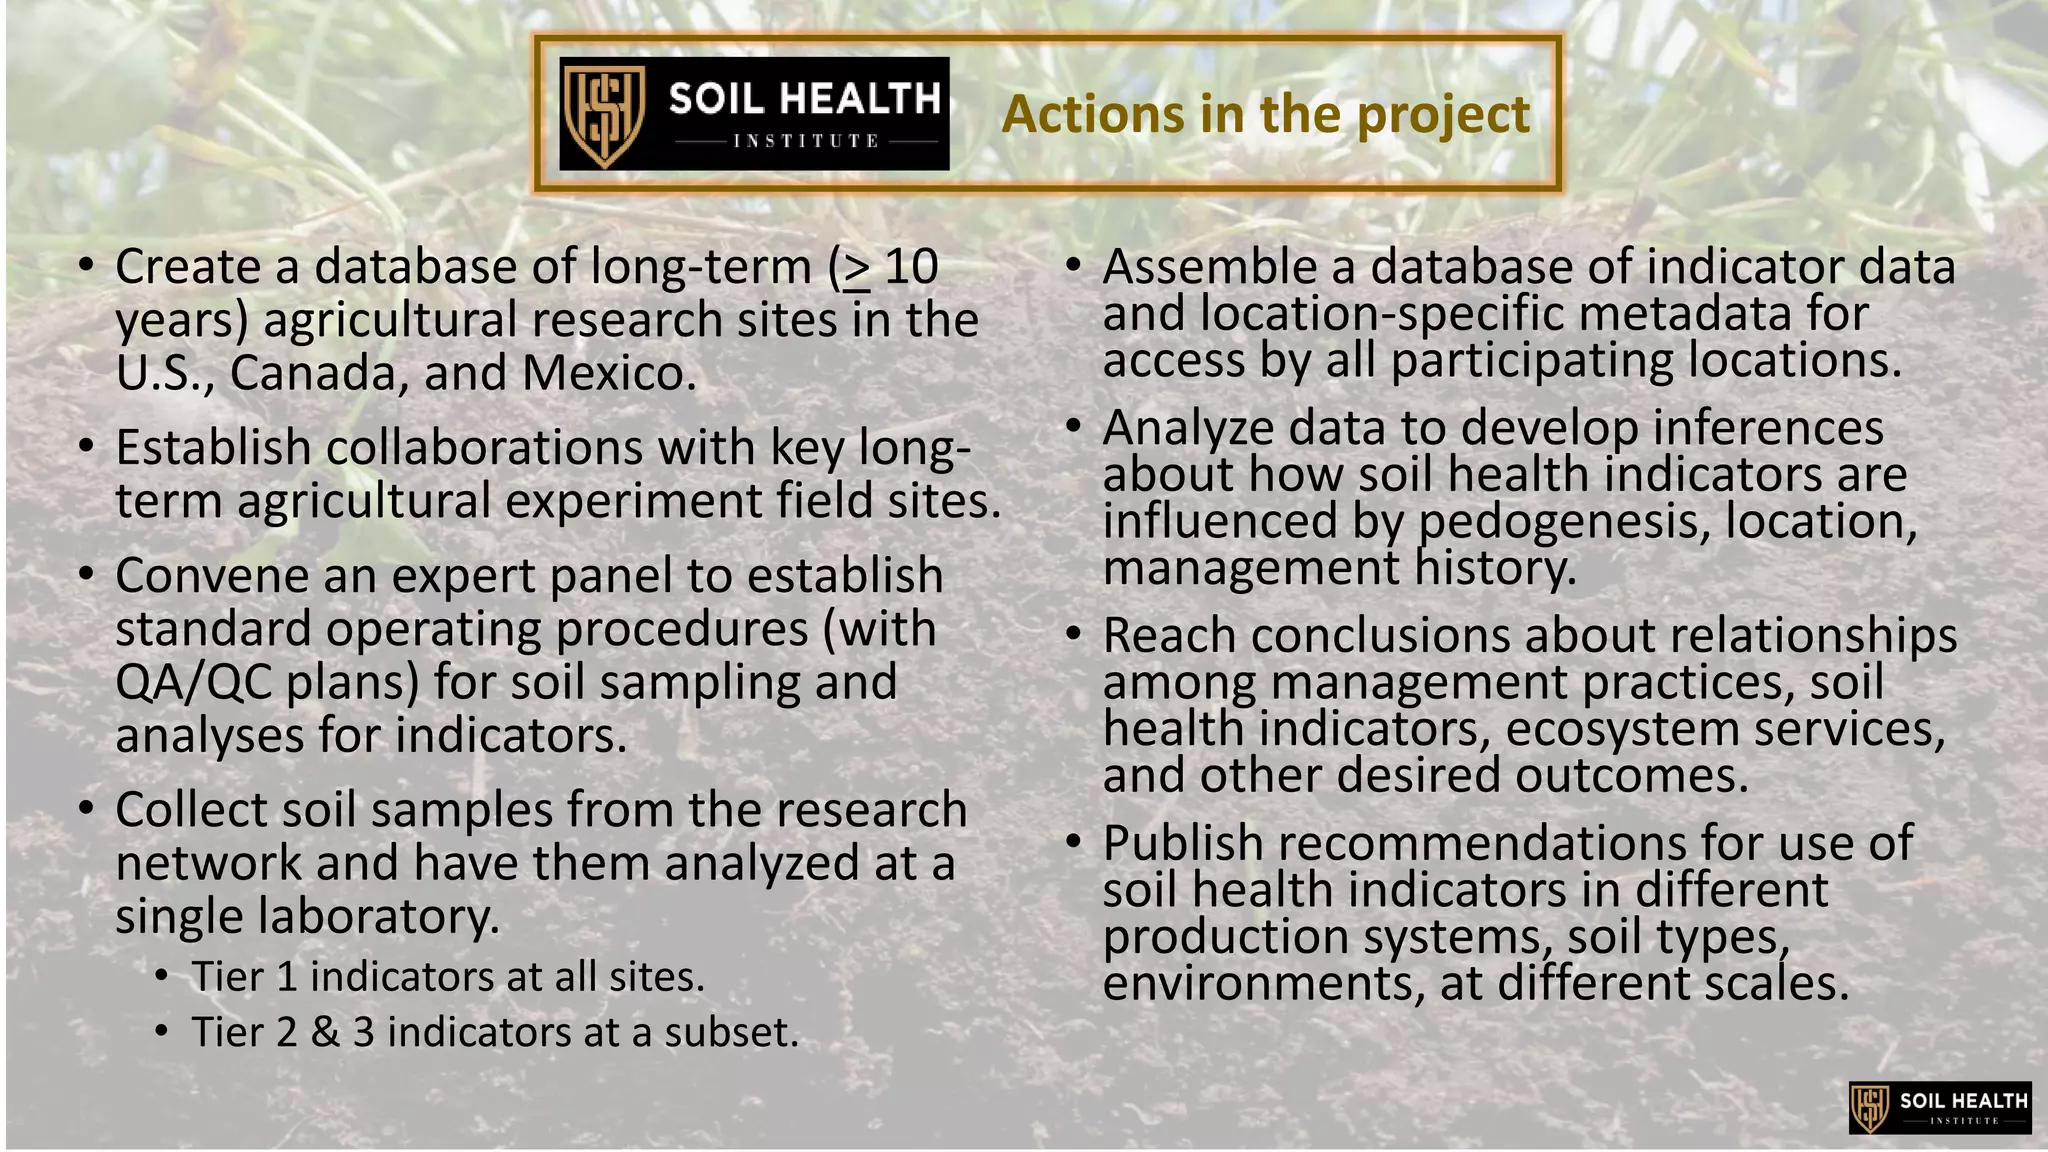


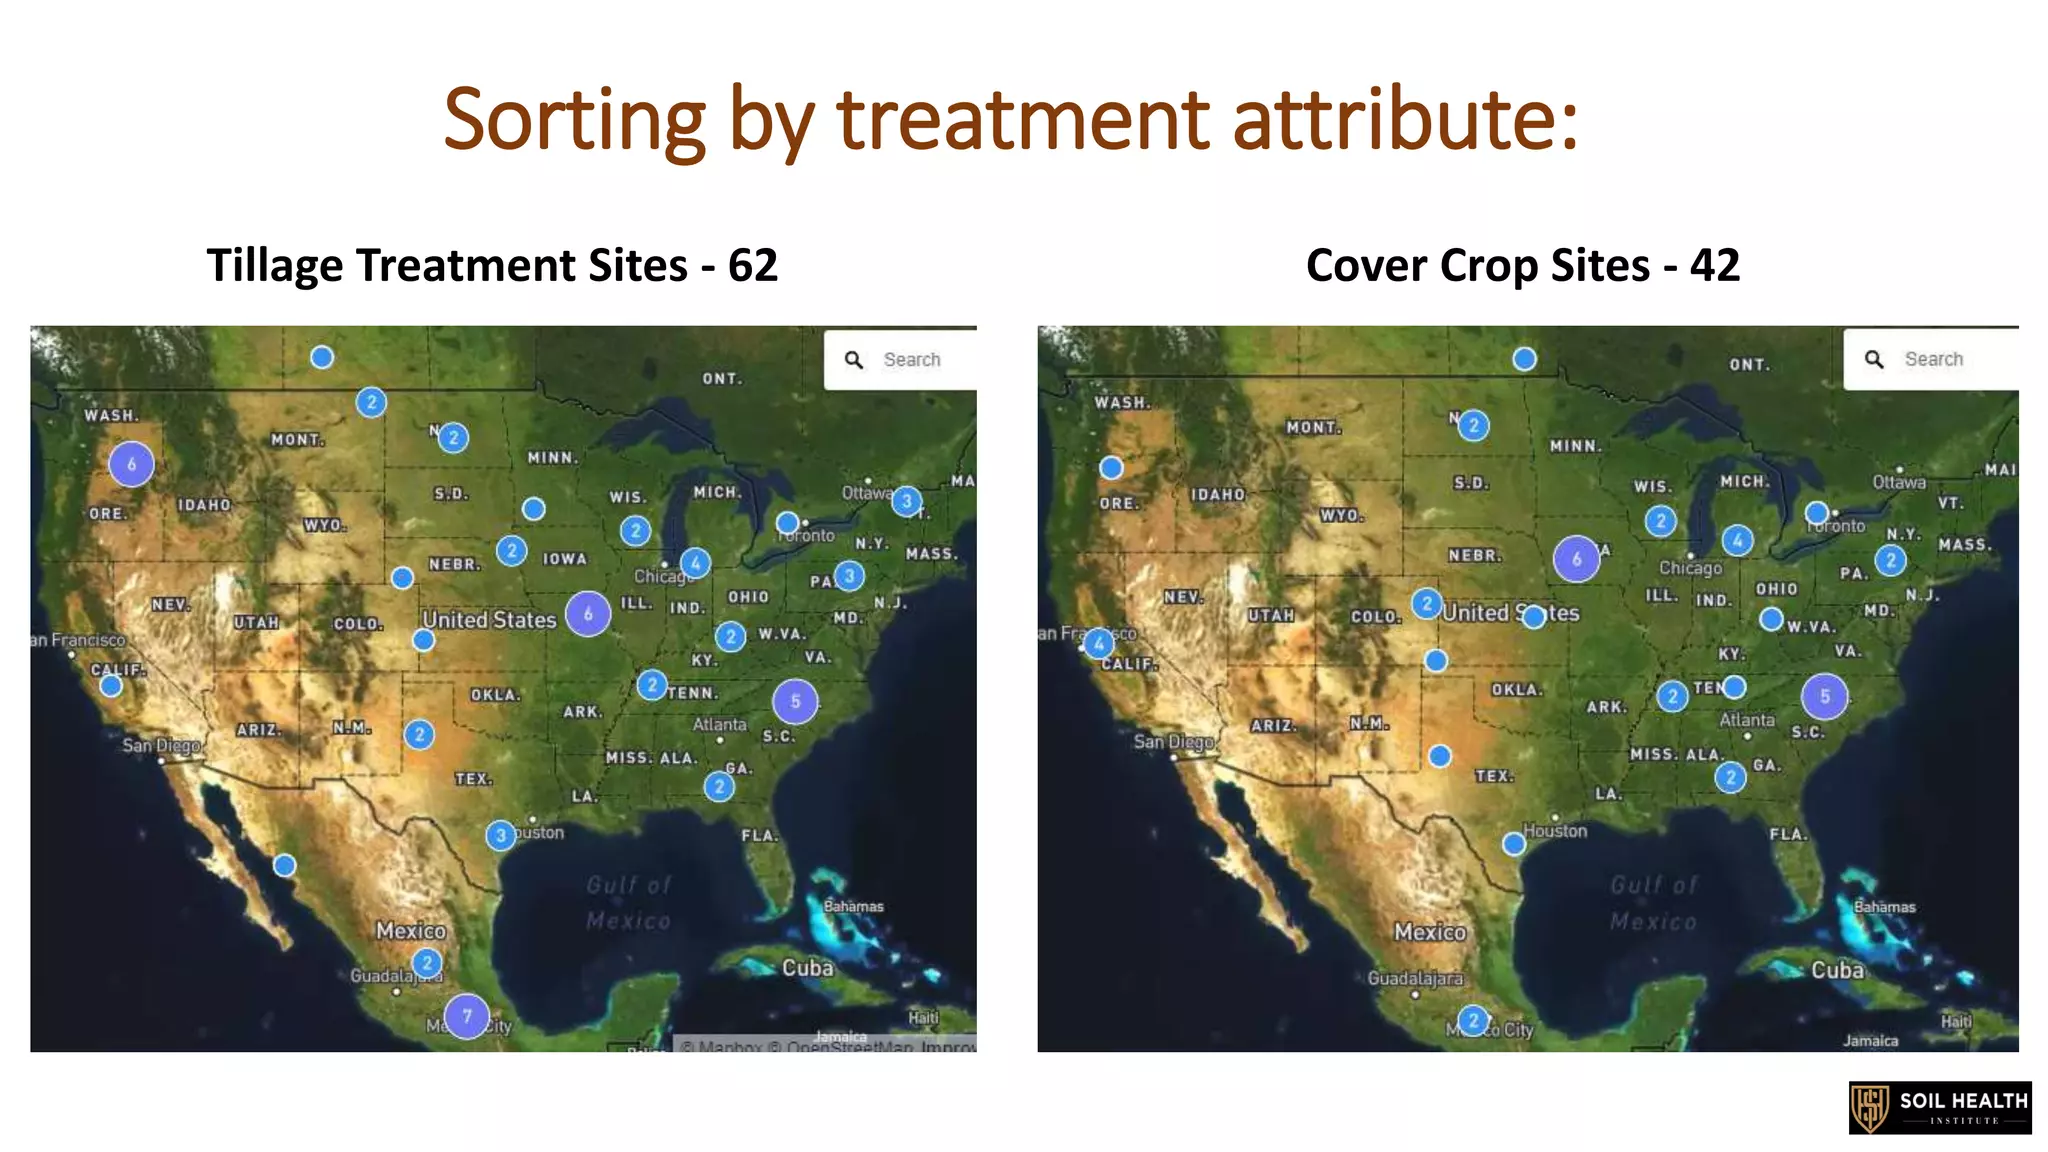
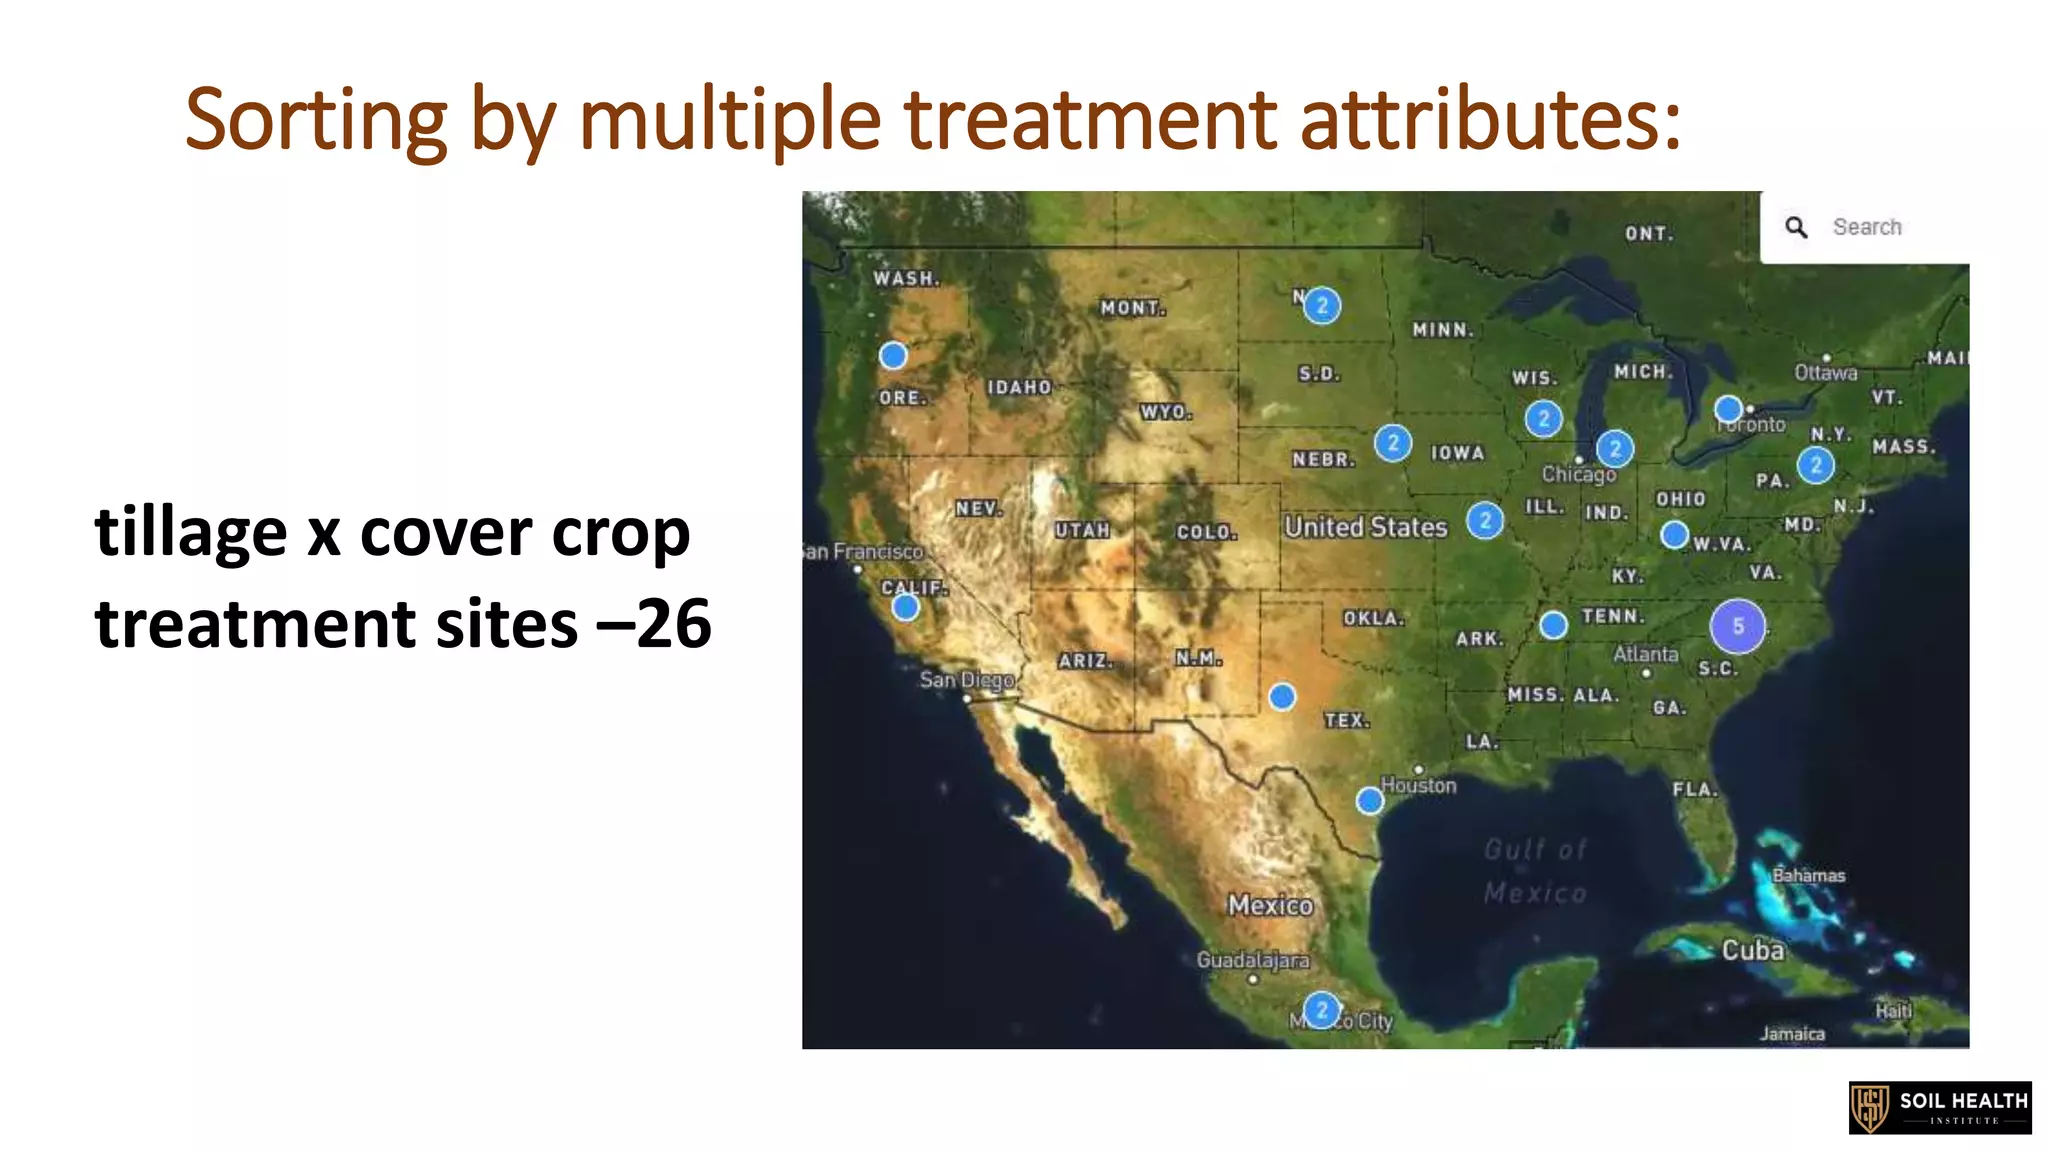


This document summarizes a project to assess soil health across agricultural research sites in the US, Canada, and Mexico. The project will create a database of long-term research sites, collect standardized soil samples from selected sites, analyze the samples for a tiered set of chemical, biological, and physical indicators of soil health, and analyze the data to understand relationships between management practices, indicators, and outcomes. The goals are to advance understanding of how soil health is influenced by location and management, and to provide recommendations on using indicators in different production systems. Over 120 long-term research sites have already been entered into the project's database from 34 US states, 4 Canadian provinces, and 9 Mexican states.


