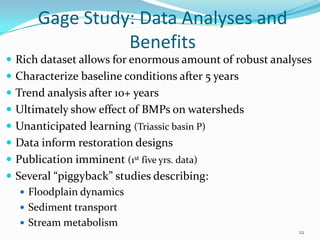
Downloaded 13 times

![Stratified-random evaluation framework (2004)
Similar to VA’s probabilistic monitoring
program
Sites stratified by stream order (1st – 5th)
Statistically valid way to make inferences on
countywide stream condition
40 sites selected annually. Sampled for:
Benthic Macroinvertebrates (spring)
Fish and habitat (summer)
Bacteria (quarterly)
Water quality (every visit)
12 reference sites
Annual Stream Quality Index (SQI) [score 1-5]
Stream Biological
Monitoring Program
8](https://image.slidesharecdn.com/monitoringprograms-potomacroundtable3-2014imh-140417091717-phpapp02/85/Water-Quality-Monitoring-Programs-in-Fairfax-County-April-2014-8-320.jpg)
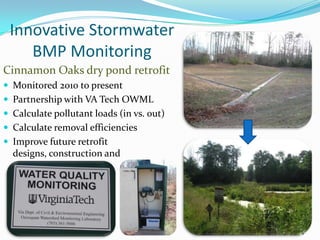
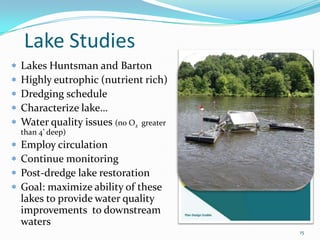
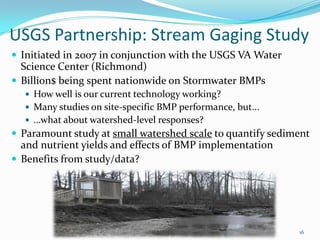
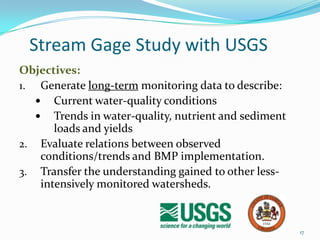

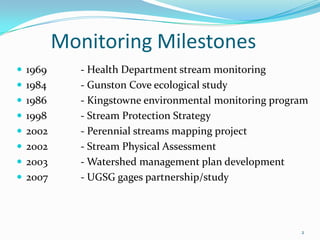
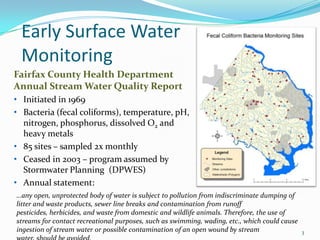
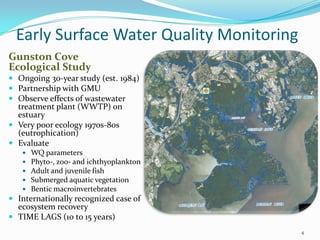
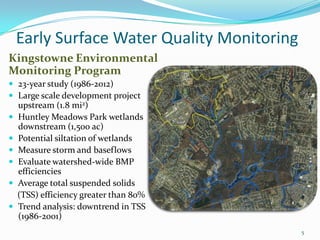
This document summarizes the history of surface water quality monitoring in Fairfax County from 1969 to present. It outlines key milestones and studies conducted over time, including the health department's stream monitoring program in 1969, the ongoing Gunston Cove ecological study partnership since 1984, and the establishment of the Stream Protection Strategy in 1998. It also describes the current state of the county's monitoring program, which includes biological monitoring of streams, dry and wet weather screening of stormwater outfalls, watershed and lake studies, and an ongoing stream gaging study partnership with the USGS since 2007.


