Download to read offline


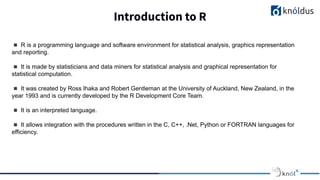
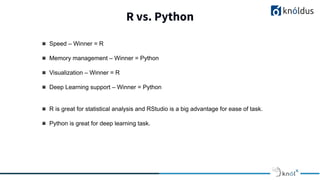


The document presents an overview of text mining using R, highlighting R's benefits for statistical analysis, data visualization, and machine learning techniques like linear regression. It compares R with Python, noting R's strengths in speed and visualization, while Python excels in deep learning support. Additionally, it introduces text mining as a process for extracting insights from unstructured textual data, featuring concepts like text corpus and term-document matrices.