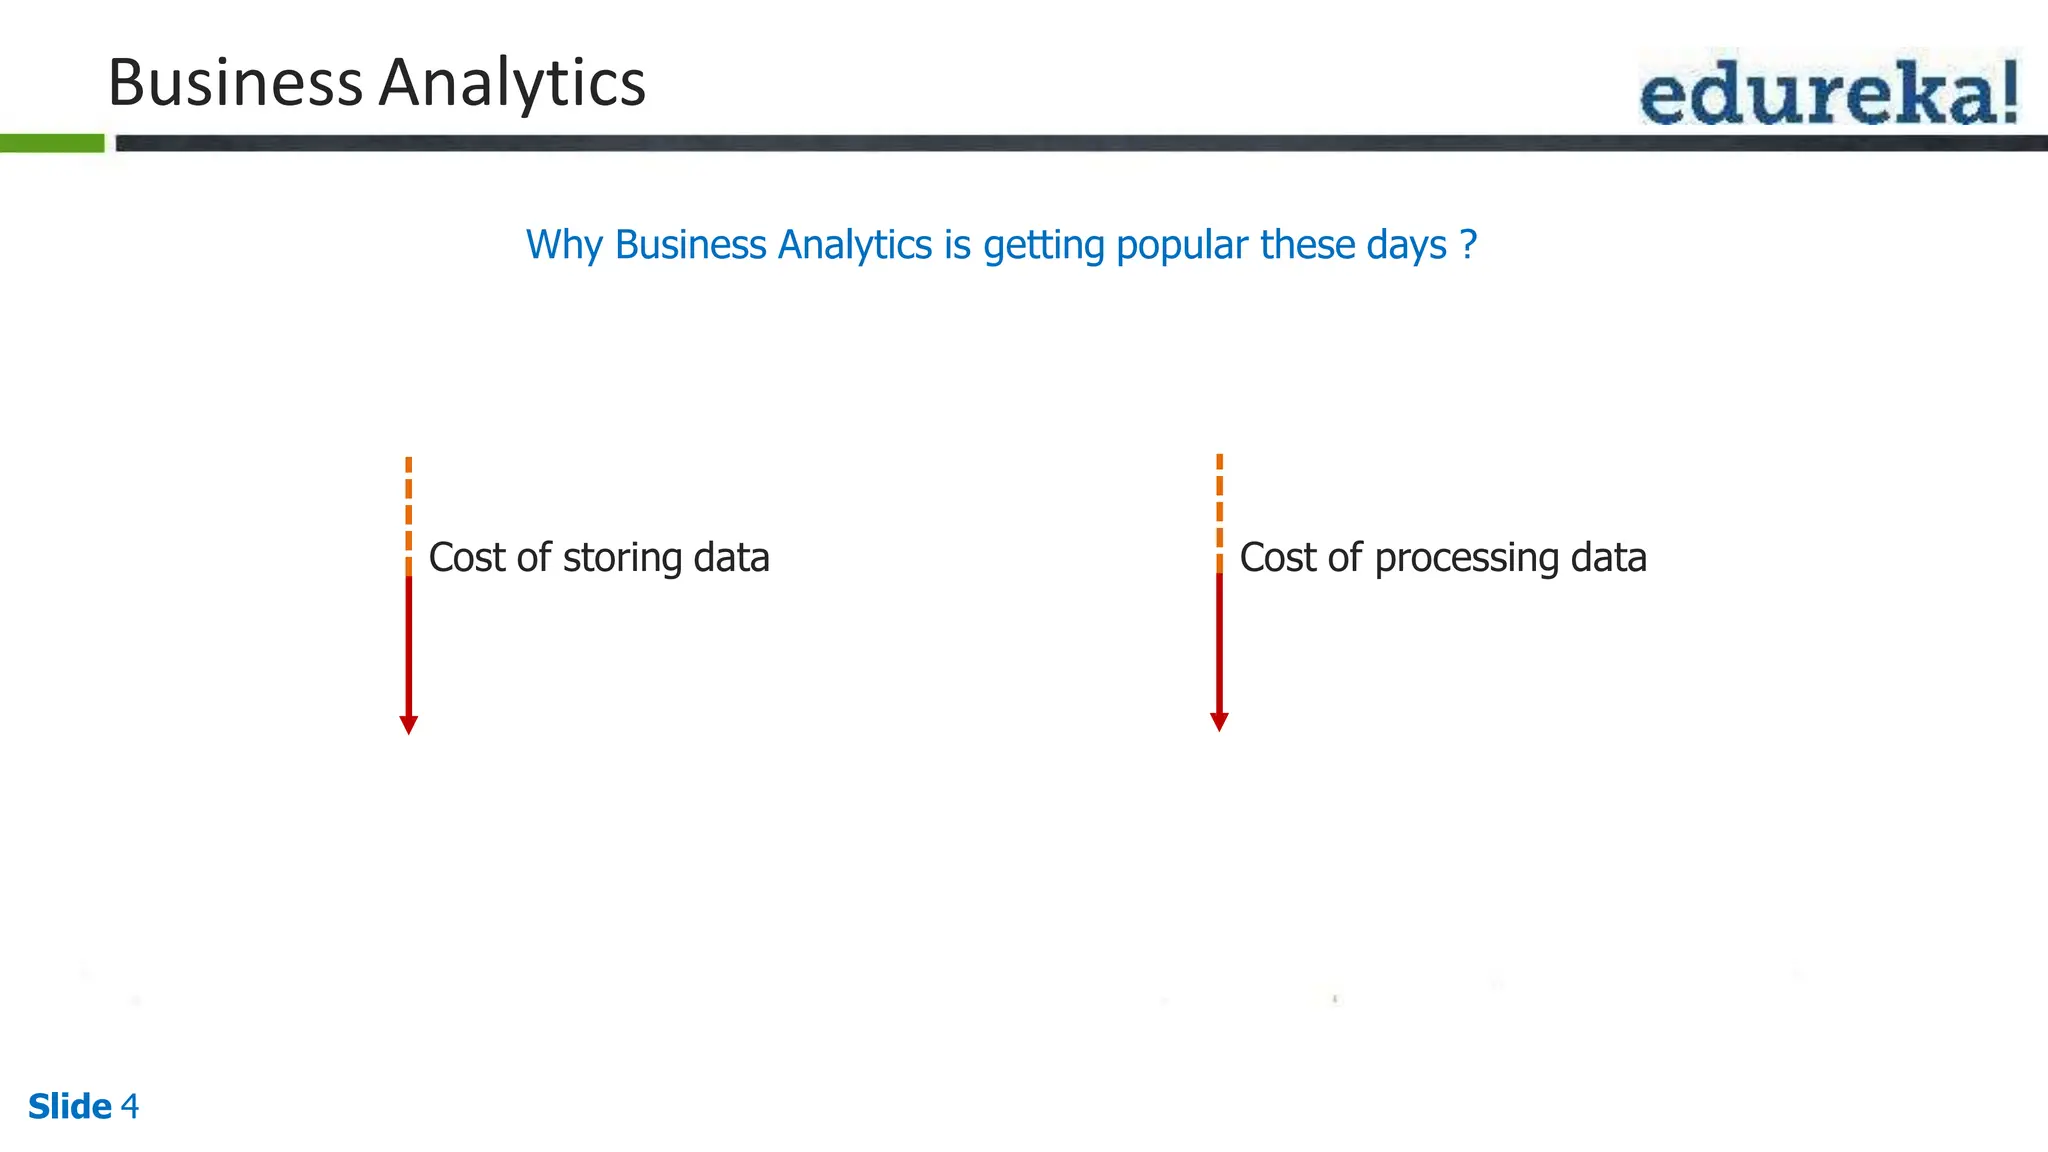
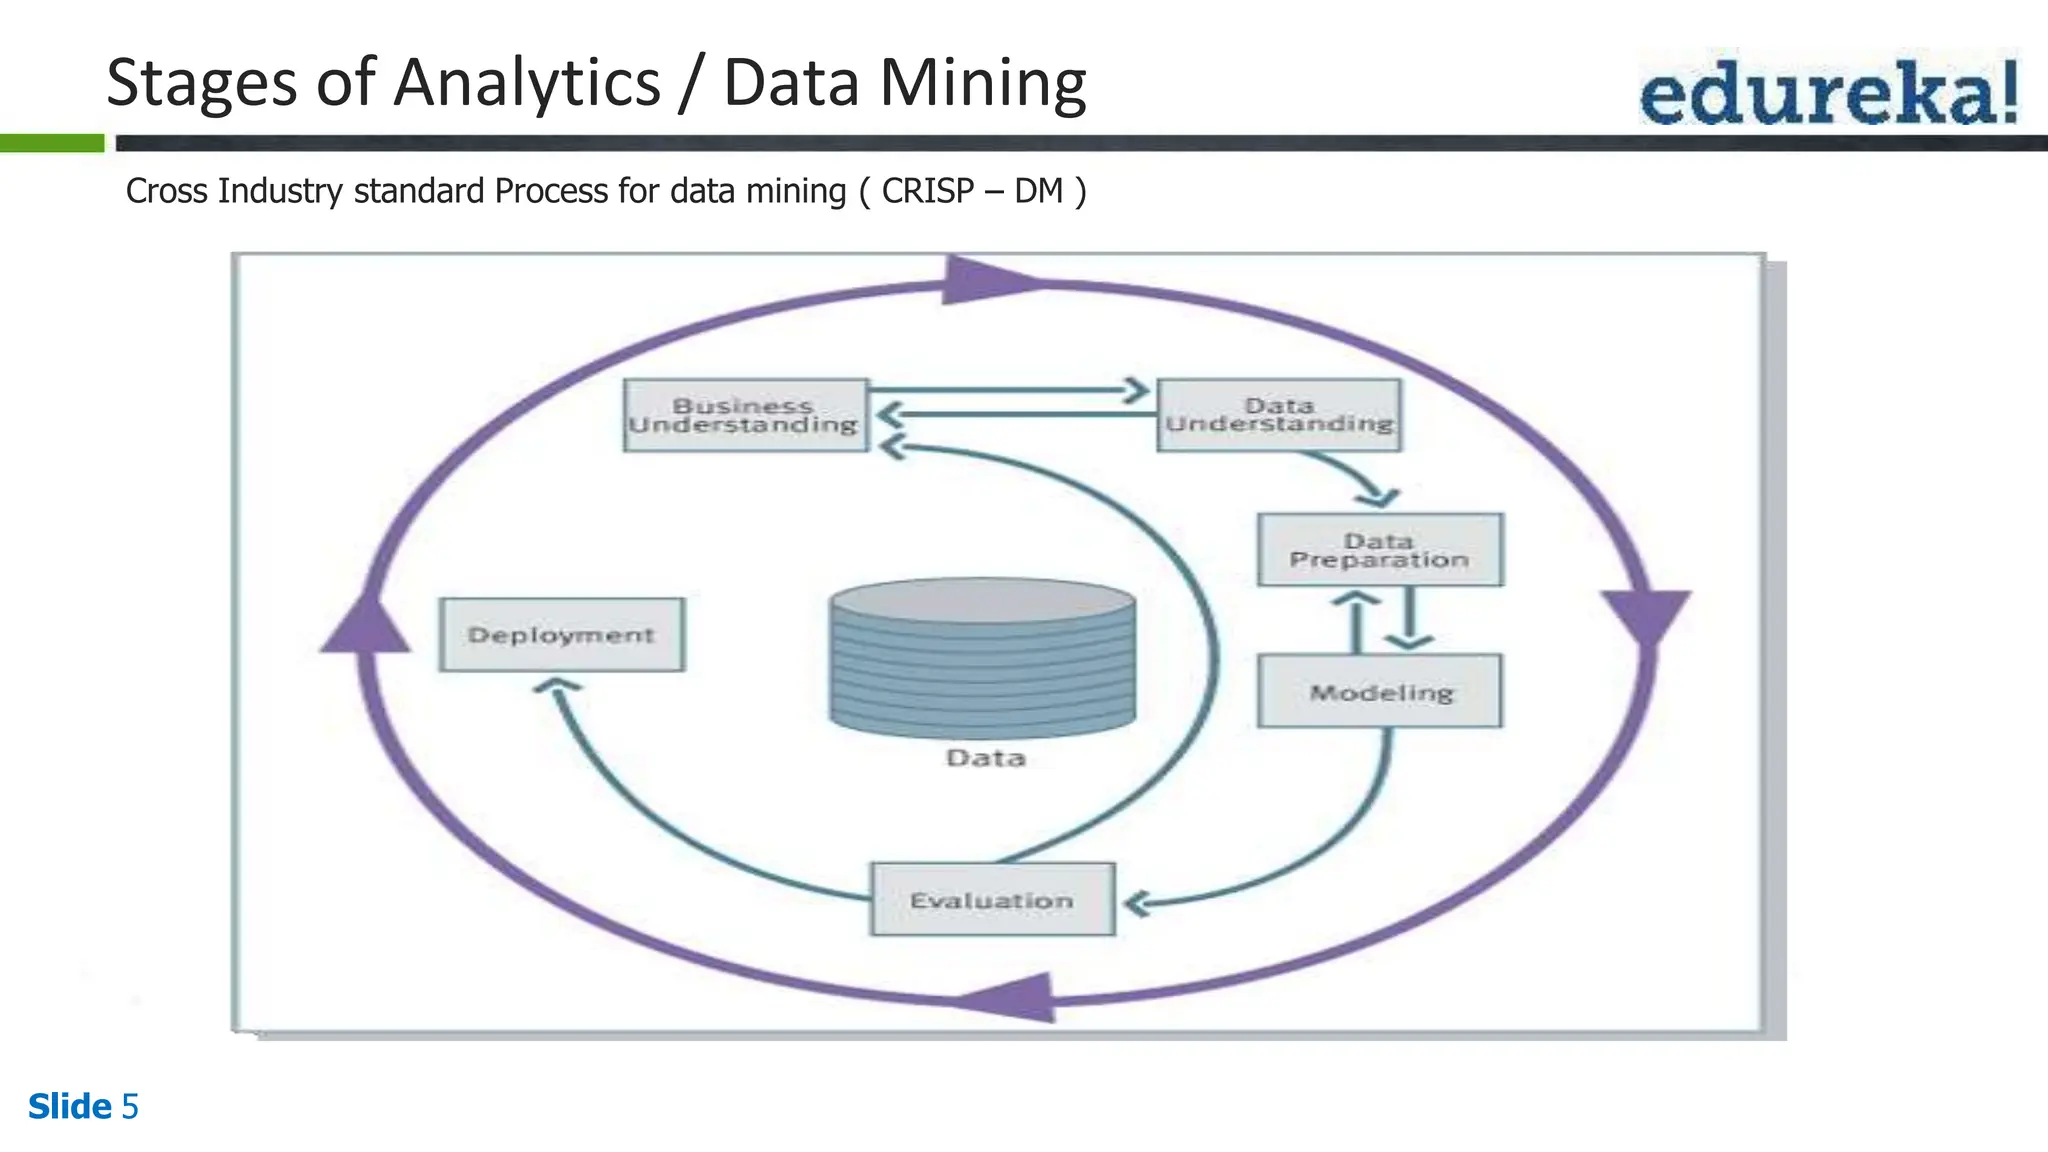
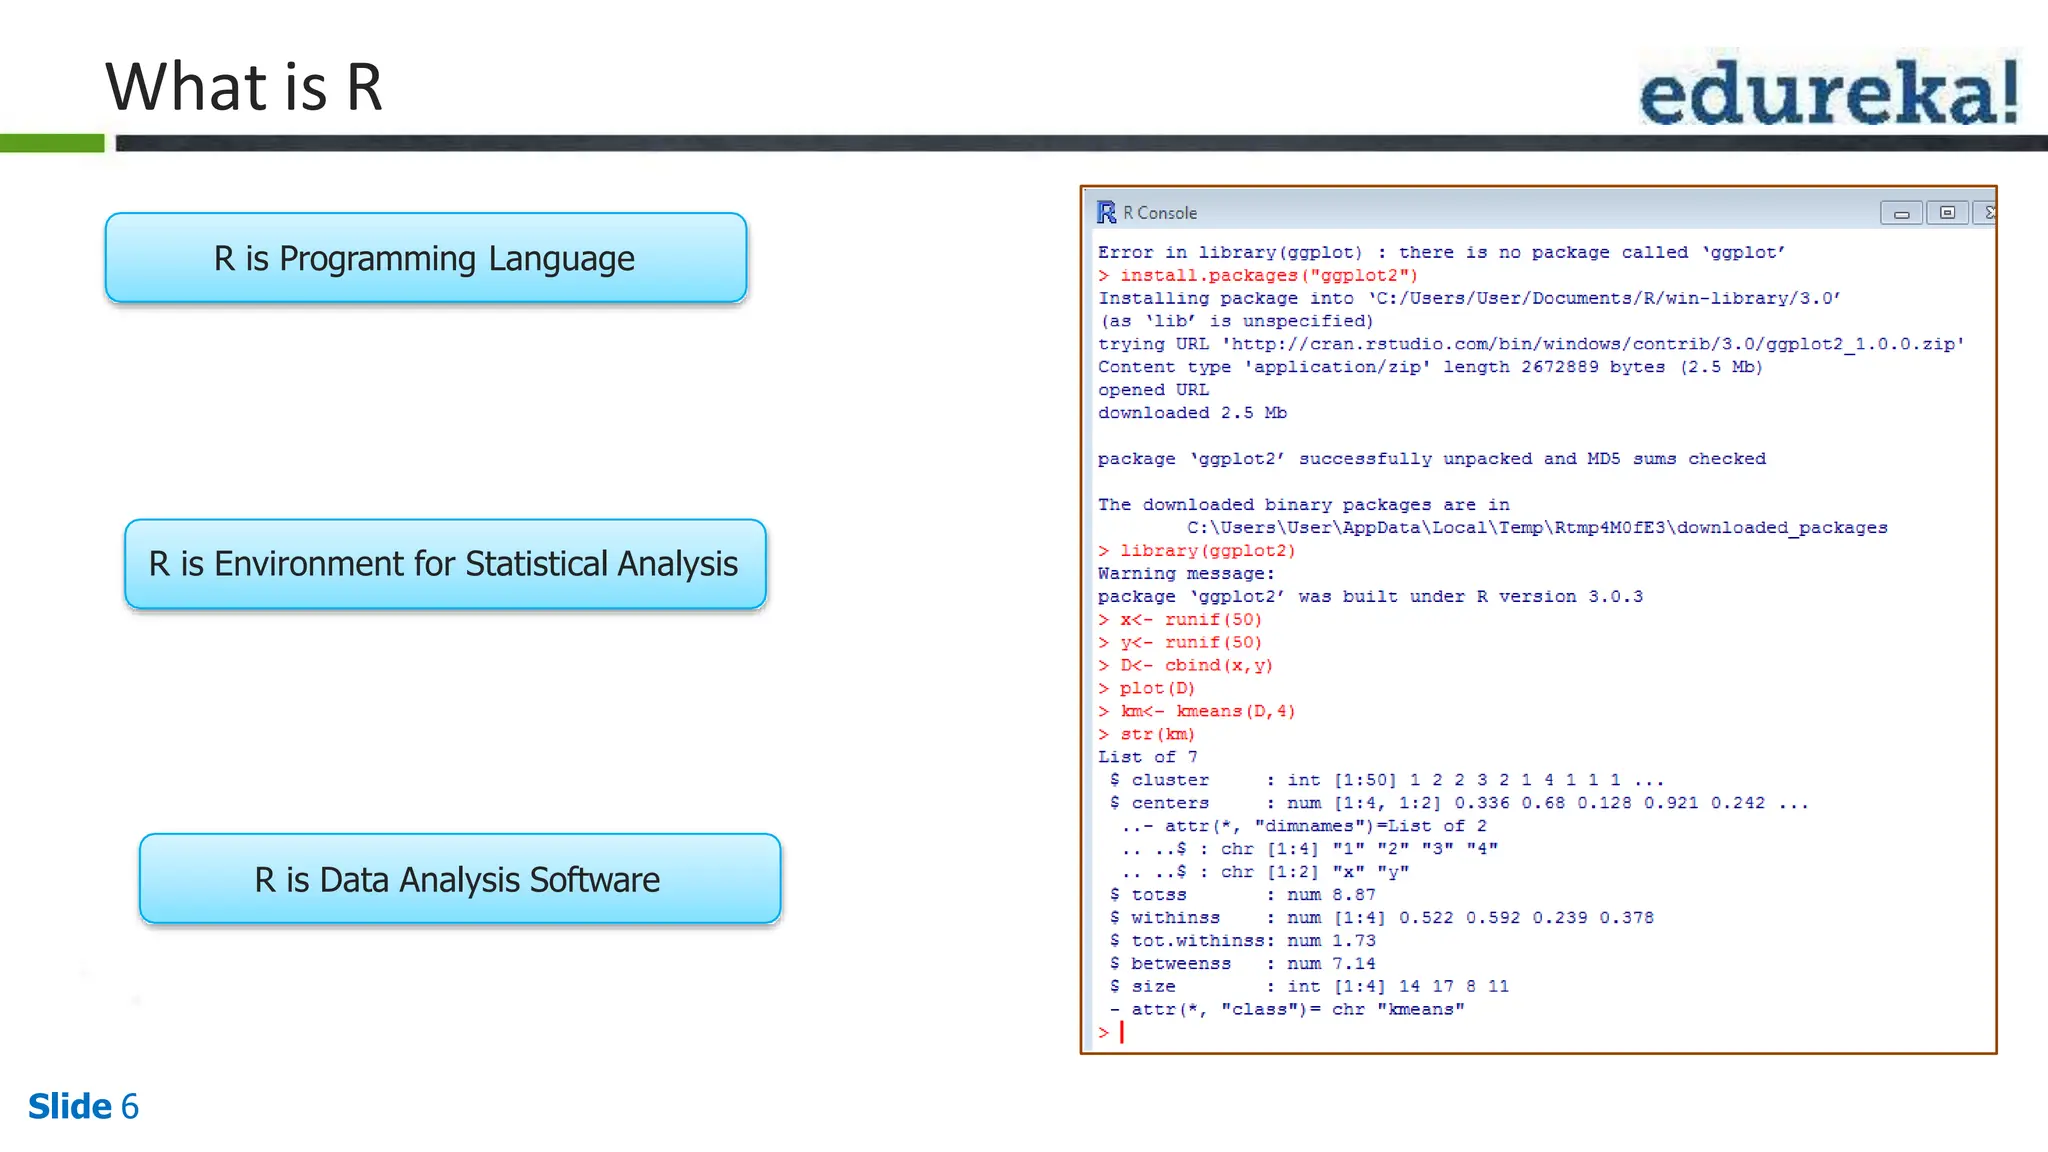
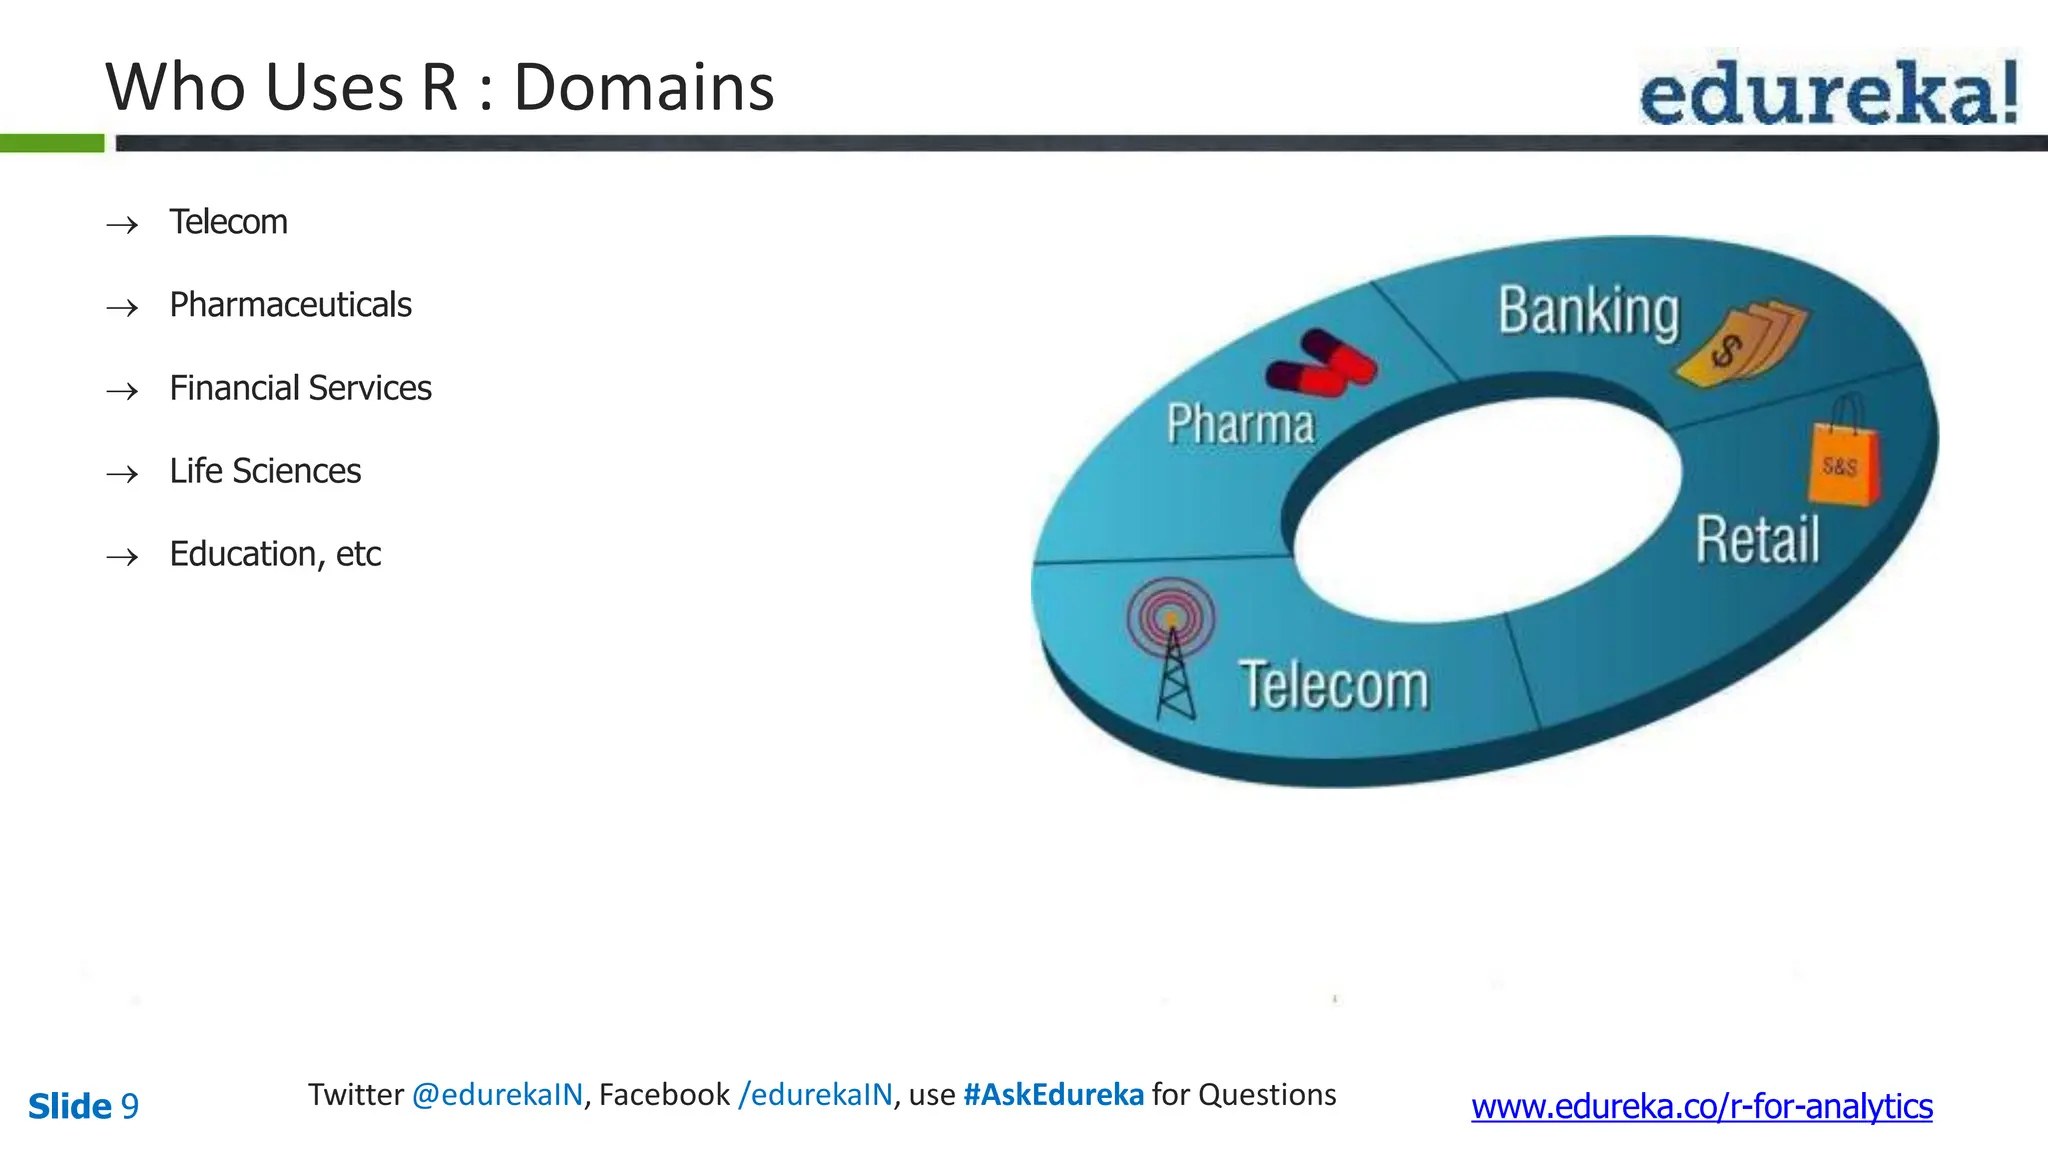
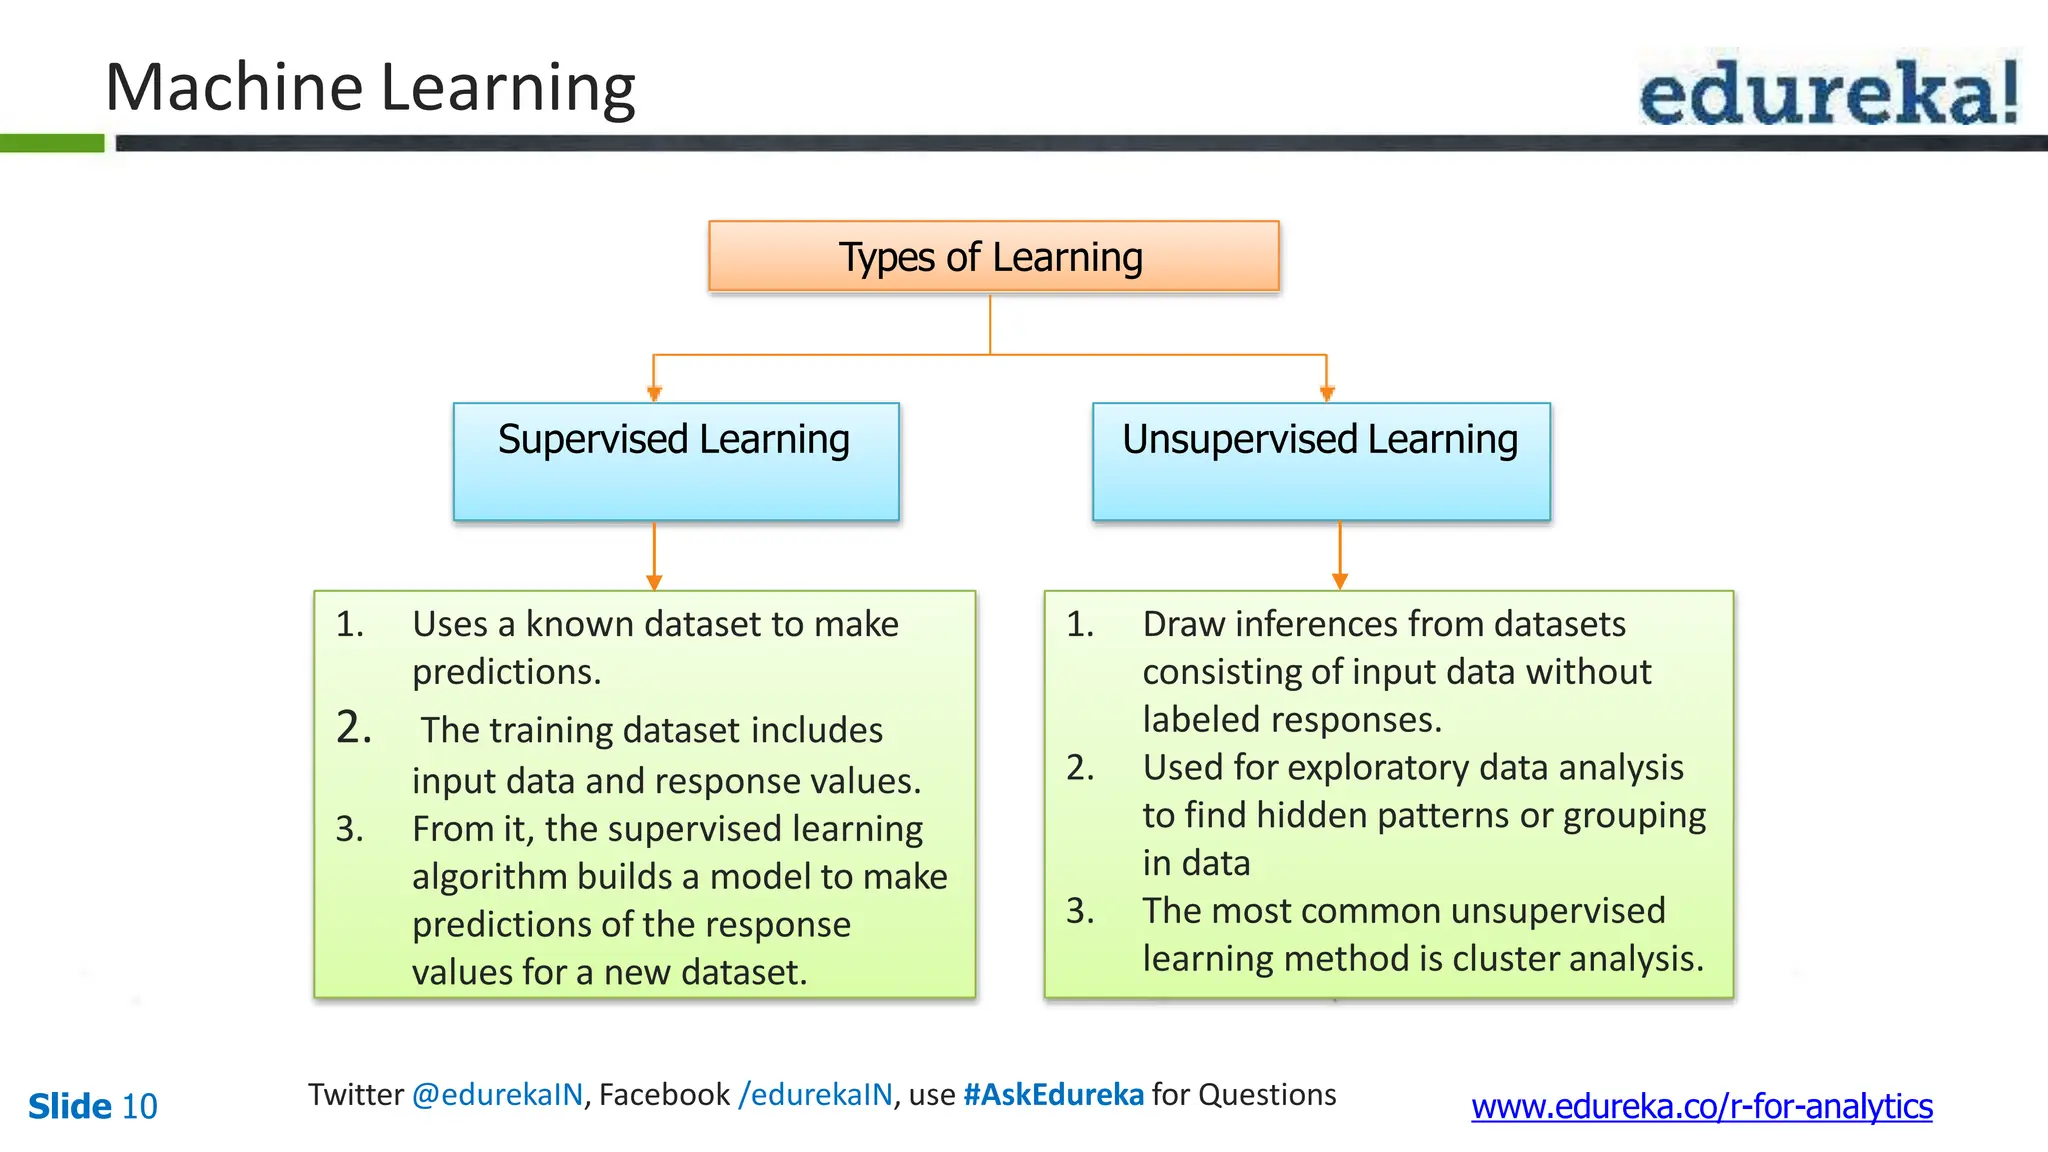
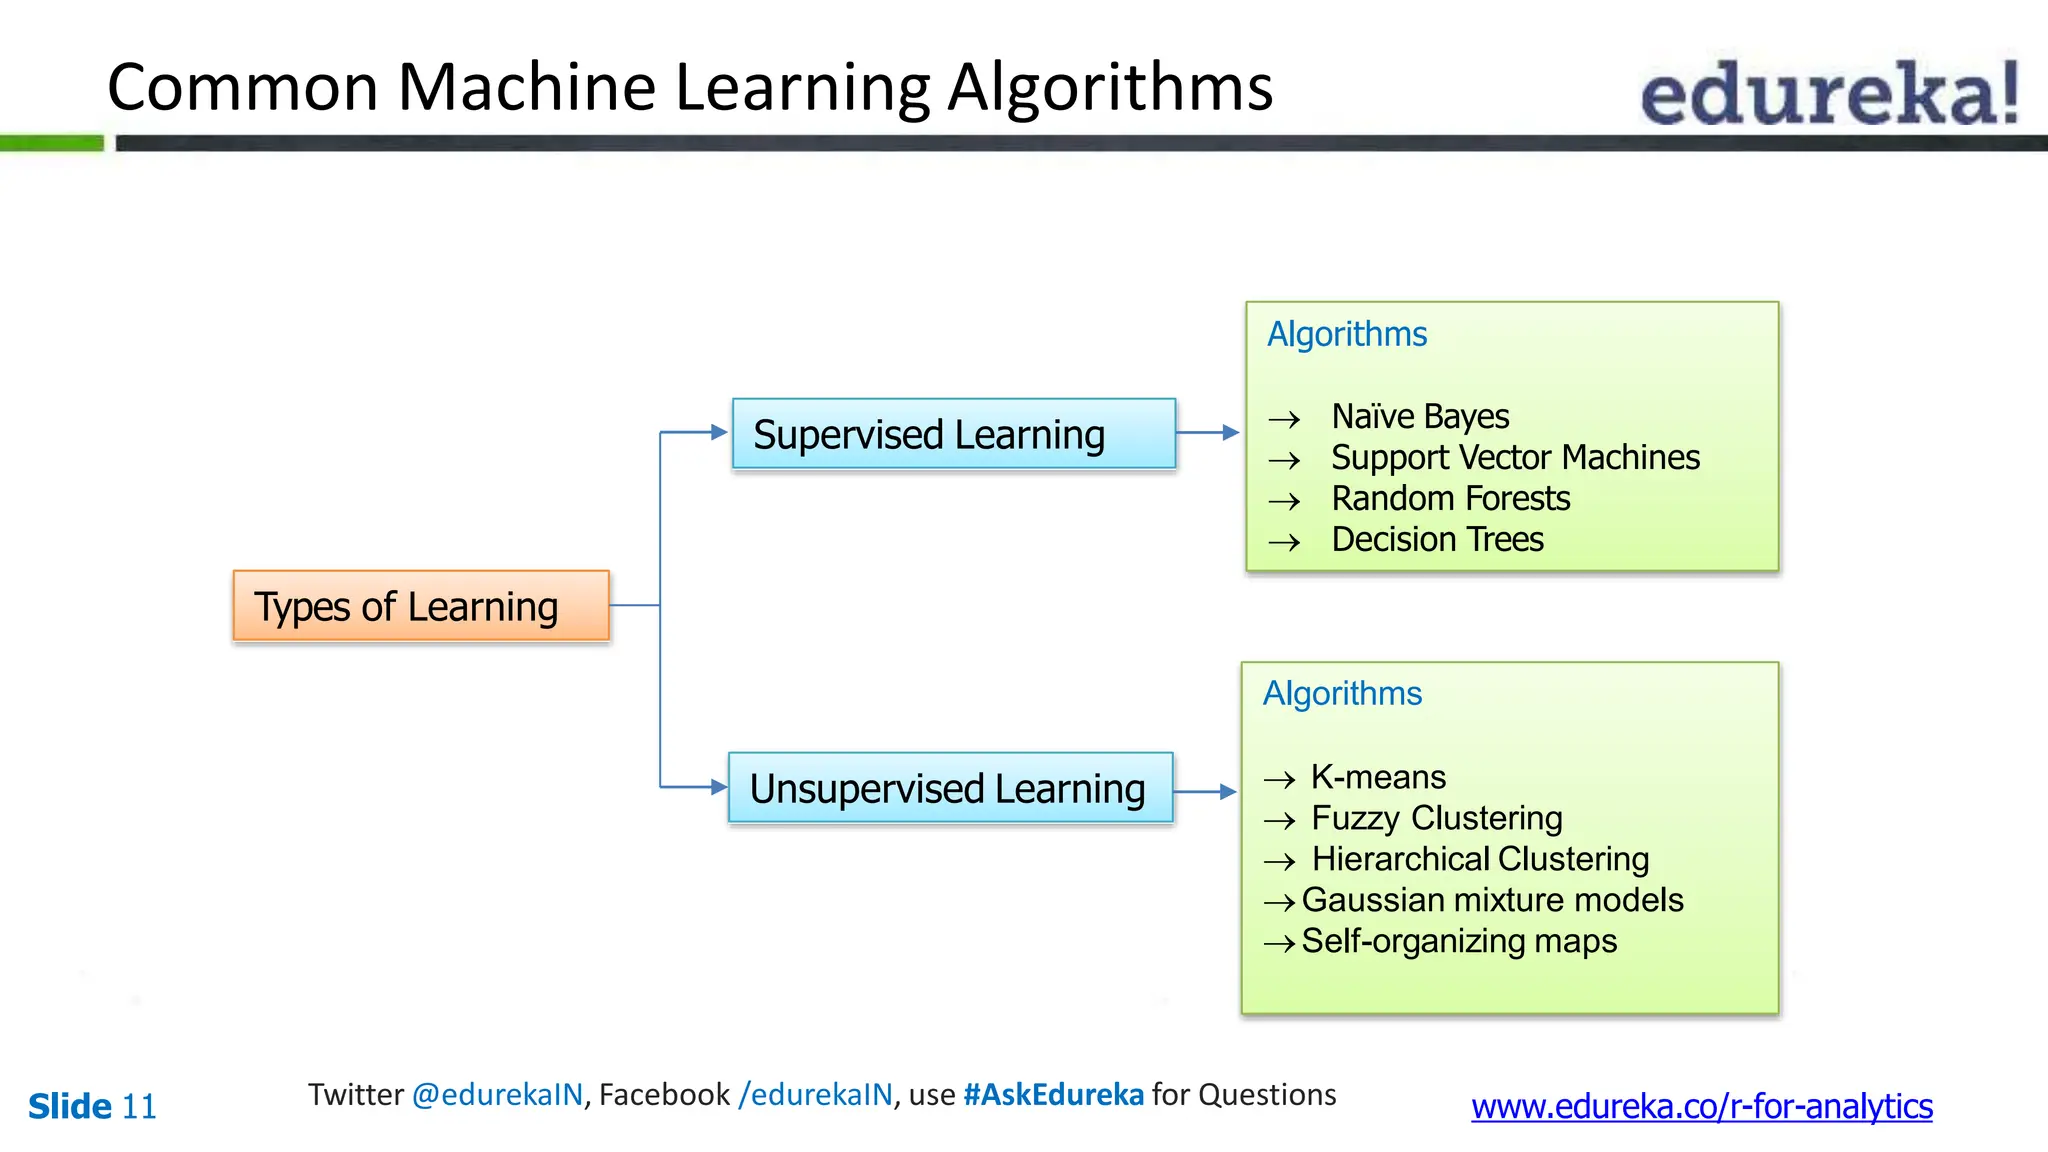
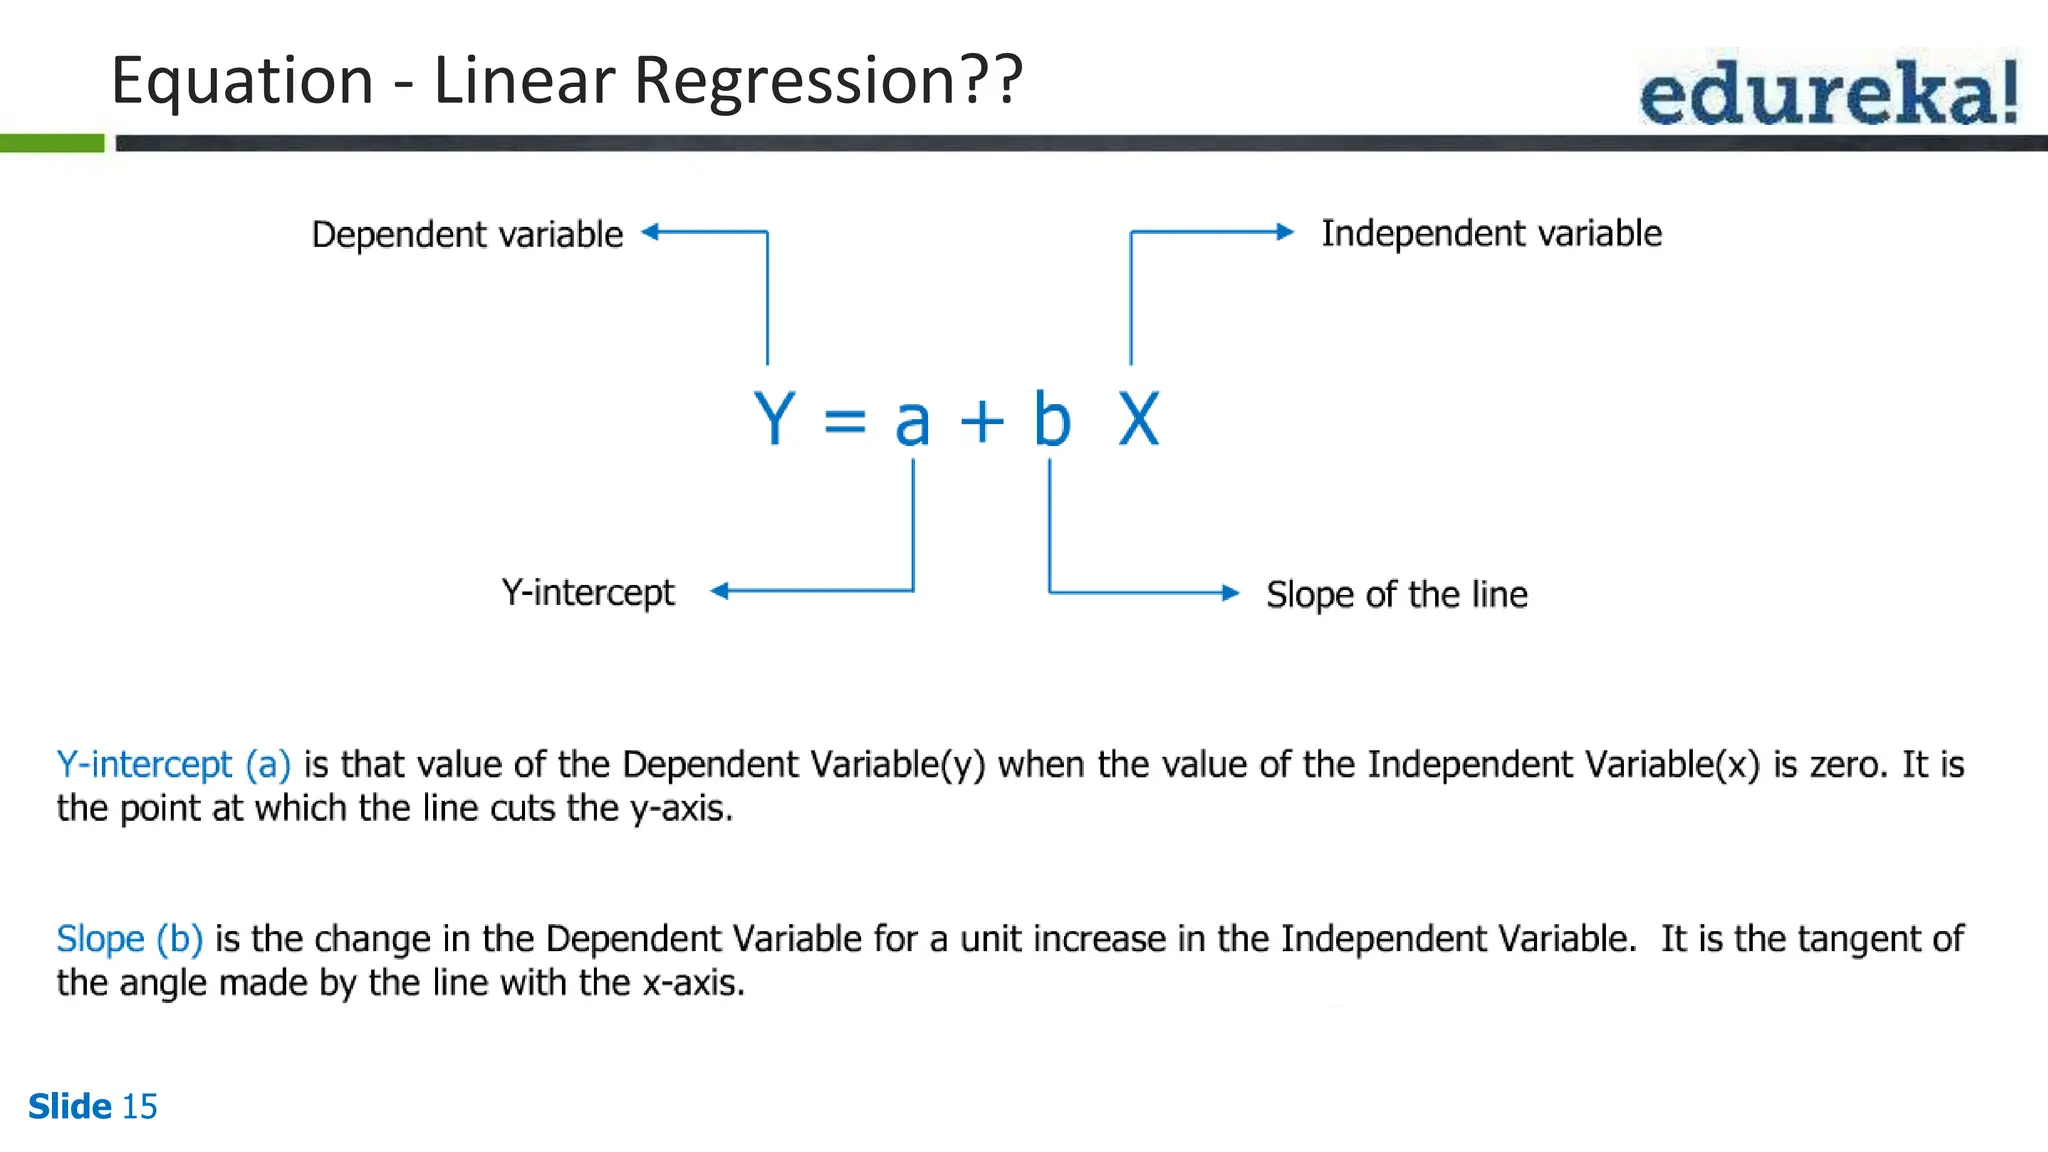
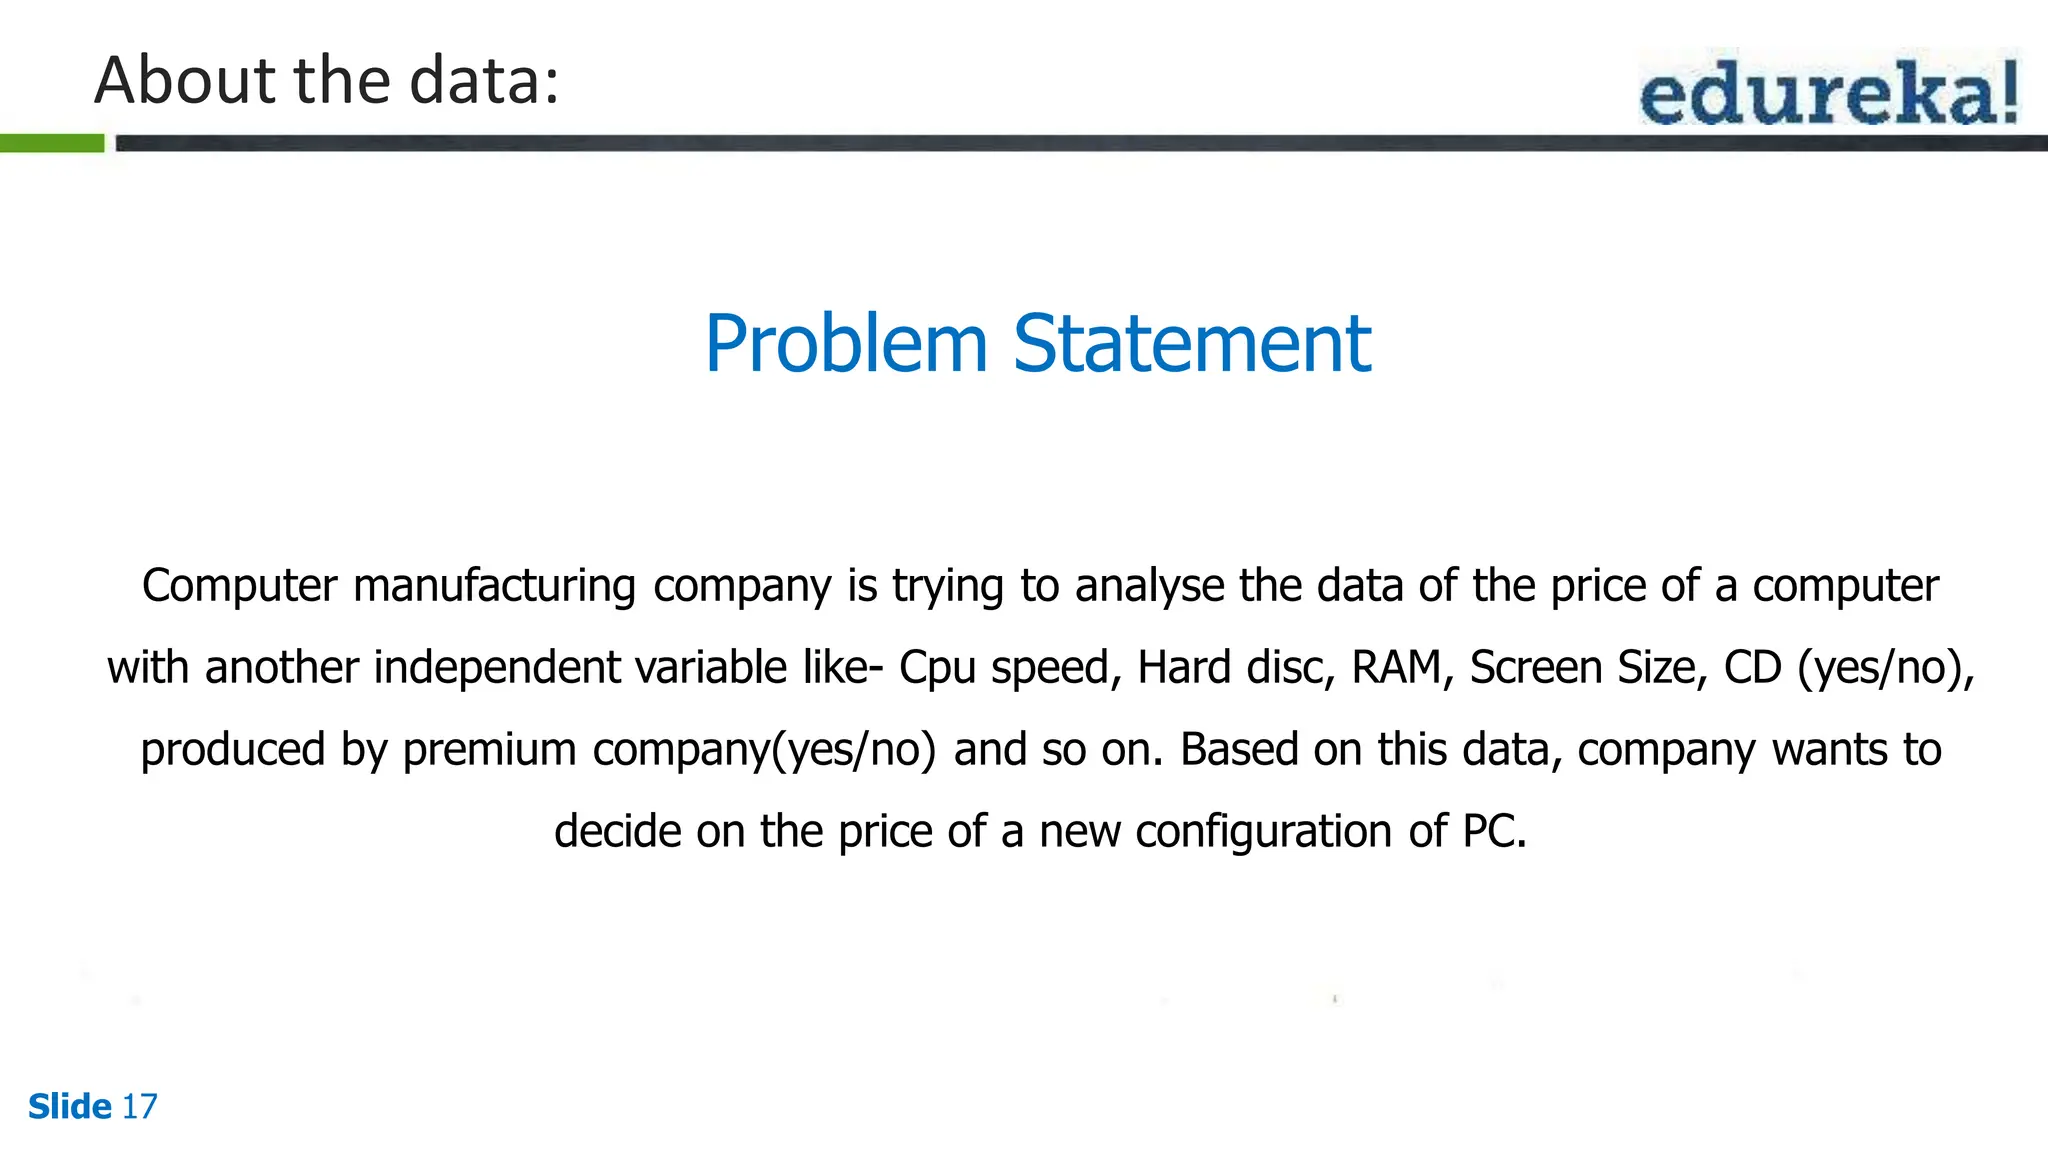
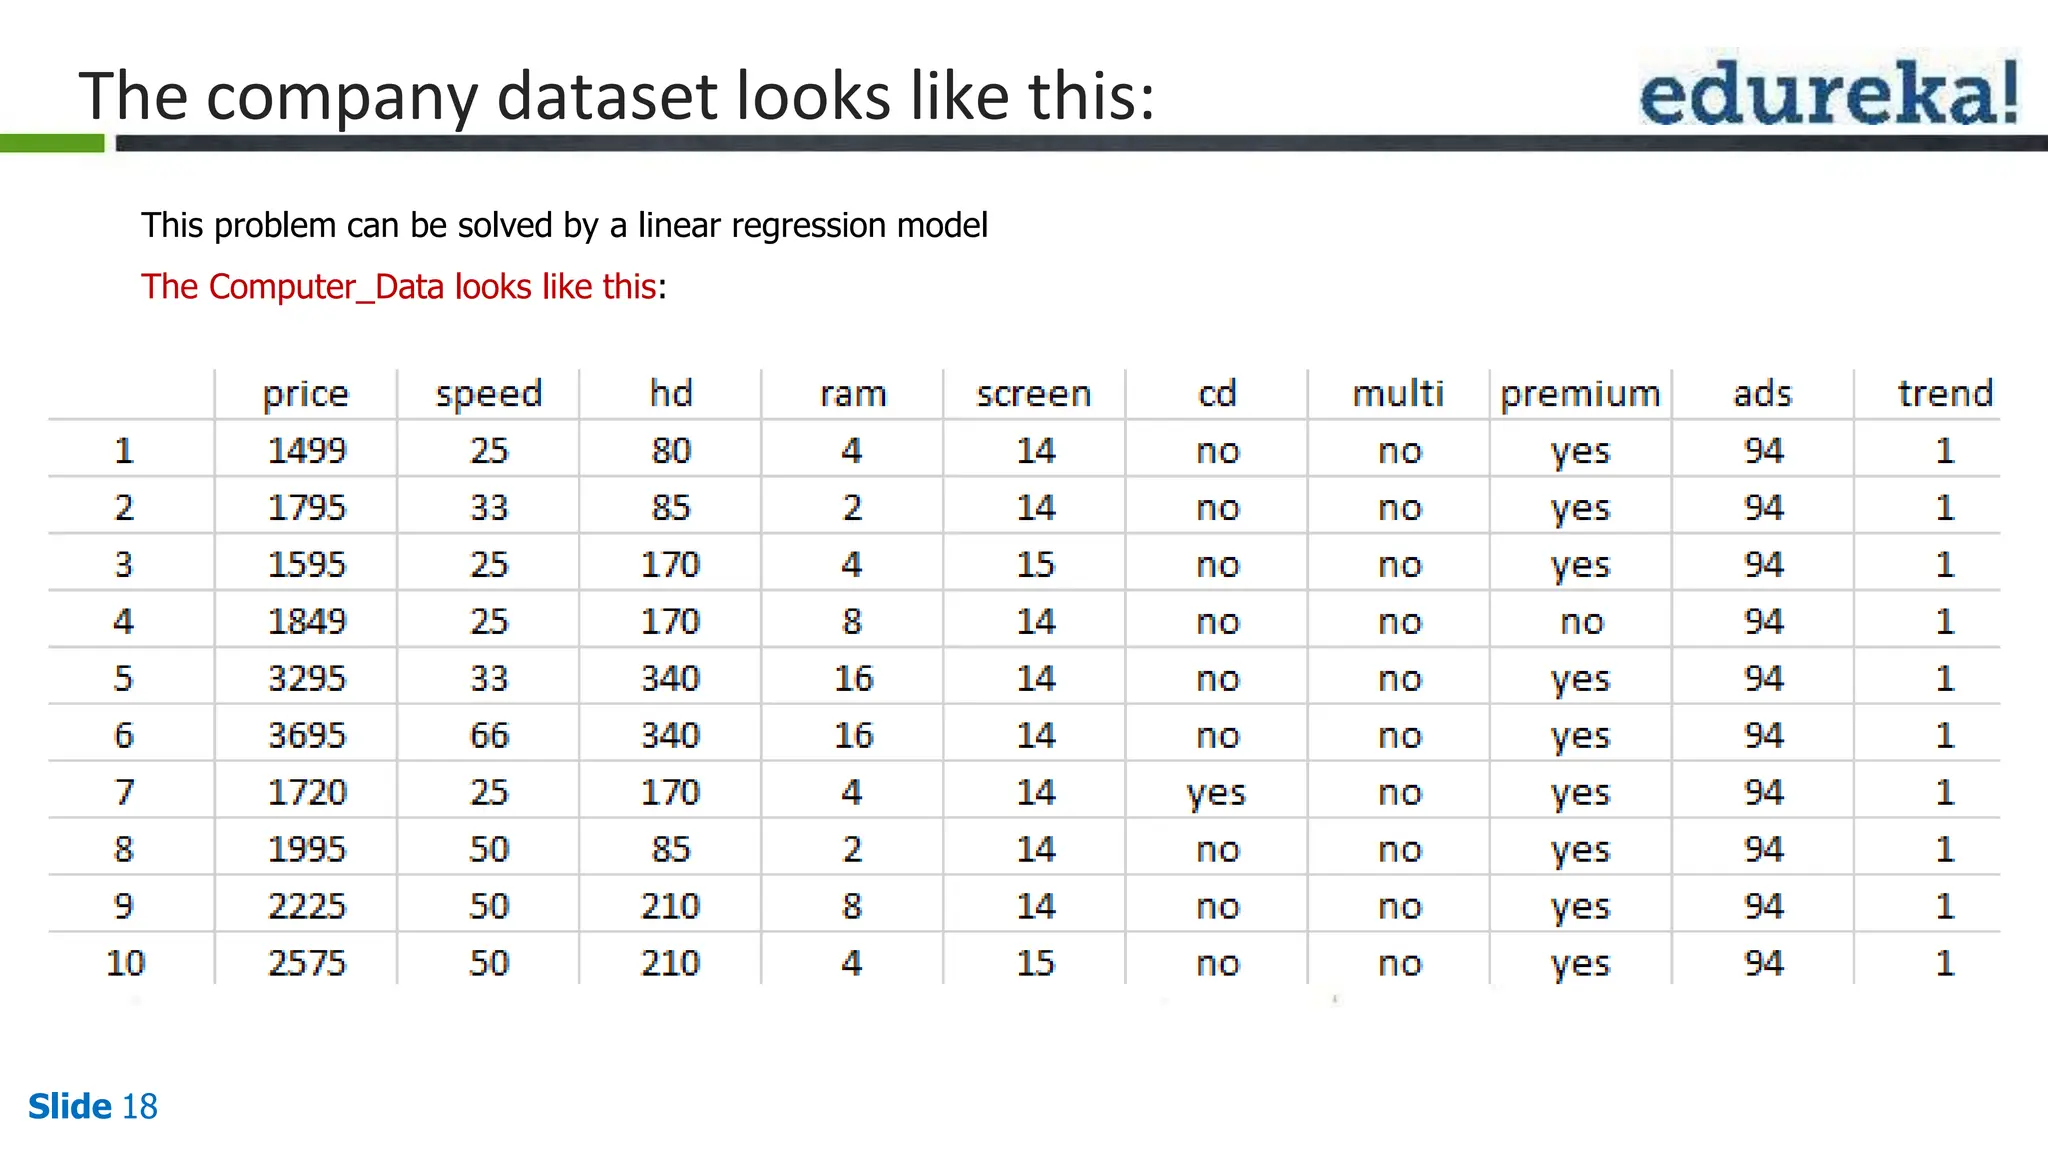
LINEAR REGRESSION WITH R
Objectives
Slide 2
What is data mining
What is Business Analytics
Stages of Analytics / data mining
What is R
Overview of Machine Learning
 What is Linear Regression
Case Study
Data mining ??
Slide 3
Generally, data mining is the process of studying data from maximum possible dimensions and summarizing it into
useful information
Technically, data mining is the process of finding correlations or patterns among dozens of fields in large data
generated from business
Or you can say, data mining is the process finding useful information from the data and then devising knowledge
out of it for improving future of our business
» Data ??
Data are any facts, numbers, or text is getting produced by existing system
» Information ??
The patterns, associations, or relationships among all this data can provide information
» Knowledge ??
Information can be converted into knowledge about historical patterns and future trends. For example summary of
sales in off season may help to start some offers in that period to increase sales
Business Analytics
Why Business Analytics is getting popular these days ?
Cost of storing data Cost of processing data
Slide 4
Cross Industry standard Process for data mining ( CRISP – DM )
Stages of Analytics / Data Mining
Slide 5
What is R
R is Programming Language
R is Environment for Statistical Analysis
R is Data Analysis Software
Slide 6
R : Characteristics
Slide 7
Effective and fast data handling and storage facility
A bunch of operators for calculations on arrays, lists, vectors etc
A large integrated collection of tools for data analysis, and visualization
Facilities for data analysis using graphs and display either directly at the computer or paper
A well implemented and effective programming language called ‘S’ on top of which R is built
A complete range of packages to extend and enrich the functionality of R
Data Visualization in R
This plot represents the
locations of all the traffic
signals in the city.
It is recognizable as
Toronto without any other
geographic data being
plotted - the structure of
the city comes out in the
data alone.
Twitter @edurekaIN, Facebook /edurekaIN, use #AskEdureka for Questions
Slide 8 www.edureka.co/r-for-analytics
Who Uses R : Domains
 Telecom
 Pharmaceuticals
 Financial Services
 Life Sciences
 Education, etc
Twitter @edurekaIN, Facebook /edurekaIN, use #AskEdureka for Questions
Slide 9 www.edureka.co/r-for-analytics
Types of Learning
Supervised Learning Unsupervised Learning
1. Uses a known dataset to make
predictions.
2. The training dataset includes
input data and response values.
3. From it, the supervised learning
algorithm builds a model to make
predictions of the response
values for a new dataset.
1. Draw inferences from datasets
consisting of input data without
labeled responses.
2. Used for exploratory data analysis
to find hidden patterns or grouping
in data
3. The most common unsupervised
learning method is cluster analysis.
Machine Learning
Twitter @edurekaIN, Facebook /edurekaIN, use #AskEdureka for Questions
Slide 10 www.edureka.co/r-for-analytics
Common Machine Learning Algorithms
Types of Learning
Supervised Learning
Unsupervised Learning
Algorithms
 Naïve Bayes
 Support Vector Machines
 Random Forests
 Decision Trees
Algorithms
 K-means
 Fuzzy Clustering
 Hierarchical Clustering
Gaussian mixture models
Self-organizing maps
Twitter @edurekaIN, Facebook /edurekaIN, use #AskEdureka for Questions
Slide 11 www.edureka.co/r-for-analytics
Linear Regression
Slide 12
What is Linear Regression??
Slide 13
 In statistics, linear regression is an approach for modeling the relationship between a scalar dependent variable y
and one or more explanatory variables (or independent variable) denoted X.
 The case of one explanatory variable is called simple linear regression.
 For more than one explanatory variable, the process is called multiple linear regression
 Data are modeled using linear predictor functions, and unknown model parameters are estimated from the data.
Where to Use Linear Regression??
Slide 14
Linear regression has many practical uses.
Most applications fall into one of the following two broad categories:
 If the goal is prediction, or forecasting, or reduction, linear regression can be used to fit a predictive model to an
observed data set of y and X values. After developing such a model, if an additional value of X is then given without
its accompanying value of y, the fitted model can be used to make a prediction of the value of y.
 Given a variable y and a number of variables X1, ..., Xp that may be related to y, linear regression analysis can be
applied to quantify the strength of the relationship between y and the Xj, to assess which Xj may have no
relationship with y at all, and to identify which subsets of the Xj contain redundant information about y.
Equation - Linear Regression??
Slide 15
Linear Regression Case-study
Slide 16
Problem Statement
Slide 17
Computer manufacturing company is trying to analyse the data of the price of a computer
with another independent variable like- Cpu speed, Hard disc, RAM, Screen Size, CD (yes/no),
produced by premium company(yes/no) and so on. Based on this data, company wants to
decide on the price of a new configuration of PC.
About the data:
The company dataset looks like this:
This problem can be solved by a linear regression model
The Computer_Data looks like this:
Slide 18

Linear Regression with R programming.pptx

  • 1.
  • 2.
    Objectives Slide 2 What isdata mining What is Business Analytics Stages of Analytics / data mining What is R Overview of Machine Learning  What is Linear Regression Case Study
  • 3.
    Data mining ?? Slide3 Generally, data mining is the process of studying data from maximum possible dimensions and summarizing it into useful information Technically, data mining is the process of finding correlations or patterns among dozens of fields in large data generated from business Or you can say, data mining is the process finding useful information from the data and then devising knowledge out of it for improving future of our business » Data ?? Data are any facts, numbers, or text is getting produced by existing system » Information ?? The patterns, associations, or relationships among all this data can provide information » Knowledge ?? Information can be converted into knowledge about historical patterns and future trends. For example summary of sales in off season may help to start some offers in that period to increase sales
  • 4.
    Business Analytics Why BusinessAnalytics is getting popular these days ? Cost of storing data Cost of processing data Slide 4
  • 5.
    Cross Industry standardProcess for data mining ( CRISP – DM ) Stages of Analytics / Data Mining Slide 5
  • 6.
    What is R Ris Programming Language R is Environment for Statistical Analysis R is Data Analysis Software Slide 6
  • 7.
    R : Characteristics Slide7 Effective and fast data handling and storage facility A bunch of operators for calculations on arrays, lists, vectors etc A large integrated collection of tools for data analysis, and visualization Facilities for data analysis using graphs and display either directly at the computer or paper A well implemented and effective programming language called ‘S’ on top of which R is built A complete range of packages to extend and enrich the functionality of R
  • 8.
    Data Visualization inR This plot represents the locations of all the traffic signals in the city. It is recognizable as Toronto without any other geographic data being plotted - the structure of the city comes out in the data alone. Twitter @edurekaIN, Facebook /edurekaIN, use #AskEdureka for Questions Slide 8 www.edureka.co/r-for-analytics
  • 9.
    Who Uses R: Domains  Telecom  Pharmaceuticals  Financial Services  Life Sciences  Education, etc Twitter @edurekaIN, Facebook /edurekaIN, use #AskEdureka for Questions Slide 9 www.edureka.co/r-for-analytics
  • 10.
    Types of Learning SupervisedLearning Unsupervised Learning 1. Uses a known dataset to make predictions. 2. The training dataset includes input data and response values. 3. From it, the supervised learning algorithm builds a model to make predictions of the response values for a new dataset. 1. Draw inferences from datasets consisting of input data without labeled responses. 2. Used for exploratory data analysis to find hidden patterns or grouping in data 3. The most common unsupervised learning method is cluster analysis. Machine Learning Twitter @edurekaIN, Facebook /edurekaIN, use #AskEdureka for Questions Slide 10 www.edureka.co/r-for-analytics
  • 11.
    Common Machine LearningAlgorithms Types of Learning Supervised Learning Unsupervised Learning Algorithms  Naïve Bayes  Support Vector Machines  Random Forests  Decision Trees Algorithms  K-means  Fuzzy Clustering  Hierarchical Clustering Gaussian mixture models Self-organizing maps Twitter @edurekaIN, Facebook /edurekaIN, use #AskEdureka for Questions Slide 11 www.edureka.co/r-for-analytics
  • 12.
  • 13.
    What is LinearRegression?? Slide 13  In statistics, linear regression is an approach for modeling the relationship between a scalar dependent variable y and one or more explanatory variables (or independent variable) denoted X.  The case of one explanatory variable is called simple linear regression.  For more than one explanatory variable, the process is called multiple linear regression  Data are modeled using linear predictor functions, and unknown model parameters are estimated from the data.
  • 14.
    Where to UseLinear Regression?? Slide 14 Linear regression has many practical uses. Most applications fall into one of the following two broad categories:  If the goal is prediction, or forecasting, or reduction, linear regression can be used to fit a predictive model to an observed data set of y and X values. After developing such a model, if an additional value of X is then given without its accompanying value of y, the fitted model can be used to make a prediction of the value of y.  Given a variable y and a number of variables X1, ..., Xp that may be related to y, linear regression analysis can be applied to quantify the strength of the relationship between y and the Xj, to assess which Xj may have no relationship with y at all, and to identify which subsets of the Xj contain redundant information about y.
  • 15.
    Equation - LinearRegression?? Slide 15
  • 16.
  • 17.
    Problem Statement Slide 17 Computermanufacturing company is trying to analyse the data of the price of a computer with another independent variable like- Cpu speed, Hard disc, RAM, Screen Size, CD (yes/no), produced by premium company(yes/no) and so on. Based on this data, company wants to decide on the price of a new configuration of PC. About the data:
  • 18.
    The company datasetlooks like this: This problem can be solved by a linear regression model The Computer_Data looks like this: Slide 18